
Optimal 3D Placement of UAV-BS for Maximum Coverage Subject to User Priorities and Distributions


School of Information and Communication Engineering, Chungbuk National University, Cheongju-si 28644, Korea
*
Author to whom correspondence should be addressed.
Electronics 2022, 11(7), 1036; https://doi.org/10.3390/electronics11071036
Submission received: 15 February 2022
/
Revised: 19 March 2022
/
Accepted: 22 March 2022
/
Published: 25 March 2022
(This article belongs to the Special Issue Unmanned Aerial Vehicle (UAV) Communication and Networking)
Abstract
:The usage of unmanned aerial vehicle (UAV) as a base station is in the spotlight to overcome the severe attenuation characteristics of short-wavelength radio in high-speed wireless networks. In this paper, we propose an optimal UAV deployment algorithm, considering the priority of ground nodes (GNs) in different wireless communication environments. Specifically, the optimal position of a UAV is determined so that as many high-priority GNs can be served rather than covering as many GNs as possible. The proposed optimization problem deals with two groups of GNs with different priorities and finds the optimal position of the UAV by solving the mixed-integer second-order cone problem (MISOCP). To verify the effectiveness of the proposed optimal UAV deployment algorithm, we conduct various evaluating scenarios with different urban environments and GN spatial distributions. We also compare the performance of the proposed algorithm with the conventional one. Simulation results show that the proposed scheme achieves superior coverage efficiency, throughput, and delay performance compared to the conventional algorithm, even when the environment and the spatial distribution of GNs are changed.
1. Introduction
Unmanned aerial vehicles (UAVs), which were primarily studied for military purposes, are now widely used in the private sector as well as in the public sector, such as logistics transportation, disaster rescue, and communication. Recently, research interests in UAV communications can be classified into two main categories: (i) the UAV acts as a relay for data transmission from a base station (BS) to ground users or (ii) the UAV serves as a BS that directly disseminates data to ground users [1]. Since the batteries equipped on the UAV have limited capacity, its flight time and transmission power are also limited. Therefore, it is crucially essential to optimize the transmission power and bandwidth of UAV-assisted communications. Notably, various research issues regarding the efficient UAV operation as well as the advantage of using UAVs in wireless networks were introduced in [2,3]. In particular, the optimal positioning of UAVs, channel modeling, security, and energy constraint on UAVs have attracted much interest in the literature. With the commercialization of high-speed networks like 5G, the use of short wavelengths such as millimeter waves is emerging to secure wide bandwidth. If the wavelength of the electromagnetic wave is short, the attenuation becomes severe, making it difficult for the radio waves to reach a long distance. Accordingly, more BSs are needed to create more line-of-sight (LoS) links than before. Unfortunately, the ground BSs not only cost a lot of time and money to set up, but they also have the issues of installing location restrictions and mobility. These disadvantages limit the formation of LoS links between BSs and ground nodes (GNs). In contrast, the UAV-BS achieves the LoS links with GNs more easily than ground BSs because UAV-BS can move freely in 3D dimensional space. Thus, a UAV-BS is considered as a useful alternative to conventional ground BS in case of natural disasters, such as earthquakes or landslides, or when too many users gathered, it can operate as a reinforcement to ground BS. Besides adding more BSs to create more LoS links, another solution to improve the network connectivity and quality-of-service (QoS) of UAV-BS is to use predictive estimation of the signal strength and fading channel conditions, as proposed in [4]. Saif et al. [5] suggested to employ a tethered connected to UAV to provide continuous power supply and exchange data with ground terminal. As a result, this solution gave superior performance in terms of LoS probability, path loss, and coverage probability for scalability coverage in various applications. Channel modeling for a UAV-BS is essential and has been studied widely in the literature. Al-Hourani et al. [6] proposed a statistical propagation model for estimating the air-to-ground path loss between a low altitude platform (LAP) and a terrestrial terminal. The estimating model was based on the urban environment properties and dependent on the elevation angle between the terminal and the platform. A comprehensive survey of the UAV channel characterization with measurement campaigns and statistical channel models was provided in [7]. The authors classified the UAV channel measurement campaigns in LAP based on several properties and classified the UAV channel modeling as deterministic, stochastic, and geometric-stochastic models. Gapeyenko et al. [8] introduced closed-form expressions for the LoS probability model that well-captured the features of UAVs in urban environments. Huang et al. [9] proposed an algorithm to maximize the minimum rate of delay-tolerant users and to satisfy the minimum rate requirement of delay-sensitive users in a UAV-BS network by jointly optimizing bandwidth, transmission power, and trajectory of the UAV. Alsamhi et al. [10] summarized recently proposed techniques and strategies to achieve green Internet of Things (IoT) using UAV to collect data from many IoT devices. These approaches help to reduce power consumption, enhance the sustainability and reliability of IoT applications.
On the other hand, it is noted that the probability of establishing LoS links and the path losses of all links are directly related to the performance of wireless networks with UAV-BSs. Therefore, optimally positioning the UAV plays a key role in limited coverage for UAV-BS in serving ground users. Many research works in the literature have investigated the problem of finding the best location of the UAV-BS, such as in [11,12,13,14,15]. Specifically, Alzenad et al. [11] studied the energy-efficient 3D placement of a UAV-BS by proposing an optimal placement algorithm that maximized the number of covered users with minimum transmit power. To achieve this goal, the UAV-BS chose its altitude to maximize its coverage region, and then it moved to a location where it could serve as many nodes as possible. For a given 3D position of the UAV-BS, the size and center of the coverage region were adjusted but with the same set of users enclosed. Clearly, the transmit power of the UAV-BS was further reduced while the number of served nodes was still maintained. The authors then applied this optimization framework into [12] by modeling the placement problem as a multiple circle placement problem. An optimal placement algorithm was proposed to maximize the number of covered users with different quality-of-service (QoS) requirements. Bor-Yaliniz et al. [13] studied the 3D placement problem of a UAV-BS with the objective of maximizing the number of users covered by the UAV-BS. The authors formulated an equivalent problem that could be solved efficiently to find the best location and size of the coverage region and optimal altitude of the UAV. Al-Hourani et al. [14] presented an analytical method for optimizing the altitude of LAPs. It was shown that the optimal altitude is a function of the maximum allowed path loss and the statistical parameters of urban environments. Mozaffari et al. [15] determined the optimal altitude of a single UAV-BS that resulted in maximum ground coverage and minimum required transmit power. The problem of providing a maximum coverage using two UAV-BSs was also investigated in two scenarios: interference-free and full interference between these two UAV-BSs.
In wireless communication environments, the UAV may also act as a relay. As before, the position of the UAV also serves as an essential factor. Chen et al. [16] studied the optimal placement of a relaying UAV for maximum reliability. The optimal altitude was investigated for both static and mobile UAVs and for both amplify-and-forward (AF) and decode-and-forward (DF) relaying UAVs. Li et al. [17] considered a UAV-enable wireless network where a relay UAV is used for two-way communications between a ground BS and a set of users. The UAV adopted the AF protocol for two-way relaying over orthogonal frequency bands. For maximizing the sum rate of both uplink and downlink, the UAV positioning and transmission power of all nodes are jointly designed. Bushnaq et al. [18] suggested an interesting method to overcome the issues of battery lifetime and wireless backhaul link capacity of UAV-based communications while still maximizing the cellular coverage for clustered users, i.e., analytically finding the optimal deployment of tethered drones. Chen et al. [19] investigated a relay system, where multiple UAVs established a cooperative UAV relay network to help some transmitters (Txs) communicate with their receivers (Rxs) by applying an orthogonal frequency division multiple access (OFDMA) scheme. The authors maximized the minimum rate of Tx-Rx by jointly optimizing the UAV location, node power, and bandwidth allocations. Eom et al. analyzed a two-way mobile relay system, where a relay mounted on a UAV assisted bidirectional communication of a pair of GNs. To maximize the minimum average rate between two GNs, the UAV trajectory, transmit power, and bandwidth were jointly optimized.
As presented above, the works in [11,12,13] focused on covering as many GN as possible with an assumption that all GNs have equal priorities. However, in practice, the GNs may be classified by different urgent needs of communications. Motivated by this observation, in this paper, we propose an optimization algorithm that maximizes the number of high-priority GNs first then maximizes the number of low-priority nodes later. The contributions of this paper are summarized as follows:
- We consider a practical scenario where a UAV serves as a BS for two groups of GNs with different priorities and location distributions, i.e., the high-priority GNs are uniformly distributed in the network area while the low-priority GNs gather into several clusters.
- We further develop the work of [11] in another aspect. Specifically, we propose an optimal algorithm that returns the best 3D locations of the UAV-BS so that it can cover the maximum number of high-priorities GNs. We use the MOSEK solver [20] to deal with the mixed-integer second-order cone problem (MISOCP). The performance of the proposed algorithm is compared with that of [11] (i.e., the conventional algorithm) in different urban environments and user’s location distributions.
- We show that the proposed algorithm can cover high-priority GNs more efficiently compared to the conventional algorithm, which focuses on maximizing the number of GNs regardless of their priorities. As a result, the proposed algorithm maintains significantly higher average throughput and lower average delay for different location distributions and urban environments.
For highlighting the contributions of our paper, we provide comparisons of our work with aforementioned works in Table 1.
The rest of this paper is organized as follows. Section 2 describes the system model, including the node distribution and wireless channels. Section 3 describes the proposed algorithm, which selects the optimal 3D location of the UAV so that the maximum number of high-priority nodes is covered. Section 4 presents the performance of the proposed algorithm in different evaluating scenarios. Comparisons between the proposed algorithm and the conventional one are also provided and discussed. Finally, Section 5 concludes the paper.
For the sake of clarity, the frequently used notations used in this paper along with their descriptions are summarized in Table 2.
2. System Model
2.1. Node Distribution
We consider a single UAV served as the BS for many ground nodes (GNs) in a network area of . It is assumed that the UAV and GNs are equipped with a single omni-directional antenna and the height of the GN is not considered. All GNs locate at fixed positions on the ground and are classified according to two different priorities, i.e., high priority and low priority. Throughout this paper, we denote U as the set of the GNs and superscripts `H’ and `L’ indicates high priority and low priority, respectively. The coordinates of M low-priority nodes and N high-priority nodes are presented as , and , , respectively. The UAV is assumed to hover at the altitude h with the minimum value of . Hence, the 3D coordinates of the UAV is . Furthermore, the level of clustering the GNs is determined by the coefficient-of-variation (CoV) of the Voronoi cell area, which was first introduced in [21]. In other words, CoV is defined as the inter-point distance used for specifying the deviations from homogeneity.
The Voronoi cell area is divided into a set of points with the closest distance from a plane coordinate to a particular point. In this paper, the Voronoi cell area out of the map is set to zero. Figure 1 is an example of the Voronoi cell area used to model the locations of GNs. As shown in Figure 1, the distance from a particular GN (green dot) to other surrounding GNs is different, and each GN also shows a different Voronoi cell area.
Figure 2a,b illustrate two different location distributions of GNs by changing the CoV, which is calculated as
where and are the standard deviation and mean of the Voronoi cell area, respectively. As shown Figure 2a, when the CoV is near to 1, the GNs are distributed with regular intervals (Poisson point process). Meanwhile, when the CoV is close to 5, the GNs form several clusters. In summary, the larger CoV is, the more densely the GNs are distributed.
The goal of the UAV placement in this paper is to serve as many GNs as possible by considering the priority of the GNs under the transmit power constraint. Specifically, no matter how many low-priority nodes are, the UAV must first explore the high-priority nodes. If the numbers of high-priority nodes in different locations are similar, then the number of low-priority nodes is used as a tiebreaker.
2.2. Wireless Channel
In the literature, many several models of air-to-ground (AtG) channels have been proposed. However, in this paper, we adopt the channel model proposed in [14] because of its simplicity and generality. According to this channel model, signals transmitted from the UAV are classified into line-of-sight (LoS) and non-light-of-sight (NLoS) groups. The probability that the UAV can establish an LoS connection with an ith GN depends on the elevation angle of the UAV to the ith GN, i.e.,
where a and b are constants that affected by environment, is the elevation angle between the horizontal plane and the line from the ith GN to the UAV. The values of a and b obtained from practical experiments for different urban environments [14] are presented in Table 3. Furthermore, from the in (2), we can calculate the probability of establishing a NLoS link as .
Figure 3 depicts the LoS probability versus the elevation angle of the UAV for different urban environments such as suburban, urban, and dense urban. It is worth noticing that since urban and dense urban have more densely populated buildings than suburban, the chance of establishing an LoS link in urban and dense urban is lower than that in suburban with the same elevation angle.
During the propagation in free space, the radio signals emitted from the UAV suffer from the shadowing and scattering caused by artificial structures. Thus, additional loss of the AtG channel should be taken into account. Similar to [14], we consider the mean value rather than the random behavior of the additional path loss because the UAV deployment deals with long-term variations rather than a small-scale variation. Denoting as the mean value of the excessive path loss, the path loss models for LoS and NLoS links in dB are, respectively, calculated as
where f is the carrier frequency; c is the speed of light; is the distance between the UAV and the ith GN. Furthermore, and are the mean additional losses for LoS and NLoS links.
In general, we cannot determine the communication between the UAV and ith GN is LoS or NLoS due to the absence of terrain knowledge. Thus, we consider its mean path loss, which is computed as
With a given transmission power of the UAV, the received power at the ith GN, denoted by , depends crucially on the path loss, and can be written as
For a proper communication between the UAV and the ith GN, the received power should be greater than a threshold power . In other words, the ith GN is covered by the UAV if the wireless link between them experiences path loss less than or equal to a threshold , i.e., . Consequently, the radius of the coverage region can be expressed as .
3. Deployment of the UAV for Maximizing Covered Users Subject to GN Priorities
This section presents our proposed approaches to deploy the UAV in a 3D coordinate system. Specifically, the optimal altitude of the UAV for maxing its coverage area is determined first. Then, based on this optimal altitude, two optimization problems to find the best location of the UAV on xy the-plane will be presented. The first one finds the optimal location of the UAV for maximum covered users without considering GN priorities. In contrast, the latter one takes user priorities into consideration.
3.1. Finding Optimal Altitude for Maximal Coverage Area
As given in (6), all GNs having the same and experience the same path loss. For a given path loss, the radius R of the coverage area of the UAV is an implicit function of its altitude h. As a result, the optimal altitude that provides the maximal coverage area can be determined by solving
Since and , finding optimal h to maximize R is equivalent to finding optimal , denoted by . Solving with respect to , we obtain the following equation [14]
After solving (9), the values of corresponding to suburban, urban, and dense urban environments are , , and , respectively.
Let us denote R be the radius of the coverage area of the UAV. Thus, . At the optimal attitude h of the UAV, the optimal elevation angle is achieved. Replacing (2) into (6), we get
By solving (10), we obtain the maximum coverage as
Then, from and presented above, the optimal altitude is given by
3.2. Finding Optimal Position of the UAV Subject to GN Priorities
Since the coverage area of the UAV is a circular disk, finding the optimal location of the UAV so that it can cover the maximum number of GNs under priority constraint is known as a circle placement problem.
Initially, we denote as a flag variable to indicate whether the ith GN stays inside the UAV’s coverage, i.e., when the ith GN is inside the coverage area of the UAV, and otherwise. Using this flag variable u, the condition that the ith GN is covered by the UAV can be written as
To ensure the constraint (13) still be satisfied when , we should add a large constant on the right side of (13). Thus, we further rewrite (13) as
where the large constant K is set as . Obviously, we can see that when , the constraint (14) reduces to the constraint (13). On the other hand, when , any location () of the UAV within the network area will fulfill the constraint (14). Thus, the problem of finding the optimal position of the UAV without considering priority of the ith GN is formulated as [11]
The solution of provides the optimal coordinate of the UAV and the number of serviceable nodes. However, in this problem, if the number of high-priority GNs is small and the number of low-priority GNs is large, the UAV tends to locate at the region of dense low-priority GNs. When the priority of the GNs is taken into consideration, a new optimization problem is formulated as
The result of (16) gives the optimal position of the UAV, taking into account the priorities of the GNs and the numbers of serviceable high-priority nodes and low-priority nodes within the UAV’s coverage area. It is noted that is a non-negative integer and is a decimal number. Therefore, no matter how large could be, the solution of (16) is achieved by maximizing first and then maximizing later. In other words, the UAV first finds the location where it can serve as many high-priority GNs as possible. Then, if there exist some candidate locations where the UAV can serve the same number of high-priority GNs, it will move to the location where the highest low-priority GNs can be served.
Since (15) and (16) are mixed-integer second-order cone problem (MISOCP), we use the MOSEK solver [20] to solve this problem. Algorithm 1 describes the procedure of the proposed search algorithm to find the optimal position of the UAV.
| Algorithm 1: Obtain optimal 3D position of the UAV. |
| Input: Output: , numbers of low-priority and high-priority nodes Obtain by solving (9) Obtain UAV’s coverage radius R by solving (11) Obtain by solving (12) Solve the problem: Obtain and numbers of high-priority and low-priority GNs by solving (16) |
We implemented the above algorithm on the MATLAB simulator. Figure 4 illustrates the positions and coverage area of the UAV in an urban environment when the conventional algorithm and the proposed algorithm are applied. There is one UAV (denoted by an asterisk), 100 high-priority GNs (denoted by red dots), and 50 low-priority GNs (denoted by green dots) in the network area of 4 km × 4 km. All high-priority GNs are uniformly distributed according to the Poisson point process, whereas all low-priority GNs form four clusters with CoV . We also compare the positions and coverage area of the UAV for two different threshold path losses, i.e., 100 dB and 103 dB. These values are selected to guarantee the QoS of each cell communication. In other words, the i-th user is covered if its link experiences a path loss less than or equal to a certain threshold , i.e., . As shown in Figure 4a,b, the higher the path loss threshold, the larger the coverage area of the UAV. In both cases, although the total number of serviceable GNs of the UAV using the conventional algorithm (yellow asterisk) is higher than that of the UAV using the proposed algorithm (green asterisk), utilizing the proposed algorithm can help the UAV cover a larger number of high-priority GNs. Particularly, for dB, the number of serviceable high-priority GNs corresponding to the proposed and conventional algorithms are 11 and 5, respectively. Meanwhile, for dB, the number of serviceable high-priority GNs corresponding to the proposed and conventional algorithms are 18 and 11, respectively.
Figure 5 demonstrates the positions and the coverages of the UAV corresponding to the conventional algorithm and the proposed algorithm for three different urban environments, i.e., suburban, urban, and dense urban. The threshold path loss is dB, other parameters are similar to those used in Figure 4. As shown in Figure 5, the coverage area of the UAV is the largest for the suburban environment, while the coverage area of the UAV is the smallest for the dense urban environment. Obviously, for the same elevation angle of the UAV, the suburban environment offers the highest LoS probability than other environments. We can see in Figure 5a,b that, for all kinds of urban environments, the UAV using the conventional algorithm locates at the positions where the largest number of the GNs can be served. However, the number of high-priority GNs is much smaller than that in using the proposed algorithm.
4. Performance Evaluation
This section will present the evaluation metrics, parameter settings, and simulation results for the evaluation of two optimization algorithms presented in the previous section.
4.1. Evaluation Metrics
Before giving the simulation parameters and results, we introduce the following evaluation metrics, which will be used to intensively evaluate the effectiveness of the proposed algorithm for obtaining the optimal 3D position of the UAV.
• Coverage efficiency: is defined as the summation of the number of high-priority GNs and the ratio of the number of low-priority GNs to the total number of GNs, i.e., . It is noted that this index is the objective function (16) of Algorithm 2. A higher value of the coverage efficiency index will demonstrate the advantages of the proposed algorithm in choosing optimal altitude and xy-plane position of the UAV.
• Average throughput: is defined as the data rate of the wireless link between the UAV and the ith GN. Specifically, the data reception rate over the UAVth GN link is computed as
where with and are the noise spectral density and the bandwidth allocated to the ith GN, respectively.
• Average delay: is defined as the delay between the time when a request for a data was sent by an ith GN to the UAV and the time when the ith GN receives the entire data from the UAV. According to [22,23], this delay can be modeled as
where RTT in second is the round trip time, ATL in bit is the average traffic load, MSS in bit is the maximum segment size, and is the number of slow start cycles with idle periods with and are, respectively, given by
4.2. Parameter Settings
In our simulations, there are one UAV, 50 high-priority GNs, and 100 low-priority GNs deployed in a network area of 3 km × 3 km. The high-priority GNs are distributed according to Poisson point process with CoV = 1, while the low-priority GNs are gathered into several clusters with CoV ranges from 1 to 5. The bandwidth for the communication between the UAV and the ith GNs is MHz. The mean additional losses for LoS and NLoS link are set as (0.1, 21), (1.0, 20), and (1.6, 23) for suburban, urban, and dense urban, respectively [14]. Other parameters are GHz, dBm, dBm, m, RTT s, ATL Mbits, MSS Mbits, dBm/Hz.
4.3. Simulation Results
Figure 6 plots the coverage efficiency versus the CoV for three kinds of urban environments (suburban, urban, dense urban) and two threshold path losses ( 100 dB and 103 dB). As shown in Figure 6, the coverage efficiency of the proposed algorithm is almost constant while that of the conventional algorithm fluctuates as the CoV increases. It is because when the proposed algorithm is employed, the optimal location of the UAV is determined so that the maximum number of high-priority GNs can be covered. We should note that the high-priority GNs are uniformly distributed, while the low-priority GNs are gathered into several clusters. Thus, the number of high-priority GNs covered by the UAV is not varied as that of low-priority GNs. We can also see that suburban provides the highest coverage efficiency for both proposed and conventional algorithms. On the other hand, the proposed algorithm always offers higher coverage efficiency than the conventional one for the same environment. Particularly, when 100 dB (Figure 6a), the coverage efficiency of the proposed algorithm is 3.26, 2.93, and 3.11 higher than that of the conventional algorithm, corresponding to suburban, urban, and dense urban, respectively. When 103 dB (Figure 6b), the coverage efficiency of the UAV using two algorithms greatly increase because of the larger coverage area of the UAV.
Figure 7 plots the average throughput of high-priority GN versus the CoV for three kinds of urban environments and two threshold path losses ( 100 dB and 103 dB). We can see that as the CoV increases, the average throughput decreases because more high-priority GNs covered by the UAV results in lower bandwidth allocated to each GN. As the CoV increases further, all average throughputs reach saturated minimum values. However, the dense urban always provides the highest throughput than the urban and the suburban. However, the difference gap is remarkably reduced when the CoV gets higher. For example, for 100 dB and conventional algorithm, the average throughput reduces from 1.67 Mbps to 1.04 Mbps ( Mbps) when the CoV increases from 1 to 2.5, but average throughput only reduces from 1.04 Mbps to 0.85 Mbps ( Mbps) when the CoV increases from 2.5 to 5. The same behavior can be observed in the cases that the proposed algorithm is used in different urban environments and 103 dB. Importantly, it is noted that the proposed algorithm provides significantly higher average throughput than the conventional algorithm, i.e., 1.52 Mbps for 100 dB (Figure 7a) and 1.14 Mbps for 103 dB (Figure 7b).
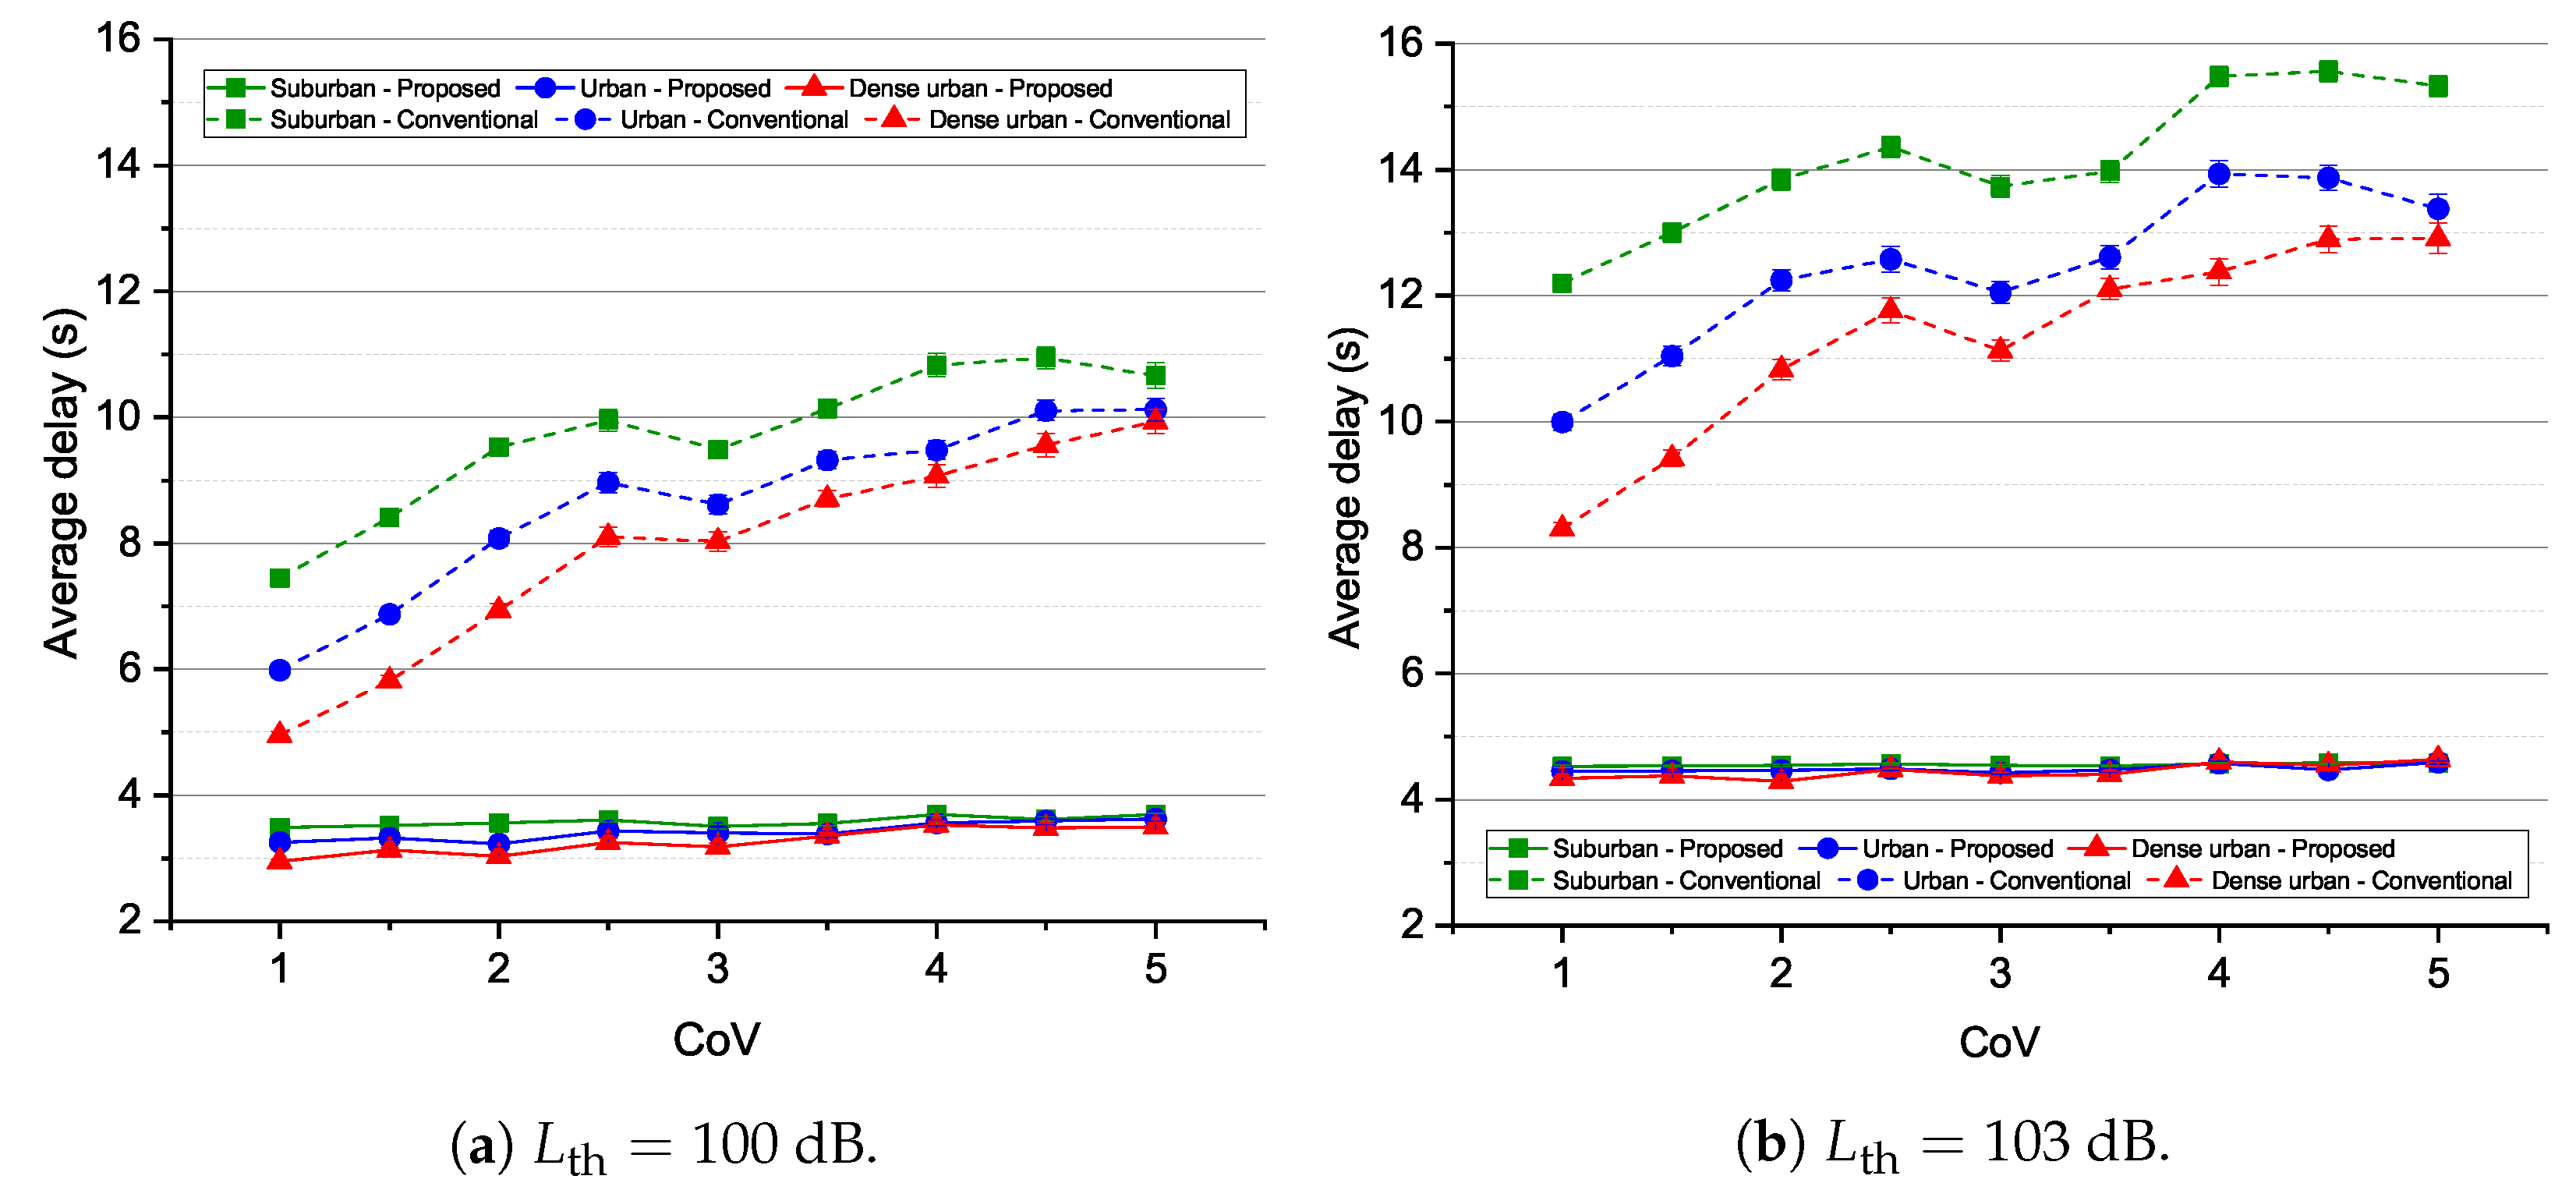
Figure 8 shows the average delay of high-priority GN versus the CoV for three kinds of urban environments and two threshold path losses ( 100 dB and 103 dB). From Figure 8, we can see that the average delay of the proposed algorithm slightly increases with the CoV, i.e., from 3.26 s to 3.63 s. In contrast, the average delay of the conventional algorithm remarkably increases from 5.98 s to 10.12 s. The reason behind this feature is that in the case of the conventional algorithm, the entire bandwidth is equally allocated to all GNs. Hence, as the number of served GNs increases, the bandwidth allocated to high-priority GN decreases, making the transmission delay increase. We can also see that suburban gives the highest delay due to its lowest throughput, as illustrated in Figure 7. On the other hand, compared with the average delay when 100 dB, the average delay when 103 dB becomes significant higher, especially for the conventional algorithm. It is because higher threshold path losses enlarge the coverage area of the UAV; thus, greatly increasing the transmission delay from the UAV to the high-priority GN.
5. Conclusions
In this paper, we have proposed and evaluated an algorithm that finds the optimal position of the UAV-BS, considering both the priority and the distribution of the GNs. Particularly, UAV-BS searched for the best 3D coordination where it could serve the maximum number of high-priority GNs first, then the maximum number of low-priority nodes later. Simulation results showed that the proposed algorithm increased the number of serviceable high-priority GNs compared to the conventional algorithm. In addition, the proposed algorithm could maintain a remarkably high average throughput and low average delay as the location distributions of GNs and the quality of wireless channels vary. In future work, we will study the joint optimization between user priorities and another system parameter such as energy efficiency or security.
Author Contributions
Conceptualization, I.M. and L.T.D.; methodology, I.M.; software, T.K.; validation, I.M., L.T.D., and T.K.; formal analysis, I.M.; investigation, I.M.; resources, T.K.; data curation, I.M. and L.T.D.; writing—original draft preparation, I.M.; writing—review and editing, L.T.D. and T.K.; visualization, I.M. and L.T.D.; supervision, L.T.D. and T.K.; project administration, T.K.; funding acquisition, T.K. All authors have read and agreed to the published version of the manuscript.
Funding
This research was supported by the Basic Science Research Program through the National Research Foundation of Korea (NRF) funded by the Ministry of Education (2020R1I1A3068305).
Institutional Review Board Statement
Not applicable.
Informed Consent Statement
Not applicable.
Data Availability Statement
The data presented in this study are available on request from the corresponding author. The data are not publicly available due to privacy.
Conflicts of Interest
The authors declare no conflict of interest.
References
- Zeng, Y.; Zhang, R.; Lim, T.J. Wireless communications with unmanned aerial vehicles: Opportunities and challenges. IEEE Commun. Mag. 2016, 54, 36–42. [Google Scholar] [CrossRef] [Green Version]
- Mozaffari, M.; Saad, W.; Bennis, M.; Nam, Y.H.; Debbah, M. A Tutorial on UAVs for Wireless Networks: Applications, Challenges, and Open Problems. IEEE Commun. Surv. Tutor. 2019, 21, 2334–2360. [Google Scholar] [CrossRef] [Green Version]
- Gupta, L.; Jain, R.; Vaszkun, G. Survey of Important Issues in UAV Communication Networks. IEEE Commun. Surv. Tutor. 2016, 18, 1123–1152. [Google Scholar] [CrossRef] [Green Version]
- Alsamhi, S.H.; Ma, O.; Ansari, M.S. Predictive Estimation of the Optimal Signal Strength from Unmanned Aerial Vehicle over Internet of Things Using ANN. arXiv 2018, arXiv:1805.07614. [Google Scholar]
- Saif, A.; Dimyati, K.; Noordin, K.; Shah, N.; Alsamhi, S.; Abdullah, Q. Energy-Efficient Tethered UAV Deployment in B5G for Smart Environments and Disaster Recovery. In Proceedings of the 1st International Conference on Emerging Smart Technologies and Applications (eSmarTA), Sana’a, Yemen, 10–12 August 2021; pp. 1–6. [Google Scholar]
- Al-Hourani, A.; Kandeepan, S.; Jamalipour, A. Modeling air-to-ground path loss for low altitude platforms in urban environments. In Proceedings of the 2014 IEEE Global Communications Conference, Austin, TX, USA, 8–12 December 2014; pp. 2898–2904. [Google Scholar]
- Khuwaja, A.A.; Chen, Y.; Zhao, N.; Alouini, M.S.; Dobbins, P. A Survey of Channel Modeling for UAV Communications. IEEE Commun. Surv. Tutor. 2018, 20, 2804–2821. [Google Scholar] [CrossRef] [Green Version]
- Gapeyenko, M.; Moltchanov, D.; Andreev, R.W.H.S. Line-of-Sight Probability for mmWave-Based UAV Communications in 3D Urban Grid Deployments. IEEE Trans. Wirel. Commun. 2021, 20, 6566–6579. [Google Scholar] [CrossRef]
- Huang, Y.; Cui, M.; Zhang, G.; Chen, W. Bandwidth, Power and Trajectory Optimization for UAV Base Station Networks With Backhaul and User QoS Constraints. IEEE Access 2020, 8, 67625–67634. [Google Scholar] [CrossRef]
- Alsamhi, S.H.; Afghah, F.; Sahal, R.; Hawbani, A.; Al-qaness, M.A.; Lee, B.; Guizani, M. Green internet of things using UAVs in B5G networks: A review of applications and strategies. Ad Hoc Netw. 2021, 117, 1–16. [Google Scholar] [CrossRef]
- Alzenad, M.; El-Keyi, A.; Lagum, F.; Yanikomeroglu, H. 3-D Placement of an Unmanned Aerial Vehicle Base Station (UAV-BS) for Energy-Efficient Maximal Coverage. IEEE Wirel. Commun. Lett. 2017, 6, 434–437. [Google Scholar] [CrossRef] [Green Version]
- Alzenad, M.; El-Keyi, A.; Yanikomeroglu, H. 3-D Placement of an Unmanned Aerial Vehicle Base Station for Maximum Coverage of Users With Different QoS Requirements. IEEE Wirel. Commun. Lett. 2018, 7, 38–41. [Google Scholar] [CrossRef] [Green Version]
- Bor-Yaliniz, R.I.; El-Keyi, A.; Yanikomeroglu, H. Efficient 3-D placement of an aerial base station in next generation cellular networks. In Proceedings of the 2016 IEEE International Conference on Communications (ICC), Kuala Lumpur, Malaysia, 22–27 May 2016; pp. 1–5. [Google Scholar]
- Al-Hourani, A.; Kandeepan, S.; Lardner, S. Optimal LAP Altitude for Maximum Coverage. IEEE Wirel. Commun. Lett. 2014, 3, 569–572. [Google Scholar] [CrossRef] [Green Version]
- Mozaffari, M.; Saad, W.; Bennis, M.; Debbah, M. Drone Small Cells in the Clouds: Design, Deployment and Performance Analysis. In Proceedings of the 2015 IEEE Global Communications Conference (GLOBECOM), San Diego, CA, USA, 6–10 December 2015; pp. 1–6. [Google Scholar]
- Chen, Y.; Feng, W.; Zheng, G. Optimum Placement of UAV as Relays. IEEE Commun. Lett. 2018, 22, 248–251. [Google Scholar] [CrossRef] [Green Version]
- Li, L.; Chang, T.H.; Cai, S. UAV Positioning and Power Control for Two-Way Wireless Relaying. IEEE Trans. Wirel. Commun. 2020, 19, 1008–1024. [Google Scholar] [CrossRef] [Green Version]
- Bushnaq, O.; Kishk, M.; Celik, A.; Alouini, M.S.; Al-Naffouri, T. Optimal Deployment of Tethered Drones for Maximum Cellular Coverage in User Clusters. IEEE Trans. Wirel. Commun. 2020, 20, 2092–2108. [Google Scholar] [CrossRef]
- Chen, Q. Joint Position and Resource Optimization for Multi-UAV-Aided Relaying Systems. IEEE Access 2020, 8, 10403–10415. [Google Scholar] [CrossRef]
- ApS, M. MOSEK Optimization Toolbox for MATLAB. Release 9.2.44; Mosek: Copenhagen, Denmark, 2021. [Google Scholar]
- Mirahsan, M.; Schoenen, R.; Yanikomeroglu, H. HetHetNets: Heterogeneous Traffic Distribution in Heterogeneous Wireless Cellular Networks. IEEE J. Sel. Areas Commun. 2015, 33, 2252–2265. [Google Scholar] [CrossRef] [Green Version]
- Liu, X.; Liu, Y.; Chen, Y. Deployment and Movement for Multiple Aerial Base Stations by Reinforcement Learning. In Proceedings of the 2018 IEEE Globecom Workshops (GC Wkshps), Abu Dhabi, United Arab Emirates, 9–13 December 2018; pp. 1–6. [Google Scholar]
- Rugelj, M.; Sedlar, U.; Volk, M.; Sterle, J.; Hajdinjak, M.; Kos, A. Novel Cross-Layer QoE-Aware Radio Resource Allocation Algorithms in Multiuser OFDMA Systems. IEEE Trans. Commun. 2014, 62, 3196–3208. [Google Scholar] [CrossRef]
Figure 1.
An example of a Voronoi cell area with 40 GNs distributed in an area of 4000 m × 4000 m.
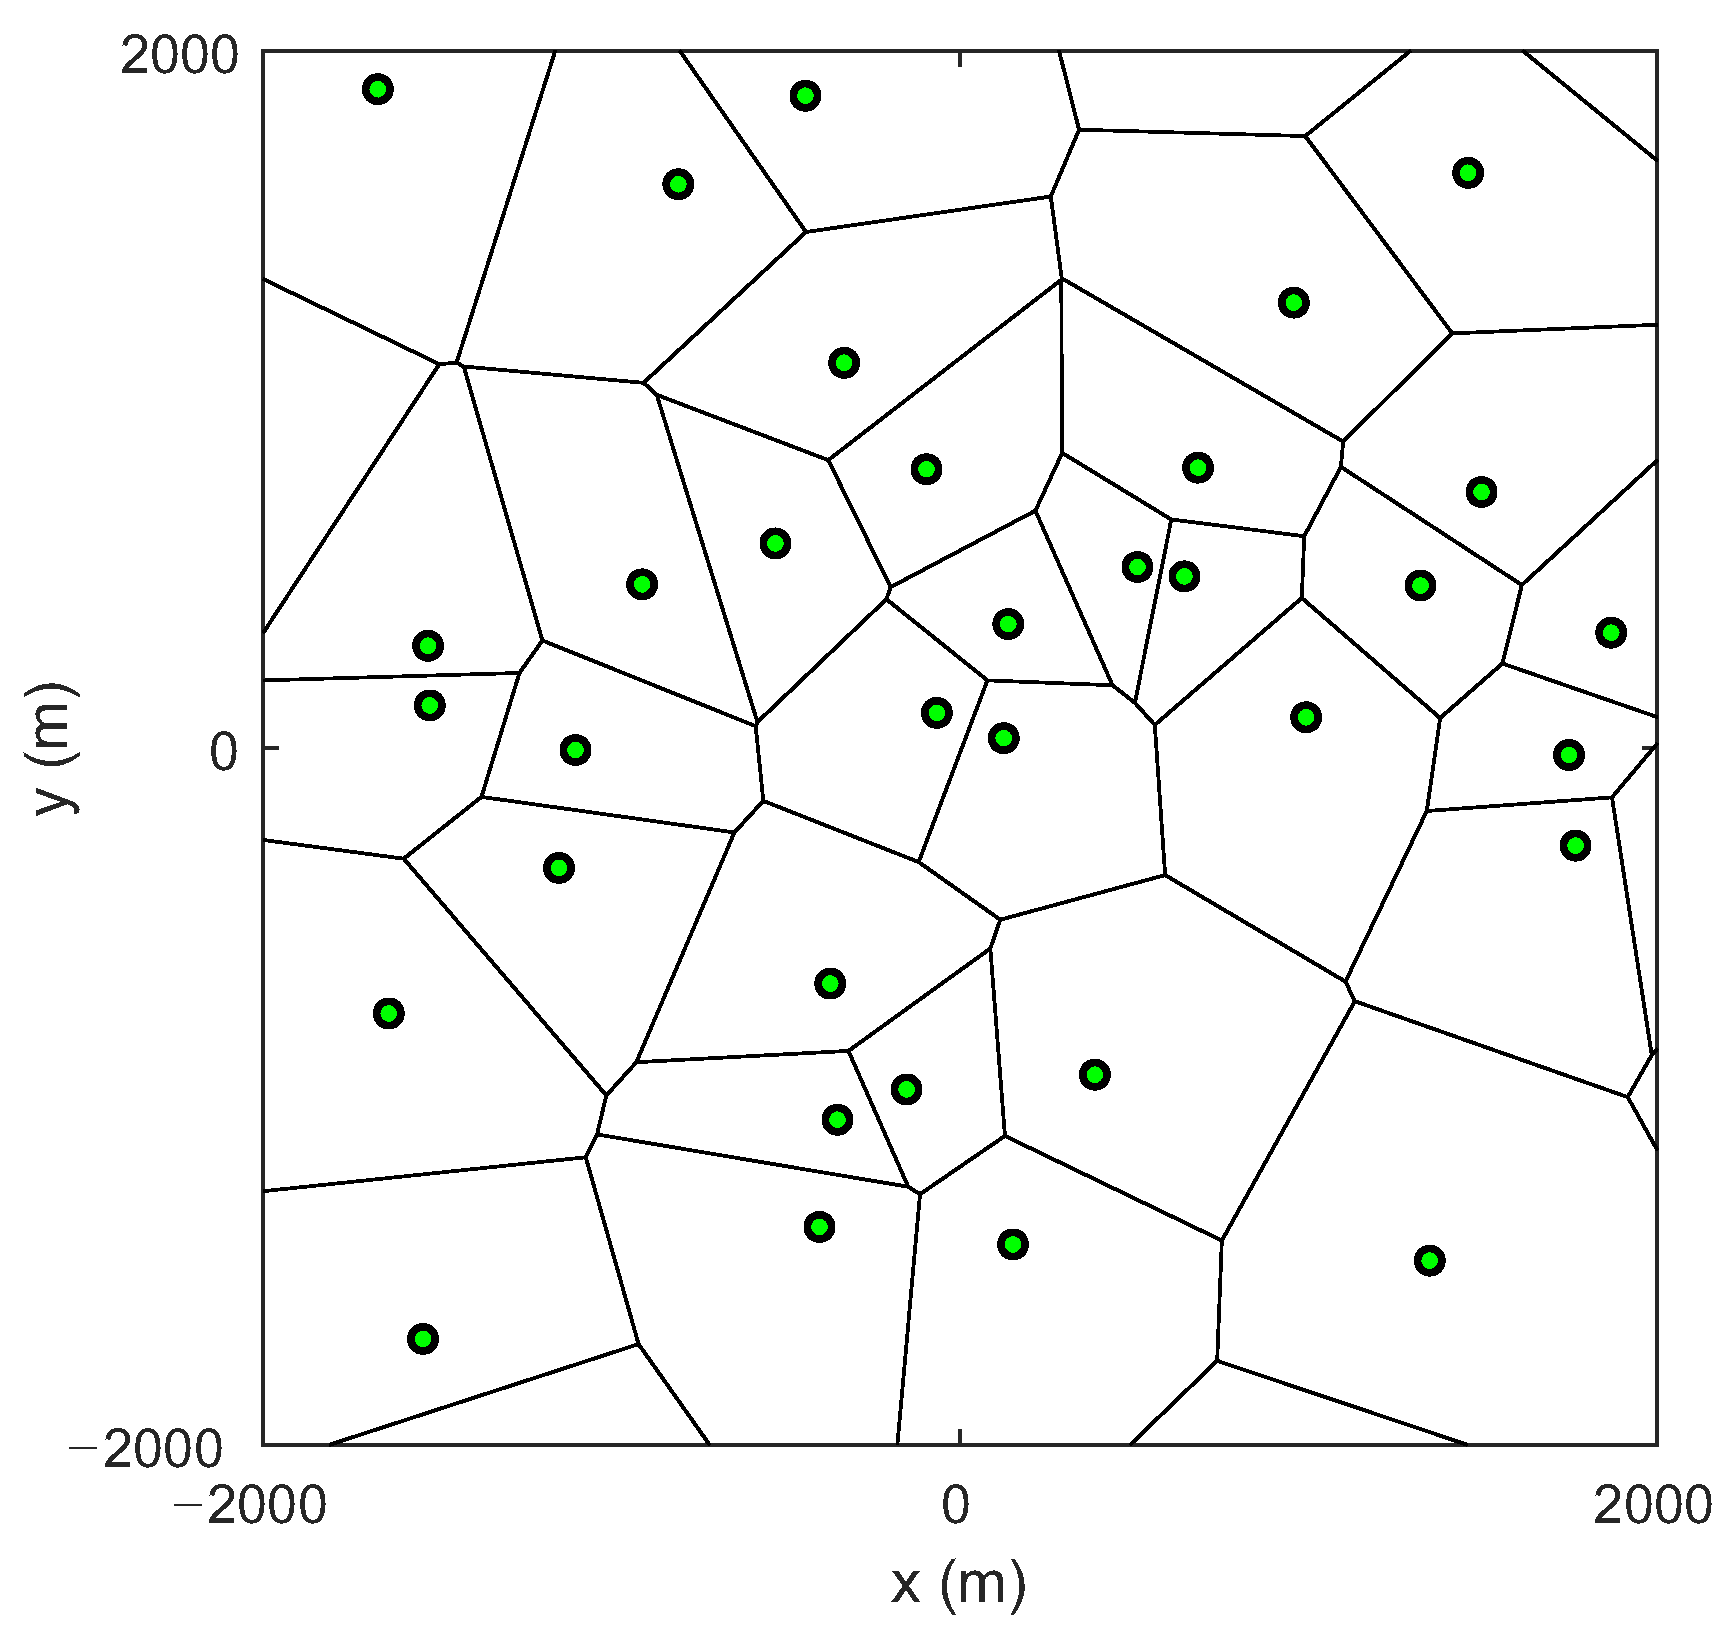
Figure 2.
The location distribution of 100 GNs for different values of CoV; m.
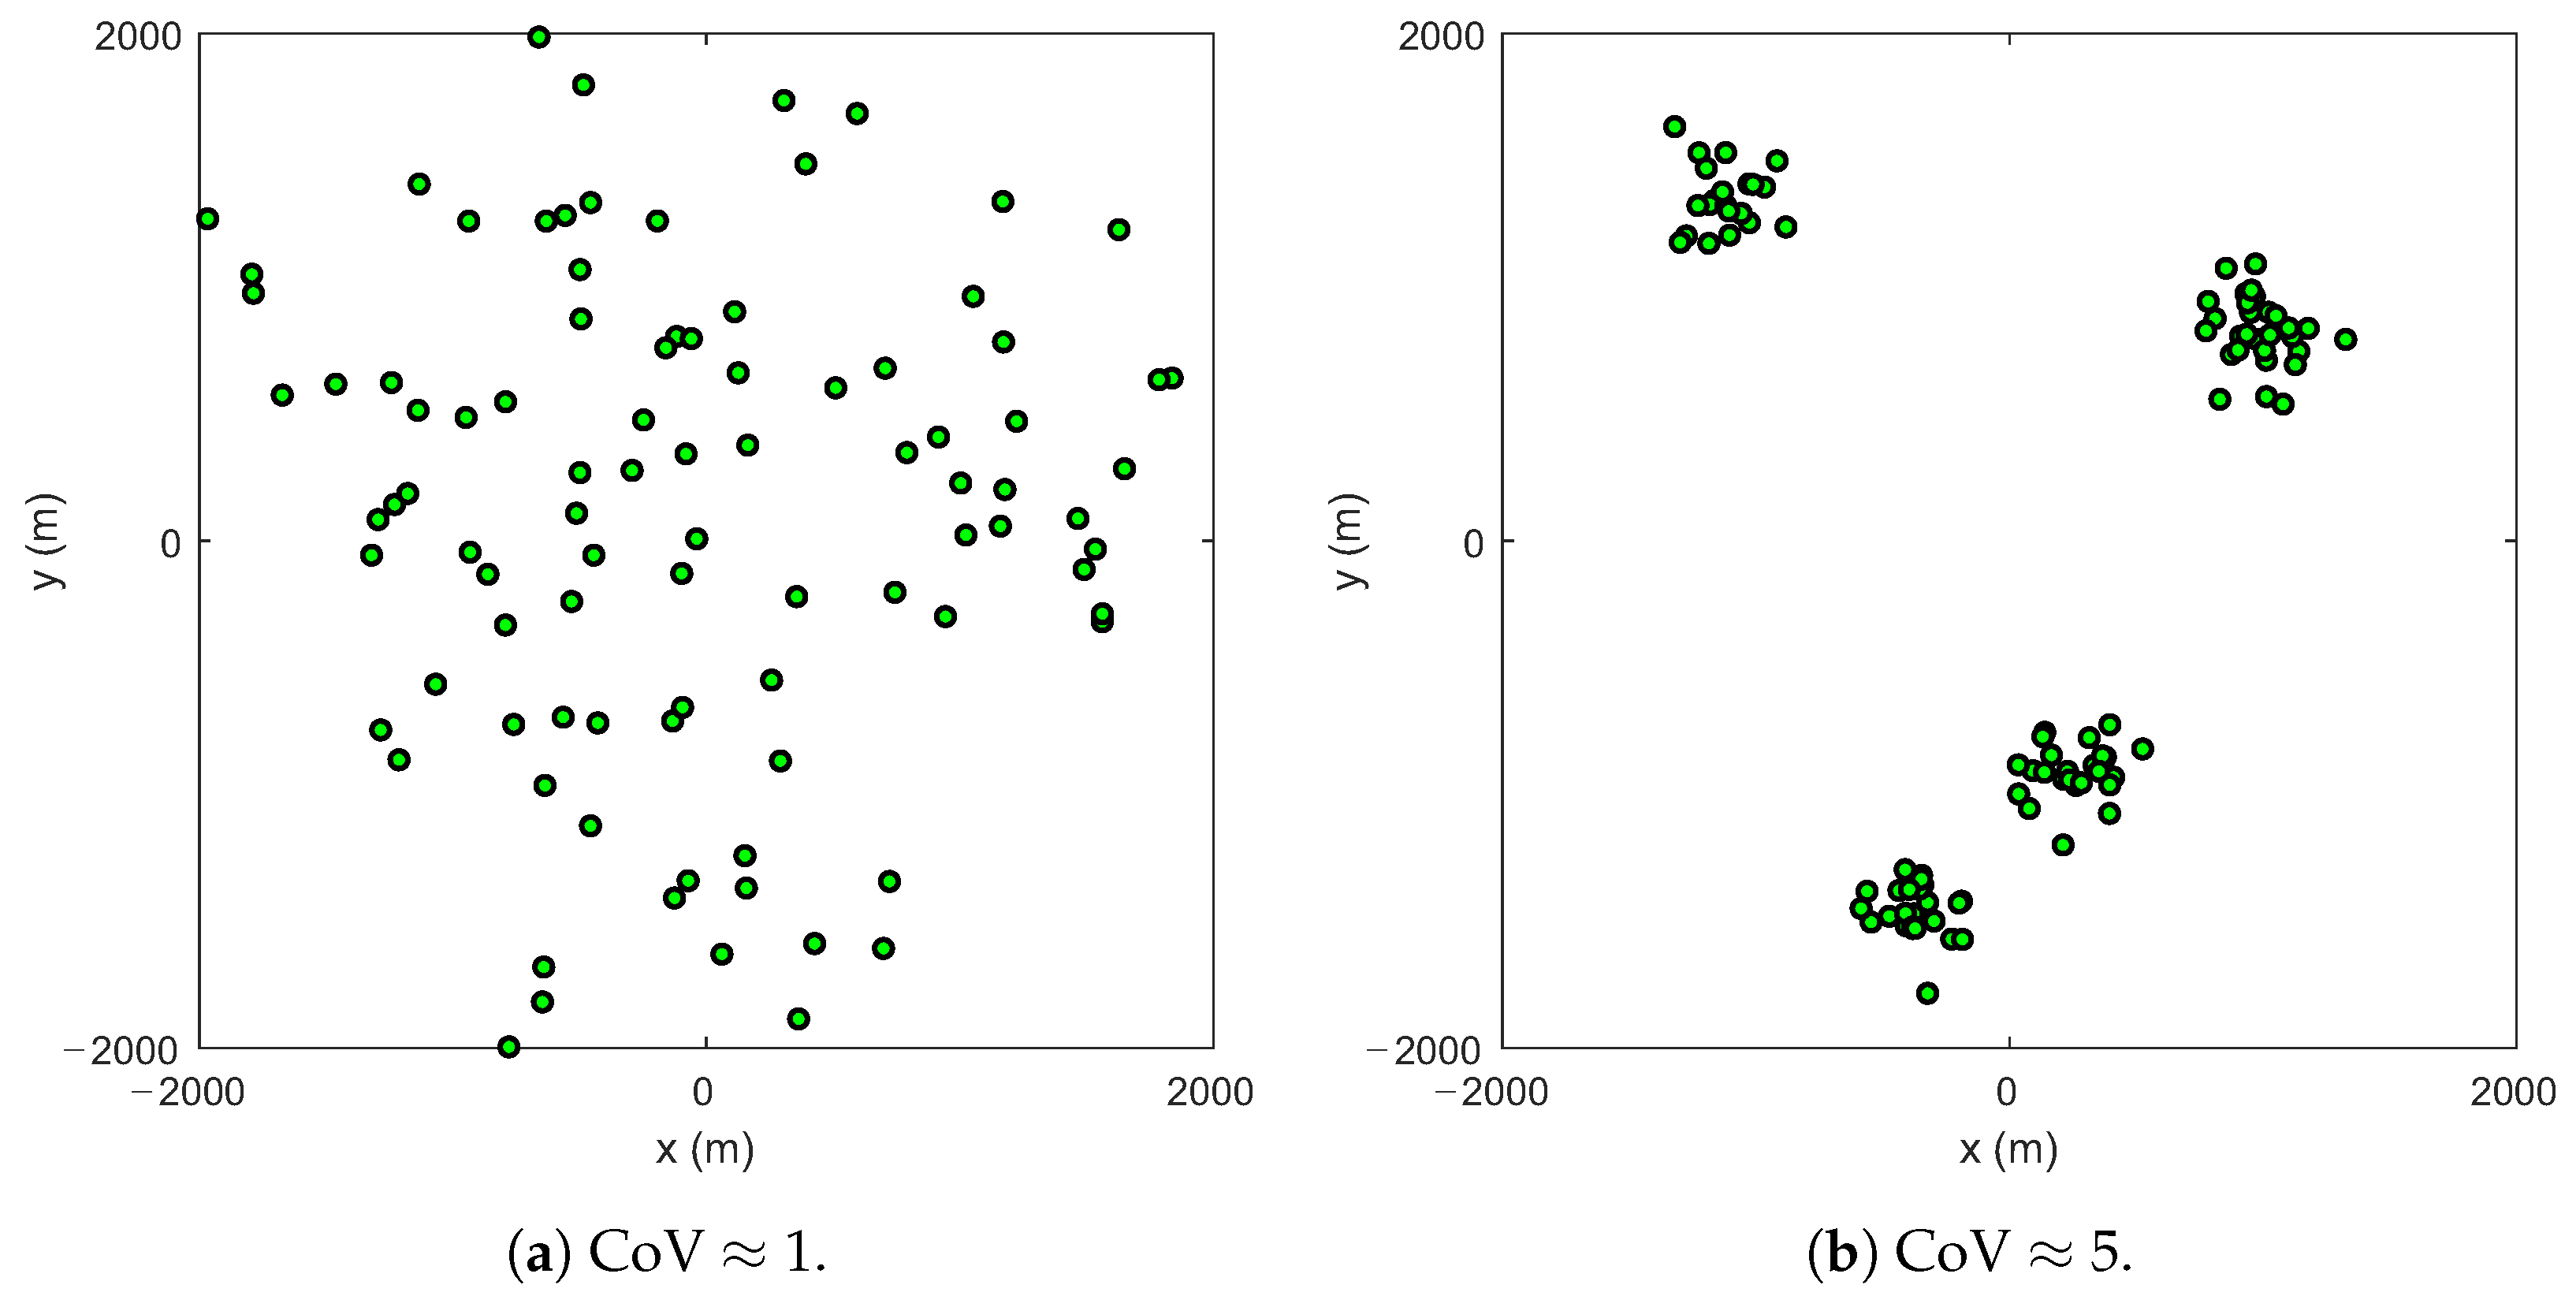
Figure 3.
LoS probability versus the elevation angle for different urban environments.
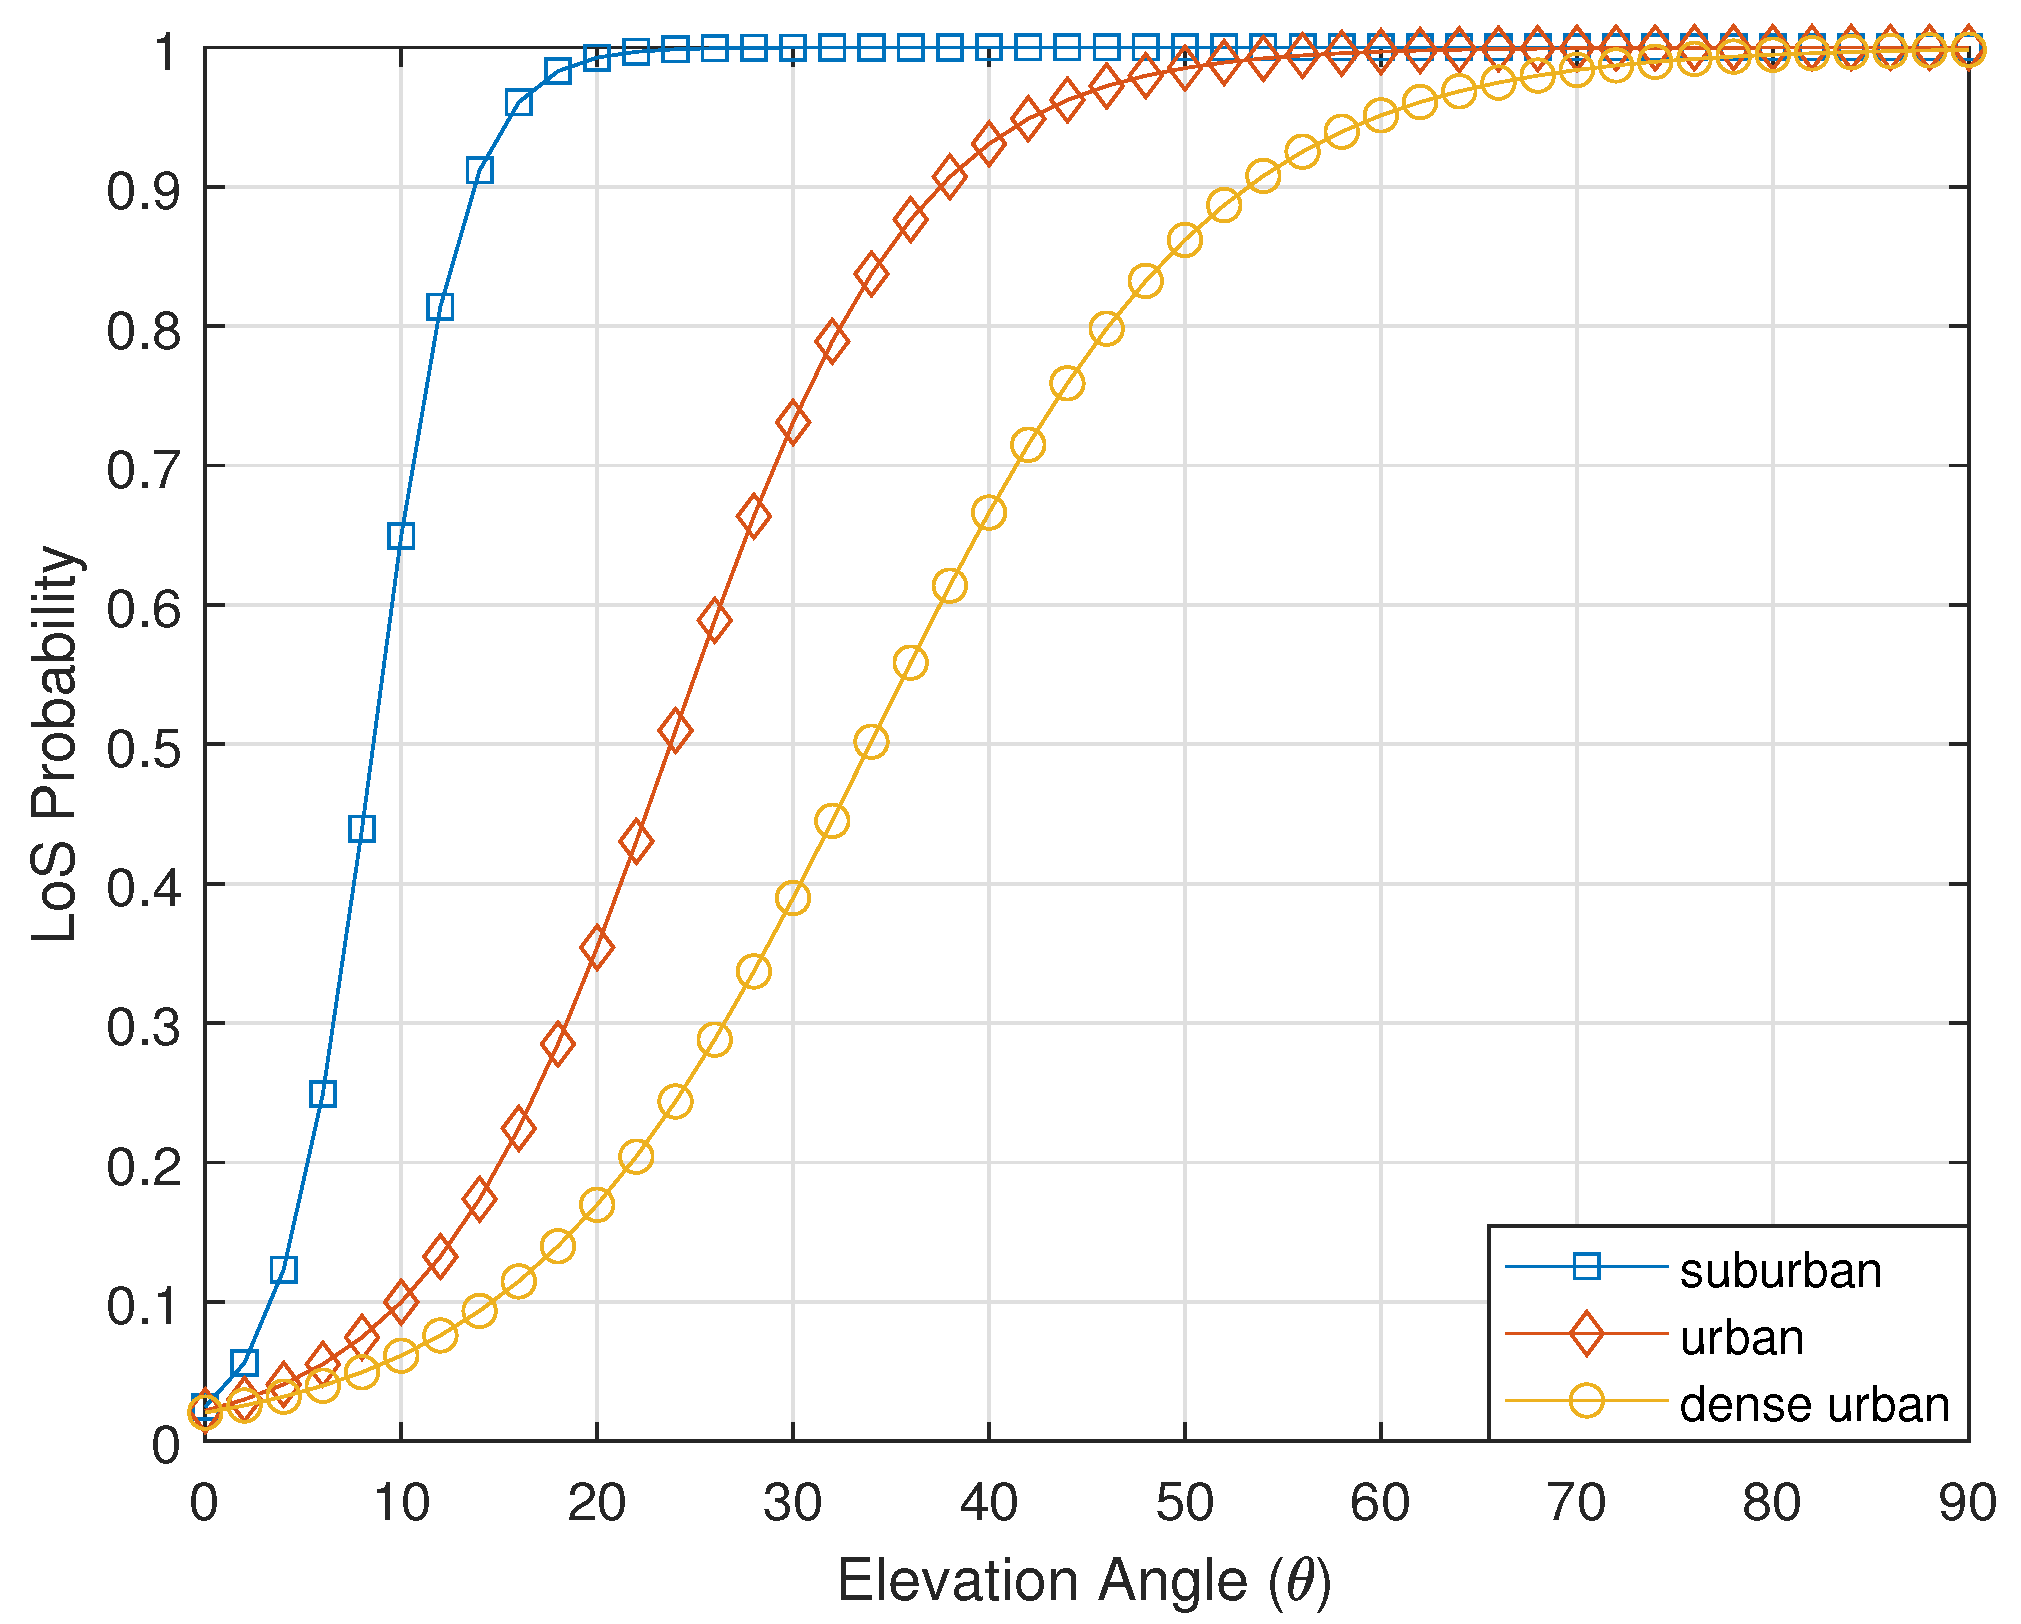
Figure 4.
The optimal position of the UAV using the conventional and proposed algorithms in urban environment for different threshold path losses; m, , .
Figure 4.
The optimal position of the UAV using the conventional and proposed algorithms in urban environment for different threshold path losses; m, , .

Figure 5.
The optimal position of the UAV using the conventional and proposed algorithms for different urban environments; dB, m, , .
Figure 5.
The optimal position of the UAV using the conventional and proposed algorithms for different urban environments; dB, m, , .

Figure 6.
Coverage efficiency versus CoVs for different urban environments and threshold path losses.
Figure 6.
Coverage efficiency versus CoVs for different urban environments and threshold path losses.
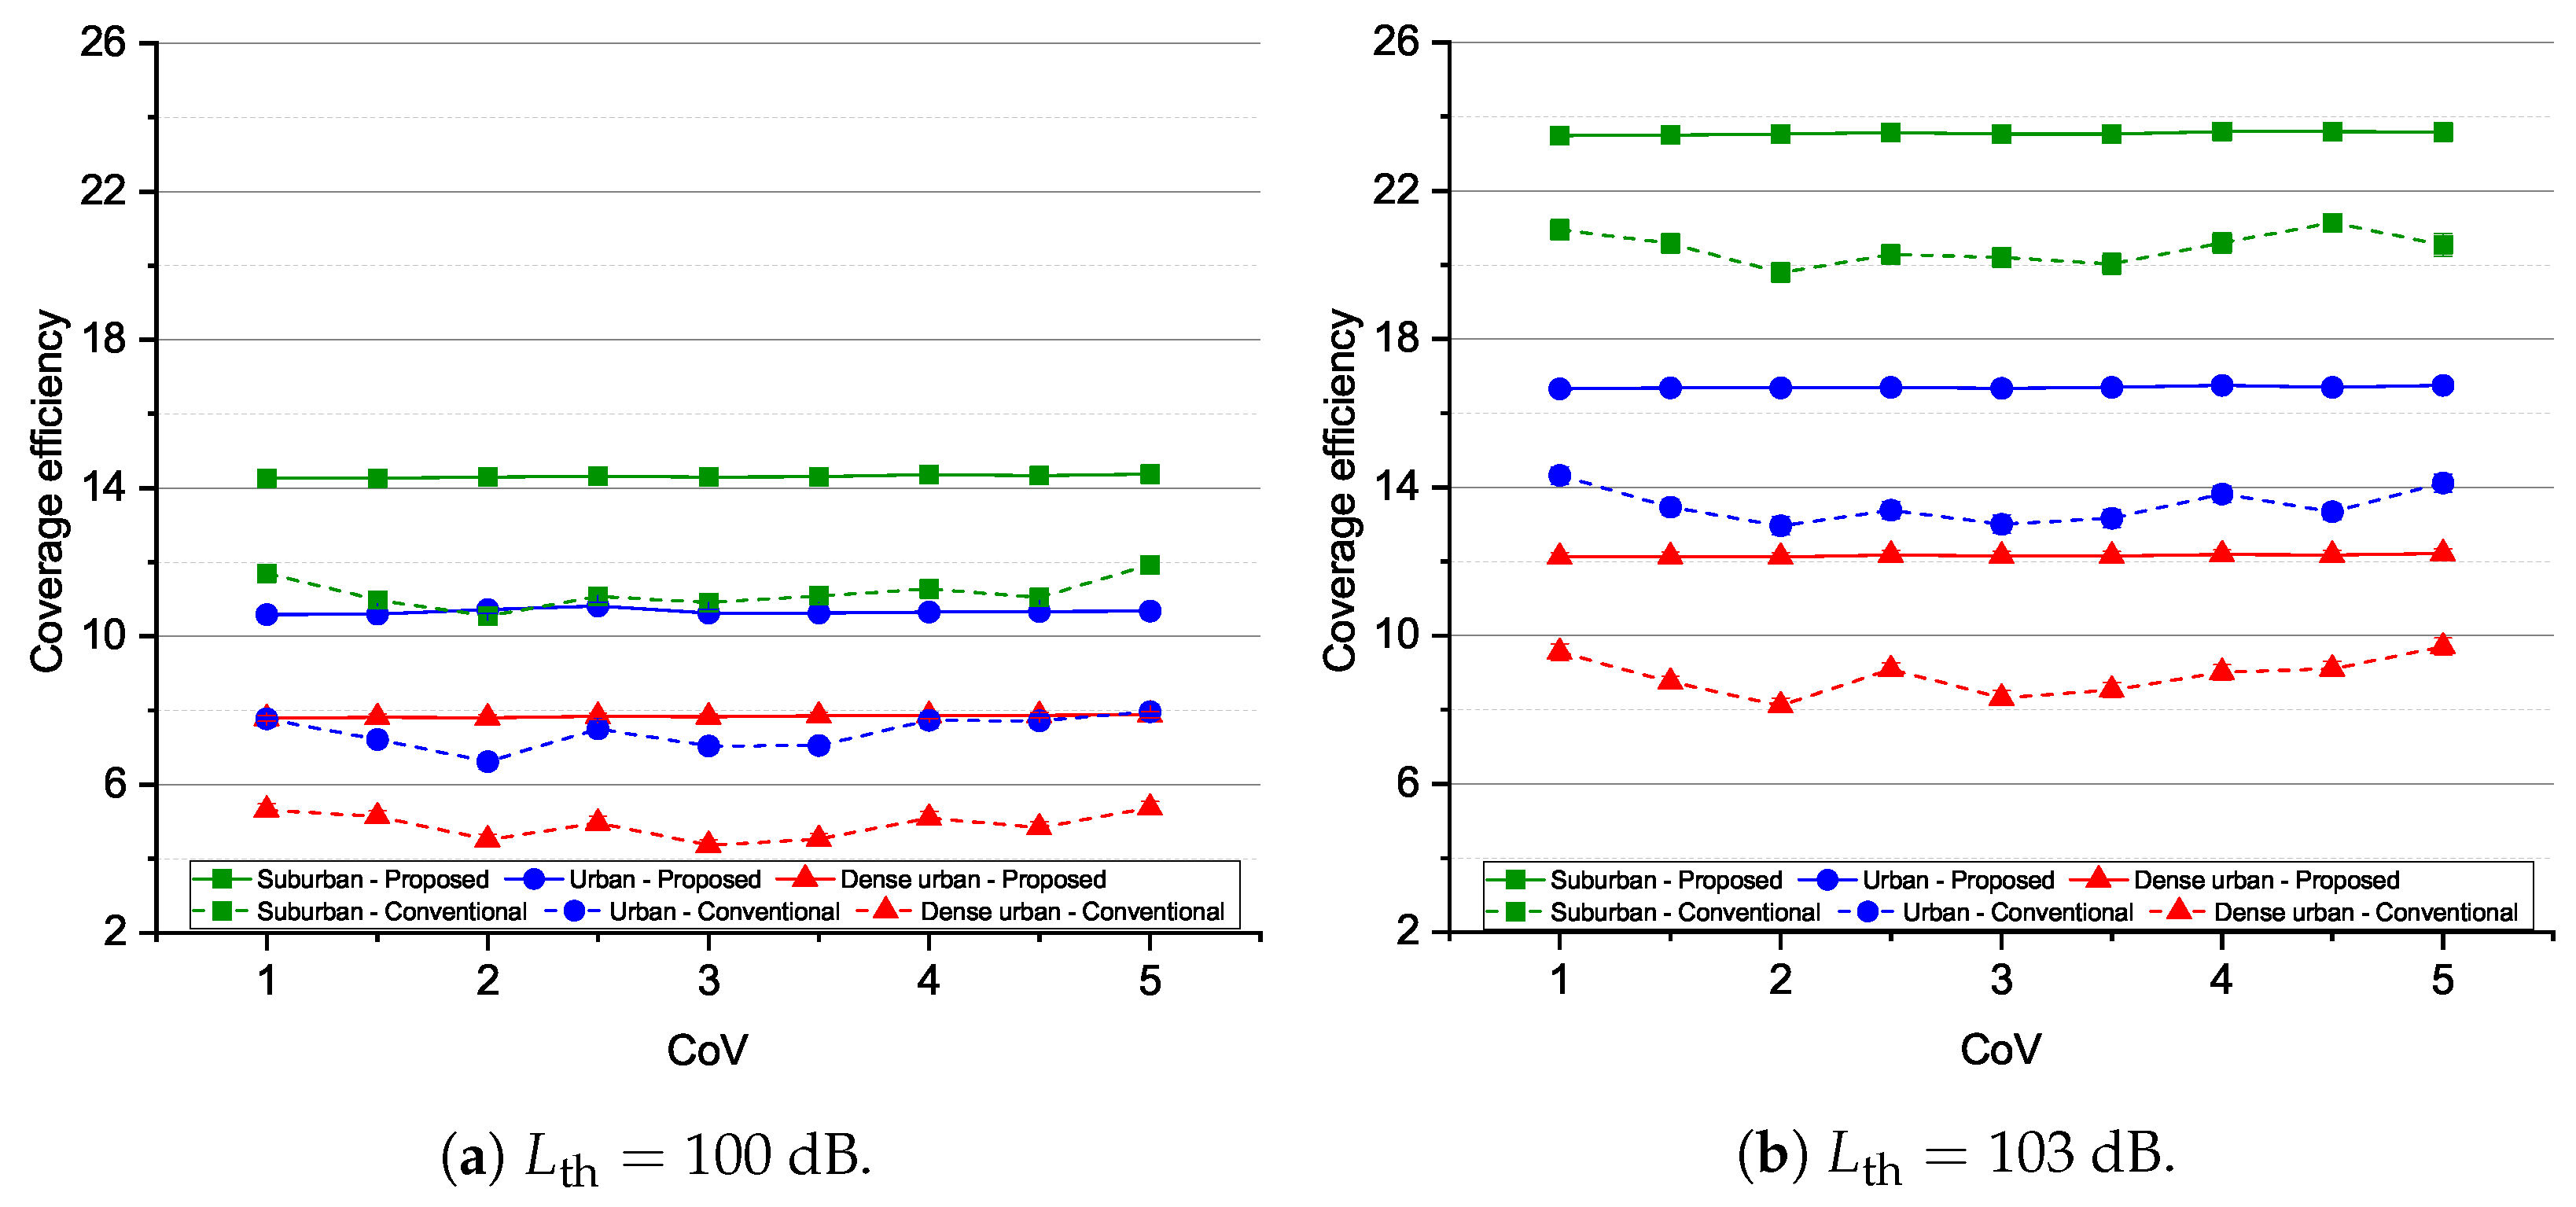
Figure 7.
Average throughput versus the CoV for different urban environments and threshold path losses.
Figure 7.
Average throughput versus the CoV for different urban environments and threshold path losses.
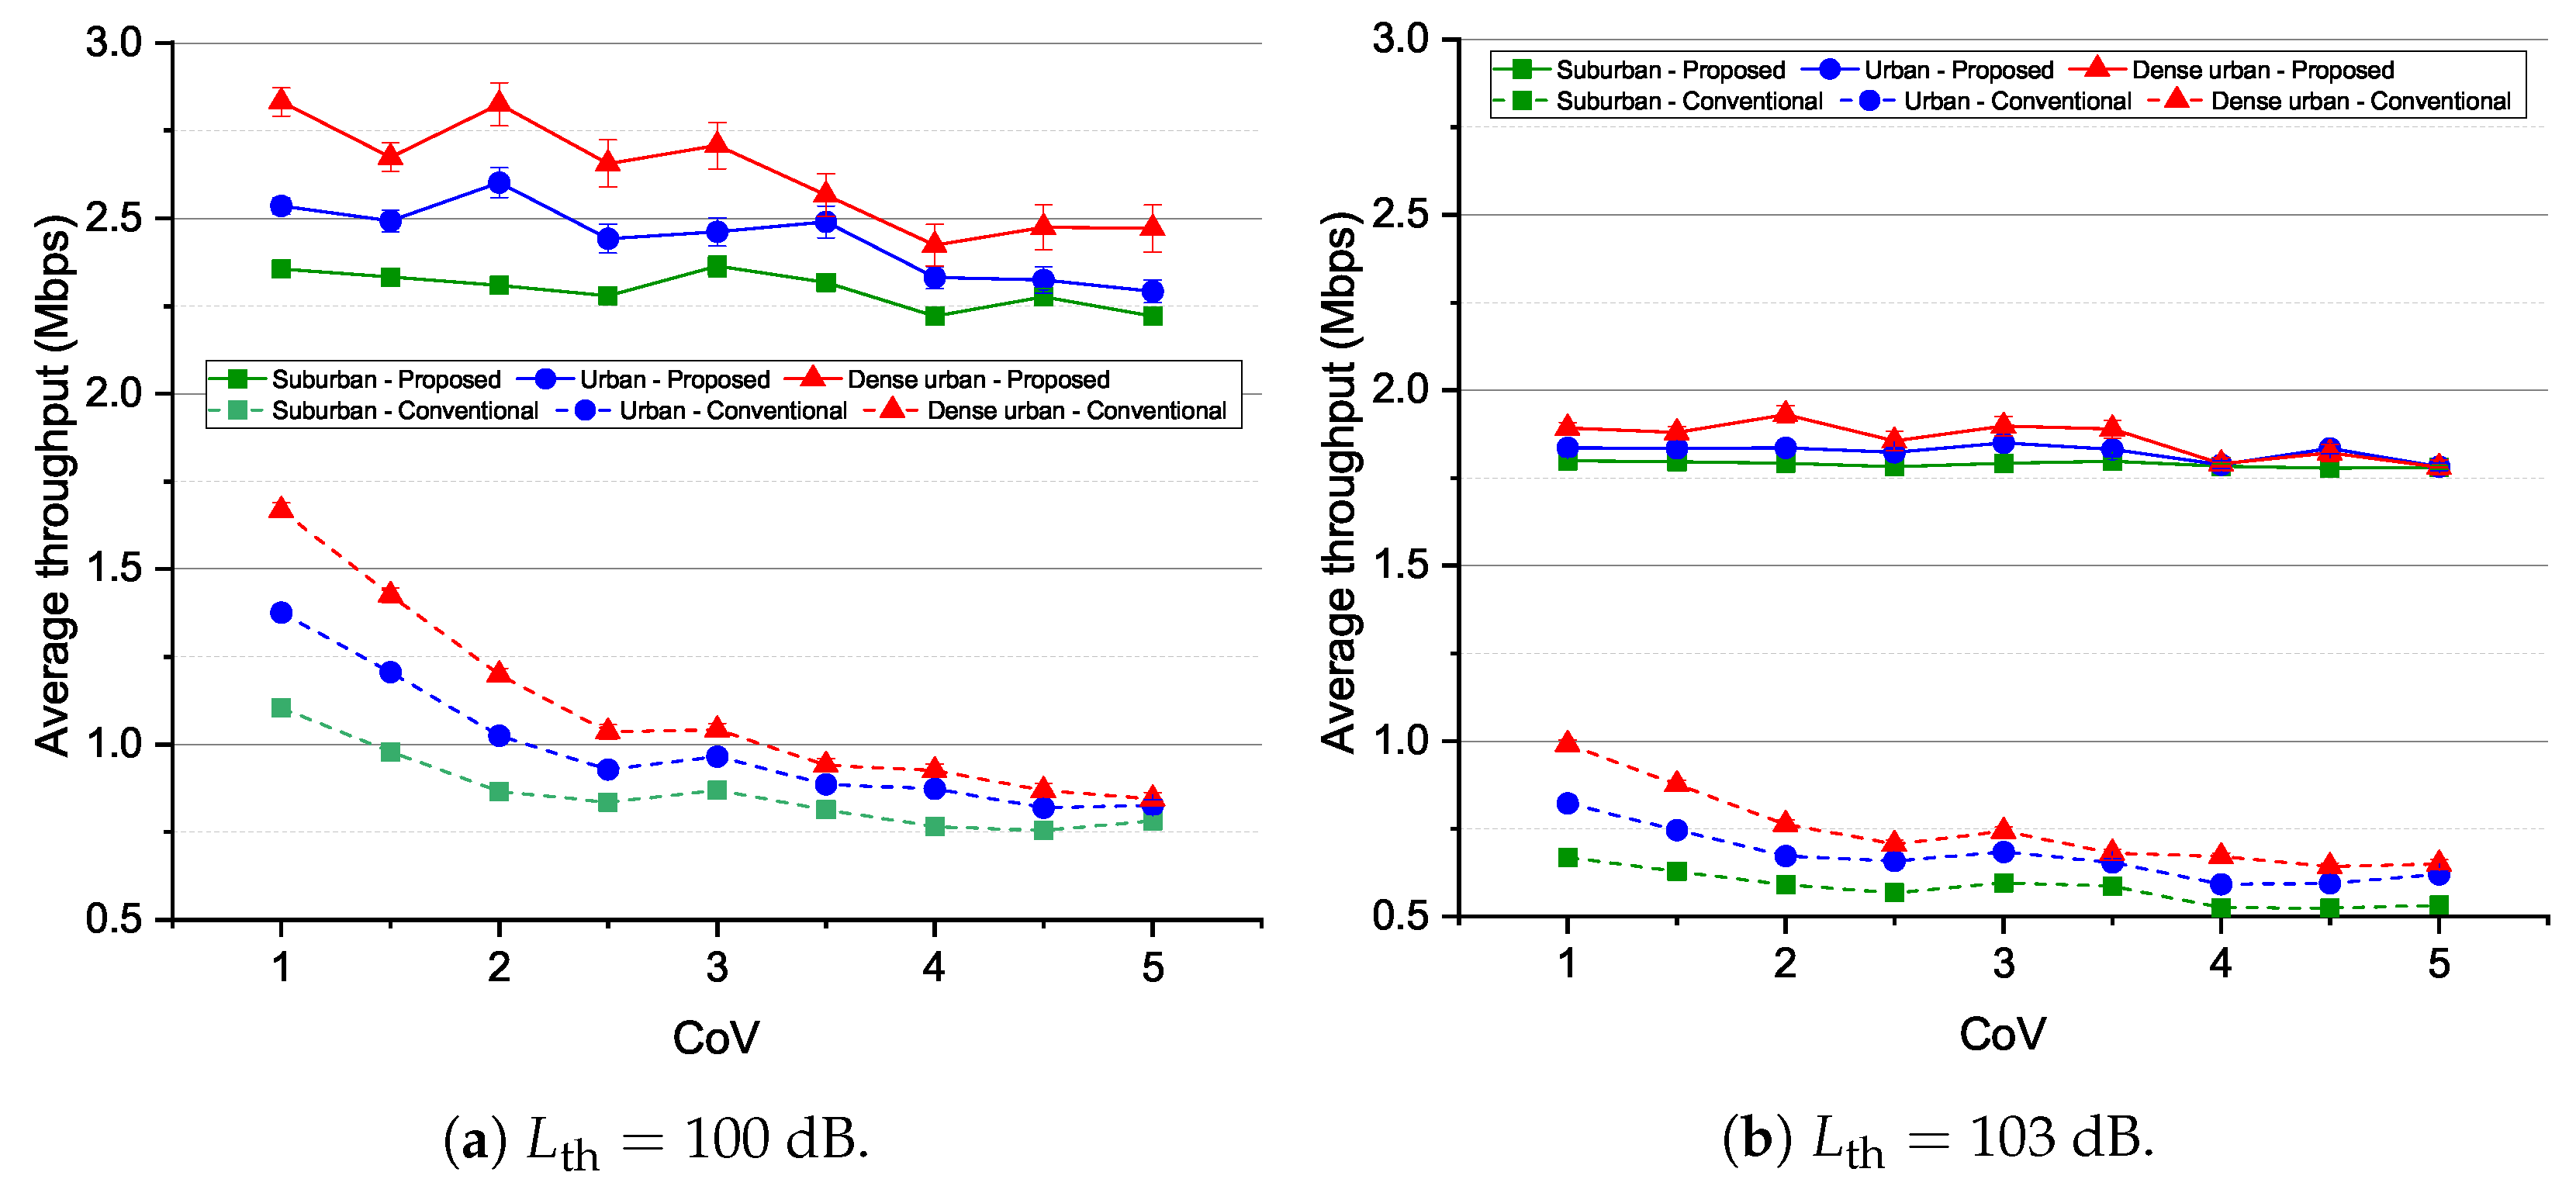
Figure 8.
Average delay versus the CoV for different urban environments and threshold path losses.

Table 1.
Comparisons of our work with previous works.
| Ref. | System Model and Contribution | Optimal Altitude | Optimal Trajectory | Different Priorities for GNs |
|---|---|---|---|---|
| [8] (2021) | UAV communicate with GN; deriving the closed-form LoS and non-LoS probabilities | yes | no | no |
| [11] (2017) | UAV server GNs; finding the altitude and trajectory for maximum coverage region | yes | yes | no |
| [12] (2018) | UAV server GNs; finding the altitude and trajectory for maximizes the number of covered users with different quality-of-service requirements | yes | yes | no |
| [16] (2018) | UAV communicate with GN; deriving the closed-form expression of outage probability | yes | fixed | no |
| [18] (2021) | UAV communicate with GN; deriving the closed-form coverage probability at GNs. | no | yes | no |
| Our work | UAV server GNs; finding the altitude and trajectory for maximum coverage region for both clusters (high-priority GNs and low-priority GNs) | yes | yes | yes |
Table 2.
Mathematical notations used in this paper.
| Notation | Description |
|---|---|
| , | Locations of low-priority node and high-priority nodes |
| The elevation angle between horizontal plane and the line from ith ground node to UAV | |
| R | The radius of the coverage area of the UAV |
| f | Carrier frequency |
| Path loss of ith ground node | |
| Path loss threshold |
Table 3.
The values of (a, b) for different urban environments.
| Environment | (a, b) |
|---|---|
| Suburban | (4.88, 0.43) |
| Urban | (9.61, 0.16) |
| Dense urban | (12.08, 0.114) |
Publisher’s Note: MDPI stays neutral with regard to jurisdictional claims in published maps and institutional affiliations. |
© 2022 by the authors. Licensee MDPI, Basel, Switzerland. This article is an open access article distributed under the terms and conditions of the Creative Commons Attribution (CC BY) license (https://creativecommons.org/licenses/by/4.0/).
Share and Cite
MDPI and ACS Style
Moon, I.; Dung, L.T.; Kim, T. Optimal 3D Placement of UAV-BS for Maximum Coverage Subject to User Priorities and Distributions. Electronics 2022, 11, 1036. https://doi.org/10.3390/electronics11071036
AMA Style
Moon I, Dung LT, Kim T. Optimal 3D Placement of UAV-BS for Maximum Coverage Subject to User Priorities and Distributions. Electronics. 2022; 11(7):1036. https://doi.org/10.3390/electronics11071036
Chicago/Turabian StyleMoon, Inseok, Le The Dung, and Taejoon Kim. 2022. "Optimal 3D Placement of UAV-BS for Maximum Coverage Subject to User Priorities and Distributions" Electronics 11, no. 7: 1036. https://doi.org/10.3390/electronics11071036
Note that from the first issue of 2016, this journal uses article numbers instead of page numbers. See further details here.