

Deep Feature Extraction for Detection of COVID-19 Using Deep Learning
by
 ,
,
Arisa Rafiq
1,
Muhammad Imran
1,*,
Mousa Alhajlah
2,
Awais Mahmood
2,
Tehmina Karamat
3,
Muhammad Haneef
4 and
Ashwaq Alhajlah
5 1
Department of Computer Science, Shaheed Zulfikar Ali Bhutto Institute of Information Technology, Islamabad 44000, Pakistan
2
Computer Science and Information Systems Department, Applied Computer Science College, King Saud University, Riyadh 12571, Saudi Arabia
3
Department of Software Engineering, Foundation University Islamabad, Islamabad 44000, Pakistan
4
Department of Electrical Engineering, Foundation University Islamabad, Islamabad 44000, Pakistan
5
Saudi Authority for Data and Artificial Intelligence, Riyadh 12571, Saudi Arabia
*
Author to whom correspondence should be addressed.
Electronics 2022, 11(23), 4053; https://doi.org/10.3390/electronics11234053
Submission received: 12 September 2022
/
Revised: 7 November 2022
/
Accepted: 17 November 2022
/
Published: 6 December 2022
(This article belongs to the Special Issue Artificial Intelligence Solutions and Applications for COVID-19 Pandemic)
Abstract
:SARS-CoV-2, a severe acute respiratory syndrome that is related to COVID-19, is a novel type of influenza virus that has infected the entire international community. It has created severe health and safety concerns all over the globe. Identifying the outbreak in the initial phase may aid successful recovery. The rapid and exact identification of COVID-19 limits the risk of spreading this fatal disease. Patients with COVID-19 have distinctive radiographic characteristics on chest X-rays and CT scans. CXR images can be used for people with COVID-19 to diagnose their disease early. This research was focused on the deep feature extraction, accurate detection, and prediction of COVID-19 from X-ray images. The proposed concatenated CNN model is based on deep learning models (Xception and ResNet101) for CXR images. For the extraction of features, CNN models (Xception and ResNet101) were utilized, and then these features were combined using a concatenated model technique. In the proposed scheme, the particle swarm optimization method is applied to the concatenated features that provide optimal features from an overall feature vector. The selection of these optimal features helps to decrease the classification period. To evaluate the performance of the proposed approach, experiments were conducted with CXR images. Datasets of CXR images were collected from three different sources. The results demonstrated the efficiency of the proposed scheme for detecting COVID-19 with average accuracies of 99.77%, 99.72%, and 99.73% for datasets 1, 2 and 3, respectively. Moreover, the proposed model also achieved average COVID-19 sensitivities of 96.6%, 97.18%, and 98.88% for datasets 1, 2, and 3, respectively. The maximum overall accuracy of all classes—normal, pneumonia, and COVID-19—was about 98.02%.
1. Introduction
Viruses are the smallest of all microbes. A virus is a microbe smaller than a bacterium that cannot grow or replicate without the help of a live cell. A virus infects living cells and exploits their chemical mechanisms to reproduce and maintain its own life. It has the potential to replicate with fidelity or with faults (mutations); this ability is what allows certain viruses to somewhat vary in each infected individual, making cures difficult.
COVID-19 is a pneumatic infection that is catalyzed by severe acute respiratory syndrome (SARS). The WHO (World Health Organization) officially declared the infection a “pandemic”. After a typical bacterial respiratory contamination and a hatching period of 214 days, the effects of the disease occur [1]. The main symptoms of the virus are a rough cough, shortness or difficulty in breathing, and high fever. The main breathing issue is the sign of the last stage of infection, at which point the patient needs immediate treatment. No proper COVID-19 treatment is currently available in hospitals. An isolation ward in the emergency unit of a hospital can be used for an infected person, though spreading might be possible before indications emerge. The estimated life of the virus on surfaces is nearly 72 h. To diagnose and identify COVID-19, radiological photographs of human lungs can be studied [2].
1.1. COVID-19 Study and Stats
As of 14 October 2020, the total number of people worldwide contaminated with COVID-19 was 38.2 M, and the numbers of reported infections and deaths are 26.5 M and 1.09 M, respectively. When we compare the COVID-19 disaster in Pakistan with that of other countries, such as the European Union, the United States, Iran, and China, plenty of issues emerge [3]. There are countless problems in treating this epidemic, such as international relations, neediness, low proficiency rate, natural norms, clean conditions, and food utilization designs. In all these areas, horrible conditions exist, yet the spread of COVID-19 in Pakistan has been slower than in other locales.
Due to Pakistan’s dry season, warm climate, and early reaction to COVID-19, most of the population remained safe. The weather in Pakistan is not consistent across all provinces and territories, and knowing how COVID-19 spreads in natural environments in relation to climatic factors can aid disease-control decision making. Most cases have been registered in Iran, the United States, the United Kingdom, China, France, Spain, Germany, and Italy. In Pakistan, the number of confirmed cases was reported to be 1.24 M, and the death and recovery figures were reported to be 27,566 and 1.16 M, respectively [3].
Figure 1 shows the country wise COVID-19 cases. Various researchers have focused on the early identification and tracking of COVID-19. One of the most specific procedures used for identification worldwide is chest radiography (X-ray). A chest X-ray is an instant, suitable, and frequently used clinical process [1,4,5]. CXR images expose a patient to less radiation than MRI (magnetic resonance imaging) and CT (computed tomography). However, it takes expert skills and experience to perform a correct diagnosis from CXR images. The prediction methodology uses for an examination of COVID-19 utilizing CXR images [6].
The measure of radiation consumed by the patient is higher in X-ray as compared to CT treatments [7]. As a result, the use of a deep machine learning model using X-ray imaging is encouraged, as it is substantially more accessible with a smaller radiation fraction compared to CT. The COVID-19-positive cases can be moved to new places for approval by the model, joined via care without interference [8].
The potential for data assessment, particularly in clinical investigations, was limited by the proportion of work needed. In this situation, AI strategies can reduce the required time for conventional examinations and can help clinicians. For example, clinical imaging shows that chest-handled CT scans can be used to recognize COVID-19 injuries [7,9]. Nevertheless, in such examinations, pre-arranged radiologists are required, who could be working on the forefront in one way or another. ML may ease up this examination, i.e., late coordinated classifiers applied over a vast dataset of 400,000 chest X-rays, which achieves 94% assurance of 14 indisputable lung pathologies [10].
1.2. Epidemic Analysis by Artificial Intelligence (ML and DL)
The branch of artificial intelligence that involves many data processing layers is usually known as deep learning. Processing is carried across multiple layers in this method, where each convolution layer uses the previous one’s output to generate its output. The analysis of biomedical and well-being topics allows medical specialists and scientists to determine the higher specification for clinical populations to represent [11]. The significant advance in dealing with this pandemic because of high infection is the identification of COVID-19 at the beginning phase and objectivity of the infected individuals from others. In contagion analysis and modeling, machine learning algorithms play a significant role. Additionally, machine learning strategies help to uncover the mechanisms of the outbreak. As an outcome, it may be possible to plan an urgent response to avoid the transmission of the virus. Machine learning models are used to identify coordinated action by using actual statistics and the prediction of the spread of COVID-19 across civilizations [12]. Because of the DNN’s high complexity, which includes many undefined boundaries, DL techniques often require a large number of training samples. Nonetheless, previous research approves that poor imaging for training has pushed researchers to deal with tiny datasets of images and use data augmentation approaches wherever possible [13]. The examination does not talk about the constraints of the approaches utilized for the automatic classification of COVID-19 [14].
The rest of the paper is structured as follows: Section 2 provides a detailed discussion of existing techniques for the prediction of COVID-19. Section 3 comprises a proposed framework using CNN model. Section 4 discusses the results and comparison with other techniques. The conclusion and future work is given in Section 5.
2. Related Work
2.1. Literature Review
In this chapter, we provide a literature review of the data, procedures, and technology related to the detection of COVID-19 using deep learning and machine learning. The purpose of this literature review is to gain an understanding of the existing research and analysis relevant to an area of study. This helps to build strong background knowledge of the field. This literature review also helps to find the research gaps. A literature review of the existing technology is presented in this section.
2.1.1. Machine Learning Techniques
Khuzani et al. [15] proposed a method used to identify and detect COVID-19 by using CXR images with the use of a machine learning approach. This research work designed a novel-based machine learning method using global image features to identify COVID-19 without lesion segmentation in the testing cases. To collect the feature from the X-ray image, we used the dimensionality reduction method. The model achieved 90% precision.
A machine vision method for recognizing COVID-19 from CXR images was proposed by Rasheed et al. [16], who investigated the possibility of machine learning algorithms for diagnosing coronavirus from X-ray pictures with high accuracy. LR (logistic regression) and CNN (convolutional neural network) were chosen as the two most often used classifiers. Researchers investigated the impact of PCA on a proposed DL-based CNN model and LR network for COVID-19 identification in CXR images. By using CNN and PCA, the proposed approach attained an accurate result.
Rouf et al. [17] used various machine learning algorithms such as logistic regression, AdaBoost, decision tree, and multinomial naive Bayes algorithms for the detection of COVID-19 based on clinical text data. They used different techniques, such as TF/IDF, function engineering, and report duration. Earlier various machine learning algorithms such as multinomial NB, SVM, strategic relapse, ADA boost, and stochastic slope boosting were tested on clinical data. The results have a precision of 94%, accuracy of 96.2%, recall of 96%, and 95% f1 score.
Zhang et al. [18] proposed a real-time algorithm for emotion assessment on Twitter moving content for posts regarding the coronavirus epidemic. The proposed methodology aims to select the best appropriate ML methods for COVID-19 sentiment analysis prediction and use them in real time. They divided the scheme into two sections: offline sentiment analysis and online prognostication pipeline simulation. The COVID-19 features were extracted using two different extraction procedures of textual predictive analytics, n-gram and TF-ID. Then, to choose the optimal platform for the online forecasting component, five standard ML techniques were used and compared: logistic regression, decision tree, k-nearest neighbors, SVM, and random forest. According to the empirical observations, the highest accuracy was attained by the RF technique employing the unigram feature extraction technique.
An intelligent device for identifying and detecting CXR images was developed by Gomes et al. [19]. To refine the COVID-19 diagnosis, they used the IKONOS desktop application platform. The Haralick and Zernike moments were used for the extraction of features and then used these features into machine learning classifiers such as SVM, naïve Bayes, multilayer perceptron, and DT. The SVM classifier outperformed other classifiers.
Ardabili et al. [20] utilized deep learning and machine learning to analyze the performance of identifying COVID-19. These researchers applied the evolutionary algorithm for optimization. They applied a gray wolf optimizer and particle swarm optimization. This study used these two ML techniques to forecast the epidemic—multi-layered perceptron (MLP) and the adaptive network-based fuzzy inference system (ANFIS). The GWO (gray wolf optimizer) provided the highest accuracy.
Afshar et al. [21] offered a capsule network system to detect the COVID-19 cases from chest X-ray images. The proposed structure contains a lost component, patient, and convolutional layers for the issue of class imbalance. Initially, the Capsule Network works on a dataset of advanced numbers restricted in size and of high contrast compared with CXR images. The proposed model achieved the most noteworthy accuracy of 98.3% for pre-prepared COVID-19. They likewise conducted the same experiment without a pre-prepared COVID-19 cover model and achieved a precision of 95.7%.
2.1.2. Deep Learning Techniques
Menaka et al. [22] highlighted a two-network system—(1) channel-shuffled dual-branched CNN architecture and (2) augmented learning paradigm with distinctive moderators—to automatically identify COVID-19 on medical CXR images. Five standard CNN backbone architectures were used to evaluate the efficiency of the DFL module: SqueezeNet, DenseNet161, VGG16, ResNeXt32, and ResNet50. The CNN model showed a strong performance on all metrics.
Idri et al. [23] developed a method to address the classification problem of pneumonia radiographs, using the deep CNN models Inception V3 or Inception, VGG16, DenseNet201, ResNet V2, Resnet50, VGG19, MobileNet, and Xception. The maximum accuracy achieved by ResNet50 was 96.61%.
Singh et al. [24] suggested a deep transfer learning system for the identification of COVID19. For this detection, the different ML classifiers SVM, random forest (RF), and others and a combination of CNN models such as ResNet50, VGGNet, GoogleNet, and a few others were used in this paper. A less sensitive RT-PCR performed well in the proposed model.
Ghosh et al. [25] suggested a CNN model for the recognition of COVID-19-positive patients using the CXR images DenseNet 201, Restnet50V2, and InceptionV3 pre-trained models run on input images. A classification accuracy of 95.7 percent was attained by the proposed model.
Sekeroglu et al. [26] proposed a DL model to achieve high precision in detecting COVID-19 using CXR images. In their study, the authors used the freely available pre-trained models such as InceptionV3 or VGG19, ResNet50, VGG16, MobileNet-V2, and DenseNet 121. In contrast, ConvNet was used to carry out the training phase, which included pre-trained transfer learning. VGG19 and MobileNet-V2 outperformed other pre-trained ConvNets.
Ismael et al. [19] used deep learning approaches (CNN model) and a deep feature extraction method used for the analysis and identification of COVID-19. The pre-trained CNN networks (VGG19, VGG16, ResNet101, ResNet18, and ResNet50) were used for feature extraction and function extraction with the support vector machine classifier. The maximum precision achieved by ResNet50 plus SVM was 95.7%.
A deep feature extraction framework for the automatic identification and classification of COVID-19 was proposed by Ralph et al. [27]. The primary aim of this scheme is to limit the generalizability error while achieving a more confirmed treatment. The author used different models such as InceptionV3, MobileNet, ResNet50, DenseNet, and many other models to obtain accurate features. The experimental findings on the accessible chest radiographs and CT dataset show that the attributes gathered by the DesnseNet121 architecture and trained by a Bagging tree classifier can reach a precision value of 99% prediction in classification.
Thunder et al. [28] suggested a system that uses a deep CNN model to identify COVID-19 with the help of CXR images. The framework employed several state-of-the-art CNN models, including InceptionV3, Resnet50V2, and DenseNet201. The weighted average assembling technique was utilized to combine models that were trained individually to make independent predictions. In this study, the proposed model attained the highest accuracy of 91.62%.
3. Proposed Framework
Deep neural networks have recently emerged as quality tools to solve a range of computer vision problems. They are used in a variety of different fields such as medicine, agriculture, robotics, and industries. CNN is a deep neural network that is basically used for image analysis. Pooling and convolution are the essential operations in the CNN model. Multiple filters are required to extract the features from the dataset.
The key goal of using deep neural networks is to identify infection in CXR images so that CXR images can be classified as pneumonia or COVID-19. VGG16, ResNet, DenseNet, Inception, Xception, GoogleNet, and MobileNet are some of the most compelling and most utilized deep CNN model networks. The proposed framework used two CNN models—ResNet101 and Xception—for feature extraction. After feature extraction, these features were combined into a single feature vector.
The proposed model can detect COVID-19 from chest X-ray images. This technique converts CXR images from RGB to grayscale form and extracts the region of interest (ROI). The system considered two CNN models, ResNet101 and Xception, for feature extraction. ResNet101 and Xception were used to extract a feature vector parallel from the same CXR image. Furthermore, both features were concatenated into a single feature vector. An optimized number of features were selected based on different criteria to reduce the data dimensions. Finally, an optimum feature vector was used as an input for the classification model. Figure 2 shows the proposed framework structure.
3.1. Datasets
This study used three publicly available datasets to assess the performance of the proposed approach. The first dataset contains CXR COVID-19 images, normal images, and pneumonia images, and the second dataset contains chest X-rays of the same classes. Two datasets were taken from Kaggle.com and the third dataset was collected from GitHub. A patient-wise breakup of these datasets is presented in Table 1.
3.2. Image Pre-Processing
Image preprocessing is crucial for extracting important information from images. The goal of pre-processing is to improve image information by suppressing unwanted distortions and enhancing specific visual properties that are important for further processing and analysis. In the proposed framework, the image is transformed from RGB to grayscale and resized into 300 × 300 pixels in the first step.
3.3. Region of Interest (ROI)
A region of interest (ROI) is a collection of samples within a dataset that have been designated for a specific purpose. The term ROI is widely employed in a variety of fields, including medical imaging pre-processing, where the borders of a lung region delineated on an image or in a volume are used to calculate its size. Based on the region of interest (ROI), the maximum value, the average, and the width of a peak, as well as the surface under the curve can be calculated.
The ROI was extracted from the CXR image to extract the desired information from the image. The ROI area is outlined by a locality primarily covering the lung region to obtain vital information. The ROI area is marked by a rectangle and with the help of logical indexing, the inside area of the region is extracted. Table 2 shows the different pre-processing stages. For example, the unwanted marks in the normal and COVID-19 groups were removed in the first stage (ROI). The CXR images utilized in this examination were gathered from three different sources, which may differ in feature or dimensions. To address this issue, all the images were resized to 300 × 300 before applying any operation on the images. The following Table 2 shows the comparison of original and COVID-19 images.
3.4. Feature Extraction
After image pre-processing, the next phase is feature extraction in the proposed framework. As stated earlier, features are extracted by ResNet101 and Xception models. Both are pre-trained CNN models. Both models generate the exact size of a feature map of 10 × 10 × 2048 in its last convolution layer. As the size of the feature vector is the same, it is easy to concatenate the feature vectors extracted by both networks into a single feature vector. This is presented in subsequent sections.
3.4.1. Xception
Xception is an inception architecture enhancement that substitutes ordinary Inception modules with depth-wise separable convolutions. The new inception layers were introduced by Xception, a deep convolutional neural network. Depth-wise convolution layers are used to create these inception layers. The Xception architecture’s feature extraction core consists of 36 convolutional layers. Aside from the first and last modules, the 36 convolutional layers were divided into 14 modules, each of which is surrounded by linear residual connections. The activation function for obtaining the output of convolution layers used a nonlinear ReLU. The convolution component, on the other hand, was divided into five sequential max-pooling layers.
Two convolution layers were utilized to foster the first two sub-regions, where the depths of the layers were 64 and 128. Moreover, to allow the addition used for the residual unit, the 1x1 convolution was used. After each entirely related layer, L2 regularization was utilized to reduce fitting problems during the implementation of the fine-tuned framework. The Xception model generates 2048 features. The architecture of the Xception network is shown in Figure 3.
3.4.2. ResNet-101
A convolutional neural network that has 101 deep layers is ResNet101. ResNet101 is a profound convolutional neural network that performed better in ImageNet datasets. In ResNet101, an adjustment was made in the spread detailing the associations between blocks. We considered the input size as 300 × 300. ResNet101 design performs the underlying convolution and max-pooling utilizing 7 × 7 and 3 × 3 kernel sizes individually. It contains three Residual blocks, each with three layers. In each of the three levels of the square, the kernel utilized to execute convolution activity is 64 or 128 bits in size. The input size will be decreased to half as compared to height and width; however, the width of the channel will be doubled.
Three layers are placed one on top of the other for each residual function. Convolutions are used in the 1 × 1 and 3 × 3 layers. The 1 × 1 convolution layers are responsible for lessening and then restoring the dimensions. With smaller input/output dimensions, the 3 × 3 layer is left as a bottleneck. Finally, the company has an average pooling layer, which is followed by a fully associated layer with 2048 characteristics. The architecture of ResNet101 is shown in Figure 4.
3.4.3. Concatenated Neural Network
The concatenated feature vector was generated by concatenating the features of Xception and Resnet101. The input (images), Xception, and ResNet101 generate a feature map of 2048 features in the last feature layer. Both models generate the exact size of the feature map; this is why it is easy to combine their feature vectors into a single feature vector. The CNN-based concatenated models provide 4096 appropriate features. The mathematical equation of the concatenated feature model is shown in Equations (1)–(3). Equations (1) and (2) exhibit the feature vectors of Xception and ResNet101, respectively. Equation (3) shows the mathematical representation of the concatenated feature vector.
fRESNET101 1Xn = {RESNET1011X1…RESNET1011Xn}
fXception 1Xn = {Xception1X1… Xception1Xm}
F(Concatenated) = {Concatenated1X1…Concatenated1Xn}
The use of residual and Xception-based layers to concatenate these feature maps helps to increase the quality of the semantic feature. The basic block diagram of the concatenated model is shown in Figure 5.
3.5. Feature Selection
The term feature selection deals with the selection of a subset of features, among the entire features from the feature vector. The feature selection enables the framework to train faster, and it also reduces the complexity. The best subset has the fewest possible dimensions that might improve accuracy. Two approaches, entropy and PSO-based feature selection, were utilized for the feature selection process. The optimization process is carried out by the PSO.
3.5.1. Entropy-Based Feature Selection
Entropy is an estimation of the level of uncertainty. While observing the outcome of a random test, an assessment of the data is possibly found. This idea has been utilized in numerous areas, including data number theory, cryptography, statistics, and artificial intelligence of these applications. Shannon’s entropy is a significant portion of evaluating structures and patterns in the data. The lower the entropy, the more similarity is in the data.
The high space in the two-dimensional feature vector will impact the calculation and storage capacity when extracting features from X-ray images. Many researchers have addressed the issues of high-dimensional feature spaces and the selection of features. A few techniques calculate a score for every feature and a higher value of feature is selected during featuring extraction. We used the probability function to calculate the feature score in entropy estimation.
Assuming that the scores are depicted with a feature vector {Z1, Z2, Z3… Zn}, Zj is the j-th value of the feature vector. In our proposed feature selection, the probability of feature fj is described below:
The feature fj round r is issued in a retrieval round, and the entropy of feature fj can then be calculated by:
where is the observed probability value of in and belongs to the domain of fj. From the proposed concatenated feature, the max entropy-based feature selection technique selects comparable or unusually related features. Unnecessary features were removed, and beneficial features were used to classify the data.
3.5.2. PSO-Based Feature Selection
The stochastic optimization based on the population technique is also known as PSO (particle swarm optimization), in which every single applicant arrangement is known as the particles. A particle is represented by a feature vector already extracted. It begins with a collection of random particles (solutions) and then updates generations to find the ideal optimal solution. In each iteration, every particle is updated, resulting in two “best” values. The fitness value is the first value; this value is P-best. The next “best” value that is followed by the PSO is the best value, which is called a global-best and known as g-best, achieved by any particle in the population. When a particle enters the population as its topological neighbors, the best value is a local best and is called l-best. At first, the velocities are set to zero and their position is randomly put down inside the boundaries of the search space. Then, the velocity of the particles utilizing equations 6 and 7 were calculated.
vl[] = vl[] + r1 × rand() × (p-best[] − p[]) + r2 × rand() × (g-best[] − p[])
p[] = p[] + vl[]
In Equation (6), vl[] is the speed of the particle, and p[] is the present particle. P-best[] and g-best[] are characterized, as previously mentioned. The random number rand() value is between 0 and 1. r1 and r2 are learning factors. Here, the particles were updated in every cycle with their position and speed to ensure the optimal result. The resulting features were given into the classifiers to detect COVID-19 images.
Figure 6 shows the feature selection using PSO. First of all, we initialized the PSO parameters and selected the features of particles. The fitness value was first evaluated and then the p-best and g-best were updated. By updating these values, we determined the movements and particle rate of change.
![Electronics 11 04053 g006]() Xi is the particle position and Vi is the velocity position. T represents the iterations and w is the inertia weight. We used 10 particles with 100 iterations and two random values (0,1).
Xi is the particle position and Vi is the velocity position. T represents the iterations and w is the inertia weight. We used 10 particles with 100 iterations and two random values (0,1).
Figure 6.
Feature selection by using PSO.

Xid(t+1) = Xid(t) + Vid(t+1)Xid(t+1) = Xid(t)+Vid(t+1)
Vid(t+1) = w*Vid(t) + c1*r1i*(pbest−Xid(t)) + c2*r2i*(gbest−Xid(t))
4. Experimental Details and Results
4.1. Experimental Setup
The experiments were implemented in a system with the following specifications using Python 3 with Jupyter Notebook, Intel(R) CPU 2.10 GHz Processor, Ubuntu Server 16.04.3 LTS 64-bit operating system, 16 GB RAM, 2 GB NVIDIA graphic card and 20 GB SCSI.
4.2. Performance Parameter
In the evaluation parameter, true positive (TP) is the quantity of correctly classified images, false positive (FP) is the quantity of the unacceptable classified images, false negative (FN) is the number of images that are recognized as another class, and true negative (TN) is the number of pictures that do not have a place with a class and were not given a place in that class.
4.3. Training Parameters
For the network training, 100 epochs with a learning rate of 10−4 in each training phase were used. The loss function (categorical cross-entropy) and Adam optimizer with a batch size of 20 were utilized in network training. The data augmentation was applied in the network to increase the training performance, which avoided overfitting in the trained network. The values of the hyperparameters used in the training phase are listed below in Table 3.
4.4. Proposed Model Performance
The PSO is a stochastic optimization technique based on a swarm, which provides the optimal features based on the best value. The objective of PSO is to retrieve the quality features from the feature vector and also reduce the classification time. PSO was used to minimize the classification time by selecting the quality features through an evolutionary process. The assessment was applied to all three datasets and their performance results are displayed in Table 4, Table 5, Table 6, Table 7, Table 8, Table 9, Table 10 and Table 11. All performance metrics explained earlier were used to evaluate the performance in the experiment.
Table 4 present the results of detected and not-detected outcomes in all three classes. Table 5 showed the impact of performance parameter results of all three datasets. In dataset 1, a total of 98 out of 91 correctly detected COVID-19 and achieved 99.88% accuracy. In dataset 2, 70 out of 71 correctly detected COVID-19 and performed with 99.83% accuracy, and in dataset 3, a total of 197 out of 198 correctly detected COVID-19 and achieved 99.83% accuracy. This clearly shows that using a PSO-based minimum number of features as compared to the entropy-based model, so it also reduces the classification time. The proposed model with PSO-based feature selection was utilized for further validation and comparisons.

Table 4.
PSO results of all datasets.
| Dataset 2 | Dataset 1 | Dataset 2 | Dataset 3 |
|---|---|---|---|
| Correct COVID-19 | 68 | 68 | 69 |
| Not detected COVID-19 | 3 | 3 | 2 |
| Correct pneumonia | 2119 | 2096 | 2146 |
| Not detected pneumonia | 91 | 114 | 64 |
| Correct normal | 1920 | 1902 | 1923 |
| Not detected | 80 | 98 | 77 |
Table 5.
Performance matrix results of all datasets.
| Datasets | Accuracy | Precision | Recall | F1-Score |
|---|---|---|---|---|
| Dataset 1 | 99.88% | 96.07% | 98% | 97.02% |
| Dataset 2 | 99.83% | 92.10% | 98.59% | 95.23% |
| Dataset 3 | 99.83% | 97.04% | 99.49% | 98.24% |
5. Discussion and Comparison
5.1. System Validation
Additionally, the k-fold techniques were utilized to validate the frameworks and to evaluate the execution of a framework to make estimates on data not used during the preparation of the framework. A k-fold cross strategy was used to further assure the accuracy of the test outcomes.
After feature extraction, the CNN classifier was built up using 5-fold cross-validation, with the feature vector randomly split into 5 sub-folds. For the planning dataset, 4 sub-folds were chosen; however, for the testing dataset, just 1 sub-fold was chosen. Table 6, Table 7, Table 8, Table 9, Table 10 and Table 11 show the CNN classification results using individual, additionally connected component extraction strategies. The singular element extraction methodologies gave less accurate precision and appeared differently concerning the proposed combination vector.
Table 6.
COVID accuracy of dataset 1.
| Dataset 1 | COVID Accuracy | COVID Precision | COVID Recall | COVID F1-Score |
|---|---|---|---|---|
| Fold 1 | 93.97% | 95.35% | 93.65% | 94.49% |
| Fold 2 | 96.04% | 96.88% | 95.93% | 96.40% |
| Fold 3 | 97.71% | 98.33% | 97.50% | 97.91% |
| Fold 4 | 95.71% | 96.76% | 95.44% | 96.09% |
| Fold 5 | 97.05% | 97.70% | 96.94% | 97.31% |
| Average | 96.10% | 97.01% | 95.89% | 96.44% |
Table 7.
COVID accuracy of dataset 2.
| Dataset 2 | COVID Accuracy | COVID Precision | COVID Recall | COVID F1-Score |
|---|---|---|---|---|
| Fold 1 | 96.07% | 95.61% | 96% | 95.80% |
| Fold 2 | 95.07% | 94.39% | 95.1% | 94.73% |
| Fold 3 | 96.77% | 96.92% | 96.15% | 96.52% |
| Fold 4 | 96.37% | 95.19% | 97.15% | 96.15% |
| Fold 5 | 97.22% | 96.08% | 98.05% | 97.05% |
| Average | 96.30% | 95.63% | 96.49% | 96.05% |
Table 8.
COVID accuracy of dataset 3.
| Dataset 3 | COVID Accuracy | COVID Precision | COVID Recall | COVID F1-Score |
|---|---|---|---|---|
| Fold 1 | 98.32% | 97.52% | 99.09% | 98.29% |
| Fold 2 | 99.41% | 99.29% | 99.52% | 99.40% |
| Fold 3 | 99.46% | 99.52% | 99.47% | 99.49% |
| Fold 4 | 99.09% | 99.00% | 99.14% | 99.06% |
| Fold 5 | 99.53% | 99.62% | 99.43% | 99.52% |
| Average | 99.17% | 98.98% | 99.33% | 99.15% |
Table 9.
Detailed dataset 1 results.
| Dataset 1 | Fold-1 | Fold-2 | Fold-3 | Fold-4 | Fold-5 |
|---|---|---|---|---|---|
| Correct COVID-19 | 94 | 96 | 98 | 97 | 98 |
| Not detected COVID-19 | 6 | 4 | 2 | 3 | 2 |
| Correct pneumonia | 2076 | 2120 | 2160 | 2117 | 2143 |
| Not detected pneumonia | 134 | 90 | 50 | 93 | 67 |
| Correct normal | 2670 | 2735 | 2780 | 2721 | 2764 |
| Not detected normal | 181 | 116 | 71 | 130 | 87 |
Table 10.
Detailed dataset 2 results.
| Dataset 2 | Fold-1 | Fold-2 | Fold-3 | Fold-4 | Fold-5 |
|---|---|---|---|---|---|
| Correct COVID-19 | 68 | 68 | 69 | 70 | 70 |
| Not detected COVID-19 | 3 | 3 | 2 | 1 | 1 |
| Correct pneumonia | 2119 | 2096 | 2146 | 2107 | 2128 |
| Not detected pneumonia | 91 | 114 | 64 | 103 | 82 |
| Correct normal | 1920 | 1902 | 1923 | 1943 | 1961 |
| Not detected | 80 | 98 | 77 | 57 | 39 |
Table 11.
Detailed dataset 3 results.
| Dataset 3 | Fold-1 | Fold-2 | Fold-3 | Fold-4 | Fold-5 |
|---|---|---|---|---|---|
| Correct COVID-19 | 193 | 197 | 196 | 196 | 197 |
| Not detected COVID-19 | 5 | 1 | 2 | 2 | 1 |
| Correct pneumonia | 1941 | 1981 | 1987 | 1972 | 1989 |
| Not detected pneumonia | 59 | 19 | 13 | 28 | 11 |
| Correct normal | 2091 | 2100 | 2097 | 2092 | 2098 |
| Not detected | 19 | 10 | 11 | 18 | 12 |
5.2. Confusion Matrix
Figure 7, Figure 8 and Figure 9 show the 5-fold confusion matrices for each dataset and display the TP, FN, TN, and FP. The confusion matrix is a summary of categorization prediction outcomes. The number of correct and incorrect predictions is split by class and summarized with count values. Table 9, Table 10 and Table 11 show the details of the confusion matrix results.
5.3. Comparative Analysis
For further validation, results achieved by the proposed model are compared with existing techniques and models. In the first step, the classification performance of the proposed framework on each dataset is shown in Figure 10. A performance comparison of the feature selection models is presented. In the last step, the comparative analysis of all datasets is shown with existing models.
Figure 10 shows a comparison between datasets which is used in experiments. The comparison was conducted with the help of performance metrics. It clearly shows that the performance of dataset 3 is better than the others. The accuracy values of all datasets are almost similar, but the other performance parameters have significant differences. The precision of dataset 2 is comparatively less than the different datasets because of the fewer COVID-19 images. A recall is more than 95% for all datasets, relatively higher than the existing state-of-the-art techniques. Dataset 3 contains better results in the classification phase.
5.3.1. Performance Comparison of Feature Selection
Table 12 shows the number of selected features from PSO and entropy.
Table 12 and Figure 11 show a comparison between feature selection techniques. Through the use of the entropy-based feature selection technique, an average of 615 features were extracted from the overall features. These features are further used for the classification. For the optimal feature selection, PSO was employed for the overall feature vector. With the PSO-based feature selection technique, an average of 493 features were extracted from overall features. The resulting features were fed into the classifiers to identify COVID-19 images. The proposed model with PSO-based feature selection provides the minimum number of features and provides better accuracy than other techniques.
5.3.2. Performance Comparison with Machine Learning
The results of classification were further compared with exiting machine learning techniques and models result. The proposed model shows better classification results, as shown in Figure 12.
The proposed technique provides good accuracy by using a CNN classifier. The convolution neural network provides a decent outcome as a binary classifier for the CXR images. Only [6] showed an accuracy of 89.03%, and [18] showed an accuracy of greater than 95%, which was comparatively higher than the other two classification techniques, such as those of [28] (92.21%) and [15] (90.16%).
5.3.3. Performance Comparison with Deep Learning
This section discusses the comparative analysis with existing deep learning techniques. Table 13 provides the comparative analysis with the parameters of accuracy, dataset, and techniques. Figure 13, Figure 14 and Figure 15 present the graphical representation of comparative analysis of existing state-of-the-art models dataset-wise.
The comparative analyses of the literature are presented in Table 12. It is shown that the proposed model provides a good accuracy of classification in identifying COVID-19 as compared to the other techniques. However, [15] provided a 94% accuracy of classification, but this can be achieved for the lower datasets when testing the technique’s performance. The authors of [1,18,21], provided a classification accuracy of more than 89%. The proposed framework (concatenated model) gives a higher classification accuracy of 99.77% for dataset 1, 99.72% for dataset 2, and 99.73% for dataset 3, which is comparatively better than other literature models. Figure 13, Figure 14 and Figure 15 show the comparative analysis with existing state-of-art techniques.
Figure 13 presents a comparative analysis conducted with the present technique. It shows that the proposed model exhibits better results than the model of [2]. The deep learning model (Xception and ResNet50) was used in this paper. The accuracy is comparable because [2] used fewer COVID-19 images in their dataset that only contained 31 CXR images.
Figure 14 show that the proposed model yields many more good results than the previous models [4]. They used the Gray Level Difference Method (GLDM) and Gray-Level Co-Occurrence Matrix (GLCM) models and deep learning classifiers ResNet101 and VGG19; the accuracy of these is better than the existing model. Precision is comparatively lower than the existing model because it utilizes a higher number of images in the other two classes, but recall is relatively higher.
Figure 15 presents a comparative analysis with the existing technology that shows that the proposed model yields better results than the model of [16]. Logistic regression (LR) and convolutional neural networks (CNNs) were utilized in this paper. The accuracy is slightly better than the existing model and the precision and recall are also comparatively higher than the existing model.
6. Conclusions
This study presented the CNN-based concatenated (Xception and ResNet101) model for chest X-ray classification by using three publicly available datasets. All datasets contain CXR images of pneumonia, COVID-19, and normal persons. The first two datasets were taken from Kaggle and the third dataset was collected from GitHub. For feature extraction, the CNN models Xception and ResNet101 were used and afterwards these features were combined by a concatenated model. The PSO-based feature selection technique was applied to the concatenated features. The PSO-based technique provides optimal features from the overall feature vector. It also helps to reduce computational time. The CNN-based classification was performed on the final features. Besides this, the proposed model presents recall, precision, accuracy, and F1 measurements much higher than the existing models.
The first dataset contained 430 images of COVID-19 and 5628 images of pneumonia and 4117 images of normal people. The second dataset contains 336 images of COVID-19, 6085 images of pneumonia, and 3341 images of normal people, and the last dataset contains 660 images of COVID-19, 4292 images of pneumonia, and 3110 images of normal people. The proposed model achieved a average accuracy for COVID-19 of 99.77% using dataset 1, 99.72% for dataset 2, and 99.73% for dataset 3. The model can also achieve an average recall for COVID-19 of 96.6% and 97.18% for dataset 2, and 98.88% for dataset 3. Additionally, 5-fold cross-validations ensure better accuracy. The overall higher accuracy of all classes (normal, pneumonia, and COVID-19) is 98.02%.
Author Contributions
Conceptualization, A.R., M.I. and M.A.; data curation, A.M.; formal analysis, A.R., M.I., A.M., T.K. and A.A.; funding acquisition, M.A. and A.M.; investigation, A.R., M.I., M.A., A.M., T.K., M.H. and A.A.; methodology, A.R., M.I., M.A., T.K. and M.H.; project administration, M.A.; resources, M.A. and A.A.; software, M.H.; supervision, M.I.; validation, A.R., T.K. and M.H.; visualization, A.R., M.I., M.A., A.M., T.K., M.H. and A.A.; writing—original draft, A.R.; writing—review and editing, A.R., M.I., M.A., A.M., T.K., M.H. and A.A. All authors have read and agreed to the published version of the manuscript.
Funding
Researchers Supporting Project number (RSP2022R458), King Saud University, Riyadh, Saudi Arabia.
Acknowledgments
Researchers Supporting Project number (RSP2022R458), King Saud University, Riyadh, Saudi Arabia.
Conflicts of Interest
The authors declare no conflict of interest.
References
- Rajpal, S.; Agarwal, M.; Rajpal, A.; Lakhyani, N.; Saggar, A.; Kumar, N. COV-ELM Classifier: An Extreme Learning Machine Based Identification of COVID-19 Using Chest X-ray Images. Intell. Decis. Technol. 2022, 16, 193–203. [Google Scholar] [CrossRef]
- Prabira, K.; Santi, B.; Preesat, B. Detection of Coronavirus Disease (COVID-19) based on Deep Features. Int. J. Math. Eng. Manag. Sci. 2020, 5, 643–651. [Google Scholar]
- Mohammad-Rahimi, H.; Nadimi, M.; Ghalyanchi-Langeroudi, A.; Taheri, M.; Soudeh, G.-F. Application of Machine Learning in Diagnosis of COVID-19 Through X-Ray and CT Images. Front. Cardiovasc. Med. 2021, 8, 185. [Google Scholar] [CrossRef] [PubMed]
- Harsh, P.; Gupta, P.; Khubeb, M.; Ruben, M.-M.; Vaishnavi, S. Application of deep learning for fast detection of COVID-19 in X-Rays using nCOVnet. Chaos Solitons Fractals 2020, 138, 109944. [Google Scholar]
- Kumar, A.; Rahul, B.; Sahayasheela, V. Accurate Prediction of COVID-19 using Chest X-ray Images through Deep Feature Learning model with SMOTE and Machine Learning Classifiers. medRxiv 2020. [Google Scholar] [CrossRef] [Green Version]
- Punn, N.S.; Agarwal, S. Automated diagnosis of COVID-19 with limited poster anterior chest X-ray images using fine-tuned deep neural networks. Appl. Intell. 2021, 51, 2689–2702. [Google Scholar] [CrossRef] [PubMed]
- Albahri, S.; Zaidan, A.; Albahri, S.; Zaidan, B.; Abdulkareem, H.; Al-Qaysi, T.; Alamoodi, A.; Aleesa, M.; Chyad, M.; Kim, L. Systematic review of artificial intelligence techniques in the detection and classification of COVID-19 medical images in terms of evaluation and benchmarking: Taxonomy analysis, challenges, future solutions and methodological aspects. J. Infect. Public Health 2020, 13, 1381–1396. [Google Scholar] [CrossRef] [PubMed]
- Ogundokun, O.; Awotunde, J.B. Machine Learning Prediction for Covid 19 Pandemic in India. medRxiv 2020. [Google Scholar] [CrossRef]
- Zhao, W.; Jiang, W.; Qiu, X. Deep learning approaches for COVID-19 detection based on chest X-ray images. Sci. Rep. 2021, 11, 114054. [Google Scholar]
- Varela-Santos, S.; Melin, P. A new approach for classifying coronavirus COVID-19 based on its manifestation on chest X-rays using texture features and neural networks. Inf. Sci. 2021, 545, 403–414. [Google Scholar] [CrossRef] [PubMed]
- Das, N.; Kumar, M.; Kaur, V.; Kumar Singh, D. Automated Deep Transfer Learning-Based Approach for Detection of COVID-19 Infection in Chest X-rays. IRBM 2020, 43, 114–119. [Google Scholar]
- Rehman, A.; Sadad, T.; Saba, T.; Hussain, A.; Tariq, U. Real-time diagnosis system of COVID-19 using X-ray images and deep learning. IT Prof. 2021, 23, 57–62. [Google Scholar] [CrossRef]
- Jain, G.; Mittal, D.; Thakur, D.; Mittal, M.K. A deep learning approach to detect COVID-19 coronavirus with X-ray images. Biocybern. Biomed. Eng. 2020, 40, 1391–1405. [Google Scholar] [CrossRef]
- Das, A.K.; Ghosh, S.; Thunder, S.; Dutta, R.; Agarwal, S.; Chakrabarti, A. Automatic COVID-19 Detection from X-ray images using Ensemble Learning with Convolutional Neural Network. Pattern Anal. Appl. 2021, 24, 1–14. [Google Scholar] [CrossRef]
- Zargari Khuzani, A.; Heidari, M.; Shariati, S.A. COVID-Classifier: An automated machine learning model to assist in the diagnosis of COVID-19 infection in chest X-ray images. Sci. Rep. 2021, 11, 9887. [Google Scholar] [CrossRef] [PubMed]
- Rasheed, J.; Hameed, A.A.; Djeddi, C.; Jamil, A.; Al-Turjman, F. A machine learning-based framework for diagnosis of COVID-19 from chest X-ray images. Interdiscip. Sci. 2021, 13, 103–117. [Google Scholar] [CrossRef] [PubMed]
- Khanday, A.M.U.D.; Rabani, S.T.; Khan, Q.R.; Rouf, N.; Mohi Ud Din, M. Machine learning based approaches for detecting COVID-19 using clinical text data. Int. J. Inf. Technol. 2020, 12, 731–739. [Google Scholar] [CrossRef] [PubMed]
- Zhang, X.; Saleh, H.; Younis, E.M.; Sahal, R.; Ali, A.A. Predicting Coronavirus Pandemic in Real-Time Using Machine Learning and Big Data Streaming System. Complexity 2020, 2020, 6688912. [Google Scholar] [CrossRef]
- Gomes, J.C.; Barbosa, V.A.D.F.; Santana, M.A.; Bandeira, J.; Valença, M.J.S.; de Souza, R.E.; Ismael, A.M.; dos Santos, W.P. IKONOS: An intelligent tool to support diagnosis of COVID-19 by texture analysis of X-ray images. medRxiv 2020, 1–14. [Google Scholar] [CrossRef]
- Ardabili, S.; Mosavi, A.; Ghamisi, P.; Ferdinand, F.; Varkonyi-Koczy, R.; Reuter, U.; Rabczuk, T.; Atkinson, P. COVID-19 Outbreak Prediction with Machine Learning. Algorithms 2020, 13, 249. [Google Scholar] [CrossRef]
- Afshar, P.; Heidarian, S.; Naderkhani, F.; Oikonomou, A.; Plataniotis, K.N.; Mohammadi, A. COVID-CAPS: A capsule network-based framework for identification of COVID-19 cases from X-ray images. Pattern Recognit. Lett. 2020, 138, 638–643. [Google Scholar] [CrossRef]
- Karthik, R.; Menaka, R.; Hariharan, M. Learning distinctive filters for COVID-19 detection from chest X-ray using shuffled residual CNN. Appl. Soft Comput. 2021, 99, 106744. [Google Scholar] [CrossRef] [PubMed]
- Elaziz, M.A.; Hosny, K.M.; Salah, A.; Darwish, M.M.; Lu, S.; Sahlol, A.T. New machine learning method for image-based diagnosis of COVID-19. PLoS ONE 2020, 15, e0235187. [Google Scholar] [CrossRef] [PubMed]
- Arun, S.; Sheeba, R.; Dinesh, G. Artificial Intelligence-Based Classification of Chest X-ray Images into COVID-19 and Other Infectious Diseases. Int. J. Biomed. Imaging 2020, 2020, 8889023. [Google Scholar]
- Al-Timemy, A.H.; Khushaba, R.N.; Mosa, Z.M.; Escudero, J. An Efficient Mixture of Deep and Machine Learning Models for COVID-19 and Tuberculosis Detection Using X-ray Images in Resource Limited Settings. In Artificial Intelligence for COVID-19; Springer International Publishing: Cham, Switzerland, 2021; pp. 77–100. [Google Scholar]
- Sekeroglu, B.; Ozsahin, I. Detection of COVID-19 from Chest X-Ray Images Using Convolutional Neural Networks. SLAS Technol. Transl. Life Sci. Innov. 2020, 25, 553–565. [Google Scholar] [CrossRef]
- Kassani, S.H.; Kassasni, P.H.; Wesolowski, M.J.; Schneider, K.A.; Detersa, R. Automatic Detection of Coronavirus Disease (COVID-19) in X-ray and CT Images: A Machine Learning Based Approach. Biocybern. Biomed. Eng. 2021, 41, 867–879. [Google Scholar] [CrossRef]
- Jain, N.; Jhunthra, S.; Garg, H.; Gupta, V.; Mohan, S.; Ahmadian, A.; Salahshour, S.; Ferrara, M. Prediction modelling of COVID using machine learning methods from B-cell dataset. Results Phys. 2021, 21, 103813. [Google Scholar] [CrossRef]
Figure 1.
Worldwide corona virus case ratio.

Figure 2.
The architecture of the proposed framework.

Figure 3.
Xception architecture.

Figure 4.
ResNet101 architecture.

Figure 5.
Concatenated network architecture.

Figure 7.
Confusion matrix of dataset 1.

Figure 8.
Confusion matrix of dataset 2.

Figure 9.
Confusion matrix of dataset 3.

Figure 10.
Result comparison of all datasets.
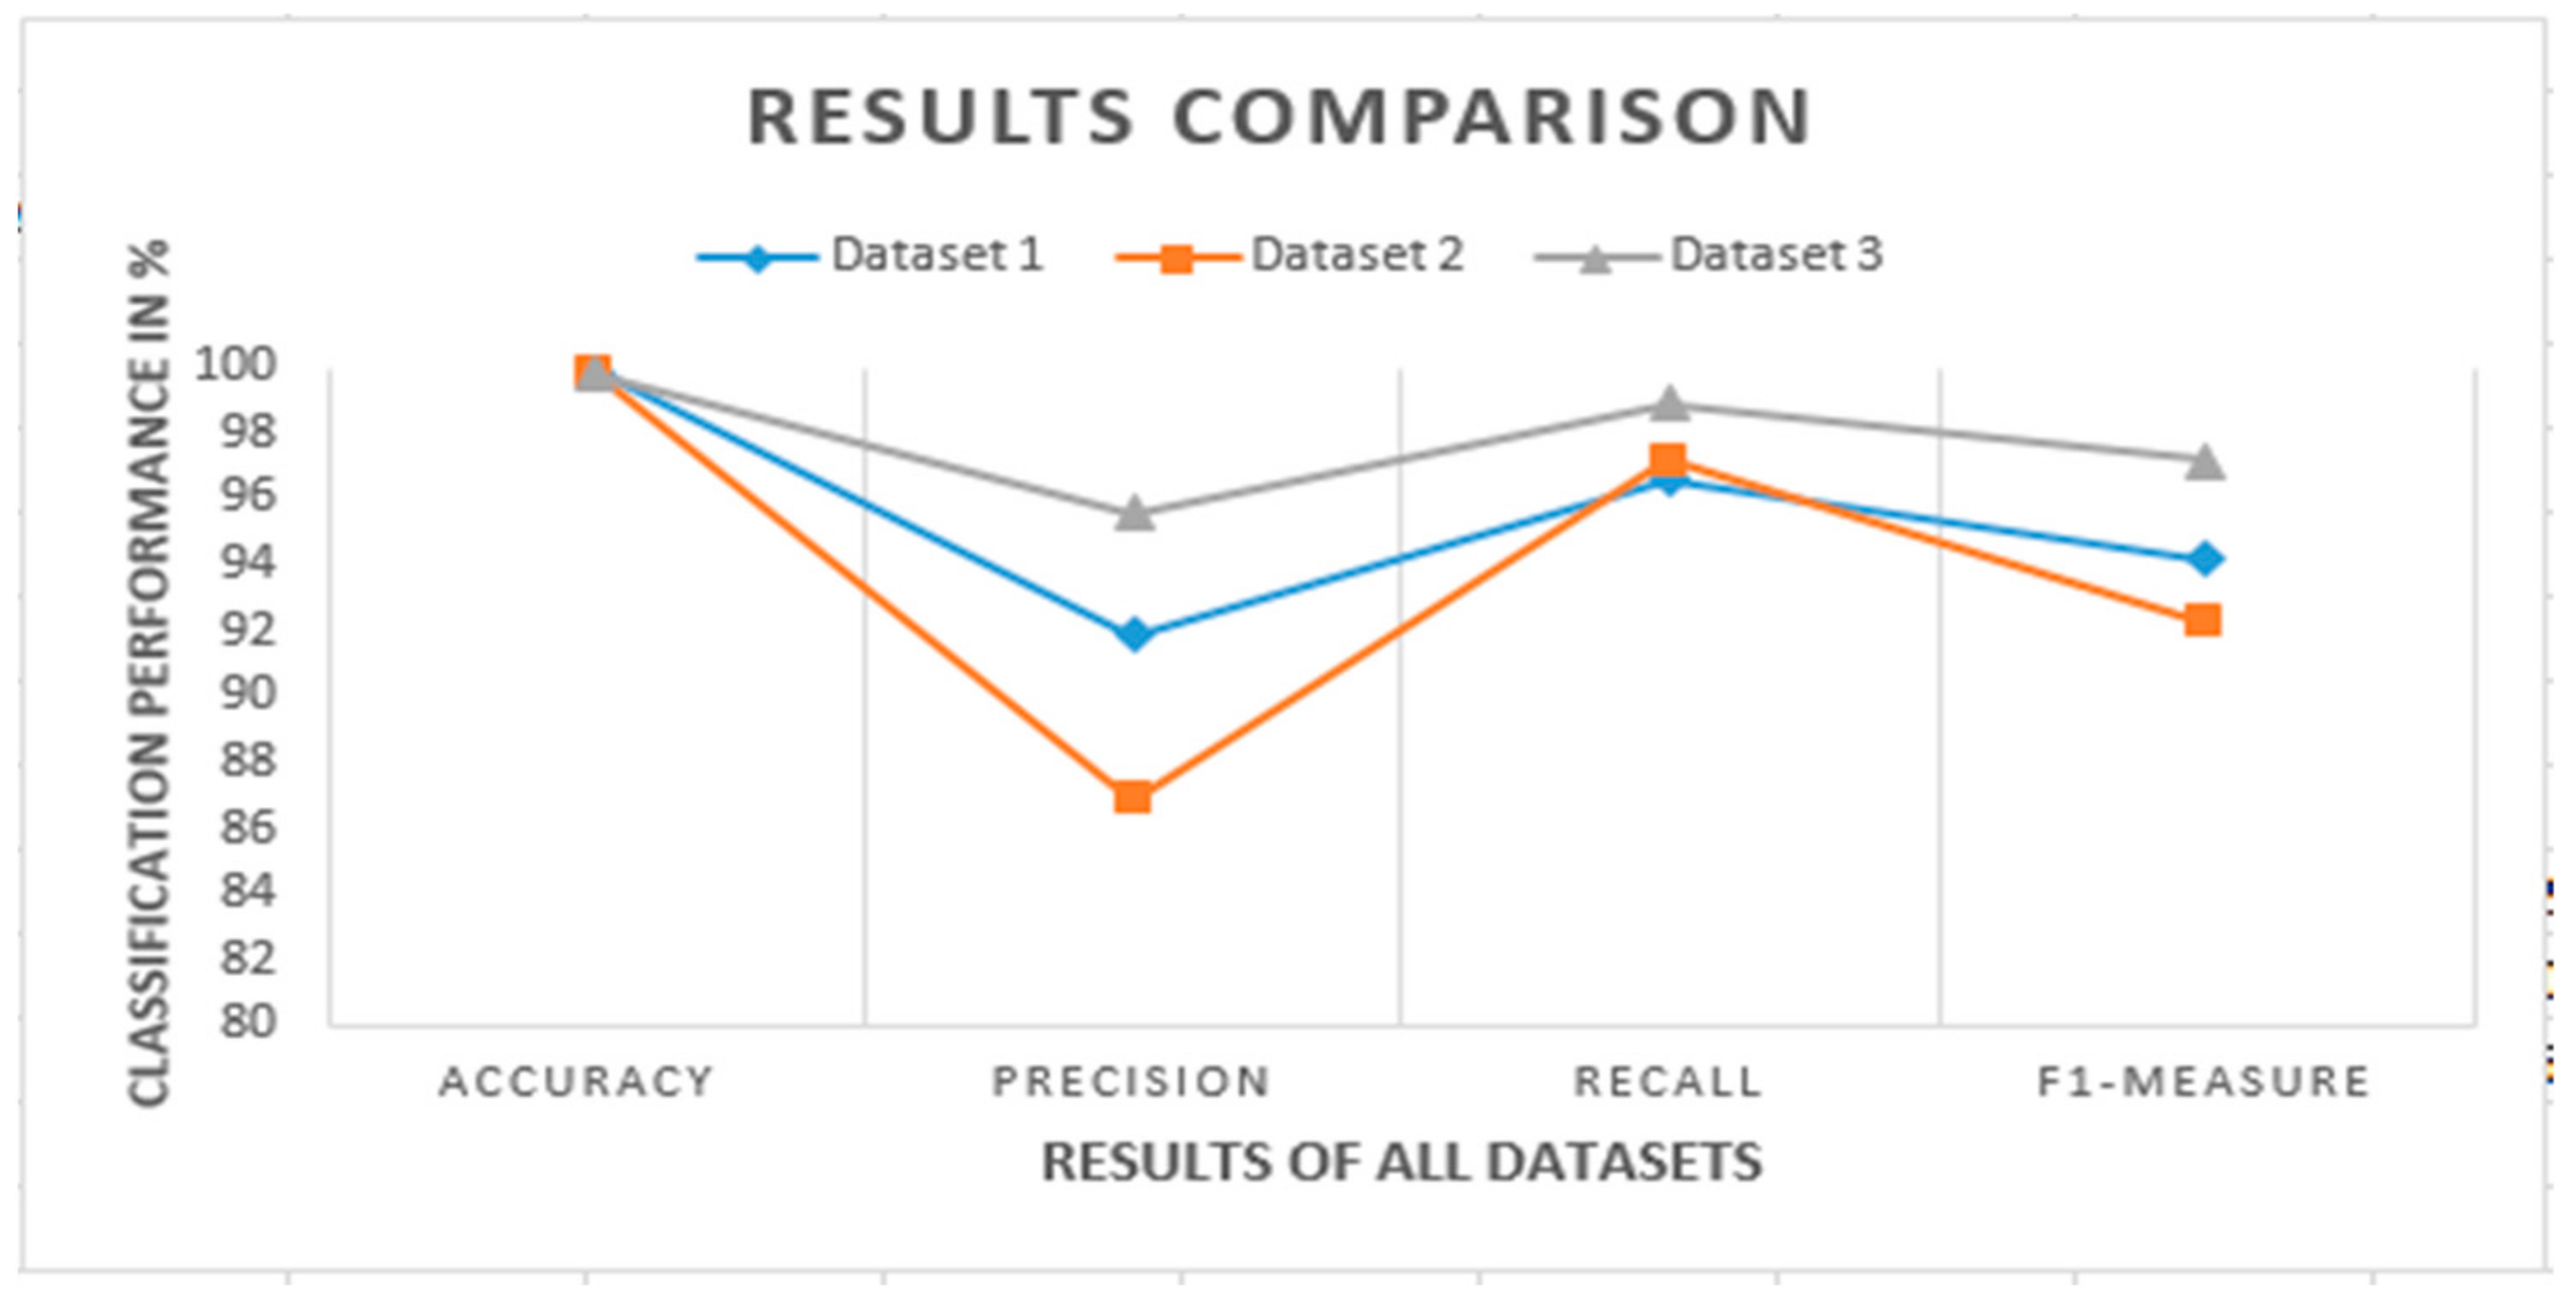
Figure 11.
Performance feature selection performance.

Figure 12.
Performance comparison with machine learning models.

Figure 13.
Comparative analysis graph of dataset 1.

Figure 14.
Comparative analysis graph of dataset 2.

Figure 15.
Comparative analysis graph of dataset 3.

Table 1.
Dataset formation.
| Evaluation Sets | Dataset 1 | Dataset 2 | Dataset 3 | ||||||
|---|---|---|---|---|---|---|---|---|---|
| Pneumonia | Normal | COVID-19 | Pneumonia | Normal | COVID-19 | Pneumonia | COVID-19 | Normal | |
| Training | 3418 | 1266 | 330 | 3875 | 1341 | 265 | 2292 | 462 | 1000 |
| Testing | 2210 | 2851 | 100 | 2210 | 4000 | 71 | 2000 | 198 | 2110 |
Table 2.
Proposed image processing: original, ROI, and RGB to gray.
| Image Category | Original | ROI | RGB to GRAY |
|---|---|---|---|
| Normal |  |  |  |
| COVID-19 |  |  |  |
Table 3.
Hyperparameters.
| Training Parameters | Concatenated Network |
|---|---|
| Optimizer | Adam |
| Zoom Range | 5% |
| Loss Function | Categorical cross-entropy |
| Epochs | 100 |
| Height and Width | 5% |
| Re-scaling | 1/255 |
| Learning Rate | 10−4 |
| Rotation | 0–360° |
| Batch Size | 20 |
Table 12.
Performance feature selection results.
| Dataset | Overall Feature | PSO | ENTROPY-BASED |
|---|---|---|---|
| Dataset 1 | 4096 | 494 | 616 |
| Dataset 2 | 4096 | 490 | 612 |
| Dataset 3 | 4096 | 497 | 619 |
| Average | 4096 | 493 | 615 |
Table 13.
Comparative Analysis.
| Reference | Datasets | Techniques | Accuracy |
|---|---|---|---|
| [15] | Dataset 2 | ResNet101 and VGG19 | 94% |
| [18] | Dataset 3 and Dataset 1 | Pre-defined CNN model fully connected layer max pooling layer dropout layer average pooling layer | 89.56% |
| [21] | Dataset 1 | Ensemble techniques: weighted average approach, unweighted average approach (by accuracy) | |
| [22] | Dataset 2 | Channel-shuffled dual-branched CNN architecture, augmented learning paradigm with distinctive moderators | 93.42% |
| Proposed Model | Dataset 1, Dataset 2, and Dataset 3 | Concatenated CNN model (Xception and ResNet101) | 99.79% |
Publisher’s Note: MDPI stays neutral with regard to jurisdictional claims in published maps and institutional affiliations. |
© 2022 by the authors. Licensee MDPI, Basel, Switzerland. This article is an open access article distributed under the terms and conditions of the Creative Commons Attribution (CC BY) license (https://creativecommons.org/licenses/by/4.0/).
Share and Cite
MDPI and ACS Style
Rafiq, A.; Imran, M.; Alhajlah, M.; Mahmood, A.; Karamat, T.; Haneef, M.; Alhajlah, A. Deep Feature Extraction for Detection of COVID-19 Using Deep Learning. Electronics 2022, 11, 4053. https://doi.org/10.3390/electronics11234053
AMA Style
Rafiq A, Imran M, Alhajlah M, Mahmood A, Karamat T, Haneef M, Alhajlah A. Deep Feature Extraction for Detection of COVID-19 Using Deep Learning. Electronics. 2022; 11(23):4053. https://doi.org/10.3390/electronics11234053
Chicago/Turabian StyleRafiq, Arisa, Muhammad Imran, Mousa Alhajlah, Awais Mahmood, Tehmina Karamat, Muhammad Haneef, and Ashwaq Alhajlah. 2022. "Deep Feature Extraction for Detection of COVID-19 Using Deep Learning" Electronics 11, no. 23: 4053. https://doi.org/10.3390/electronics11234053
Note that from the first issue of 2016, this journal uses article numbers instead of page numbers. See further details here.