
Simulation of Biochemical Reactions with ANN-Dependent Kinetic Parameter Extraction Method


School of Computer Science, Peking University, Beijing 100871, China
*
Authors to whom correspondence should be addressed.
Electronics 2022, 11(2), 216; https://doi.org/10.3390/electronics11020216
Submission received: 8 December 2021
/
Revised: 1 January 2022
/
Accepted: 7 January 2022
/
Published: 11 January 2022
(This article belongs to the Special Issue Advances in Swarm Intelligence, Data Science and Their Applications)
Abstract
:The measurement of thermodynamic properties of chemical or biological reactions were often confined to experimental means, which produced overall measurements of properties being investigated, but were usually susceptible to pitfalls of being too general. Among the thermodynamic properties that are of interest, reaction rates hold the greatest significance, as they play a critical role in reaction processes where speed is of essence, especially when fast association may enhance binding affinity of reaction molecules. Association reactions with high affinities often involve the formation of a intermediate state, which can be demonstrated by a hyperbolic reaction curve, but whose low abundance in reaction mixture often preclude the possibility of experimental measurement. Therefore, we resorted to computational methods using predefined reaction models that model the intermediate state as the reaction progresses. Here, we present a novel method called AKPE (ANN-Dependent Kinetic Parameter Extraction), our goal is to investigate the association/dissociation rate constants and the concentration dynamics of lowly-populated states (intermediate states) in the reaction landscape. To reach our goal, we simulated the chemical or biological reactions as system of differential equations, employed artificial neural networks (ANN) to model experimentally measured data, and utilized Particle Swarm Optimization (PSO) algorithm to obtain the globally optimum parameters in both the simulation and data fitting. In the Results section, we have successfully modeled a protein association reaction using AKPE, obtained the kinetic rate constants of the reaction, and constructed a full concentration versus reaction time curve of the intermediate state during the reaction. Furthermore, judging from the various validation methods that the method proposed in this paper has strong robustness and accuracy.
1. Introduction
The association of small chemicals or large biological molecules in a rapid, specific way is an essential step in various chemical or biological processes ranging from enzyme catalysis to regulation of immune responses [1,2]; extracting key thermodynamic information from those reactions will greatly benefit the understanding of those chemical or biological processes. Two of the most prominent thermodynamic properties that define a reaction are association rates and reaction intermediate state concentrations [3].
The rate of association spans a range from to ; it is limited either by diffusion or subsequent chemical processes such as conformational rearrangement [1]. Association rates can be categorized as time-dependent and time-independent [2,4]. Time-dependent reaction rate constants are usually greatly influenced by diffusion, are more susceptible to disruptions in reaction environment, and can thus be described by non-equilibrium radial distribution functions [5,6]. Time-independent reactions rates look at molecule diffusion and interactions on a mass scale that exhibit overall reaction kinetics. Time-independent reaction rates can be modeled through approximation [7].
Association reactions between chemical or biological molecules often involve an intermediate state (also known as transitional state) whose existence greatly expedite the efficiency of molecule association, thus increasing chemical or biological reaction rates [1]. Intermediate states in the reaction pathway, also sometimes called transition states, refer to one or a set of configurations that possess rotational or translational correlations between the interacting species [3,8]. Intermediate states are the most unstable species in the reaction pathway, whose bonds are in the process of been constantly broken and remade [8]. They are key to elucidating chemical or biological reaction pathways as their kinetic and structural characteristics shed light on the reaction process and energy landscape.
In order to reveal the structural or kinetic traits of intermediate states, kinetic experiments such as stop-flow were used in conjunction with fluorescence spectroscopy to capture this transient species [9,10,11,12]. Experimental detection of the transitional states can be done for some reactions, but for others, especially reactions involving large biological molecules, experimental detection of transient states might prove to be extremely difficult [1,8]. More generally, experimental data can only provide the kinetic and structural information of the more abundant states, which often exist as dominant fractions and are much easier to detect using regular experimental tools. Even though experimental data were unable to provide specific kinetic parameters associated with intermediate states, its existence can often be presumed based on a hyperbolic dependence of reaction time to reactant concentration [8]. We speculate that if experimental evidence confirm the existence of the intermediate state but were unable extract the kinetic parameters involving the intermediate state turnover, it is crucial to reveal the information regarding the intermediate states via methods other than experimental. Therefore, we strive to build an efficient computational framework for extracting information encoded in experimental data regarding intermediate states [13].
Here, we will present a novel method making use of artificial neural-networks to gather kinetic and concentration information of a possible transitional state in a biological or chemical reaction system [14]. The objective of our method is to use computational methods to extract association/dissociation rate constants and concentration dynamics of the intermediate state with the aid of experimental datasets. To do so, firstly, we simulated the reaction systems using differential equations, secondly, we fit the modeled differential equations to experimental data, using neural networks as an approximator to differential equations [15]. Finally, we utilized global search algorithm Particle Swarm Optimization (PSO) to solve the non-linear differential equations derived from reactions. We chose PSO because it can provides us a global best solution on the parameter space, other algorithms, such as gradient descent are prone to encounter local optima, are single based or have unknown search space issues; therefore, they are unable to produce an optimal solution [16]. In sum, we have developed a simple, but effective model to simulate the reactions as differential equations using the adaptive strength of neural networks, and used a rapid global search method (PSO) [17,18] to minimize unsupervised errors combined from simulating reactions and from the fitting of experimental data to neural networks.
The main contributions of this paper are as follows:
- Based on chemical reaction kinetics and experimental presumptions, a reaction model of differential equations involving intermediate states were constructed describing chemical or biological reactions.
- Utilizing Artificial Neural Network (ANN) to model differential equations describing reactions. Adjusting ANN’s weights to best model the chemical reactions while minimizing the difference between the output of the neural network and experimentally measured data using swarm intelligence algorithms. Based on ANN and predefined reaction models, a novel model-based parameter extraction method called ANN-Dependent Kinetic Parameter Extraction method (AKPE) emerges that could obtain kinetic rate constants associated with lowly-populated species with high efficiency and low computational cost.
- Extensive experiments employing the proposed method were carried out upon real-life examples. Kinetic parameters of biochemical reactions regarding the intermediate state were given. The derived parameters were further analyzed and subsequent in-depth kinetic and structural characterization of the intermediate state were accomplished.
- Validation of our method were carried out by comparing kinetic rate constants produced by AKPE with corresponding experimental kinetic rates and stochastic simulation results, consistency is achieved. The agreement between parameter values produced by AKPE and other methods confirms the validity of AKPE.
The remainder of this paper is organized as follows. Section 2 (Related Works) reviewed the area of chemical reaction simulation and introduced some basic ideas in model-based reaction parameter prediction. Section 3 (Materials and Methods) proposed the general architecture and the computational details of our method. In Section 4, (Results), an real-life case study using the C terminal domain of SARS-CoV virus’s main protease was analyzed using the proposed method, extensive biological characterization was achieved. Section 5 (Discussion) validated the proposed method by comparing it with other algorithms or experimental data. Finally, Section 6 (Conclusions) and Section 7 (Future Perspective) concluded and provided future perspectives of this study.
2. Related Works
This section reviews some reaction simulation approaches and highlights the basic features of AKPE.
The two most widely used reaction simulation methods are deterministic and stochastic. Deterministic methods make use of reaction models, reaction models describe the rates of reactions and can demonstrate the concentration fluctuations of reactants. Large scale reactions that involve large quantities of reactants can be described by deterministic linear or non-linear ordinary differential equations in homogenous reaction space [19,20]. Small scale association reactions that can be described by a limited number of molecules, or when the key steps of the reactions depend on the behavior of a limited number of molecules are more accurately simulated by stochastic simulation algorithms (SSA), chemical reaction models can be incorporated into both of the aforementioned simulation categories [21].
2.1. Deterministic Simulation Methods
For macroscopic deterministic reaction systems, differential equations can often describe reaction system and reactants by:
In the case of single reactant:
where x is the reaction time and y(x) denotes reactant concentration as a function of time, G is the differential function based on the chemical properties of the reaction system, denotes the nth derivative of the term with respect to reaction time and is also the order of the reaction.
Sets of differential equations involving k reacting species are presented below:
where x is the reaction time, to are the concentrations of the k reactants in the reaction system, the system of differential equations take into account the interaction between the k species, n is the reaction order.
2.2. Neural Networks as Universal Approximators
Neural networks can be universal approximators [14]; it can be ideal to use neural networks to simulate reaction-derived differential equations. Methods utilizing feed forward neural networks was applied to solving differential equations describing gas-phase or liquid-phase reaction systems in steady states. The capability of neural networks as approximators of reaction-derived differential equations were exploited, postulating them as solutions for a given deferential equation with an unsupervised error. Neural networks can provide an expression for the analytical solution of differential equations over the entire definition domain. As it can be expressed as a set of compact mathematical expression, therefore, it can include any number of parameters and variables, making it adequate in solving optimization problem with an accuracy of around MSE/ to . Although other analytical approaches at solving differential equations might arrive at identical solutions, the neural networks approach to solving differential equations is much more computationally efficient since it allows the evaluation of solutions at any desired number of input points with much less memory usage and computing time [22,23].
When describing gas-phase or liquid-phase reaction systems in non-equilibrium, the capability of neural networks to approximate stochastic diffusional systems can be revealed. A special class of neural networks, named Stochastic Neural Networks(SNN), are capable of approximating stochastic processes. SNN incorporated statistical randomness into its mathematical expression, thus are capable of generating random sample functions. SNN can be canonical solutions to random processes describing reaction systems just as ANN can represent solutions to ordinary differential equations. SNN is more memory efficient at representing solutions to random differential equations, since they are capable of generating a collection of sample functions while normal ANN only generate a single sample function. Some example studies have demonstrated SNN’s applicability at approximating solutions of non-linear random differential Equations [24,25].
2.3. Stochastic Simulation Methods
In microscopic systems where only a small number of molecules are present, stochastic diffusion takes a crucial role, therefore, differential equations describing the behavior of molecules in such a system will take diffusion and the location of each molecule into account. In such systems, stochasticity and variability is an perpetual problem to address. It has been shown experimentally that in some of these reaction systems, stochasticity of reaction resulted in large variability of reaction rates [1].
Some theoretical work had been done to understand the consequences of stochastic fluctuations of molecule concentration on molecular interactions [26]. Take two freely diffusing reacting particles with a center to center distance r as example, will be the probability density of two particles to remain unbound and separated with a distance r at time t and reaction dimensionality [5,27]. Modeling the reaction of the two particles gives the reaction-diffusion master equation, which is given below:
The generalized form of the reaction-diffusion master equation can be derived when the space is divided into various compartments, the molecule denote a molecule species I in subvolumn . When describing reactions such as , where is the stoichiometry vector, is the probability that the reaction will occur in compartment . The generalized form of reaction-diffusion master equation can thus be expressed as [28]:
where t is the reaction time, x is the coordinate position of the molecule, the factor M governs reaction and D diffusion. The form of M and D can be given below for reactant X of species i in compartment j:
where is the chemical reaction propensity function, which is also a measure of reaction rate.
Stochastic simulation algorithms (SSA) are widely used to implement the chemical master Equation [29], it is a procedure for numerically simulating the time evolution of a small scale, well-stirred, diffusion influenced reacting system in which the reaction rate is subjected to stochastic variation [30]. The most well-known and widely applied of which is developed by Gillespia and thus termed Gillespia’s Algorithm [31], the general principle of which is described below:
For chemical reactions of the form: or , Gillespia’s Algorithm will first compute the propensity functions of each reaction with each reaction’s corresponding probability distribution, and then determine the time when the next chemical reaction takes place, finally, it provides the choice of which reaction occurs at which time step and the molecular number of each species in reaction will be updated accordingly, reporting the state of each reactant and the value of reaction kinetics as the reaction progress [32].
However, despite recent major improvements in the efficiency of the SSA, its drawback remains the inaccuracy of simulation results, which is a common occurrence in experimental data independent computational simulations of reaction, this is a problem due to the unpredictability of chemical or biological systems. The great amount of computational time that were often required to simulate a desired system is also one of the disadvantage of SSA [32]. People often resort to dynamic simulations that take into account the position and structural traits of every molecule in the reaction system, and it generate linear step response curves or reaction trajectories that are not necessary when the goal is only to obtain the thermodynamic parameters of the reaction system [33,34], but require much more computation power and need much more time [33,35].
Experimental results are valuable because they help to guide the process of reaction model building and simplify the complicated simulation of molecules in reaction. Establishing reaction models based on experimental data is beginning to gain more popularity in the field of chemical or biological computation, because it more accurately model the biological or chemical reaction process than hypothesized models alone.
Here we proposed an ANN-dependent Kinetic Parameter Extraction Method (AKPE) as an aid to experimental data to acquire kinetic rate constants from reactions. Features involved in AKPE include:
- Presentation of reaction models describing chemical or biological reactions based on known experimental data.
- Acquisition of reaction parameters based on reaction models will substantially simplify the simulation procedure and shorten the amount computational time.
- The stochasticity of molecular reactions can be reflected on time-independent or time-dependent association rate constants, here, microscopic parameters such as center-to-center distance between two reacting molecules were also encoded in the kinetic rate constants, and AKPE will decode and extract these parameters from experimental data.
3. Materials and Methods
3.1. Introduction of the Computation Mechanism of ANN-Dependent Kinetic Parameter Extraction (AKPE)
In this section, a brief introduction of the method will be given. Firstly, a mathematical model of differential equations is presented describing chemical or biological reactions. The coefficients of the differential equations correspond to the kinetic parameters of the reactions. secondly, a neural network will be used to approximate the aforementioned differential equations according to experimental data, the coefficients in differential equations were incorporated into neural networks. Finally, errors from the differential equations and from the fitting of the experimental data to neural networks were combined to form a final error that will be evaluated by a global search algorithm that will yield optimum parameters for subsequent reaction analysis. The outline of the method is presented on a step-by-step basis below.
3.2. Mathematical Modeling of Reactions
In this section, mathematical models of reactions were presented as differential equations. For systems where the copy numbers of reactants are large enough that stochastic fluctuations in solvents have little effect on the macroscopic rate constants, Deterministic Reaction Rate Equations (RRE) are sufficient to describe the reaction system. Depending on whether the reactants are partitioned into different spatial compartments, we categorize RREs into ordinary differential equations and partial differential equations.
3.2.1. Differential Equation Describing Single Reactant Reaction
Ordinary deterministic chemical rate equations when describing reactions with a single reactant, such as material decay A -> A, can be expressed in the form:
where x is the reaction time and D designate a certain definition domain of x, A(x) signifies the concentration of reactant A, denotes the nth order derivative of A, n is the reaction order. The boundary conditions were defined such that is any predefined points in domain D:
3.2.2. Differential Equations Involving Multiple Reactants
When the chemical reaction system involves multiple reacting species, such as in the nth order reaction A+B ->C, and the aim is to monitor the status of multiple reactants. We shall use a set of differential equations:
with initial conditions in the form of:
where A, B, and C are reacting species, n is the reaction order.
3.2.3. Partial Differential Equations Describing Compartmentalized Reactions
Partial differential equation was also employed when compartmentation or spatial inhomogeneity is present in the system with regard to a critical reactant [36]. Reactions or interactions between species only occur when reacting species diffuse across reacting boundaries [19]. The form of the partial differential equations that we used in AKPE for a single reactant y are as follows [22]:
where and are time measurements in two distinctive reaction environments; y is the reactant concentration with regards to the sub-reactions.
Boundary conditions take the form of:
3.2.4. Time-Dependent Reaction Rate Constant
In classical chemical kinetics, it assumes a ample supply of reacting pairs in close proximity, kinetic parameters from reaction-derived differential equations often possess time-independent association rate constants. However, due to a small number of reacting molecules and low reaction rates, diffusion cannot effectively provide a continuous supply of closely reacting pairs [27]. Anomaly in kinetic rate constants will shift the rate parameters away from a perfectly time-independent one. Therefore, a completely time-independent reaction rate constant would be misleading as microscopic fluctuations can propagate to cause a macroscopic effect on reaction rates. As a consequence, stochasticity turns out to be an important factor in reaction systems described above [37]. To more accurately capture the variability in reactions, time-dependent rate coefficients were used, the complicated derivation of time-dependent association rate constants are not the main focus of our study here, for thorough description, please refer to Supplementary Information (SI) Section S1 and references [7,38,39].
3.3. Constructing Neural Networks Modeling Reaction Differential Equations for Experimental Data Approximation
The general form of the reaction-derived differential equations are given in the previous Section [23]. Here, we utilize feedforward multi-layer neural networks for modeling any given set of experimental data. Any given function y and its n-th order derivative , can be mapped continuously by an neural network in the following way:
where x is the independent variable, , , are bounded real-valued adaptive parameters from neural networks, k is the total number of hidden nodes and is the activation function of neural networks, here it takes the form of a sigmoid function.
Any given experimental data can be formulated with a linear combination of neural nodes, with an arbitrary number of nodes. The coefficients of the reaction-modeled differential equations and inherent parameters of neural networks can be trained by a search algorithm both for the fitting of the experimental data and for solving differential equations. The general architecture of the neural network is illustrated in Figure 1, the three layers of neural networks are demonstrated in the figure, The structure of the network can be represented as [m, ,..., n] where is the number of nodes in the kth hidden layer, we started with one hidden layer and 10 hidden nodes in the first setup, and then gradually increasing the number of hidden layers for better performance. The network consists of an input layer of m nodes representing m experimental data points. The second layer is the hidden layer, where input nodes are transformed by sigmoidal activation function and adjustable parameters and for hidden layer i, the first order and second order derivatives of each nodes were also computed in this layer, the specifics of transformations are slightly different depending on the requirements of each reaction systems; however, each reaction species in the reaction system can be represented by a certain transformation of the neural network nodes, which can subsequently be fitted to experimental data. The third layer is the outputs from the neural network, which are the coefficients of the reaction-derived differential equations, the parameters of neural networks and the search method, and errors from all the above-mentioned modules in AKPE.
3.4. Fitness Evaluation and Training in AKPE
The fitness function contains two errors arising from the fitting of experimental data and from solving reaction-derived differential equations. The linear combination of errors from the neural network’s modeling of reaction differential equation and from fitting of experimental data forms an unsupervised error function. The error to be minimized can be defined as an weighted error with minimization priority in either sub-errors according to specific conditions in application. The total error is given as:
where is the weight in the range of 0–1. The weight factor puts emphasis on one error over the other, and offer more freedom in user coordination, this leads to higher accuracy and better robustness.
From total error e, is the error that originate from differential equations and can be expressed as:
where function G(.) takes the from of Equation (1) for single reactant reaction or it can take the form of Equations (2) and (3) for multi-reactants reactions or compartmentalized reactions, respectively, is the concentration of reactant, denotes the nth order derivative of , m is the total number of points in the definition domain of independent variable x.
is an error arising from neural network data fitting of experimentally measured values with an expression in the form of:
where is single output neural network with parameter p and m input units fed with variable vector x. contains no adjustable parameters and is the experimental data vector in time point i. The weight vector p can be adjusted and trained according to the optimization algorithm used.
In the training process, the parameters to be adjusted in the minimization algorithms are the parameters from the differential equations, plus weights from the neural networks. The training data were normalized to be in the binary form to hasten the network training. About 70% of the data were used in the training and simulation steps and the rest of the data were used for validation of the network model. We initialize all the weights by assigning random values in the range , use the training data to learn the weights and record the value of the Root Mean Square Error(RMSE) in function of the times/cycles until the RMSE drops to a value below .
3.5. PSO as an Optimizer
We employed a global search method to find the set of optimum parameters that best fit the experimental data and solve the reaction-derived differential equations. The method we used was particle swarm optimization (PSO) [17,18]. PSO is a well-developed, computer optimization method aimed to find the global optimum by iterative refining a predefined measure of quality. It was introduced by Eberhart and Kennedy in 1995 as a stochastic global optimization technique inspired from the behavior of particles or individuals in a swarm. This algorithm integrated the information gathered by the parallel searching of individuals to enhance the total efficiency of the swarm. The main advantages of PSO algorithm are that it is simple in concepts, easy in implementation, stable in convergence and in global optimum finding, and efficient computationally compared to other heuristic optimization techniques [40].
In PSO algorithm, each individual of the swarm represents a possible solution in the non-linear solution space. The problem of finding a global optimum is thus turned into finding the optimum individual. Each individual searches a problem space and its measure of quality is its position and velocity. PSO algorithm initializes with each particle placed randomly within an exploration space, and then each individual searches the space with its position and velocity updated iteratively according to previous local best and global best . The updating scheme of PSO is as follows:
where i is the number of the particle, j is the number of iteration, is the inertia weight, and were defined by the authors as local and global acceleration constant, and are random vectors in the range of 0 and 1, X and V are positional and velocity vectors.
3.6. Pseudo Code and General Architecture of AKPE
The following is a sample pseudo-code of AKPE, annotations were provided in every line of the code after the percentage sign, function is as defined in SI S1, is the reaction-derived differential equations, has the expression , D, MI and denote reaction component dimer, intermediate state and starting monomer concentration, respectively. Executing AKPE module in Algorithm 1 and PSO module in Algorithm 2 will produce optimal values of all kinetic rate constants and intermediate state dynamics (concentration vs. reaction time curve) together with errors from every module, line 13, 17 and line 18, function D_to_MI and MI_to_D in in Algorithm 1 were inferred from reaction models, thus their expressions depend on the specific chemical or biological reaction under study.
| Algorithm 1 AKPE |
|
| Algorithm 2 PSO Module |
|
The main steps of our application of neural networks and PSO in data fitting and parameter optimization can be summarized as follows and in Figure 2.
- step 1:
- Feedforward neural networks construction for experimental data fitting.
- step 2:
- Constructing differential equations according to the reaction systems.
- step 3:
- Fitness function construction by combining errors from data fitting and solving differential equations.
- step 4:
- PSO optimization of kinetic parameters.
The novelty and contributions of AKPE method on biological or chemical reaction systems includes the following points:
- Presentation of a method that integrate differential equation reaction modeling and neural networks for accurate reaction progress prediction.
- Presentation of a computational method that predict the concentration dynamics and the reaction coefficients associated with the intermediate state which can not be measured experimentally due to limitations on experimental means.
- Exploiting existing experimental data to aid de novo computational prediction of reaction coefficients and concentration dynamics of reactants and lowly-populated states (intermediate states).
- Provided a simple and efficient system for fast reaction prediction, as opposed to having to describe every minute details of the reaction system in other simulation methods.
4. Results
4.1. Application Example: Modeling the C terminus of SARS-Cov Virus Main Protease Protein-Protein Association Reaction
The main protease() of severe acute respiratory syndrome coronavirus(SARS-CoV) is indispensable to SARS virus life cycle. of SARS-CoV exist in monomeric and dimeric forms in solution simultaneously with interconversion between these two forms, but only the dimeric form is enzymatically active. The C terminal domain (residues 187–306) of (-C) is crucial to ’s dimerization with itself under interconversion between monomeric and dimeric forms. Therefore, we put the emphasis of our study here on -C. The mechanism of monomer–dimer interconversion of -C is still not clear, but many researchers carried out studies on -C monomer–dimer interconversion and found substantial evidences for the existence of a partially-folded transitional state of -C which might facilitate the interconversion between monomeric and dimeric forms [41,42].
A hypothetical model of the reaction mechanism involving -C were presented which proposes that two monomeric protein in solution might associate with each other to form an monomeric intermediate state, which will further interact with each other and evolve into a native dimeric complex [41,42]. The schematic diagrams of the association process are represented in Figure 3. In the figure, two monomers on the left were colored separately in yellow and green, if two diffusing monomers came within each other in a distance smaller than , then these two monomers will undergo a series of rotational or thermodynamical transformations to become intermediate states which were monomeric-like, but possess much higher reaction propensity, if other particles came within its reaction radius , then two intermediate monomers will interact to form a dimer protein. By incorporating differential equations in continuous time regime, we arrive at a set of deterministic rate-based equations describing the model, taking the existence of an intermediate state into account, the reaction dynamics of different fraction of -C can be described with mass action kinetics below:
Equation (21) is the set of differential equations describing the reaction in Equation (20), where , , and are the concentration of -C monomer, transitional state, and dimer, respectively, , , , are the association coefficients of the dimerizational process as shown in Figure 3. is the association rate constant of -C through diffusion, is diffusional limited because the intermediate state exist only in a very small amount. The expression of can be found in SI S1, is the starting monomeric concentration of -C.
The association process of -C is mediated through a monomeric-like transitional state, probably generated from partial unfolding of the native -C monomer. The transitional state is an activated complex that is inclined to react with its partially folded neighbors for dimer formation. The subsequent step of dimer formation can be seen as a stochastic diffusional encounter of transitional states [43].
4.2. Application of AKPE for WT -C Association
The monomeric -C and dimeric -C concentration at different time points in different experimental conditions were obtained. The transitional state as previously stated can not be directly detected by experimental methods, but the application of AKPE on this system will effectively assist experimental methods to obtain species concentration and kinetic rate information of the monomer-dimer interconversion.
The building of AKPE was carried out with Matlab. According to the reaction model stated in the last section, we setup the neural network module of AKPE, the input layer contains m experimental data points obtained through experiments, the hidden layer contains ten nodes, the outputs of the neural network represent dimer concentrations, which we will use to compare with corresponding experimental values, trainable parameters of the neural network module are all the coefficients from the reaction model, weights and offsets from neural networks. PSO was implemented in another module of AKPE, minimizing a combined loss from both the experimental data fitting and the neural network’s approximation of differential equations. The final parameters of neural networks, the number of population and iteration of PSO are provided in SI S5 (Tables S2–S4).
According to the reaction model, the kinetic rates to be calculated include (The concentration of the intermediate state at various time points), , , , and . The association constant was back calculated from and in an diffusion-dependent manner. , and are reaction orders involving the transitional state, the values of which were usually measured through experiments, if there were no experimental measurements concerning the order of the reaction, the values of which can also be predicted using our approach.
Table 1 shows a complete list of parameters used in the simulation. The biologically relevant upper and lower limit fixed the range of the parameter search in PSO, thus yielding an optimum value within the predefined range for each parameter. This range of parameters is narrow enough to provides a guide to AKPE, yet broad enough to see how well it overcomes possible local minimums while still capturing general trends of each parameters.
The results of the optimum parameters yielded by our methods are listed in Table 2. for both the wildtype -C and its mutants in various conditions. The parameter values are the average of 10 repetitive runs of AKPE, with Root Mean Square Deviations (RMSD) in an acceptable range, which are provided in SI Table S1.
Discussion of the Results Obtained in this Section
Convergence of total error is achieved at around epochs 30,000 (Figure 4). The architecture of ANN used was one input layer, m input nodes(m is the number of experimental data points), one hidden layer, 10 hidden nodes, one output layer, this structure yielded lowest RMSE values. Note that the optimized parameters of the kinetic equations reached convergence rapidly, without many random variations, meaning that the parameters are robust and stable in the optimization process undertaken by PSO. In neural network fitting of experimental data, fewer neural nodes in neural networks simplify the network topology, reduce the number of unknown parameters that went along with the neural networks, thus decreasing the possibility of overfitting. We reduced the number of nodes in the hidden layer to 10 to prevent overfitting while at the same time maintaining the best fitting capability of the neural networks.
As shown in Table 2, the values of the kinetic rate constant pertaining to the intermediate states of both the wild-type and the mutant proteins in various experimental conditions are somewhat different, but the overall trends are generally the same with , , implying the rapid turnover rate of the transitional state, thus accounting for its dramatically low quantity, making its detection very difficult. The micro-scale parameters and report on the relative inter-particle distance under which protein–protein association occurs and the relative protein radius, respectively.
Each value of the output results in Table 2 were the average value of ten parallel runs of AKPE with the same upper and lower bounds on the rate constants, but with different choices of ANN’s initial weights, therefore, the reproducibility of AKPE can be speculated from the standard errors of kinetic rate constants, which are shown in SI Table S1. Among the kinetic rate constants of the reaction, the values of are generally on the order of with standard errors much smaller than its values, the values of are on the order of , with standard errors on the same order or an order lower, the values of span a range of to depending on the specific protein system, but has small standard errors compared to its corresponding value. span a value of a range of to with small standard errors. and are stochastic diffusional parameters, which have physical meanings and can be interpreted to describe the reaction microenvironment, they were also used to back calculate the values of . The generally consistent values of in different reaction systems can be a side evidence for the reliability of AKPE outputs.
The neural network and experimental data fitting module have negligible errors of around with data values of around to ; therefore, the accuracy of the fitting module is very high. The module responsible for the solution of reaction-derived differential equations generated errors of around , which were also very small; therefore, the accuracy aspect of AKPE was well-grounded.
The error of kinetic rate constant at higher temperatures were a little higher, but the output coefficients were generally on the same order, with variabilities in specific numbers, however, the values of were on the order of , predicting the correct order was valuable enough providing the limited amount of experimental data, on the other hand, was back calculated from the values of and through Equation S5, and are the parameters describing stochastic diffusions in the reaction system, therefore, the higher errors might rose from the combined error from , and from the inherent randomness in the system.
4.3. The Kinetic Parameters of Interconversion in Increasing Temperatures
We used AKPE to simulate the interconversion reaction at various temperatures, the kinetic parameters are as shown in Figure 5, Blue lines are experimentally measured dimeric concentration curves and colored lines with markers are simulation outcomes from ANN, we can observe an perfect overlap of the lines and an minimum systematic fitting error of around , indicating the high accuracy of the fitting module in AKPE.
Discussion of the Results Obtained in This Section
The transitional state concentration of WT -C in various temperatures are shown in Figure 6, plotted as a function of time. Inspection of the transitional state concentration curve indicate that transitional state concentration generally increases as temperature rises, probably due to its faster conversion from monomers and almost for all of the temperatures investigated, the intermediate concentration is highest at the start of the interconversion process and slowly reaches a low steady value demonstrating that the interconversion is approaching equilibrium.
4.4. Kinetic Parameters as a Function of Temperatures
Discussion of the Results Obtained in This Section
Figure 7 shows how the kinetic parameters change as a function of temperature. For association rate constant , the higher the temperature, the greater its value. Examining closely at how and shifts at raising temperature, the value of increases in value while the value of shifts downwards. An increase in signifies an enlarged reaction radius and thus higher reactivity in the same intermediate species concentration, relaxing the reaction criteria. Decreasing means larger intermediate state protein radius, it might also imply a more relaxed protein structure, thus higher reaction possibility. Increase in values of , , , , and a decrease in the the value of at increasing temperatures signify an increase in thermodynamic activity in chemical or biological reactions that come naturally at an elevation of temperature; this result also confirmed the validity of AKPE at predicting biologically or chemically correct parameters. Figure 7 might show a higher standard error at higher temperatures, this might due to the limited number of experimentally measured data (due to difficulties in experimental techniques in obtaining more data), adding more data points into the AKPE will surely increase the accuracy of calculations.
5. Discussion
The reaction system we discussed previously was a model involving -C. It exists in an equilibrium of monomers and dimers. Previous experimental studies on this system assumed the existence of a intermediate state. We incorporated this intermediate state to our proposed three-state model. In our study, the intermediate state was treated as a third reacting species in reaction model. The fitting of the experimental data was carried out via the help of neural networks, and subsequent reaction model was optimized through swarm intelligence algorithm PSO. The outcome of the method yielded corresponding kinetic parameters involving all reacting species and intermediate state concentrations as functions of reaction time, these output parameters can unequivocally reflect a reaction’s precise dynamics.
5.1. The Biological Implication of AKPE
The biological significance of AKPE was also demonstrated through -C WT protein and its mutants, we showed that AKPE can properly describe intermediate state dynamics in our system. Change in intermediate state dynamics when mutations are introduced into protein reflect the importance of the specific residue loci for the reaction equilibrium, which provide valuable information on the structure of the protein. Change of reaction conditions (temperature) also brings about changes in intermediate state dynamics, as indicated in Table 2, an increase in temperature from 303K to 310K increased both the association rate and the dissociation rate of intermediate state. On the same token, protein mutants that showed different association/dissociation parameters compared to wild-type proteins can be used to indicate which specific reaction pathway does the mutation or the change in condition affects the most, thus demonstrating the mutational site’s significance to the reaction. These results can be interpreted to provide information on the biological significance of every residue in the protein under investigation.
5.2. Validation of AKPE
AKPE is a method that describes reactions involving stochastic diffusional particles, in this section, we will compare the result of AKPE with other stochastic algorithm. Moreover, we will also use experimentally obtained overall association rate constant to confirmed the accuracy of AKPE.
5.2.1. Validation of AKPE Using Gillespia’s Stochastic Algorithm
Stochastic Gillespia Algorithm (SSA) is a fundamental approach to model chemical reaction and diffusion. The implicating stochastic models of chemical reactions provided a detailed and precise treatment of reaction diffusion process, especially for biological systems where there are only a small abundance of a specific reacting species. A limited copy number of the reacting species makes the deterministic chemical reaction models less accurate.
Since the intermediate state in -C monomer–dimer interconversion process exist in a extremely low concentration in solution, we decided to use SSA to verify results produced by AKPE. The principle idea is that when simulating dimer and monomer populations by SSA, using kinetic parameters produced by AKPE would recreate the time-dependent concentration curve of the -C dimers, which are given by experiments. By comparing the experimentally obtained dimer population (same as AKPE) and SSA produced dimer concentration, the validity of AKPE will be clearly demonstrated. Using the same set of kinetic parameters, we compared AKPE with SSA by simulating the transitional state concentration and WT--C dimer concentration as a function of time at 310 K. The simulation parameters are listed in Table 3. and the results of the simulation are given in Table 4. Mean Absolute Error (MAE) and Root Mean Square Error (RMSE) are common metrics to measure the differences between predicted values and real values, relatively small MAE and RMSE values indicate that the predicted values of the sample are closer to the real values, we have also calculated the MAE and RMSE between the two methods SSA and AKPE, and they are relatively small, meaning that AKPE is just as good as SSA at simulating diffusion-perturbed reaction systems.
The results from SSA using kinetic parameters outputted from AKPE are plotted in Figure 8, we can observe a significant agreement between these two methods. Confirming the validity of AKPE.
5.2.2. Evaluation of AKPE by Experimental Kinetic Rate Constants
In this subsection, we will provide comparison of kinetic rate constants obtained from AKPE and from mathematical model of the reaction based on regression method.
The experimental data was divided into two sets: training and validation. The training dataset was used to adjust the weights of all connecting nodes until the desired error level is reached. Validation datasets was used to evaluate the efficacy of AKPE at predicting kinetic rate constants.
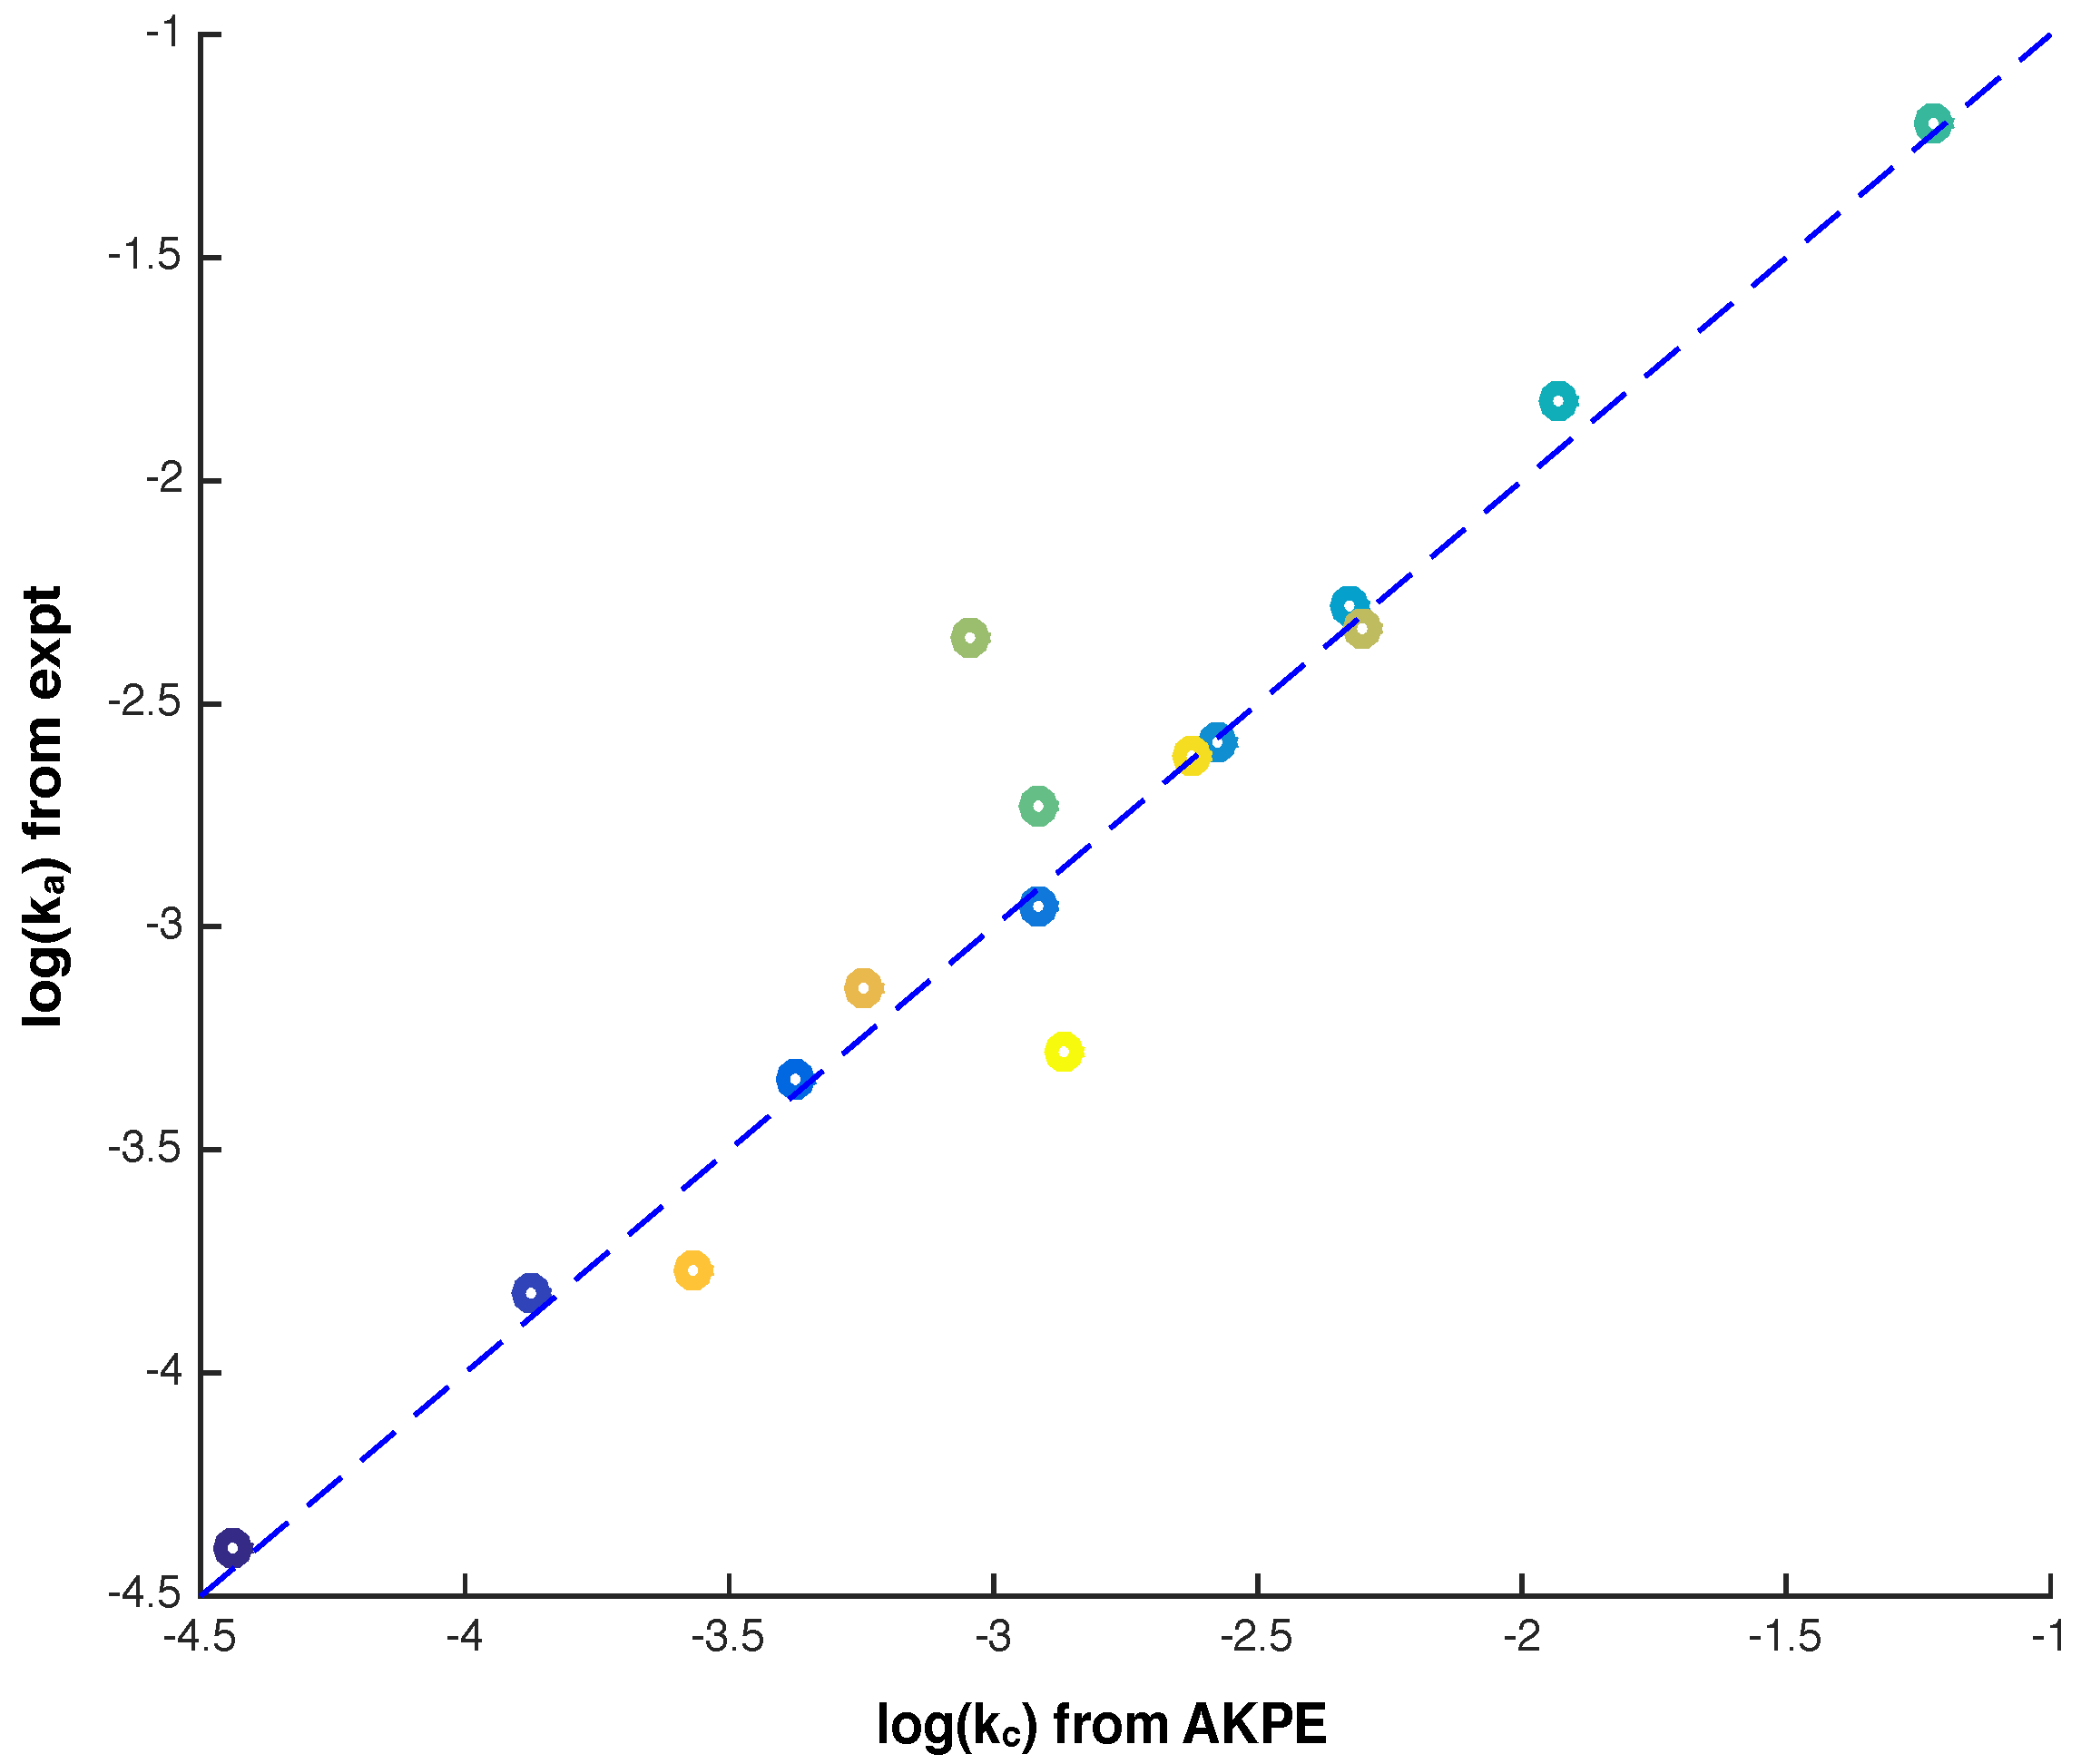
Experimentally observed dimerization curve of -C monomers are fitted to a monomer-dimer two-state interconversion model (SI S2. Equations (7)–(9) [41,42]) producing the overall association rate constant and the overall dissociation rate constant . In the model used by AKPE, the existence of the intermediate state introduced rate constants , , and . Bridging rate constant and the kinetic rate constants in AKPE, we arrive at the conversion formula Equation (22). The second term in the expression of should be around zero, therefore, the kinetic parameter generated by AKPE should equal to the according to Equation (22), calculated from AKPE in different temperatures and for different mutants are listed in Table 5, it agrees very well with the experimentally fitted association rate constant , common metrics measuring the agreement between these two methods such as MAE and RMSE were also given in the table, less than 5% of MAE and RMSE are observed between the predicted values and the experimental data, confirming the accuracy of AKPE at predicting kinetic rate constants Figure 9.
5.2.3. Comparison of AKPE with Other Reaction Dynamics Prediction Methods
In other research works, kinetic rate constants of Carbon Fiber Phenolic Resin (CFPR) Composites from pyrolysis reactions were predicted from thermogravimetric analysis. The thermogravimetric curves were modeled by neural networks using the Levenberg–Marquardt back propagation algorithm as the search algorithm. Similar to AKPE, their method also made use of an reaction model involving kinetic rate constants as the fitting equation. To predict reaction rate constants, the ANN they used had two hidden layers, one output layer. Their results yielded an RMSE value of 15%, comparable with the performance of AKPE (5%) [44].
Another research study employed ANN successfully predicted the dissolution kinetics of colemanite mineral. The input of ANN are experimental setup such as total pressure, reaction temperature, particle size, solid/liquid ratio, and stirring speed parameters while the output is dissolution rate. The ANN was trained by experimental data using Levenberg–Marquardt backpropagation algorithm. ANN structure is comprised of 6 input neurons, 7 first hidden, 4 second hidden, and one output layer. Their study had an lowest RMSE of 0.0073 and a highest of 0.9975, also comparable to that of AKPE [45].
The similarity of AKPE compared to these kinetic rate prediction methods is that they all used ANN to model experimental data, employed a search method of Levenberg–Marquardt backpropagation or PSO to find the optimum values of these parameters. However, AKPE is inherently more flexible by integrating user-defined reaction models; therefore, it can not only predict the kinetic rate constants, it also has the capability of predicting the reaction dynamics of a intermediate state based on a predefined reaction model. In sum, AKPE can cater to the needs of different experimental datasets or reaction systems given a predefined reaction model.
6. Conclusions
Simulation and prediction of chemical reactions can be an indispensable tool for understanding the mechanism of chemical or biological reactions [37,46,47]. Many reactions call for the participation of an intermediate state which prompts the reactions to proceed in an energetically favorable way. Unfortunately, for some reactions, experimental measurement failed to capture the intermediate state dynamics because of its low abundance; however, computational simulations can show its excellency in aiding experimental data at measuring intermediate state dynamics.
In this paper, we have presented a new method AKPE for predicting kinetic rate constants and reacting species concentration. AKPE employs neural networks to approximate experimental data and solve reaction model-derived differential equations, it also implements swarm intelligence algorithm such as PSO to optimize parameters and coefficients. AKPE couples neural network data fitting and equation-based swarm intelligence algorithm error minimization for kinetic rates and lowly-populated state dynamics prediction. As an extension of experimental data fitting, it is aimed to extract more information from experimental data and defined chemical reaction models, It obtains more information than a simple two-state fitting, and outputs previously undetected kinetic rates and undiscovered transitional state concentrations.
The applicability of AKPE at predicting chemical reaction dynamics was illustrated using two case studies, which yielded corresponding kinetic rate constants and the concentration curve of the intermediate state as a function of time. The computational accuracy of AKPE was quantified in standard variation of kinetic parameters, and it is well within tolerable ranges. As one of the most illustrious points of our work, we have also demonstrated that AKPE properly describes intermediate state dynamics in reaction systems where experimental or other methods failed. AKPE produced the intermediate state concentration curve with respect to time, which describes in detail how the concentration of the intermediate changes as the reaction progress, providing us a peek into the mechanism of reactions.
Another point worth noticing is that even though we used a primarily deterministic model, we also incorporated stochasticity into our system since a particular reacting species(intermediate state) exist only in a very low concentration. The stochasticity was incorporated into a time dependent reaction rate constant . This stochasticity helped us in producing the correct intermediate state dynamics.
To evaluate the validity of AKPE, we used SSA simulations, which produced similar results as AKPE, with standard errors (MSE, RMSE) within acceptable ranges, demonstrating the validity of AKPE. Moreover, by mathematical modeling, we arrive at a equation linking experimentally measured kinetic rate constants and all the rate constants used in our model, thereby, making up another method for validating AKPE, the result showed that experimental association rate constant also confirmed the validity of the predictions produced by AKPE.
The method AKPE proposed in this article is a robust predictor of lowly-populated reacting species, it also greatly improves the accuracy of kinetic rate prediction. It helps to identify the intermediate state that was previously invisible to experimental detections.
The novelty of AKPE lies in the fact that it is a roust and generally accurate predictor of the reaction dynamics associated with scantly-populated reacting species, which were unable to detect by experimental methods alone. AKPE utilized existing experimental data on chemical or biological reaction systems, greatly improved the accuracy of kinetic rate prediction compared with de novo computational methods. In the method architecture, AKPE combines the flexibility of neural networks, the generalizability of differential equations in modeling reaction systems and the global optimizing properties of PSO to obtain an accurate simulation of reaction systems.
7. Future Prospects
However, AKPE is strongly model dependent and did not include effects that might play roles in molecule–molecule association such as the electrostatic interactions, or more structurally relevant geometric constraints; therefore, incorporating more model dependent factors in AKPE will help in more clearly elucidating the chemical or biological reaction mechanisms.
One of the major problems of AKPE is its accuracy, the lower accuracy of some of our output data might be due to the limited amount of experimental data available, or it might arise from the variability of neural networks. However, more experimental datasets had been made public in recent years and deep neural networks have emerged. Due to our limited amount of experimental data available, only three layers of the neural network were explored; however, by incorporating deeper neural network architecture on larger datasets, the performance and robustness of AKPE will definitely be improved [48,49].
Supplementary Materials
The following are available at https://www.mdpi.com/article/10.3390/electronics11020216/s1, Figure S1: Schematic representation of the stochastic association model of monomeric , Figure S2: The 3D graph of as a function of and . Table S1: The resulting kinetic parameters for proteins at different temperature. Table S2: The parameters of the neural network in AKPE. Table S3: Best solution given by PSO. Table S4: Personal best fitness given by PSO.
Author Contributions
Conceptualization, F.T. and J.X.; methodology, F.T.; software, F.T.; validation, F.T.; resources, J.X.; data curation, F.T.; writing—original draft preparation, F.T.; writing—review and editing, J.X.; visualization, F.T.; supervision, J.X.; project administration, F.T.; funding acquisition, J.X. All authors have read and agreed to the published version of the manuscript.
Funding
This research was supported by State Commission of Science Technology of China (Natural Science Grant 62172014, 62172015, 61872166), The authors would like to acknowledge the support of Peking University for paying the Article Processing Charges (APC) of this publication.
Data Availability Statement
The data and codes in his article can be found at github upon publication.
Acknowledgments
The authors acknowledge Tianyi Wang and Xue Kang for some data contribution. This research was in part supported by National Natural Science Foundation of China.
Conflicts of Interest
The authors declare no conflict of interest. The funders had no role in the design of the study; in the collection, analyses, or interpretation of data; in the writing of the manuscript, or in the decision to publish the results’.
Abbreviations
The following abbreviations are used in this manuscript:
| SI | Supplementary Information |
| ANN | Artificial Neural Network |
| AKPE | ANN-Dependent Kinetic Parameter Extraction Method |
| SSA | Stochastic Simulation Algorithm |
| -C | C terminal domain of main protease of SARS VIrus |
| NN | Neural Networks |
| PSO | Particle Swarm Optimization |
| RMSE | Root Mean Square Error |
| MAE | Mean Absolute Error |
| MI | Intermediate State |
| D | Dimer |
| M | Monomer |
References
- Schreiber, G.; Haran, G.; Zhou, H.X. Fundamental aspects of protein-protein association kinetics. Chem. Rev. 2009, 109, 839–860. [Google Scholar] [CrossRef] [Green Version]
- Naik, P.A.; Zu, J. Modeling and simulation of spatial-temporal calcium distribution in T lymphocyte cell by using a reaction-diffusion equation. J. Bioinform. Comput. Biol. 2020, 18, 2050013. [Google Scholar] [CrossRef]
- Hartwell, L.H.; Hopfield, J.J.; Leibler, S.; Murray, A.W. From molecular to modular cell biology. Nature 1999, 402, C47–C52. [Google Scholar] [CrossRef]
- Tran, H.N.; Ramos-Mendez, J.; Shin, W.G.; Perrot, Y.; Faddegon, B.; Okada, S.; Karamitros, M.; Davidkova, M.; Stepan, V.; Incerti, S.; et al. Assessment of DNA damage with an adapted independent reaction time approach implemented in Geant4-DNA for the simulation of diffusion-controlled reactions between radio-induced reactive species and a chromatin fiber. Med. Phys. 2021, 48, 890–901. [Google Scholar] [CrossRef]
- Agbanusi, I.C.; Isaacson, S.A. A comparison of bimolecular reaction models for stochastic reaction-diffusion systems. Bull. Math. Biol. 2014, 76, 922–946. [Google Scholar] [CrossRef]
- Northrup, S.H. Diffusion-Controlled Ligand-Binding to Multiple Competing Cell-Bound Receptors. J. Phys. Chem. 1988, 92, 5847–5850. [Google Scholar] [CrossRef]
- Martinez, H.L. Kinetics of nonstationary, single species, bimolecular, diffusion-influenced irreversible reactions. J. Chem. Phys. 1996, 104, 2692. [Google Scholar] [CrossRef]
- Snopok, B.A.; Kostyukevich, E.V. Kinetic studies of protein-surface interactions: A two-stage model of surface-induced protein transitions in adsorbed biofilms. Anal. Biochem. 2006, 348, 222–231. [Google Scholar] [CrossRef] [PubMed]
- Peng, J.W.; Wagner, G. Investigation of protein motions via relaxation measurements. Methods Enzymol. 1994, 239, 563–596. [Google Scholar] [CrossRef] [PubMed]
- Wang, T.; Zhou, Z.; Bunagan, M.R.; Du, D.G.; Bai, Y.W.; Gai, F. Probing the folding intermediate of Rd-apocyt b(562) by protein engineering and infrared T-jump. Protein Sci. 2007, 16, 1176–1183. [Google Scholar] [CrossRef] [PubMed] [Green Version]
- Waudby, C.A.; Launay, H.; Cabrita, L.D.; Christodoulou, J. Protein folding on the ribosome studied using NMR spectroscopy. Prog. Nucl. Magn. Reson. Spectrosc. 2013, 74, 57–75. [Google Scholar] [CrossRef] [PubMed] [Green Version]
- Xu, Q.; Keiderling, T.A. Stop-flow kinetics studies of the interaction of surfactant, sodium dodecyl sulfate, with acid-denatured cytochrome c. Proteins 2006, 63, 571–580. [Google Scholar] [CrossRef] [PubMed]
- Baldwin, A.J.; Kay, L.E. NMR spectroscopy brings invisible protein states into focus. Nat. Chem. Biol. 2009, 5, 808–814. [Google Scholar] [CrossRef] [PubMed]
- Hornik, K.; Stinchcombe, M.; White, H. Multilayer Feedforward Networks Are Universal Approximators. Neural Netw. 1989, 2, 359–366. [Google Scholar] [CrossRef]
- Yang, S.S.; Yu, X.L.; Ding, M.Q.; He, L.; Cao, G.L.; Zhao, L.; Tao, Y.; Pang, J.W.; Bai, S.W.; Ding, J.; et al. Simulating a combined lysis-cryptic and biological nitrogen removal system treating domestic wastewater at low C/N ratios using artificial neural network. Water Res. 2021, 189, 116576. [Google Scholar] [CrossRef]
- Zhong, L.; Fang, Z.; Liu, F.; Yuan, B.; Zhang, G.; Lu, J. Bridging the Theoretical Bound and Deep Algorithms for Open Set Domain Adaptation. IEEE Trans. Neural Netw. Learn. Syst. 2021, 1–15. [Google Scholar] [CrossRef]
- Shi, Y.H.; Eberhart, R. Monitoring of particle swarm optimization. Front. Comput. Sci. China 2009, 3, 31–37. [Google Scholar] [CrossRef]
- Kennedy, J.; Eberhart, R. Particle swarm optimization. In Proceedings of the ICNN’95-International Conference on Neural Networks, Perth, Australia, 27 November–1 December 1995; pp. 1942–1948. [Google Scholar] [CrossRef]
- Kalantzis, G. Hybrid stochastic simulations of intracellular reaction-diffusion systems. Comput. Biol. Chem. 2009, 33, 205–215. [Google Scholar] [CrossRef] [PubMed] [Green Version]
- Ridgway, D.; Broderick, G.; Lopez-Campistrous, A.; Ru’aini, M.; Winter, P.; Hamilton, M.; Boulanger, P.; Kovalenko, A.; Ellison, M.J. Coarse-grained molecular simulation of diffusion and reaction kinetics in a crowded virtual cytoplasm. Biophys. J. 2008, 94, 3748–3759. [Google Scholar] [CrossRef] [PubMed] [Green Version]
- Hebert, D.J. Simulations of Stochastic Reaction-Diffusion Systems. Math. Comput. Simul. 1992, 34, 411–432. [Google Scholar] [CrossRef]
- Beidokhti, R.S.; Malek, A. Solving initial-boundary value problems for systems of partial differential equations using neural networks and optimization techniques. J. Frankl.-Inst.-Eng. Appl. Math. 2009, 346, 898–913. [Google Scholar] [CrossRef]
- Parisi, D.R.; Mariani, M.C.; Laborde, M.A. Solving differential equations with unsupervised neural networks. Chem. Eng. Process.-Process. Intensif. 2003, 42, 715–721. [Google Scholar] [CrossRef]
- Belli, M.R.; Conti, M.; Crippa, P.; Turchetti, C. Artificial neural networks as approximators of stochastic processes. Neural Netw. 1999, 12, 647–658. [Google Scholar] [CrossRef]
- Turchetti, C.; Crippa, P.; Pirani, M.; Biagetti, G. Representation of nonlinear random transformations by non-Gaussian stochastic neural networks. IEEE Trans. Neural Netw. 2008, 19, 1033–1060. [Google Scholar] [CrossRef]
- Isaacson, S.A. A convergent reaction-diffusion master equation. J. Chem. Phys. 2013, 139, 054101. [Google Scholar] [CrossRef] [PubMed] [Green Version]
- Fange, D.; Berg, O.G.; Sjoberg, P.; Elf, J. Stochastic reaction-diffusion kinetics in the microscopic limit. Proc. Natl. Acad. Sci. USA 2010, 107, 19820–19825. [Google Scholar] [CrossRef] [Green Version]
- Engblom, S.; Ferm, L.; Hellander, A.; Lotstedt, P. Simulation of Stochastic Reaction-Diffusion Processes on Unstructured Meshes. Siam J. Sci. Comput. 2009, 31, 1774–1797. [Google Scholar] [CrossRef] [Green Version]
- Gillespie, D.T. Exact Stochastic Simulation of Coupled Chemical-Reactions. Abstr. Pap. Am. Chem. Soc. 1977, 173, 128. [Google Scholar] [CrossRef]
- Erban, R.; Chapman, S.J. Stochastic modelling of reaction-diffusion processes: Algorithms for bimolecular reactions. Phys. Biol. 2009, 6, 046001. [Google Scholar] [CrossRef] [Green Version]
- Peter, W.; De Paula Atkins, J. The Elements of Physical Chemistry; Oxford University Press: Oxford, MS, USA, 2013. [Google Scholar]
- Gillespie, D.T. Approximate accelerated stochastic simulation of chemically reacting systems. J. Chem. Phys. 2001, 115, 1716–1733. [Google Scholar] [CrossRef]
- Yao, H.; Liu, J.; Xu, M.; Ji, J.; Dai, Q.; You, Z. Discussion on molecular dynamics (MD) simulations of the asphalt materials. Adv. Colloid Interface Sci. 2021, 299, 102565. [Google Scholar] [CrossRef]
- Ahmed, N.; Elsonbaty, A.; Raza, A.; Rafiq, M.; Adel, W. Numerical simulation and stability analysis of a novel reaction-diffusion COVID-19 model. Nonlinear Dyn. 2021, 106, 1–18. [Google Scholar] [CrossRef]
- Nass, K.J.; Ilie, I.M.; Saller, M.J.; Driessen, A.J.M.; Caflisch, A.; Kammerer, R.A.; Li, X. The role of the N-terminal amphipathic helix (N-AH) in bacterial YidC: Insights from functional studies, the crystal structure and molecular dynamics simulations. Biochim. Biophys. Acta Biomembr. 2021, 1864, 183825. [Google Scholar] [CrossRef] [PubMed]
- Liu, F.; Zhang, G.Q.; Lu, J. Heterogeneous Domain Adaptation: An Unsupervised Approach. IEEE Trans. Neural Netw. Learn. Syst. 2020, 31, 5588–5602. [Google Scholar] [CrossRef] [Green Version]
- Sicard, J.; Mirade, P.S.; Portanguen, S.; Clerjon, S.; Kondjoyan, A. Simulation of the gastric digestion of proteins of meat bolus using a reaction-diffusion model. Food Funct. 2018, 9, 6455–6469. [Google Scholar] [CrossRef] [PubMed] [Green Version]
- Batada, N.N.; Shepp, L.A.; Siegmund, D.O. Stochastic model of protein-protein interaction: Why signaling proteins need to be colocalized. Proc. Natl. Acad. Sci. USA 2004, 101, 6445–6449. [Google Scholar] [CrossRef] [Green Version]
- Kim, H.; Shin, S.; Shin, K.J. On the numerical solutions of kinetic equations for diffusion-influenced bimolecular reactions. J. Chem. Phys. 1998, 108, 5861. [Google Scholar] [CrossRef]
- Eberhart, R.C.; Shi, Y.H. Tracking and optimizing dynamic systems with particle swarms. In Proceedings of the 2001 Congress on Evolutionary Computation, Seoul, Korea, 27–30 May 2001; Volumes 1–2, pp. 94–100. [Google Scholar]
- Kang, X.; Zhong, N.; Zou, P.; Zhang, S.; Jin, C.; Xia, B. Foldon unfolding mediates the interconversion between M(pro)-C monomer and 3D domain-swapped dimer. Proc. Natl. Acad. Sci. USA 2012, 109, 14900–14905. [Google Scholar] [CrossRef] [PubMed] [Green Version]
- Zhong, N.; Zhang, S.; Xue, F.; Kang, X.; Zou, P.; Chen, J.; Liang, C.; Rao, Z.; Jin, C.; Lou, Z.; et al. C-terminal domain of SARS-CoV main protease can form a 3D domain-swapped dimer. Protein Sci. 2009, 18, 839–844. [Google Scholar] [CrossRef] [Green Version]
- Sayyidmousavi, A.; Rohlf, K.; Ilie, S. A hybrid method for micro-mesoscopic stochastic simulation of reaction-diffusion systems. Math. Biosci. 2019, 312, 23–32. [Google Scholar] [CrossRef]
- Bezerra, E.M.; Bento, M.S.; Rocco, J.A.F.F.; Iha, K.; Lourenco, V.L.; Pardini, L.C. Artificial neural network (ANN) prediction of kinetic parameters of (CRFC) composites. Comput. Mater. Sci. 2008, 44, 656–663. [Google Scholar] [CrossRef]
- Elcicek, H.; Akdogan, E.; Karagoz, S. The Use of Artificial Neural Network for Prediction of Dissolution Kinetics. Sci. World J. 2014, 2014, 194874. [Google Scholar] [CrossRef] [Green Version]
- Guo, C.; Niu, Y. Cellular Automaton Simulation for Degradation of Poly Lactic Acid with Acceleratable Reaction-Diffusion Model. ACS Biomater. Sci. Eng. 2019, 5, 1771–1783. [Google Scholar] [CrossRef] [PubMed]
- Potse, M. Scalable and Accurate ECG Simulation for Reaction-Diffusion Models of the Human Heart. Front. Physiol. 2018, 9, 370. [Google Scholar] [CrossRef] [PubMed] [Green Version]
- Jin, X.; Chen, Y.M.; Wang, L.; Han, H.L.; Chen, P. Failure prediction, monitoring and diagnosis methods for slewing bearings of large-scale wind turbine: A review. Measurement 2021, 172, 108855. [Google Scholar] [CrossRef]
- Yu, H.; Tao, J.; Qin, C.; Liu, M.; Xiao, D.; Sun, H.; Liu, C. A novel constrained dense convolutional autoencoder and DNN-based semi-supervised method for shield machine tunnel geological formation recognition. Mech. Syst. Signal Process. 2022, 165, 108353. [Google Scholar] [CrossRef]
Figure 1.
General architecture of the neural network employed by AKPE. The first layer is the input layers, with m nodes signifying m experimental data points. The second layer is where each nodes were transformed by activation function () and other reaction model related transformations (first/second order derivatives or reacting species calculations.). The third layer is the outputs from the neural network.

Figure 2.
A flow chart depicting the the main steps and calculation mechanism of AKPE. The mud-colored box represents outputs from neural networks, which are adjusted according to the results produced by PSO, the outputs of PSO are parameters from neural networks w, b, and coefficients from the reaction-derived differential equations.

Figure 3.
Association pathways of SARS-CoV -C. (a) Two monomers colored separately in yellow and green. (b) When the interparticle distance between two monomers is smaller than , then two monomers will interact with each other, forming an monomeric-like intermediate state. (c) The intermediate has a high reaction propensity, easily forming dimers with other intermediate state within reaction radius . This hypothetical reaction model was inferred from research papers [41,42].

Figure 4.
The minimization of overall absolute error with the number of epochs. Results under different temperatures are represented by different thin colored lines (as indicated in the legend of the figure), the progression to final convergence of total error are observed in the figure.
Figure 4.
The minimization of overall absolute error with the number of epochs. Results under different temperatures are represented by different thin colored lines (as indicated in the legend of the figure), the progression to final convergence of total error are observed in the figure.

Figure 5.
AKPE fitting of experimental data at various temperatures. The experimental curves are drawn as blue lines while neural network curve are represented as colored lines interspersed with markers: 303 K (30 C) as green lines with flower markers, 306 K (33 C) with red lines and circular marker, 308 K (35 C) with cyan lines with diamond markers and purple lines represents 310 K (37 C) with star markers, reaction speed at 310 K is faster, which account for the shorter curve.

Figure 6.
Curves demonstrating intermediate state concentration calculated from AKPE-derive kinetic parameters. (a) The change of wildtype intermediate concentration with time at 308 K. (b) Intermediate state curve at 310 K. (c) intermediate state curve at 303 K (green) and 306 K (pink). The unit of intermediate state concentrations are Molar.

Figure 7.
Variation of parameters with changing temperature. The value of each parameters change directionally with increasing temperature. (a) The value of ; (b) the value of ; (c) the value of ; (d) the value of ; (e) the value of ; (f) the value of .
Figure 7.
Variation of parameters with changing temperature. The value of each parameters change directionally with increasing temperature. (a) The value of ; (b) the value of ; (c) the value of ; (d) the value of ; (e) the value of ; (f) the value of .

Figure 8.
Simulation result of SSA (red and blue lines signifying monomer and dimer, respectively) in comparison with that of AKPE (red and blue empty circles). Apparent correspondence between AKPE and SSA simulation results is observed.
Figure 8.
Simulation result of SSA (red and blue lines signifying monomer and dimer, respectively) in comparison with that of AKPE (red and blue empty circles). Apparent correspondence between AKPE and SSA simulation results is observed.

Figure 9.
Comparison between the predicted association constant produced by AKPE and experimentally measured association constant , agreement between the two can be observed.
Figure 9.
Comparison between the predicted association constant produced by AKPE and experimentally measured association constant , agreement between the two can be observed.

Table 1.
The upper and lower limits for each of the input parameters of AKPE.
| Parameter | Upper Limit | Lower Limit |
|---|---|---|
| Number of nodes | 5 | 5 |
| Number of iterations | 30,000 | 30,000 |
| 100 | ||
| 2 | 1 | |
| 2 | 1 | |
| 2 | 1 | |
| w | 1/2log2 | 1/2log2 |
| 0.5 + log2 | 0.5 + log2 | |
| 0.5 + log2 | 0.5 + log2 | |
| N | 20 | 20 |
Table 2.
Kinetic parameters for -C WT and its mutants at different temperatures.
| Rates | Sequence | ||||||
|---|---|---|---|---|---|---|---|
| Mutant | |||||||
| WT/303K | 187–306 | ||||||
| WT/306K | 187–306 | ||||||
| WT/308K | 187–306 | ||||||
| WT/310K | 187–306 | ||||||
| C301/310K | 187–301 | ||||||
| C298/310K | 187–298 | 63.60 | |||||
| C296/310K | 187–296 | 55.20 | |||||
| C295/310K | 187–295 | 50.80 | |||||
| R112A/310K | R112A | 75.30 | |||||
| P107A/310K | P107A | 53.60 | |||||
| V110A/310K | V110A | 63.50 | |||||
| D109A/310K | D109A | 50.90 | |||||
| F108A/310K | F108A | 64.00 | |||||
| C114A/310K | C114A | 63.70 | |||||
| *2/310K | *1 | 63.00 |
Descriptions of mutants can be found at SI S3. * indicate mutant F108AD109A.
Table 3.
Simulation parameter values.
| Parameter | Value |
|---|---|
| 56.80 | |
Table 4.
Dimer(D) and monomer(M) percentage(%) prediction by AKPE and SSA.
| Time(s) | AKPE(D) | AKPE(M) | SSA(D) | SSA(M) | MAE | RMSE |
|---|---|---|---|---|---|---|
| 0 | 0.00 | 100.00 | 0.00 | 100.00 | 0.93 | 1.19 |
| 1800 | 1.97 | 98.03 | 0.50 | 99.50 | ||
| 3600 | 3.20 | 96.80 | 1.90 | 98.10 | ||
| 7200 | 4.67 | 95.33 | 4.60 | 95.40 | ||
| 10,800 | 5.41 | 94.59 | 7.20 | 92.80 |
Table 5.
Comparison of the kinetic constants calculated from AKPE and experiments.
| Construct | Residues | AKPE | Expt | MAE | RMSE |
|---|---|---|---|---|---|
| -C-WT at 306 K | 187–306 | ||||
| -C-WT/308 K | 187–306 | - | - | ||
| -C-WT/310 K | 187–306 | - | - | ||
| -C301/310 K | 187–301 | - | - | ||
| -C298/310 K | 187–298 | - | - | ||
| -C296/310 K | 187–296 | - | - | ||
| -C295/310 K | 187–295 | ||||
| -CC114A/310 K | C114A | ||||
| -CR112A/310 K | R112A | - | - | ||
| -CV110A/310 K | V110A | - | - | ||
| -CF108A/310 K | F108A | - | - | ||
| -CP107A/310 K | P107A | - | - | ||
| -CD109A/310 K | D109A | - | - | ||
| -CF108AD109A/310 K | F108AD109A |
Publisher’s Note: MDPI stays neutral with regard to jurisdictional claims in published maps and institutional affiliations. |
© 2022 by the authors. Licensee MDPI, Basel, Switzerland. This article is an open access article distributed under the terms and conditions of the Creative Commons Attribution (CC BY) license (https://creativecommons.org/licenses/by/4.0/).
Share and Cite
MDPI and ACS Style
Tan, F.; Xu, J. Simulation of Biochemical Reactions with ANN-Dependent Kinetic Parameter Extraction Method. Electronics 2022, 11, 216. https://doi.org/10.3390/electronics11020216
AMA Style
Tan F, Xu J. Simulation of Biochemical Reactions with ANN-Dependent Kinetic Parameter Extraction Method. Electronics. 2022; 11(2):216. https://doi.org/10.3390/electronics11020216
Chicago/Turabian StyleTan, Fei, and Jin Xu. 2022. "Simulation of Biochemical Reactions with ANN-Dependent Kinetic Parameter Extraction Method" Electronics 11, no. 2: 216. https://doi.org/10.3390/electronics11020216
Note that from the first issue of 2016, this journal uses article numbers instead of page numbers. See further details here.