Abstract
Melanoma is developed due to disturbances in the melanocytes of the skin cells. Every human skin color is defined by melanin, which is produced by melanocytes. Around the globe, the melanoma probability percentage age intervals are from 70 and older. Melanoma is a lethal form of cancer and can easily spread to other parts of the body. It needs to be detected and treated early to avoid mortality. Early diagnosis can be made by an automated diagnosis system to help clinicians for larger populations. In the proposed system, the input images are taken from Med Node, PH2, and HAM10000 Kaggle and given to the pre-trained architectures such as AlexNet, Vgg-16, ResNet50, Inception V3, and GoogleNet. The performance is analyzed using accuracy (AC), sensitivity (SE), specificity (SP), positive predictive value (PPV), and negative predictive value (NPV). Among all the architectures, InceptionV3 obtained the best accuracy of 97.1%, 97.2%, and 96.2% for the MedNode, PH2, and HAM10000 Kaggle datasets, respectively, in melanoma identification.
1. Introduction
Melanoma is a lethal form of cancer. From an ICMR survey, it was found that India has a low incidence of skin cancer relative to all other cancers when compared to other parts of the world. According to a recent Indian Council of Medical Research (ICMR) study, melanoma cases are most common in Northern India, but non-melanoma skin cancer cases are most common in the Northeast, particularly in Nagaland [1]. A survey by the US Cancer Institute estimated that in 2022, almost 7650 deaths will be due to melanoma of the skin. Around the globe, the probability percentage age intervals of those mostly affected by melanoma are from the age group of 70 and older [2]. Melanoma is developed due to disturbances in the melanocytes of the skin cells. Every human skin color is defined by melanin, which is produced by melanocytes [3]. Skin lesion investigation is made difficult by the lack of standardized diagnosis guidelines. Additionally, there are number of difficulties with dermoscopy picture analysis. Even the melanoma and non-melanoma lesions have a significant degree of visual similarity. In addition, skin lesion analysis is made more difficult by ambiguous boundaries, the presence of artifacts, and obstacles such as hairs and veins [4]. Dermoscopy is an important tool for the early detection of melanoma in the hands of experienced practitioners, improving the diagnostic accuracy above clinical eye assessment [5,6].
Medical imaging is urgently needed to disclose the internal and hidden structures beneath the skin given the rising prevalence of severe skin illnesses including skin cancer. Dermatologists find it difficult to appropriately identify patients because the majority of skin illnesses share similar symptoms. Therefore, the accurate early detection of skin illnesses and the diagnosis of dermoscopy images can both benefit greatly from the use of machine and deep learning techniques [7,8,9]. Deep learning has been used in recent studies to train data-driven features for better generalization and accuracy. To diagnose disease based on deep features of skin lesion images utilizing a SoftMax output layer in a convolutional neural network is a typical strategy in this field [10,11,12,13]. A novel problem of cross-domain skin disease recognition is given using two methods. By fine-tuning the network on two datasets related to skin diseases, we examine a two-step progressive transfer learning technique starting from a fully supervised deep convolutional neural network classifier that has been pre-trained on ImageNet. Next, we recommend employing adversarial learning as a domain adaptation strategy to execute invariant attribute translation from source to target domain in order to improve recognition performance. In order to compare the approaches, we look at the generalization capability of the trained model for melanoma identification, cancer detection, and cross-modality learning tasks using two skin image datasets collected from diverse clinical situations and cohorts with various disease distributions. The results of the studies demonstrate how well our approach works for resolving the domain shift issue [14].
Deep learning automates feature extraction by using the back propagation algorithm, which makes it effective for general image classification where statistical methods call for manually created features. When used to identify melanoma, convolutional neural networks outperformed statistical image classification techniques in terms of accuracy [15,16]. The accuracy of classifiers can be changed by even minor changes to the dataset’s properties. Investigative work is carried out on the transfer learning problems in this instance. To produce reliable prediction models and to have a more adaptable system architecture that can cope with changes in the training datasets, continual training−test iterations are required. The creation and application of a hybrid architecture based on cloud, fog, and edge computing offers a service for melanoma detection using dermoscopy and clinical images. Tests using a single computer and various distribution methods demonstrate how a distributed approach ensures output achievement in a significantly shorter amount of time [17]. It is suggested to develop an intelligent Region of Interest (ROI)-based system to distinguish between melanoma and nevus cancer utilizing transfer learning. The ROIs are extracted from the photos using a better version of the k-mean technique. These ROI-based approaches aid in the identification of distinguishing characteristics because the system is trained using images that only include melanoma cells. For ROI images from the DermIS and DermQuest datasets, we also employ a Convolutional Neural Network (CNN)-based transfer learning model with data augmentation. DermIS and DermQuest accuracy rates provided by the proposed system are 97.9% and 97.4%, respectively [18].
The fully autonomous ensemble deep learning approaches combine two of the best segmentation techniques, namely DeeplabV3+ (semantic segmentation) and Mask R-CNN (instance segmentation), to produce considerably more accurate results in a variety of skin lesion datasets with noisy expert annotations. In accordance with our assertion, Ensemble-L and Ensemble-A fared best in sensitivity while Ensemble-S performed best in specificity in both the PH2 dataset and the ISIC 2017 testing set [19]. The combination of deep learning and local descriptor encoding is proposed as a method for dermoscopy image recognition. For example, using an extremely deep residual neural network that has been pretrained on a sizable dataset of real images, deep representations of a rescaled dermoscopy image are first extracted. Then, to create a global image representation, these local deep descriptors are combined with orderless visual statistic features based on Fisher vector (FV) encoding. Finally, melanoma images are classified using the FV encoded representations and a support vector machine with a Chi-squared kernel. With less training data, the suggested strategy can produce more discriminative features to handle both significant variations within melanoma classes and modest variations between melanoma and non-melanoma classes [20]. Unit-vise is a transition and additional supervision layer-based multistage deep residual neural network. As a result, the network is forced to learn better features through the use of supervision and transition layers and is given direct access to the gradients from the loss function. The ISIC-18 challenge experiment revealed a considerable improvement (0.891) in comparison to the top five outcomes of the ISIC-18 challenge [21].
For effective learning and feature extraction, an upgraded encoder−decoder network is developed, which connects the encoder and decoder sub-networks by a series of skip routes and lowers the semantic level of the encoder feature maps relative to the decoder feature maps. For the pixel-wise categorization of melanoma lesions, the system uses a multi-stage, multi-scale approach and the SoftMax classifier. We create a brand-new technique called Lesion-classifier that divides skin lesions into melanoma and non-melanoma based on the outcomes of pixel-wise classification. On the ISIC 2017 dataset and the PH2 datasets, the attained accuracy and dice coefficient are 95% and 92%, respectively [22]. The combination of enhanced convolutional neural networks and a test-time regularly spaced shifting method is used for the categorization of skin lesions. The shifting method creates various iterations of the test input image that have their displacement vectors moved in the plane of potential shifts using a regular lattice. Each classifier in an ensemble will then receive these shifted copies of the test image. The final output is produced by combining all of the classifier’s outputs. The findings of the experiment demonstrate a considerable increase in accuracy and F-score over the well-known HAM10000 dataset. It is specifically shown that our approach, which combines ensembles with test-time regularly spaced shifting, produces superior results than either of the two approaches used independently [23]. The performance of the ConvNet models is improved by creating a cascaded ensembled network that combines ConvNet and manually created multi-layer perceptron features. Convolutional neural networks are used in this model to mine handcrafted and non-handcrafted image attributes, as well as color and texture moments. It is shown that the accuracy of the ensembled deep learning model has increased from the convolutional neural network model’s 85.3%, to 98.3% [24].
Skin lesion categorization for benign and malignant melanocytic nevi was established utilizing convolutional SNNs and the unsupervised spike-timing dependent plasticity (STDP) learning rule. Our networks achieve an average accuracy of 83.8% due to sparse spike coding, efficient temporal coding, event-driven learning, and a winner-take-all (WTA) mechanism [25]. The diagnosis of melanoma from dysplastic nevi was made with the use of the multi-instance learning (MIL) method. The MIL approach can be used as one of the appropriate instruments for diagnosing skin cancer, according to simulation results. MIL, on the other hand, was a straightforward weakly supervised classification algorithm with sets that, in some circumstances, can yield worse results [26,27]. Although highly deep CNNs or integrated deep network models can increase classification accuracy, a more major issue with hardware resource consumption will arise, making it more challenging to implement diagnostic systems on small portable devices. Additionally, recent studies have shown that whether transfer learning is successful depends on the distance between the data used to pretrain CNNs and the data in the actual classification task [28]. Numerous effective DCNN models have shown that network depth has a significant impact on their effectiveness. Deep networks may now be designed and trained thanks to the growing accessibility of massive datasets, sophisticated computer hardware, and computational techniques such as rectified linear unit activation, dropout, batch normalization, and layer normalization. However, it is still challenging to train an extremely deep model network due to degradation issues [29,30]. In this paper, three different dermoscopy datasets include images of various skin tones, and climatic conditions; food habits are analyzed using five pre-trained deep learning algorithms for the classification of melanoma and non-melanoma. Section 2 contains the materials and methods, the methodology is in Section 3, Section 4 contains results and discussion, and the conclusion is in Section 5.
2. Materials and Methods
The proposed system used three different datasets. The datasets are given to the five different pre-trained deep learning architectures. Table 1 gives the details of the three datasets.

Table 1.
Detail of datasets and links.
3. Methodology
The proposed system uses five models that have already been trained (ALEXNET, VGG-16, RESNET50, INCEPTION V3, and GOOGLENET), and all of the models went through the same training process. All of the pre-trained models initialized their weights from the ImageNet database before training on the dataset. The layers utilized in the architecture and the straightforward model are the convolutional layer, normalization layer, ReLU layer, pooling layer, fully connected layer (FC layer), and SoftMax layer. According to the validation data and frequency, all of the proposed pre-trained networks are trained using the stochastic gradient descent momentum at a learning rate of 0.001, with a maximum of 50 epochs. The information is randomly shuffled each epoch. The network has been taught and offers reliable validation. The proposed pre-trained models can be adjusted or altered based on the classification stages by the advantages of transfer learning, and the output is classified as melanoma and non-melanoma in the testing phase. Figure 1 depicts the proposed system’s framework.
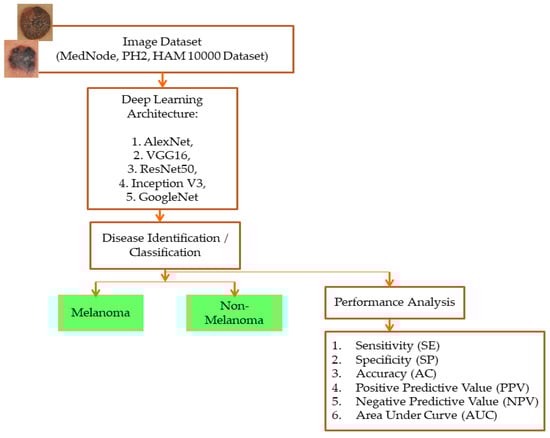
Figure 1.
Framework of the proposed system.
Specificity (SP), sensitivity (SE), accuracy (AC), negative predictive value (NPV), positive predictive value (PPV), the area under curve (AUC), and the receiver operating characteristic (ROC) curve make up the performance analysis employed in the proposed system. All performance analysis is calculated using true positive (TP) and true negative (TN) values. AUC, which gives the classification stage’s ability, summarizes the ROC curve. It is assumed that the classes have been accurately classified if the AUC value is 1. The classes are not accurately categorized if AUC is 0. The classes are only partially categorized if the AUC value is between 0.5 and 1. The ROC plot for class detection is between the SE and 1-SP.
The mathematical equations for each performance metric are given below:
3.1. ALEXNET
With zero center normalization, the pre-trained architecture is called ALEXNET, and the input dermoscopy image with size/operation is resized to 227*227*3. The AlexNet structure has the size and operation of the 5 convolutional layers combined with the Rectifier Linear Unit (ReLU) activation function. According to the convolutional layer’s size and operation, the filters differ as 11*11, 5*5, and 3*3. Each convolutional layer is arranged with size and operation, Overlapping Max Pooling, Stride, and Kernel. The 3*3 filter/kernels and 2 strides are used in the Max Pooling layer. The depth of each of the five convolutional layers along with ReLU activation function varies as 96, 256, 384, 384, and 256. Zero padding is seen in conv1, but from conv2 to conv5 it is noted as 2, 1, 1, and 1. Finally, 4096 channels and 1000 classes can be changed according to the need of the classification layers. The architecture of ALEXNET is shown in Figure 2.
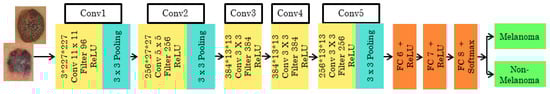
Figure 2.
Pre-trained architecture of ALEXNET.
3.2. VGG-16
The 16-layer pre-trained architecture has the initial image input of the size 224*244*3. It is then executed 5 times, with 2 convolution layers and max pooling. Each time the size, filter size, and stride vary according to the layer. The feature map is the output given to the next layer from the previous layer. The feature map ranges from 1 to 512. In this network, the ReLU activation function with the SoftMax classifier is used. The stride varies as 1 and 2 for the consecutive convolutional layer and max pooling layer used to filter the input volume. The 3*3 filter/kernel size, at the end of three fully connected input layers, 13, 14, and 15, are sized 25,088, and 4096 with the ReLU activation function. From the 16th input layer, the output is obtained with a size of 1000. The architecture of VGG16 is shown in Figure 3.
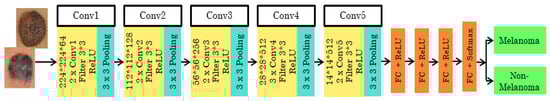
Figure 3.
Pre-trained VGG16 architecture.
3.3. RESNET50
The Resnet50 architecture has 5 stages combined with two layers known as convolutional and identity block/layer. The Resnet50 architecture is shown in Figure 4. In Stage 1, the skin cancer input image is given to the first layer which consists of 7*7 size, 64 different filtering layers, and size two strides. In Stage 2, the feature region is selected by the max pooling layer with stride 2. The stage 2 convolution layer consists of nine layers. Stage 3, 4, and 5 have 12, 18, and 9 layers, respectively, which include filtering and activation layers. In the end, the average pooling is connected to 1000 nodes, and at the end, 1 SoftMax function gives us the output. The output is classified as melanoma or non-melanoma.
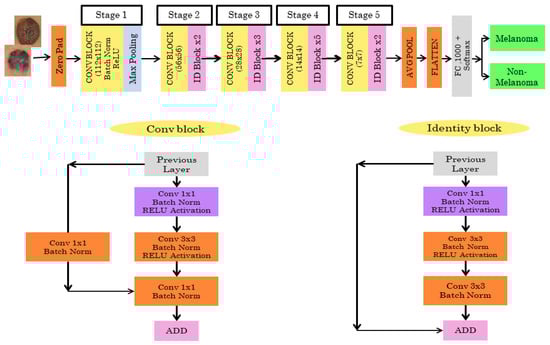
Figure 4.
Pretrained RESNET50 architecture.
3.4. INCEPTIONV3
For the Inception V3 architecture, where the input image dataset with the ratio of 299*299*3 is to be given, the final result is obtained with the size of 8*8*2048. The model has 42 layers consisting of many convolutions with a patch stride size of 3*3. There are three modules present. Module 1 has 3* inception with 35*35*288 input size. Module 2 has 5*inception with an input size of 17*17*768. The 2* inception with the input size of 8*8*1280 is for module 3. The pooling layer has an 8*8 patch size. The classifier used is SoftMax, which tells us whether it is melanoma or non-melanoma. The INCEPTIONV3 architecture is shown in Figure 5.
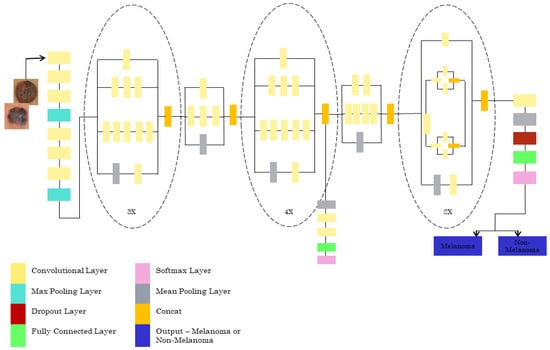
Figure 5.
Pretrained INCEPTIONV3 architecture.
3.5. GOOGLENET
The pretrained GOOGLENET architecture consists of 22 deep layers and is shown in Figure 6. The input size of the architecture is 224*224. The inception block in the network is used 3 times, which includes a convolutional layer of 1*1, 2*2, and 3*3 sizes. Two maximum poolings of 3*3 and one global average pool are used. This architecture consumes less power and less usage of memory. The final layer of the GOOGLENET architecture contains 2048*1000 fully connected layers, which can be changed according to the classification layers needed.
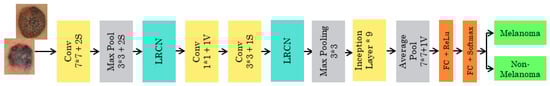
Figure 6.
Pretrained GOOGLENET architecture.
4. Results and Discussion
The three datasets—MedNode, PH2, and HAM10000 Kaggle—are given as input data to the pretrained architectures AlexNet, Vgg-16, ResNet50, InceptionV3, and GoogleNet, which are used as the final classification layers in the fully connected layer. The target set for the classification is also given to this layer and this is the decision-making layer. The input size, a parameter which is used for all models, is the same, except that the number of layers differs according to the network used. The proposed parameters are tabulated in Table 2. The performance analysis for the MedNode dataset, PH2 dataset, and HAM10000 Kaggle dataset is given in Table 3, Table 4 and Table 5. The receiver operating characteristic curve (ROC curve) graph, which shows the classification model at all thresholds, is given in Figure 7, Figure 8 and Figure 9. The ROC curve is between the detection rate and false positive rate. If the values are above the saturation point, the accuracy is higher; thus, the performance and classification of the network model are considered the best classification model.
Table 2.
Proposed parameters of the five different architectures.
Table 3.
Performance analysis of MedNode dataset for the five architectures.
Table 4.
Performance analysis of PH2 dataset for the five architectures.
Table 5.
Performance analysis of HAM10000 Kaggle dataset for the five architectures.
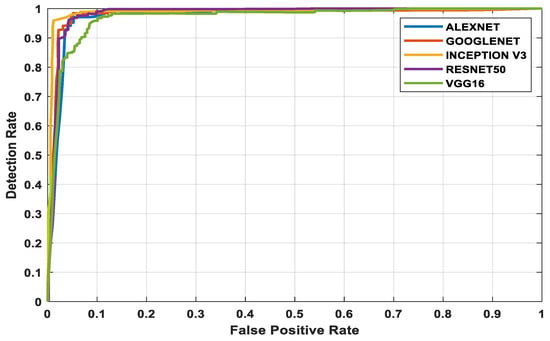
Figure 7.
MedNode dataset’s ROC curve for all architectures.
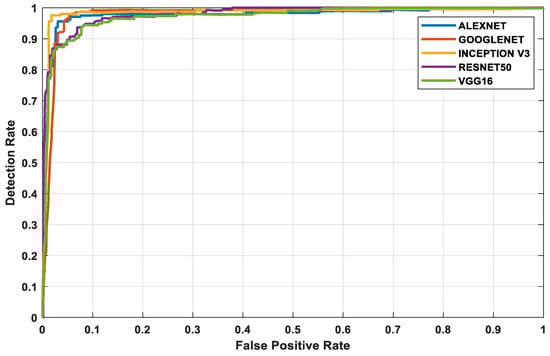
Figure 8.
PH2 dataset’s ROC curve for all architectures.
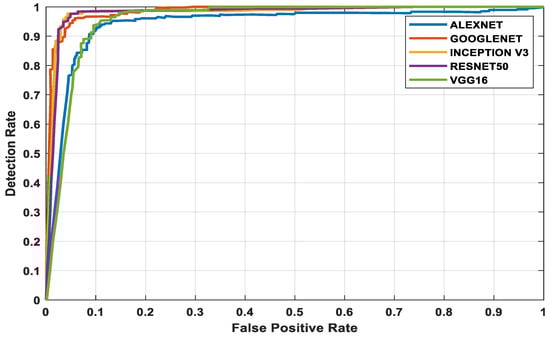
Figure 9.
HAM10000 Kaggle dataset’s ROC curve for all architectures.
5. Conclusions
The advanced world is full of hazardous diseases and skin cancer is one of them. Early diagnosis is the ideal course of action. Medical knowledge has advanced in the modern world. Previously, skin cancer had to be manually identified, which took time and money. However, with the advancement of deep learning in the field of medical science, it has become more straightforward. Deep learning techniques, most notably CNN, can identify skin cancer fast and are less expensive. In this paper, five pretrained architectures (AlexNet, Vgg-16, ResNet50, Inception V3, and GoogleNet) are implemented using MedNode, PH2, and HAM10000 datasets. The accuracy obtained using Inception V3 (97.2%) is higher in all the comparisons among the datasets. In future work, different kinds of real-time databases from various skin regions, skin tones, geographical environments, and food habits can be collected for clinical validation by the developed methods. The algorithms can also be fine-tuned to help clinicians. Though all the methods give higher accuracies, the research is an ongoing process for practical clinical validation.
Author Contributions
Conceptualization, J.P.J.; methodology, A.G.P.H.; validation, A.J.; supervision, J.H. All authors have read and agreed to the published version of the manuscript.
Funding
This research received no external funding.
Conflicts of Interest
The authors declare no conflict of interest.
References
- Pereira, P.M.M.; Thomaz, L.A.; Tavora, L.M.N.; Assuncao, P.A.A.; Fonseca-Pinto, R.; Paiva, R.P.; Faria, S.M.M. Multiple Instance Learning Using 3D Features for Melanoma Detection. IEEE Access 2022, 10, 76296–76309. [Google Scholar] [CrossRef]
- American Cancer Society. Available online: https://www.cancer.org/research/cancer-facts-statistics.html (accessed on 1 January 2022).
- Mustafa, S.; Dauda, A.B.; Dauda, M. Image processing and SVM classification for melanoma detection. In Proceedings of the 2017 International Conference on Computing Networking and Informatics (ICCNI), Lagos, Nigeria, 29–31 October 2017. [Google Scholar]
- Song, L.; Lin, J.Z.; Wang, Z.J.; Wang, H.Q. An End-to-End Multi-Task Deep Learning Framework for Skin Lesion Analysis. IEEE J. Biomed. Health Inform. 2020, 24, 2912–2921. [Google Scholar] [CrossRef] [PubMed]
- Hagerty, J.R.; Stanley, R.J.; Almubarak, H.A.; Lama, N.; Kasmi, R.; Guo, P.; Drugge, R.J.; Rabinovitz, H.S.; Oliviero, M.; Stoecker, W.V. Deep Learning and Handcrafted Method Fusion: Higher Diagnostic Accuracy for Melanoma Dermoscopy Images. IEEE J. Biomed. Health Inform. 2019, 23, 1385–1391. [Google Scholar] [CrossRef]
- Soyer, H.P.; Argenziano, G.; Talamini, R.; Chimenti, S. Is dermoscopy useful for the diagnosis of melanoma? Arch. Dermatol. 2001, 137, 1361–1363. [Google Scholar] [CrossRef] [PubMed]
- Michael, A.M.; Noel, C.F.C.; Stephen, W.D.; David, A.G.; Brian, H.; Aadi, K.; Nabin, M.; Cristina, C.M.; Emre, C.; Jennifer, L.D.; et al. Results of the 2016 international skin imaging collaboration international symposium on biomedical imaging challenge: Comparison of the accuracy of computer algorithms to dermatologists for the diagnosis of melanoma from dermoscopic images. Am. Acad. Dermatol. 2018, 78, 270–277. [Google Scholar]
- Haenssle, H.A.; Fink, C.; Schneiderbauer, R.; Toberer, F.; Buhl, T.; Blum, A.; Kalloo, A.; Hassen, A.B.H.; Thomas, L.; Enk, A.; et al. Man against machine: Diagnostic performance of a deep learning convolutional neural network for dermoscopic melanoma recognition in comparison to 58 dermatologists. Ann. Oncol. 2018, 29, 1836–1842. [Google Scholar] [CrossRef]
- Abunadi, I.; Senan, E.M. Deep learning and machine learning techniques of diagnosis dermoscopy images for early detection of skin diseases. Electronics 2021, 10, 3158. [Google Scholar] [CrossRef]
- Ozturk, S.; Tolga, C. Deep clustering via center-oriented margin free-triplet loss for skin detection in highly imbalance datasets. IEEE J. Biomed. Health Inform. 2022, 26, 4679–4690. [Google Scholar] [CrossRef]
- Cassidy, B.; Kendrick, C.; Brodzicki, A.; Jaworek-Korjakowska, J.; Yap, M.H. Analysis of the ISIC image datasets: Usage, benchmarks and recommendations. Med. Image Anal. 2022, 75, 102305. [Google Scholar] [CrossRef]
- Gessert, N.; Sentker, T.; Madesta, F.; Schmitz, R.; Kniep, H.; Baltruschat, I.; Werner, R.; Schlaefer, A. Skin lesion classification using CNNs with path-based attention and diagnosis-guided loss weighting. IEEE Trans. Biomed. Eng. 2020, 67, 495–503. [Google Scholar] [CrossRef]
- Santos, F.; Silva, F.; Georgieva, P. Transfer learning for skin lesion classification using convolutional neural networks. In Proceedings of the International Conference on Innovations in Intelligent Systems and Applications (INISTA), Kocaeli, Turkey, 25–27 August 2021. [Google Scholar]
- Gu, Y.; Ge, Z.; Bonnington, C.P.; Zhou, J. Progressive transfer learning and adversarial domain adaptation for cross domain skin disease classification. IEEE J. Biomed. Health Inform. 2019, 24, 1379–1393. [Google Scholar]
- Albert, B.A. Deep learning from limited training data: Novel segmentation and ensemble algorithms applied to automatic melanoma diagnosis. IEEE Access 2020, 8, 31254–31269. [Google Scholar] [CrossRef]
- Esteva, A.; Kuprel, B.; Novoa, R.A.; Ko, J.; Swetter, S.M.; Blau, H.M.; Thrun, S. Dermatologist-level classification of skin cancer with deep neural networks. Nature 2017, 52, 115–118. [Google Scholar] [CrossRef] [PubMed]
- Di Biasi, L.; Citarella, A.A.; Risi, M.; Tortora, G. A cloud approach for melanoma detection based on deep learning networks. IEEE J. Biomed. Health Inform. 2022, 26, 962–972. [Google Scholar] [CrossRef]
- Ashraf, R.; Afzal, S.; Rehman, A.U.; Gul, S.; Baber, J.; Bakhtyar, M.; Mehmood, I.; Song, O.Y.; Maqsood, M. Region-of-interest based transfer learning assisted framework for skin cancer detection. IEEE Access 2020, 8, 147858–147871. [Google Scholar] [CrossRef]
- Goyal, M.; Oakley, A.; Bansal, P.; Dancey, D.; Yap, M.H. Skin lesion segmentation in dermoscopy images with ensemble deep learning methods. IEEE Access 2019, 8, 4171–4181. [Google Scholar] [CrossRef]
- Yu, Z.; Jiang, X.; Zhou, F.; Qin, J.; Ni, D.; Chen, S.; Lei, B.; Wang, T. Melanoma recognition in dermoscopy images via aggregated deep convolutional features. IEEE Trans. Biomed. Eng. 2019, 66, 1006–1016. [Google Scholar] [CrossRef]
- Razzak, I.; Naz, S. Unit-Vise: Deep shallow unit-vise residual neural networks with transition layer for expert level skin cancer classification. IEEE Trans. Comput. Biol. Bioinform. 2022, 19, 1225–1234. [Google Scholar] [CrossRef]
- Adegun, A.A.; Viriri, S. Deep learning-based system for automatic melanoma detection. IEEE Access 2019, 8, 7160–7172. [Google Scholar] [CrossRef]
- Karl, E. Skin lesion classification by ensembles of deep convolutional neural networks and regularly spaced shifting. IEEE Access 2022, 9, 12193–112205. [Google Scholar]
- Sharma, A.K.; Tiwari, S.; Aggarwal, G.; Goenka, N.; Kumar, A.; Chakrabarti, P.; Chakrabarti, T.; Gono, R.; Leonowicz, Z.; Jasiński, M. Dermatologist-level classification of skin cancer using cascaded ensembling of convolutional neural network and handcrafted features based neural network. IEEE Access 2022, 10, 17920–17932. [Google Scholar] [CrossRef]
- Zhou, Q.; Shi, Y.; Xu, Z.; Qu, R.; Xu, G. Classifying melanoma skin lesions using convolutional spiking neural networks with unsupervised STDP learning rule. IEEE Access 2020, 8, 101309–101319. [Google Scholar] [CrossRef]
- Vocaturo, E.; Zumpano, E. Dangerousness of dysplastic nevi: A multiple instance learning solution for early diagnosis. In Proceedings of the IEEE International Conference on Bioinformatics and Biomedicine (BIBM), San Diego, CA, USA, 18–21 November 2019. [Google Scholar]
- Lu, X.; Firoozeh Abolhasani Zadeh, Y.A. Deep learning-based classification for melanoma detection using XceptionNet. J. Healthc. Eng. 2022, 2022. [Google Scholar] [CrossRef] [PubMed]
- Zhang, J.; Xie, Y.; Xia, Y.; Shen, C. Attention residual learning for skin lesion classification. IEEE Trans. Med. Imaging 2019, 38, 2092–2103. [Google Scholar] [CrossRef] [PubMed]
- Srivastava, N.; Hinton, G.; Krizhevsky, A.; Sutskever, I.; Salakhutdinov, R. Dropout: A simple way to prevent neural networks from overfitting. J. Mach. Learn. Res. 2014, 15, 1929–1958. [Google Scholar]
- Huang, G.; Liu, Z.; Van Der Maaten, L.; Weinberger, K.Q. Densely connected convolutional networks. In Proceedings of the IEEE Conference on Computer Vision and Pattern Recognition, Honolulu, HI, USA, 21–26 July 2017. [Google Scholar]
Publisher’s Note: MDPI stays neutral with regard to jurisdictional claims in published maps and institutional affiliations. |
© 2022 by the authors. Licensee MDPI, Basel, Switzerland. This article is an open access article distributed under the terms and conditions of the Creative Commons Attribution (CC BY) license (https://creativecommons.org/licenses/by/4.0/).