Article

Classification and Identification Method of Radio Fuze Target and Sweep Jamming Signals Based on Third-Order Spectrum Features

Science and Technology on Electromechanical Dynamic Control Laboratory, Beijing Institute of Technology, Beijing 100081, China
*
Author to whom correspondence should be addressed.
Electronics 2022, 11(15), 2474; https://doi.org/10.3390/electronics11152474
Submission received: 30 June 2022 / Revised: 24 July 2022 / Accepted: 5 August 2022 / Published: 8 August 2022
(This article belongs to the Section Circuit and Signal Processing)

Abstract

:
To overcome the problem of insufficiency of linear frequency modulation (LFM) radio fuzes against sweep-type jamming, a method is proposed to classify and identify radio fuze targets and interfering signals based on third-order spectrum features. Using the measured data of an LFM radio fuze, the third-order spectral transform is applied to the output signals of the detector end under the action of the target and several amplitude modulated sweeping interfering signals, and the amplitude mean value, third-order spectral amplitude entropy, and third-order spectral singular value entropy based on the third-order spectrum are extracted as three-dimensional features. The experimental results show that the classification and identification of targets and AM sweep-type interference using the third-order spectral features of the signal at the detector end has a high success rate, with a comprehensive identification accuracy of 98.33%.

1. Introduction

1.1. Research Background

Continuous waveform linear frequency modulation(LFM) radio fuze is a kind of proximity detector with high real-time performance, has an excellent ranging and anti-jamming ability, and is widely used on the modern battlefield [1,2,3]. However, with the development of electronic countermeasures technology, LFM radio fuze is seriously affected by interference and jamming. Electromagnetic jamming by radio fuze jammers can make radio fuzes spoof interference, which in turn can cause missiles to blow up early or not, greatly reducing the efficiency of the weaponry’s role [4]. In particular, sweep jamming is the most serious threat to LFM radio fuzes [5]. Therefore, it’s quite important to improve the anti-jamming ability of the LFM radio fuze, and the effective classification and identification of radio fuze targets and jamming signals can greatly improve the anti-jamming capability of radio fuzes.

1.2. Related Works

Many researchers have conducted research and achieved some results to improve the anti-jamming ability of LFM radio fuzes. There are two main types of LFM radio fuze anti-jamming methods: radio fuze transmits waveform design and radio fuze output signal processing.
Radio fuze transmitted waveform design [6,7,8,9,10] mainly focus on the transmitted electromagnetic wave to anti-jamming signals. Yue et al. [6] designed a novel structure based on the intermediate frequency signals for the transceiver which is different from the traditional linear frequency modulated continuous wave transceiver using the beat frequency signal-based structure. A sequence with good autocorrelation properties was studied [7], and the side-lobe level of the autocorrelation is regarded as the main merit and is optimized through newly introduced cyclic algorithms. The numerical experiments confirm the superiority of the newly developed algorithms compared to high-performance algorithms in monostatic and MIMO radars. Considering the strong sea clutter environment, Choi et al. [8] designed and built a FMCW transceiver for short range proximity sensors in sea clutter. The FMCW transceiver has low phase noise and the wideband FMCW transmits a signal with good linearity while maintaining consistency between transmit and receive frequencies to reduce the effects of strong sea clutter. Hanbali et al. [9] proposed a novel technique to counter active echo cancellation and interrupted-sampling repeater jammer, and the proposed technique is based on frequency-shifting of the transmitted radar signal. By doing that, the true target and the jammer echo will be in phase. To improve the anti-jamming performance of FM fuze against DRFM type jamming, Chen et al. [10] proposed an anti-jamming method based on two-channel harmonic correlation detection of variable chirp rate transmit signals.
Radio fuze output signals process and mainly research the radio fuze output signals’ recognition and classification [11,12,13,14,15]. Based on the statistical properties of continuous wave detector outputs under swept jamming, an averaged range flanking method was proposed [11], which uses the fast Fourier transform to extract the harmonic envelope and averages the multiple harmonic coefficients obtained by FFT. Simulation experiments were also carried out to demonstrate the superiority of the averaged range sidelobe method. Dai et al. [12] proposed three different false-target recognition strategies for different kinds of interference, and dynamically allocated the three false-target recognition strategies based on the maximized payoff principle in the non-cooperative game between the radio frequency proximity sensor and the interference, which can significantly improve the false-target recognition performance of the radio frequency proximity sensor. A small sample terrain recognition framework [13] based on the carrier-free UWB proximity sensor was proposed to classify terrain echo signals using time–frequency feature maps. Insufficient samples make the classifier prone to overfitting, so the author proposed an Improved Auxiliary Classifier Generative Adversarial Networks for data enhancement in the paper. Zhu et al. [14] proposed a hierarchical dictionary learning mechanism for vehicle recognition based on the carrier-free UWB radar. The hierarchical dictionary learning framework aids the model in learning discriminative representations through reconstructing clean data over the signal dictionary, which encourages the sub-dictionary to be representative for signals from the corresponding category but to be away from other categories. A classification and identification method based on information entropy features in the frequency domain was first used in radio fuze target identification [15] to suppress AM sweep jamming of FM fuzes. The Shannon entropy and singular spectrum entropy of the fuze detection output signal were extracted, and a support vector machine was used to classify and identify the target signal and the jamming signal.
To summarise, all current research on LFM fuzes against sweeping frequency jamming is based on the time and frequency domains, where the frequency domain research focuses on the signal spectrum and power spectrum, i.e., the analysis of the second-order spectrum. The higher-order spectrum contains a wealth of information about the signal, but no research has been conducted in the literature on the use of higher-order spectrum information for LFM radio fuze anti-jamming. Therefore, this paper takes a certain type of LFM radio fuze as the object of analysis and proposes a method to classify and identify the target and sweeping frequency jamming signals at the LFM radio fuze detector output with the third-order spectrum information as the characteristic parameter, so as to improve the ability of LFM radio fuze to combat sweeping jamming in the complex battlefield electromagnetic environment.
The content of this paper is arranged as follows: Section 1 introduces the research background and the current status of the study; Section 2 introduces the theory related to high-order cumulants; Section 3 describes the methods of experimental data collection; Section 4 researches the method of signal feature extraction based on higher order spectra; Section 5 provides experimental validation of the method proposed in this paper and the last section gives the conclusion of this paper.

2. Higher-Order Statistics Theory

2.1. Higher-Order Moments and Higher-Order Cumulants

Compared with second-order statistics, higher-order statistics not only contain the amplitude information of the signal but also retain the rich phase information that cannot be obtained from second-order statistics, so that higher-order statistics can be used to obtain more complete features of the signal. The application of higher-order statistics to classification and recognition problems has significant advantages. Currently, scholars at home and abroad have used higher-order statistics for human and animal recognition [16,17], disease classification and diagnosis [18,19,20], mechanical fault diagnosis [21], modulation type recognition [22,23,24], etc. Higher-order statistics include higher-order moments, higher-order cumulants, and their spectra, i.e., higher-order moment spectrum and higher-order cumulant spectrum.
Assuming that x = [ x 1 , x 2 , , x k ] T is a random vector, the first eigenfunction of the random vector is defined by the following equation:
Φ w 1 , w 2 , , w k = E e j w 1 x 1 + w 2 x 2 + + w k w k
Solving for the r = r 1 + r 2 + + r k partial derivatives of the above equation, we get
r Φ ( w 1 , w 2 , , w k ) w 1 v 1 w 2 v 2 w k v k = j r E { x 1 r 1 x k r k e j ( w 1 x 1 + + w k x k ) }
Letting w 1 = w 2 = w k = 0 in the above equation give the r order moment of the random vector, i.e.,
m r 1 r k = E { x 1 r 1 x k r k } = ( j ) r r Φ ( w 1 , , w k ) w 1 r 1 w k r k w 1 = = w k = 0
In particular, choose r 1 = r 2 = = r k = 1 to obtain the k order moment of the random vector x, denoted as
m k x = m 1 , , 1 = m o m x 1 , , x k
Similarly, the second eigenfunction of the random vector x can be defined by Equation (1) as
Ψ w 1 , , w k = ln Φ w 1 , , w k
Solve the second eigenfunction for its r = r 1 + r 2 + + r k order partial derivative and let w 1 = w 2 = = w k = 0 , i.e., obtain the r order cumulative of the random vector x,
c r 1 r k = ( j ) r r Ψ ( w 1 , , w k ) w 1 r 1 w k r k w 1 = = w k = 0 = ( j ) r r ln Φ ( w 1 , , w k ) w 1 r 1 w k r k w 1 = = w k = 0
As in Equation (4), taking r 1 = = r k = 1 , we obtain the kth order cumulant of the random vector x, denoted as
c k x = c 1 , , 1 = c u m x 1 , , x k

2.2. Higher-Order Moment Spectrum and Higher-Order Cumulant Spectrum

The higher-order moment spectrum and the higher-order cumulant spectrum are the multidimensional Fourier transforms of higher-order moments and higher-order cumulants, respectively. Assuming that the higher-order moments m k of Equation (4) are summable, the spectrum of k-order moments of order is defined as
M k x ( w 1 , , w k 1 ) = τ 1 τ k 1 m k x ( τ 1 , , τ k 1 ) exp [ j i w i τ i ]
Similarly, assuming that the higher-order cumulants c k x of Equation (7) are summable, the spectrum of k-order cumulants of order is defined as
S k x ( w 1 , , w k 1 ) = τ 1 τ k 1 c k x ( τ 1 , , τ k 1 ) exp [ j i w i τ i ]
Due to the complexity of calculating the fourth-order spectrum and the real-time nature of radio fusing, in this paper, the third-order spectrum of the signal is selected for calculation and analysis. In this paper, the third-order spectrum of the signal is chosen for calculation and analysis, i.e., the value of k in Equation (9) equals 3 is used to obtain the third-order spectrum.
S 3 x ( w 1 , w 2 ) = τ 1 τ 2 c 3 x ( τ 1 , τ 2 ) exp [ j i = 1 2 w i τ i ]

3. Signal Data Collection

3.1. Experimental Scenarios and Parameter Settings

This paper selects a type of continuous-wave FM radio fuze, in the microwave darkroom environment, respectively, to simulate the target, noise AM sweep interference, sinusoidal AM sweep interference, and square wave AM sweep interference on the fuze, and to collect the fuze start signal generation moment before the detector output signal, the experimental scenario is shown in Figure 1. The scenario is based on the parameters of the US SEPS 3 radio fuze jammer, which has an effective jamming power of 800 W and an effective jamming distance of not less than 200 m. The interference distance in the experimental scenario is set to 1.75 m; the simulated target is a metal plate with an RCS of 1 m2, and the linear distance between the target and the fuze is 10 m; the centre frequency of the FM radio fuze is f 0 = 3   GHz , and the modulation bandwidth is Δ F = 15   MHz ; and the sweeping range of the interference signal is set to f 0 ± 2 Δ F , and the amplitude modulation frequency of the interference signal is set randomly.

3.2. Radio Fuze Output Signal Capture

The radio fuze start pulse signal is used as the cut-off time for signal acquisition, and 20,000 data points are selected forward for the output signal of the detector end at this point, and the frequency of signal acquisition is 1000 kHz, i.e., the acquisition time is 20 ms. A total of 180 groups of target echo signals are acquired, and 60 groups of the output signal of the detector end under the action of noise AM sweep, sinusoidal AM sweep, and square wave AM sweep interference signal are also acquired. The total number of signals collected is 360. Figure 2 shows the measured waveforms of the time domain signals from the detector side of the radio fuze under the effect of the target and different interference signals.

4. Signal Third-Order Spectral Feature Extraction

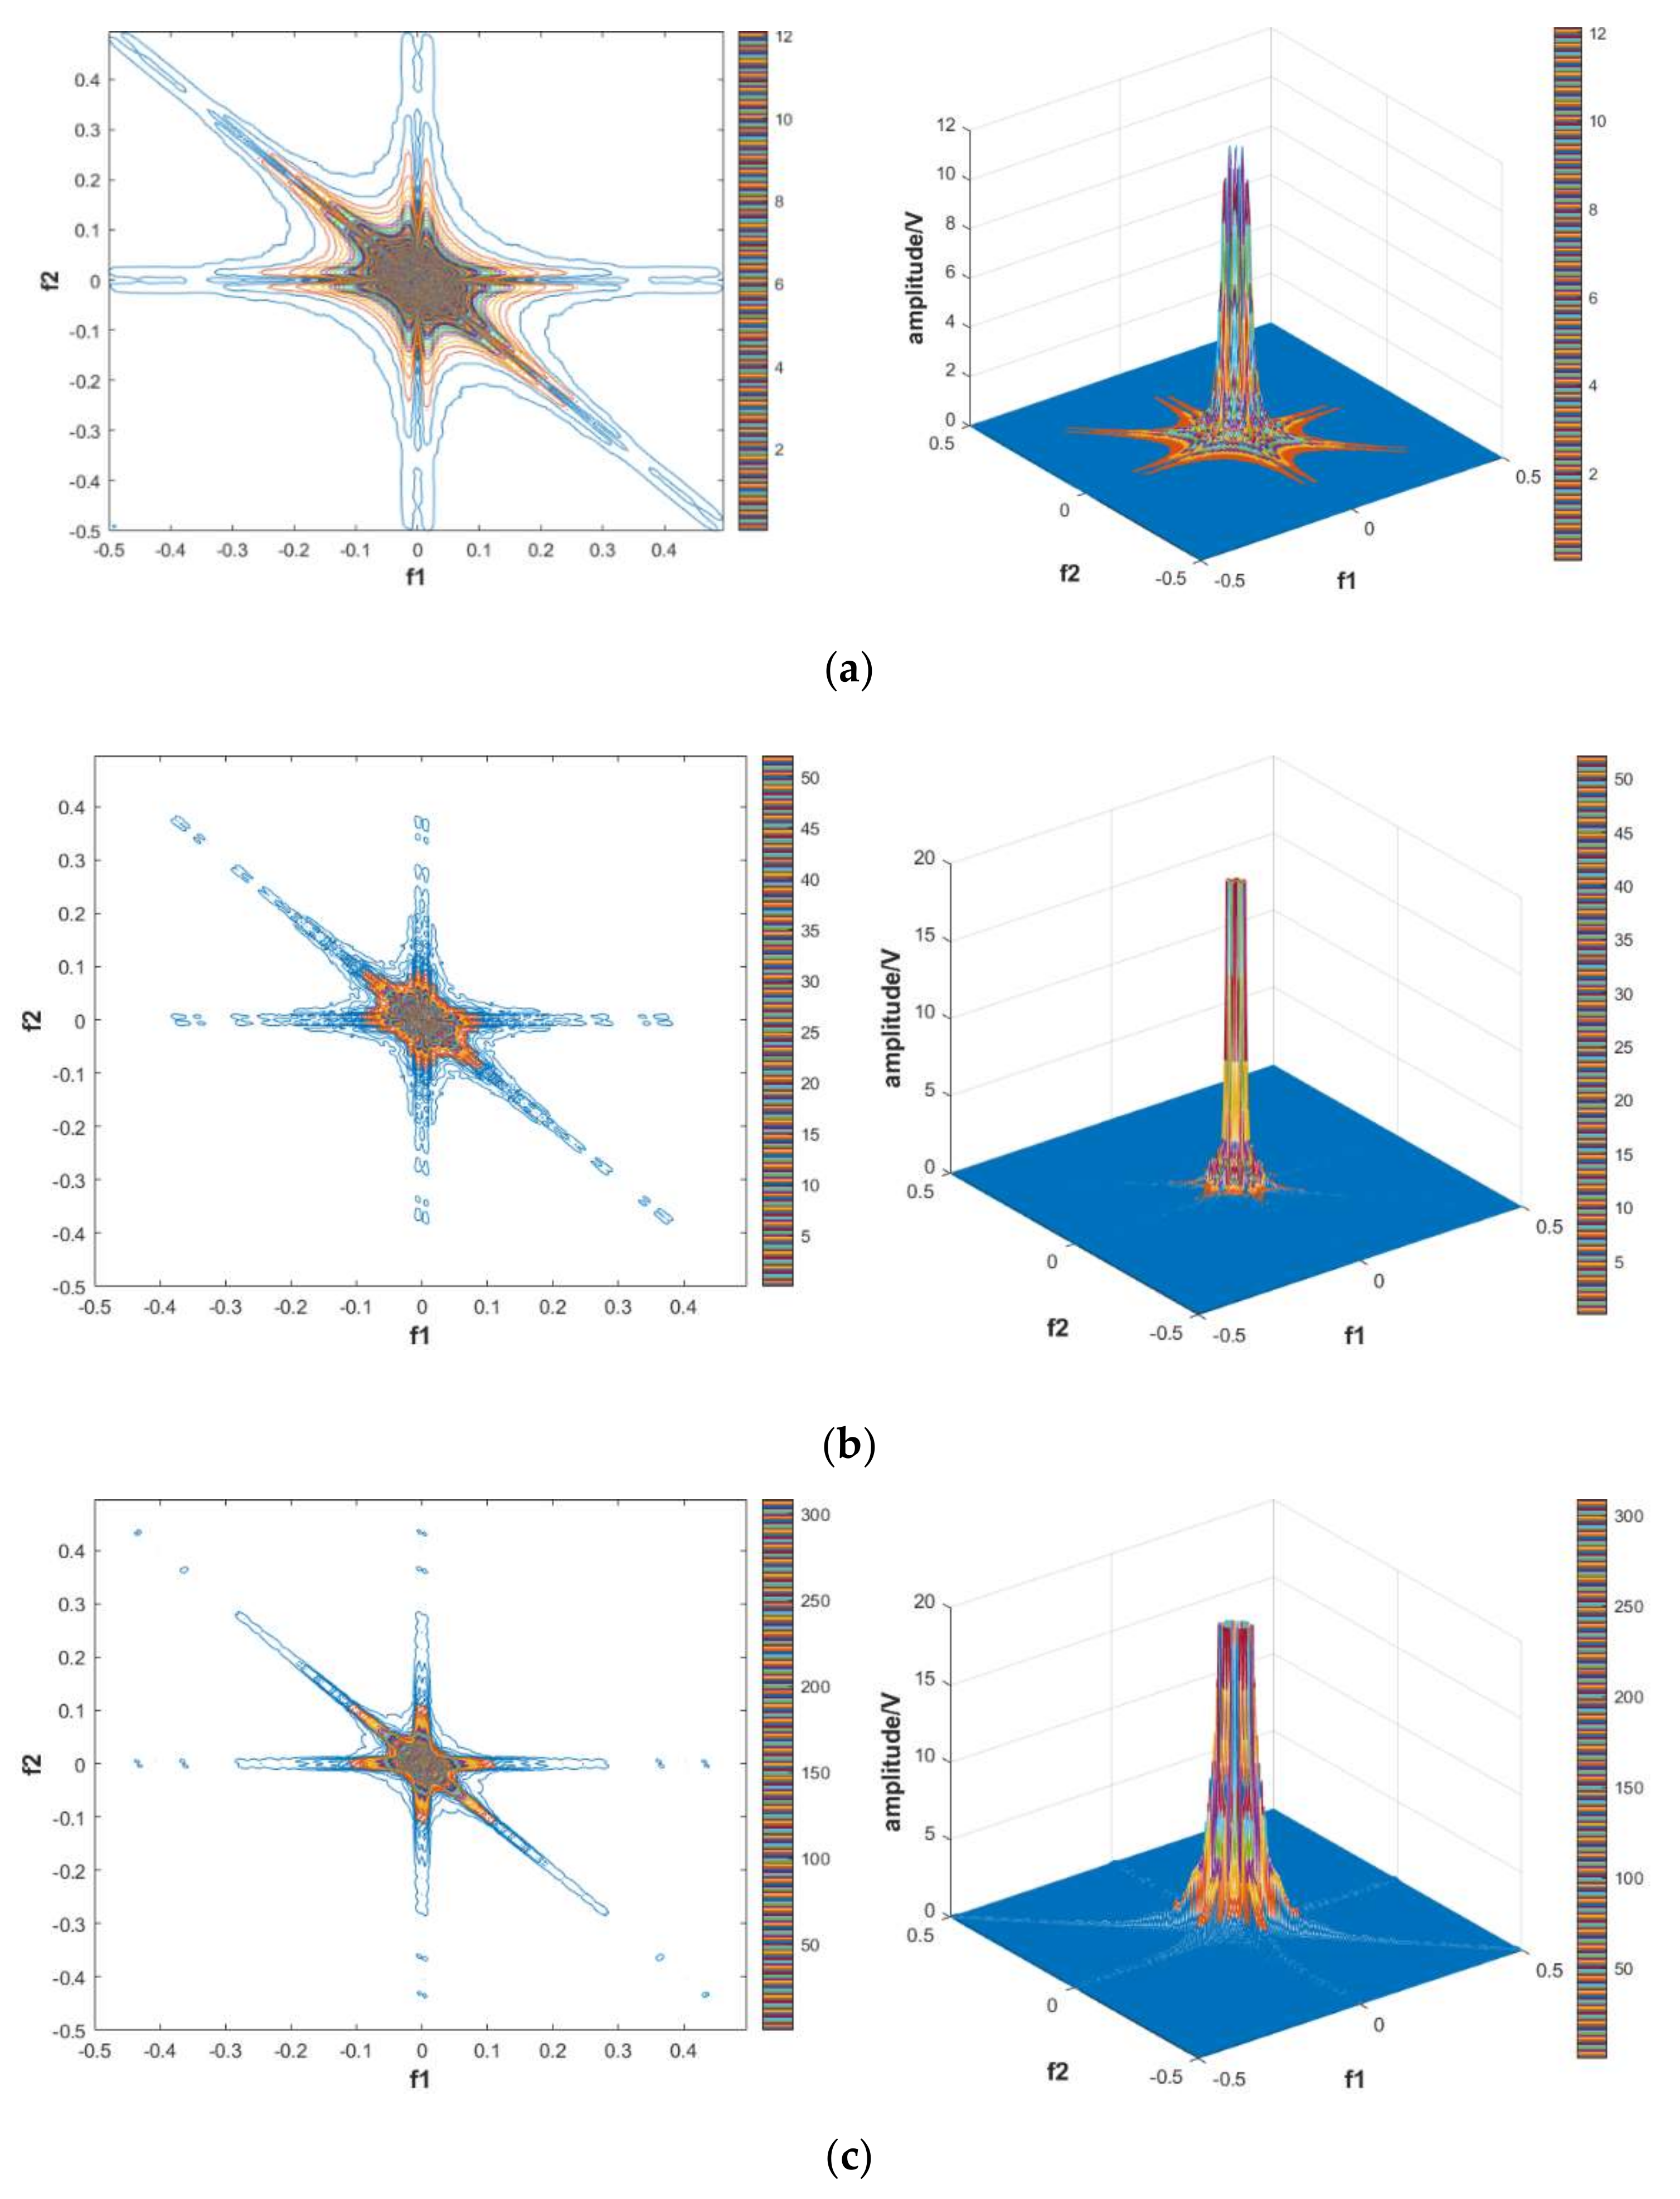
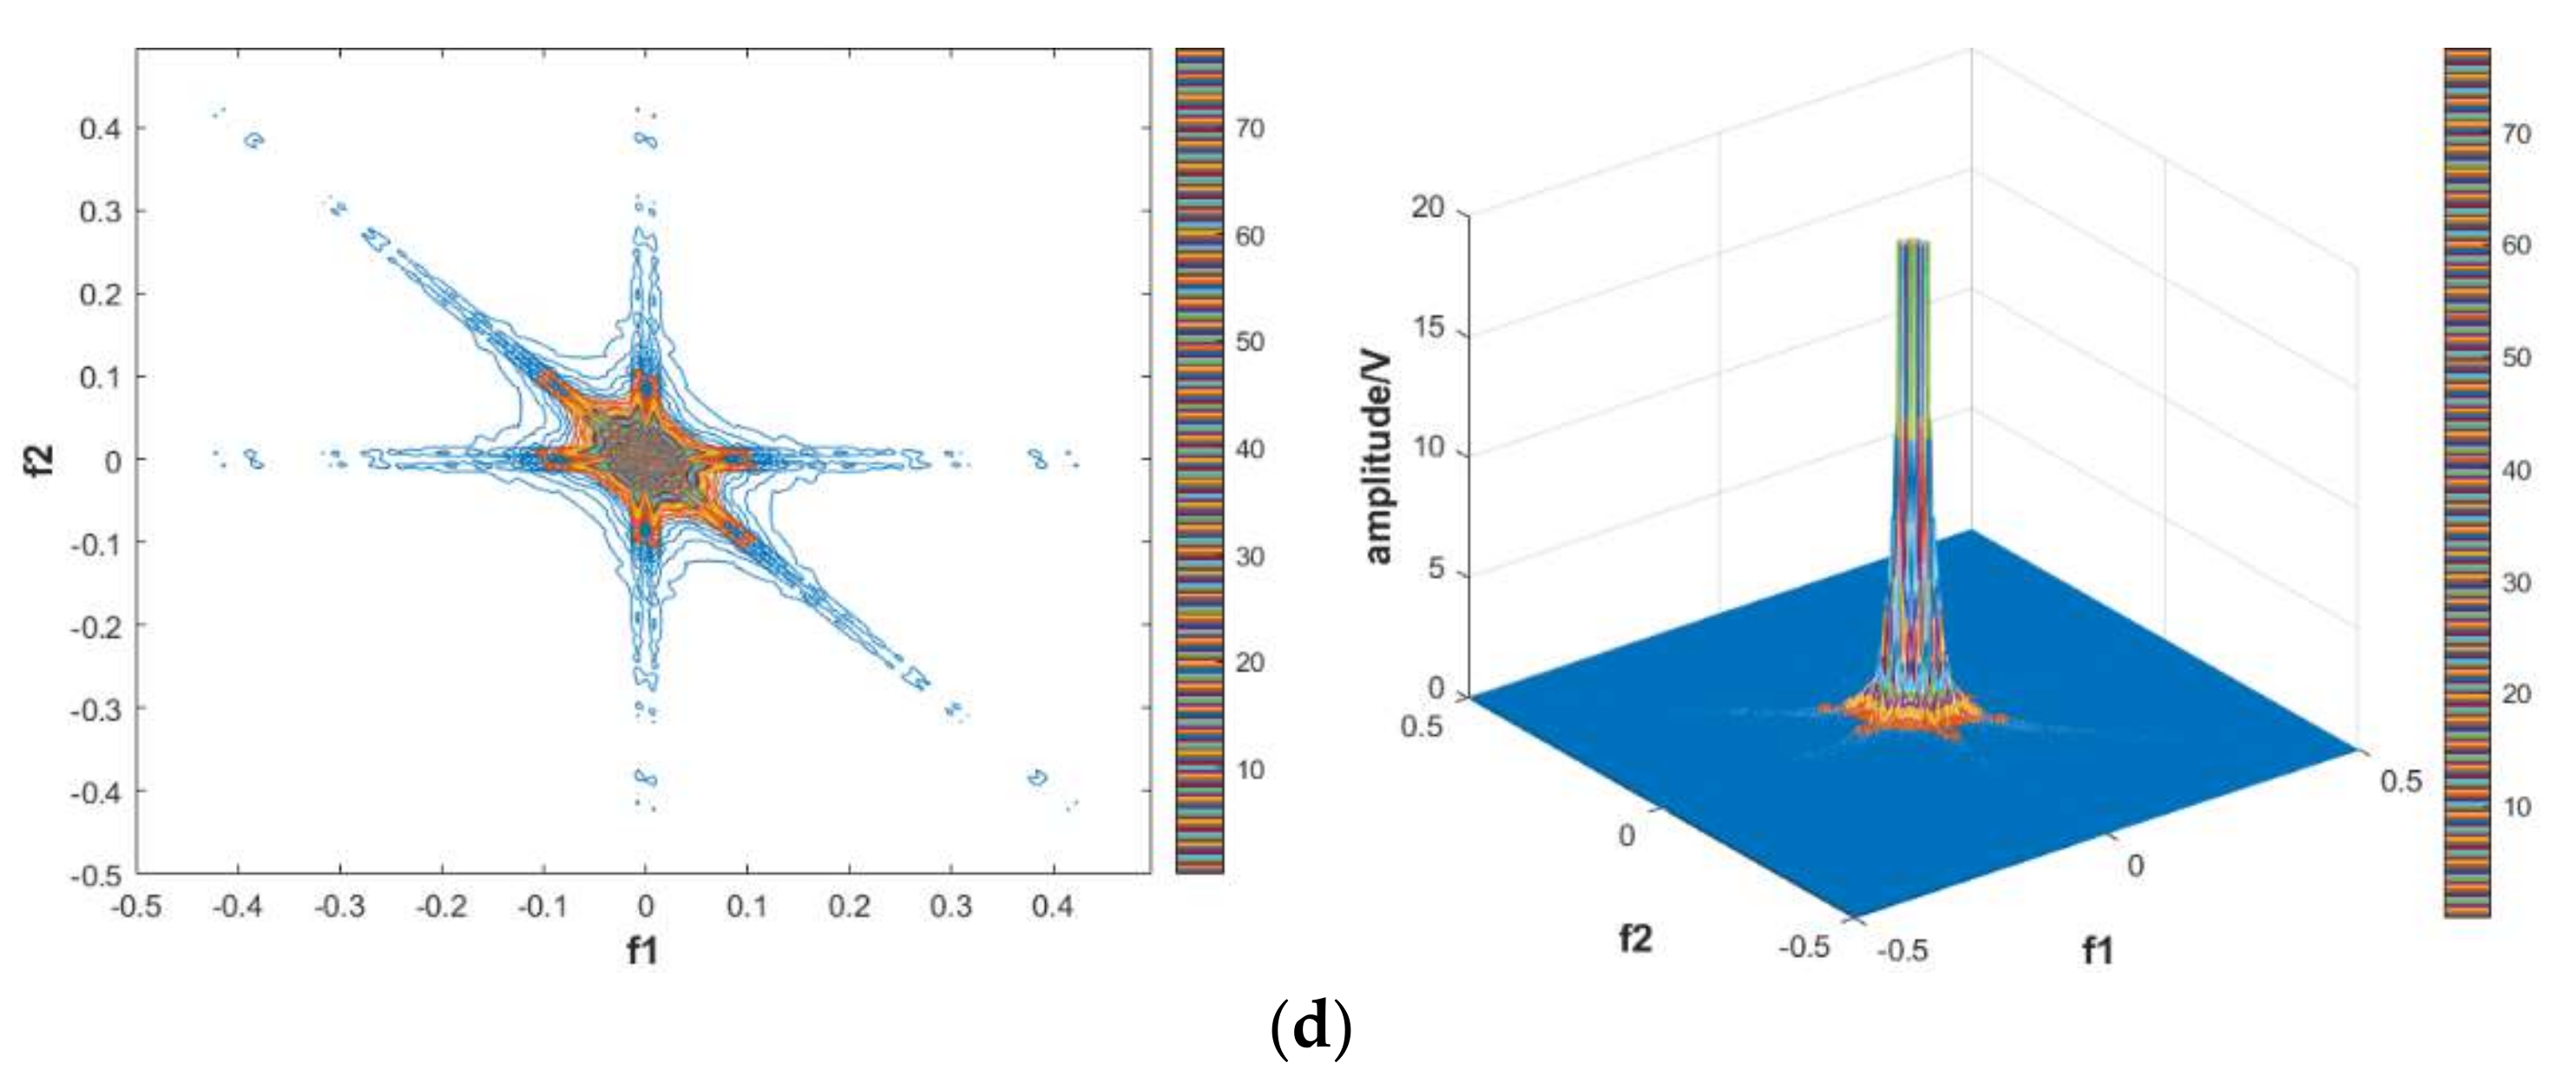
4.1. Third-Order Spectral Transformation of Signals

The third-order spectrum of a signal contains a richer set of properties than the second-order spectrum, including not only information about the amplitude of the signal at different frequencies, but also information about the phase of the signal that is not available in the second-order spectrum. The richer signal properties help to improve the accuracy of signal classification. At the same time, due to the insensitivity of the third-order spectrum to Gaussian noise, the third-order spectrum of Gaussian noise is constant at zero [25].
A total of 180 sets of target signals and 60 sets of signals at the detector end under the action of three types of interference signals were selected, and for a total of 360 sets of signals, a third-order spectral transformation was carried out. The three order spectrum 3D plots and contours of the different signals are shown in Figure 3.

4.2. Feature Extraction Based on Third-Order Spectrum

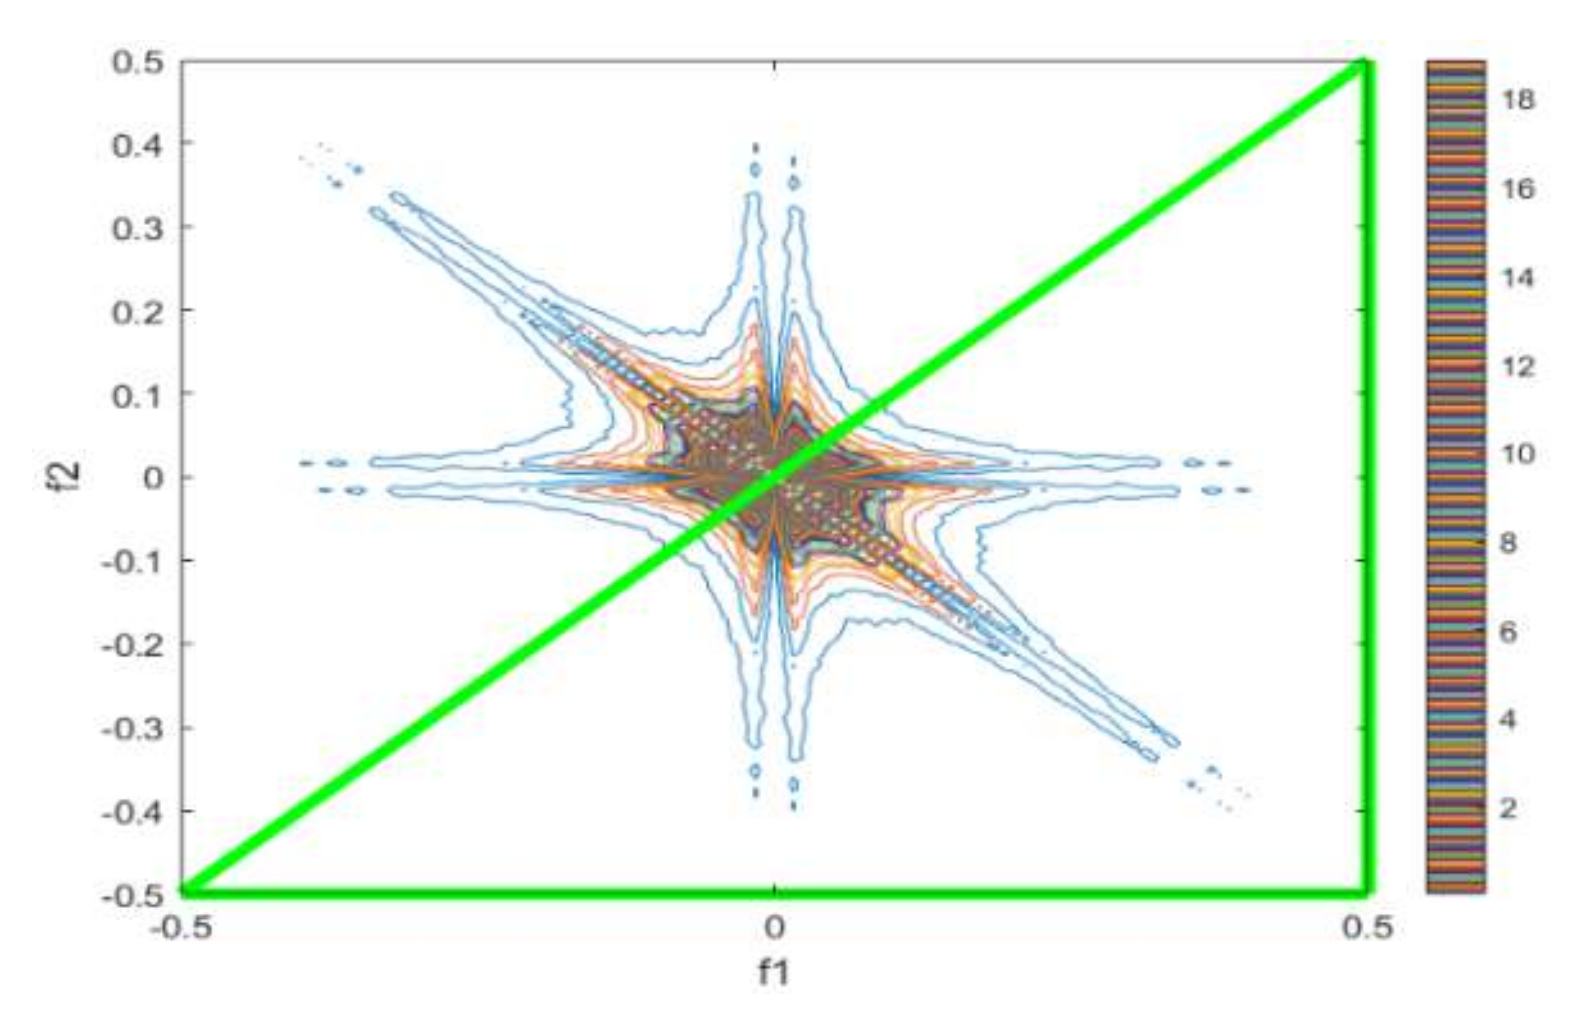
4.2.1. Feature Extraction Area Selection

The symmetry of the third-order spectrum shows that the region defined by the third-order spectrum can be divided into two parts symmetrical from the origin to the symmetry line f 2 = f 1 . To ensure the real-time processing of the fuzzy signal, reduce the computational effort of the feature extraction process and ensure the completeness of the signal feature information, the part enclosed by f 2 f 1 , f 1 min f 1 f 1 max , f 2 min f 2 f 2 max is selected as the region for the third-order spectrum feature extraction in this paper. Taking the contour map of the third-order spectrum of the target signal as an example, the points within the area enclosed by the green triangle are selected as the calculation points for feature extraction, as shown in the Figure 4.

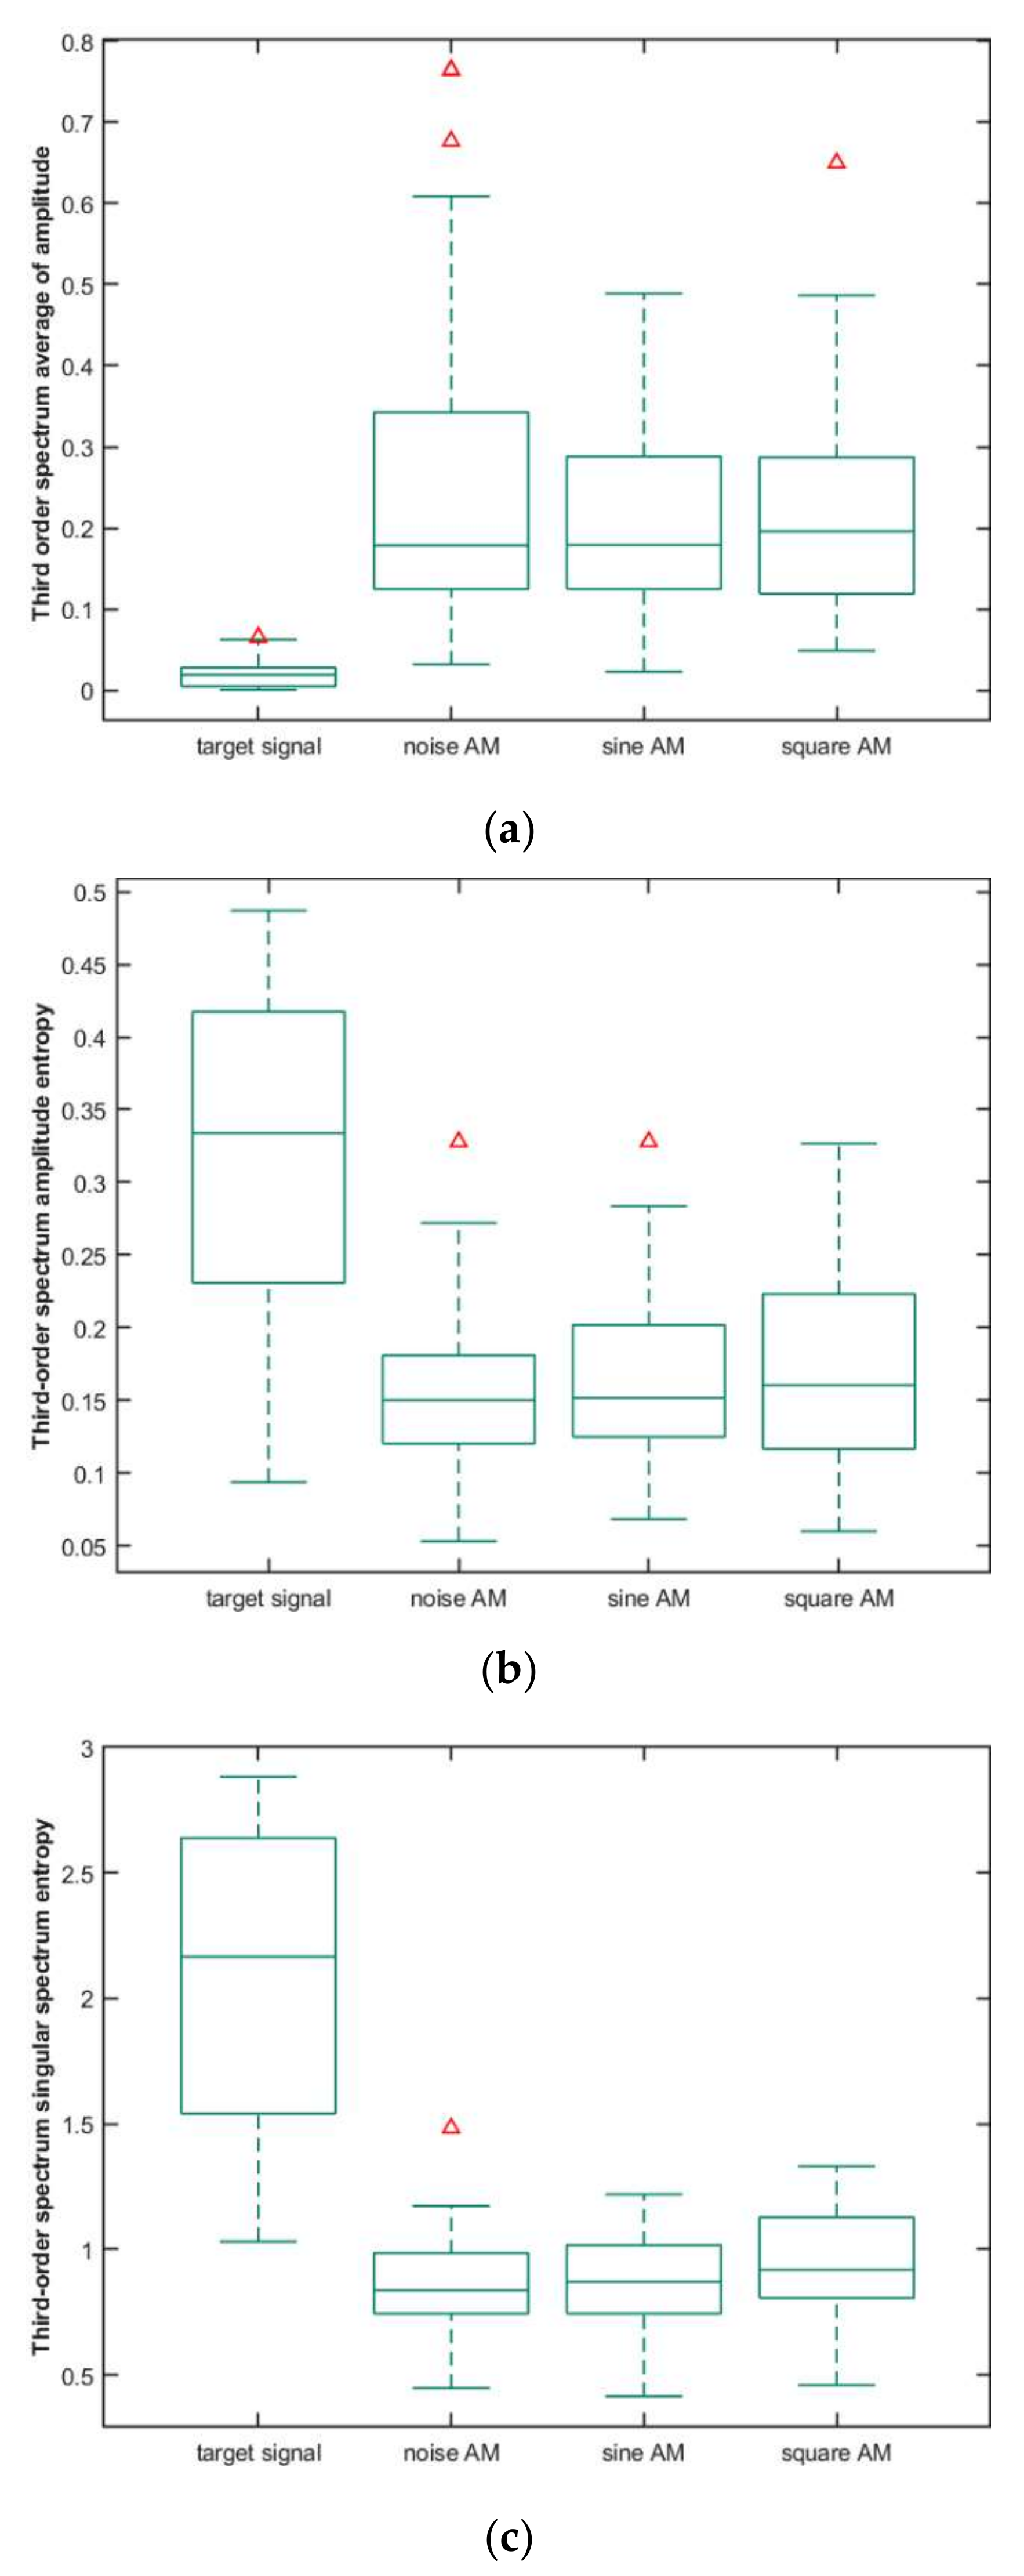
4.2.2. Third Order Spectral Amplitude Mean Characteristics

The third-order spectral amplitude means the feature is the average of the third-order spectral amplitudes in the feature extraction region, such that the region enclosed by the green line in Figure 4 is O , and the feature can be expressed as follows
A a v g = O B f 1 , f 2 N
The above equation A a v g denotes the third-order spectral amplitude mean feature, B ( f 1 , f 2 ) denotes the third-order spectral value in the feature extraction region, which is a complex number, and therefore O B ( f 1 , f 2 ) denotes the sum of the absolute third-order spectral values in the feature extraction region, and denotes the number of all points in the region.

4.2.3. Third-Order Spectral Amplitude Entropy Characteristics

The third-order spectral amplitude entropy feature can be used to represent the regularity of the third-order spectral amplitude of a signal. Suppose that the probability of occurrence of an element in a random sequence is p i , and the total number of elements is M , the entropy characteristic of the sequence is given by
E n = M p i × log 2 p i
The entropy characteristics of the third-order spectrum of the signal can be obtained from the amplitude entropy characteristics of a one-dimensional random sequence as
E n p 1 = M p 1 × log 2 p 1
E n p 2 = M p 2 × log 2 p 2
In the above equation
p 1 = B f 1 , f 2 O B f 1 , f 2
p 1 = B f 1 , f 2 2 O B f 1 , f 2 2
In this paper, the third-order spectral amplitude entropy feature of the signal is chosen in Equation (14).

4.2.4. Third-Order Spectral Singular Spectral Entropy

The singular spectral entropy feature has unique performance in signal information evaluation and information component analysis. The singular spectral entropy feature extraction in this section firstly reconstructs the data points in the third-order spectral feature extraction region of the signal shown in Figure 4 spatially to generate a new data matrix, then performs singular value decomposition on the new data matrix, and finally further performs singular spectral entropy calculation for the singular values. There are a total of 16,512 data points in the third-order spectral feature extraction region in Figure 4, so a new data matrix of size 129 × 128 will be formed, with the following expression:
M 129 × 128 = b 1.1 b 1.2 b 1.128 b 2.1 b 2.2 b 2.128 b 129.1 b 129.2 b 129.128
b i , j denotes the j-th magnitude of the i-th row of the reconstructed third-order spectral matrix and the singular value decomposition of the matrix yields
M 129 × 128 = L S M R T
In the above equation, S M is the singular value matrix of the matrix M 129 × 128 , L is the left singular value matrix, and R is the right singular value matrix. The matrix S M is a diagonal matrix which satisfies S M R 129 × 128 , and the diagonal elements { s m 1 , s m 2 , , s m 128 } of the matrix to obtain the singular spectral entropy of the signal are as follows
E M = i p m i × log 2 p m i
where p m i = s m i / i s m i .

4.3. Analysis of the Significance of Differences in Characteristics

To verify the significance of the difference between the different signals based on the third-order spectral features in the feature extraction section, the third-order spectral amplitude mean features, the third-order spectral amplitude entropy features, and the third-order spectral singular spectral entropy features of the target and interference signals are analyzed for the significance of the difference. In this paper, the anova1 function in the MATLAB statistical toolbox is used to do the test, which returns the value, specifically: assuming that there is no significant difference between the test sets, at the level of significance α = 0.05 , p > 0.05 then the original hypothesis is accepted p < 0.05 then the original hypothesis is rejected. The results of the test are shown in Table 1.
As can be seen from Table 1, all three feature significance tests returned extremely small values and therefore the original hypothesis was rejected, i.e., the differences between the three features of the target and interfering signals were all extremely significant. To visualize the difference in the numerical distribution of the third-order spectral features of the target and interfering signals, statistical box plots and scatter plots are plotted as shown below. Figure 5a–c show the box plots of the third-order spectral amplitude mean feature, the box plots of the third-order spectral amplitude entropy feature, and the box plots of the third-order spectral singular spectral entropy feature respectively. In Figure 5b,c the third-order spectral amplitude entropy feature and the third-order spectral singular spectral entropy feature of the target signal have a larger range of numerical distribution compared to the interference signal. In Figure 5b, the values of the upper and lower 1/4 quantile of the interference signal are included between the lower 1/4 quantile and the minimum of the signal, but the upper and lower 1/4 quantile data of the target and interference are completely staggered; In Figure 5c, the minimum of the target signal and the in Figure 5c, there is an overlap between the minimum value of the target signal and the maximum value of the interfering signal, and the upper and lower 1/4 quantile points are completely staggered and more differentiated. Overall, the target and interfering signals are more distinguishable within the selected feature range.
The scatter plot of the three-dimensional characteristics of the target and interference signals is shown in Figure 6, where the red circles indicate the target signals and the other graphs indicate different interference signals. It can be seen from the figure that the vast majority of the target and interference signals in the three-dimensional feature space do not overlap with the interference signals in the scatter plot, and only a very small number of points overlap with the interference signals in the spatial distribution. Among them, 10 have a large overlap with the interference signals, accounting for 5.6% of the total.

5. Signal Classification and Identification Experiments

5.1. Classification Recognition Accuracy Experiment

The radio fuze is used in the actual battlefield environment, where the rendezvous time is extremely short, and the real-time requirements for the target and interference signal recognition algorithm are high. Therefore, the KNN algorithm based on the KD tree with relatively low computational complexity is selected for the target and interference signal classification and recognition experiments.
To avoid the influence of the number of targets and interfering signals on the experimental results, the same number of targets and interfering signals are selected, that is, 180 groups of target signals, 60 groups of noisy AM sweep signals, 60 groups of sinusoidal AM sweep signals, and 60 groups of square wave AM sweep signals, for a total of 360 groups. Using the 10-fold cross-check method, the 360 sets of signals are randomly divided into 10 groups of 36 signals each, one of which is selected each time as the test sample set, and the remaining 9 groups are used as the training sample set, for a total of 10 tests. The average of the results of the 10 experiments was taken as the final test result.
To comprehensively evaluate the proposed method, the target recognition accuracy, interference recognition accuracy, combined recognition accuracy, and the probability of being interfered with are selected as the effect evaluation indexes, which are defined as follows:
D R t t = N u m t t N u m t × 100 %
D R j j = N u m j j N u m j × 100 %
J R j r = N u m j r N u m j × 100 %
D R a l l = N u m t t + N u m j j N u m t + N u m j × 100 %
D R t t is the target identification accuracy, N u m t t is the number of targets identified as targets and N u m t is the total number of targets in the test set; D R j j is the interference identification accuracy, N u m j j is the number of interference identified as interference, and N u m j is the total number of interference in the test set; J R j r is the interference probability N u m j r is the number of interference identified as targets; and D R a l l is the overall identification accuracy.
When the KNN classification and recognition algorithm classifies test points, it needs to calculate the distance between test points and other points, and then discriminate the test point attribute category. The distance calculation methods mainly include Euclidean distance, Manhattan distance, and Chebyshev distance, which all belong to the Minkowski distance. Suppose m i = { m i 1 , m i 2 , , m i D } and n j = { n j 1 , n j 2 , , n j D } are two points in the dimensional real space, and the Minkowski distance between two points is shown as follows
D P ( m i , n j ) = ( k = 1 D m i k n j k P ) 1 / P
When P = 1 , for Manhattan Distance
D 1 ( m i , n j ) = ( k = 1 D m i k n j k )
When P = 2 , for Euclidean distance
D 2 ( m i , n j ) = ( k = 1 D m i k n j k 2 )
When P , for Chebyshev Distance
D ( m i , n j ) = max k ( m i k n j k )
Using the 10-fold cross-check experiment method mentioned earlier, the test sample set was calculated 10 times and then the average value was taken as the final result. In the experiment of the KNN classification recognition algorithm based on the KD tree, different distance calculation methods and the number of nearest neighbours were selected to calculate the comprehensive recognition accuracy, target recognition accuracy, interference recognition accuracy, and the probability of being interfered with in the evaluation index respectively. The graphs of the calculation results are shown in Figure 7. Figure 7a shows the graph of comprehensive recognition accuracy, Figure 7b shows the graph of target recognition accuracy, Figure 7c shows the graph of interference recognition accuracy and Figure 7d shows the graph of the probability of being interfered. From Figure 7a,b, it can be seen that using Manhattan distance calculation has the highest recognition accuracy compared to Euclidean distance and Chebyshev distance, and using Euclidean distance calculation has higher recognition accuracy compared to Chebyshev distance for the same number of nearest neighbours. When the number of nearest neighbours exceeds 80, both the combined recognition accuracy and the target recognition accuracy start to show a decreasing trend, dropping sharply to around 43% and 50% when the number of nearest neighbours exceeds 300, i.e., it is almost impossible to classify targets and interferences for recognition.
As can be seen from Figure 7c, when the number of nearest neighbours reaches a certain number, the jamming recognition accuracy can reach 100%, but at this moment, the target recognition accuracy decreases seriously. As the radio fuze is used in the actual battlefield environment, it needs to identify the target accurately while identifying the interference; otherwise, it will cause no bombing or near bombing to touch bombing, making the effective killing performance reduced, so it needs to take into account the target identification accuracy and interference identification accuracy at the same time.
Table 2 shows the overall recognition accuracy, target recognition accuracy, interference recognition accuracy, and the corresponding interference probability for different distance calculation methods and the number of nearest neighbours. As can be seen from Table 2, the comprehensive recognition accuracy achieves 98% or more under the Euclidean distance, Manhattan distance, and Chebyshev distance calculation methods, and the probability of being interfered with is less than 1.5%. The target recognition accuracy was 99.0% when the number of nearest neighbours was 3, and the probability of being interfered with was 1.39%. However, a larger number of nearest neighbours means lower computational real-time performance, and in Figure 7c, we can see that the interference recognition accuracy is greater than 95% when the number of nearest neighbours is less than 50, so the number of nearest neighbours can be reduced appropriately to balance computational simplicity, Therefore, the number of nearest neighbours can be reduced appropriately to balance the computational simplicity and recognition accuracy.
In summary, the proposed method can guarantee comprehensive recognition accuracy, target recognition accuracy, and interference recognition accuracy, while having a very low probability of being interfered with, and the number of nearest neighbours can be selected below 10 to meet the computational simplicity of fuze signal processing.

5.2. Performance Comparison

In order to verify the superior performance of the method proposed in this paper, especially the effectiveness of the signal feature extraction method based on third-order spectrum features, the signal feature extraction methods mentioned in references [15,16] are selected as comparison in this section. The comparison experiments are conducted based on the same dataset, and the same KD tree-based KNN classifier, with the difference that different feature extraction methods are utilised. In particular, the frequency domain Shannon entropy and singular spectral entropy of the fuze output signal were extracted in reference [15], and the signal high-order cumulant feature was extracted in reference [16].
Using the comprehensive recognition accuracy, target recognition accuracy, and jamming recognition accuracy as comparison metrics, Table 3 presents the comparison results obtained with the references and method in this study.
The results show that the target and jamming signal classification method based on third-order spectrum features proposed in this paper has a better comprehensive recognition accuracy, target recognition accuracy, and jamming recognition accuracy in the dataset used in this paper. Compared with the feature extraction method based on signal frequency domain Shannon entropy and singular spectral entropy features in reference [15] and the feature extracted method based on higher-order cumulant in reference [16], the method in this paper is superior.
The classification algorithm in this paper uses a KD tree-based KNN classifier, which has lower computational complexity than the exhaustive-based KNN algorithm when the algorithm is running and can meet the requirements of computational real-time. We chose the algorithm running time as a measure of algorithm complexity. The algorithm runtime experiments were performed on a computer. The computing platform is MatLab R2021a, the computer operating system is Windows 10-2022TAHRW, and the CPU model is Intel(R)-Core(TM) i7-8565U @1.80Hz. RAM: 16GB. The number of test samples selected for each calculation was 36 test samples, and the experiment was conducted using a 10-fold cross-validation approach, with the average calculation time of the 10 operations used as the final calculation result.
Table 4 represents the running time comparison between the KD tree-based KNN and exhaustive-based KNN.
As can be seen from Table 4 above, the KD tree-based KNN algorithm runs in less time and the complexity of the algorithm is lower compared to the exhaustive-based KNN algorithm. The application scenario of radio fuzing requires signal processing algorithms with fast and strong real-time characteristics, so the KD tree-based KNN algorithm can meet the requirements.

6. Conclusions

A method is proposed to classify and identify the target of a radio fuze and the AM sweeping interference signal using third-order spectral features and to effectively classify and identify the output signal of the detector under the action of the target and the typical AM sweeping interference signal of an FM fuze. The third-order spectrum of the signal contains not only the frequency information but also the phase information of the signal compared with the second-order spectrum, which can extract the characteristic information of the signal to a greater extent. To reduce the complexity of calculation, some of the third-order spectral regions are selected for feature extraction, and the third-order spectral amplitude means, third-order spectral amplitude entropy, and third-order spectral singular spectral entropy are used as three-dimensional features. The results show that the third-order spectral features-based radio fuze target and interference signal classification and identification method can effectively identify the target and interference signal, and the highest comprehensive recognition accuracy can reach 98.33%, which has important reference significance for the research of radio fuze anti-interference design.

Author Contributions

Conceptualization, X.H. and B.L.; methodology, B.L.; validation, B.L.; writing—original draft preparation, B.L.; writing—review and editing, X.H.; supervision, X.H.; data curation, P.Q., X.C. and W.Z. All authors have read and agreed to the published version of the manuscript.

Funding

This paper was funded partly by the National Natural Science Foundation of China, Grant Number 61871414, and partly by the Basic Strengthening Project of Military Science and Technology Commission, Grant Number 2019-JCJQ-ZD-324.

Conflicts of Interest

The authors declare no conflict of interest.

References

  1. Fericean, S.; Dorneich, A.; Droxler, R.; Krater, D. Development of a microwave proximity sensor for industrial applications. IEEE Sens. J. 2009, 9, 870–876. [Google Scholar] [CrossRef]
  2. Chen, Q.L.; Hao, X.H.; Yan, X.P.; Li, P. A high-performance waveform and a new ranging method for the proximity detector. Def. Technol. 2020, 16, 1–12. [Google Scholar] [CrossRef]
  3. Choi, J.H.; Jung, M.S.; Yeom, K.W. A design and assessment of a direction finding proximity fuze sensor. IEEE Sens. J. 2013, 13, 3079–3089. [Google Scholar] [CrossRef]
  4. Choi, J.H.; Jang, J.H.; Roh, J.E. Design of an FMCW radar altimeter for wide-range and low measurement error. IEEE Trans. Instrum. Meas. 2015, 64, 3517–3525. [Google Scholar] [CrossRef]
  5. Kong, Z.J.; Yan, X.P.; Li, P.; Hao, X.H.; Wang, J.T. Jamming Mechanism of frequency sweep jamming to FM Doppler fuze. Acta Armamentarii. 2017, 38, 1716–1722. [Google Scholar]
  6. Yue, K.; Hao, X.H.; Li, P. An LFMCW detector with new structure and FRFT based differential distance estimation method. Springer Plus 2016, 5, 1–12. [Google Scholar] [CrossRef] [PubMed] [Green Version]
  7. Esmaeili-Najafabadi, H.; Ataei, M.; Sabahi, M.F. Designing sequence with minimum PSL using Chebyshev distance and its application for chaotic MIMO radar waveform design. IEEE Trans. Signal Processing 2017, 65, 690–704. [Google Scholar] [CrossRef]
  8. Choi, J.H.; Lee, J.M.; Jung, M.S.; An, J.Y.; Kim, K.L. FMCW transceiver of short-range proximity sensor in sea clutter. Microw. Opt. Technol. Lett. 2017, 59, 334–337. [Google Scholar] [CrossRef]
  9. Hanbali, S.B.S.; Kastantin, R. Technique to counter active echo cancellation of self-protection ISRJ. IET Radar Sonar Nav. 2017, 53, 680–681. [Google Scholar]
  10. Chen, Q.L.; Hao, X.H.; Yan, X.P.; Wang, X.W. Anti-DRFM jamming method using dual-channel harmonic correlation detection for variable chirp rate FM fuze. Acta Armamentarii. 2019, 40, 449–455. [Google Scholar]
  11. Chen, Q.L.; Hao, X.H.; Kong, Z.J.; Yan, X.P. Anti-Sweep-Jamming method based on the averaging of range side lobes for hybrid modulation proximity detectors. IEEE Access 2020, 8, 33479–33488. [Google Scholar] [CrossRef]
  12. Dai, J.; Hao, X.H.; Yan, X.P.; Li, Z. Adaptive false-target recognition for the proximity sensor based on joint-feature extraction and chaotic encryption. IEEE Sens. J. 2022, 22, 10828–10840. [Google Scholar] [CrossRef]
  13. Li, X.X.; Xiao, Z.L.; Zhu, Y.Y.; Zhang, S.N.; Chen, S. Carrier-Free UWB sensor Small-Sample Terrian recognition based on improved ACGAN with Self-Attention. IEEE Sens. J. 2020, 22, 8050–8058. [Google Scholar] [CrossRef]
  14. Zhu, Y.Y.; Zhang, S.N.; Zhu, L.Z.; Sun, Y.Y.; Chen, S. Hierarchical dictionary learning for vehicle classification based on the carrier-free UWB radar. IEEE Trans. Geosci. Electron. 2020, 60, 1–12. [Google Scholar] [CrossRef]
  15. Huang, Y.; Hao, X.H.; Kong, Z.J.; Zhang, B. Recognition of Target and jamming signal for FM fuze based on entropy features. Acta Armamentarii. 2017, 38, 254–260. [Google Scholar]
  16. Zhong, Y.; Yang, Y.; Zhu, X.; Dutkiewicz, E.; Zhou, Z.; Jiang, T. Device-Free sensing for personnel detection in a foliage environment. IEEE Geosci. Remote. Sens. Lett. 2017, 14, 1–5. [Google Scholar] [CrossRef]
  17. Zhong, Y.; Bi, T.Q.; Wang, J.; Wu, S.L.; Jiang, T.; Huang, Y. Low data regimes in extreme climates: Foliage penetration personnel detection using a wireless network-based device-free sensing approach. Ad Hoc Netw. 2021, 114, 102438–102448. [Google Scholar] [CrossRef]
  18. Mookiah, M.R.K.; Acharya, U.R.; Lim, C.M.; Petznick, A.; Suri, J.S. Data mining technique for automated diagnosis of glaucoma using higher order spectra and wavelet energy features. Knowl.-Based Syst. 2012, 33, 73–82. [Google Scholar] [CrossRef]
  19. Berraih, S.A.; Baakek, Y.N.E.; Debbal, S.M.E.A. Pathological discrimination of the phonocardiogram signal using the bispectral technique. Phys. Eng. Sci. Med. 2020, 43, 1371–1385. [Google Scholar] [CrossRef]
  20. Mahmoodian, N.; Boese, A.; Friebe, M.; Haddadnia, J. Epileptic seizure detection using cross-bispectrum of electroencephalogram signal. Seizure-Eur. J. Epilep. 2019, 66, 4–11. [Google Scholar] [CrossRef] [Green Version]
  21. Borges, F.; Pinto, A.; Ribeiro, D.; Barbosa, T.; Pereira, D.; Magalhaes, R.; Barbosa, B.; Ferreira, D. An Unsupervised method based on support vector machines and high-order statistic for mechical faults detection. IEEE Lat. Am. Trans. 2020, 18, 1093–1101. [Google Scholar] [CrossRef]
  22. Orlic, V.D.; Dukic, M.L. Automatic modelation classification algorithm using higher-order cumulants under real-world channel conditions. IEEE Commun. Lett. 2009, 13, 917–919. [Google Scholar] [CrossRef]
  23. Su, W. Feature space analysis of modulation classification using very high-order statistics. IEEE Commun. Lett. 2013, 17, 1688–1691. [Google Scholar] [CrossRef]
  24. Dong, Z.Y.; Lv, F.R.; Wan, T.; Jiang, K.L.; Fang, X.L.; Zhang, L. Radar signal modulation recognition based on bispectrum features and deep learning. In Proceedings of the 2021 International Conference on Computer Engineering and Application, Kunming, China, 25–27 June 2021. [Google Scholar]
  25. Garth, L.M.; Bresler, Y. A comparison of optimized higher order spectral detection techniques for non-Gaussian signals. IEEE Trans. Signal Processing 1996, 44, 1198–1213. [Google Scholar] [CrossRef]
Figure 1. Data acquisition experiment scenario.
Electronics 11 02474 g001
Figure 2. Fuze output time–domain signals under the action of the target and jamming. (a) Target action output signal; (b) Noise AM frequency sweep action output signal; (c) Sine AM frequency sweep action output signal; (d) Square AM frequency sweep action output signal.
Electronics 11 02474 g002
Figure 3. Contour plot of three order spectrum and 3D plot for fuze output signals under the action of target and jamming. (a) Contour plot of three order spectrum and 3D plot for the target signal; (b) Contour plot of three order spectrum and 3D plot for noise AM frequency sweep signal; (c) Contour plot of three order spectrum and 3D plot for sine AM frequency sweep signal; (d) Contour plot of three order spectrum and 3D plot for square AM frequency sweep signal.
Electronics 11 02474 g003aElectronics 11 02474 g003b
Figure 4. Schematic of selected area for feature extraction.
Electronics 11 02474 g004
Figure 5. Box diagram of different signal features. (a) Box diagram of three order spectrum average amplitude feature; (b) Box diagram of three order spectrum entropy feature; (c) Box diagram of three order spectrum singular spectrum entropy feature.
Electronics 11 02474 g005
Figure 6. Scatter plot of different signal features.
Electronics 11 02474 g006
Figure 7. Plot of experiment results. (a) comprehensive recognition accuracy; (b) target recognition accuracy; (c) jamming recognition accuracy; (d) probability of being jammed.
Electronics 11 02474 g007
Table 1. Third-order spectral features significance test results.
Feature Typep-Value
Third-order spectral amplitude mean feature1.0285 × 10−55
Third-order spectral amplitude entropy feature6.4729 × 10−45
Third-order spectral singular spectral entropy feature7.3621 × 10−85
Table 2. Optimal recognition results of different parameters.
Evaluation IndicatorsDistance CalculationNumber of Nearest NeighboursResultsProbability of Being Jammed
Comprehensive recognition accuracyEuclidean distance2798.06%0.83%
Manhattan distance498.33%1.11%
Chebyshev distance398.06%1.11%
Target recognition accuracyEuclidean distance698.64%1.39%
Manhattan distance399.0%1.39%
Chebyshev distance698.64%1.39%
Jamming recognition accuracyEuclidean distance130100%0
Manhattan distance98100%0
Chebyshev distance146100%0
Table 3. Comparison of the performance of the proposed signal feature extraction method with the reference.
Signal Feature Extraction MethodsDistance CalculationNumber of Nearest NeighboursComprehensive Recognition AccuracyTarget Recognition
Accuracy
Jamming Recognition Accuracy
Our MethodChebyshev distance398.06%98.11%95.43%
Reference [15]Chebyshev distance392.01%94.12%91.14%
Reference [16]Chebyshev distance394.17%93.58%94.87%
Table 4. Algorithm running time comparison (unit: seconds).
Distance CalculationKNN Algorithm Search MethodK Value
50100150
Euclidean distanceKD tree-based1.3346 × 10−41.5592 × 10−42.3757 × 10−4
exhaustive-based1.8121 × 10−42.0652 × 10−42.4106 × 10−4
Manhattan distanceKD tree-based1.1571 × 10−41.3203 × 10−41.7362 × 10−4
exhaustive-based1.7081 × 10−41.8351 × 10−41.9569 × 10−4
Chebyshev distanceKD tree-based1.0857 × 10−41.2173 × 10−41.5153 × 10−4
exhaustive-based1.5446 × 10−41.7651 × 10−41.8902 × 10−4
Publisher’s Note: MDPI stays neutral with regard to jurisdictional claims in published maps and institutional affiliations.

