1. Introduction
Modern information systems and increased usability introduce new cyber security challenges. They usually do not have a constant structure and allow connecting and disconnecting various types of devices (in the scope of Internet of Things technology, or the Bring Your Own Device concept) that can provide new entry points for cyber attacks. Moreover, installation and updates of hardware and software, and changes in access policies, can result in new cyber security breaches. To avoid losses from cyber attacks within information systems, it is essential to monitor infrastructure modifications and reassess cyber security risks based on possible attack paths analysis [
1,
2,
3]. One of the key points while assessing cyber security risks is understanding the organizational assets that can become the target of cyber attacks, and their value [
4]. Here we consider all physical and information objects of an information system as assets with different values for an organization. Another important aspect is understanding of interconnections between the assets and their security breaches that can lead to the successful implementation of multi-step cyber attacks based on lateral movement within the organization network.
Identifying assets and their connections in constantly changing environments is a complicated task. Infrastructure holders should conduct routine measures to implement it, which become tedious and costly. Wrong specification of assets can result in improper identification of cyber security hazards.
Until recently, organizations usually implemented assets inventory by manually adding them to databases. This process can be partially automated using network scanning tools. They allow detecting network entities, such as services, ports, hosts, and network devices. Nonetheless, this approach does not grant computerized identification of all entity types, including network connections, users, authorizations, operating systems, service dependencies, etc. as well as a ranking of these entities. This blocks obtaining a real live model of the organization’s software and information infrastructure. Recently, with the development of information system monitoring tools, new approaches and tools to assets inventory based on gathered data analysis have begun to appear. However, the main limitation of such approaches and tools is related to specific data management formats [
5,
6,
7]. Hence, though lots of large organizations work with asset inventory, the challenge of automated detection of all object types and their hierarchy in real time is still not worked out [
8,
9].
In this paper, we introduce a new two-stage technique for automated identification of entire system assets, specifically both physical and information assets, and for revealing connections between them. The first stage of the technique was presented at the 1st IFIP NTMS Workshop on “Cybersecurity on Hardware (CyberSECHARD)”, in conjunction with the 10th IFIP International Conference on New Technologies, Mobility and Security (NTMS) [
10]. It is formed on the event correlation apparatus [
11]. We take as an input the unspecified events log. First, we use the volatility of object characteristics to isolate the association of characteristics to the specific information category to understand the event structure. Then, we specify types of infrastructure assets based on computing and study the pair usage rates for event properties. In this paper, we provide some additional details on the first stage of the technique.
The second stage is related to the determination of connections between the objects. This stage is essential for the further determination of possible cyber attack paths. We propose outlining the connections using two steps: (1) determination of objects hierarchy (from separate ports to the whole network) based on the total use rate of objects’ characteristics; (2) determination of relations between the objects based on an event’s type (it should be an interaction event).
Finally, we discuss an automated calculation of the assets’ criticality. We propose to evaluate the object’s significance based on the total usage rates of characteristics.
Compared to the paper presented on CyberSECHARD, in this paper, we provide new experiments demonstrating the applicability of the developed technique.
Namely, compared to the paper presented on CyberSECHARD the contribution of this paper is as follows:
a new two-stage technique for automated identification of system assets and for revealing connections between them (in the paper presented on CyberSECHARD only the first stage related to asset determination was introduced);
detailing the technique for assets determination in terms of models and calculation of the parameters used for assets determination;
a discussion of an automated calculation of the assets’ criticality;
the experiments for the determination of objects using logs containing information from multiple hosts (in the paper presented on CyberSECHARD the experiments were conducted using a log from one host).
The rest of the article is presented as follows.
Section 2 considers related work in the field of event correlation and automated assets inventory as well as their significance in security risks evaluation.
Section 3 introduces the produced two-stage method of asset inventory and discusses assets criticality assessment.
Section 4 describes the data used for the experiments, the fulfilled empirical studies, and the outcome. Finally, the conclusion and planning of the forthcoming studies are given.
2. Related Work
Asset inventory is one of the essential processes while managing an organization. According to the ISO/IEC 19770 “International standard for Asset Management” asset management as a whole incorporates the following operations: asset identification, asset inventory management, and asset control [
12]. All of these procedures are established within the standard. ISO/IEC 19770 proposes using the eXtensible Markup Language (XML) data elements to recognize the software. As for the disadvantages of this approach, these are as follows:
it is unworkable to constrain the software established with open architecture;
it is challenging to use programs with XML tags without any other ones;
it is complicated to trace all the software of lately linked gadgets, cyber-physical units, or data from portable modules;
finally, the approach is suitable exclusively for program components.
There are systems for manual asset inventory; for example, the information security management system (ISMS) [
13]. In these systems, objects should be manually placed to the database as soon as they appear in the data infrastructure. It demands high time and financial expenses. Moreover, the given circumstance is not constantly feasible, for instance, in event of linked portable units to the system. Finally, in this paper, only some types of assets are considered. Thus, sessions, service dependencies, and processes are not in consideration.
Hardware/electronic asset accounting means are regarded as well, for example, barcode labeling, RFID tagging, and GPS active tracking. The disadvantages consist of the need to add the barcode, RFID tag, or GPS tracker to each asset and applicability to physical assets only.
Limitations of the manual approaches led to the development of automated tools and techniques. There are means for computerized object revelation in cluster structures [
5] and other mediums [
6,
7]. The main limitation is related to the specific data management format. For automated identification of network infrastructure including hosts, software, services, and their interconnections, the network scanners are usually used [
14,
15,
16]. Moreover, there are methods oriented toward the computerized discovery of service dependencies but these are not widely used [
17,
18,
19]. They do not allow specifying connections and relations between different objects clearly while it is essential for the security management task.
In this paper, we consider the asset inventory process from the security management point of view. Discovery of information system configuration as a whole and its assets in particular is one of the crucial procedures of security management because the results of one of its stages, namely risk assessment, highly depend on the precision of such procedures.
There is a set of specifications related to the asset identification and reporting processes that are included in the security content automation protocol (SCAP) [
20]. SCAP is developed to automate and facilitate security management processes. Specifications related to assets management constitute one of the basic blocks of SCAP. Thus, in [
21], the method and model for asset identification are provided. Asset identification may be used in the scope of the asset summary reporting document [
22] to list the assets. In [
22], a model of data exchange format expression for aggregated assets is introduced. Asset summary reporting may be used as a part of an asset reporting format document [
23]. In [
23], a data model of data exchange format expression for assets and relationships between them and reports is introduced. However, there is still an open question as to how to detect assets before their identification and reporting on them.
The security management task has additional requirements of assets detection, namely its operation time (it should be decreased) and its coverage. As was stated in the introduction, we consider all physical and information objects of the information system as assets. Different types of objects, including physical objects, information objects from ports to the network as a whole, as well as malicious and legitimate objects should be detected. Security management, particularly risk assessment, incorporates the determination of critical system assets as well as analysis of potential threats to these assets including threats likelihood and possible impact determination [
24]. Whereas delineation of the important assets of the system is taken into consideration, the essential business assets (e.g., secret modules), the supporting assets, and connections between assets (sessions and dependencies) must be regarded deliberately. Additionally, when conducting security analysis, the malignant entities (processes, sessions, files) should be caught. All the previous objects and connections are transformed occasionally, which makes the task of their determination challenging. We state that the ground for the computerized risk evaluation technique in its use for any practical case is an identification of the originally “lively” assets being modified in runtime. However, existing methods and tools demand considerable manual operations as well as do not grant identification of all categories of assets and connections between them.
In this paper, we introduce the two-stage technique to identify the dynamic objects belonging to an undetermined infrastructure and the connections between them using the dynamic data investigation. We call the infrastructure “undetermined” because we do not learn all the assets of this infrastructure initially. The proposed method grants forming a real alive structure of the target software complex. The work is close to the studies using machine learning [
8]. In [
8], Tuchs and Jobmann use time regularity features of event categories to identify the assets. Unlike in that paper, we use alternative features of the source data in our research, such as the usage degree and variability of properties and their values. It grants a more exact revelation of objects. Another work that is quite similar to ours is [
9]. However, in [
9], Motahari-Nezhad et al. regard event series, whereas we operate with the ranking of assets and their categories, and then proceed with the investigation of event array of independent objects. In our opinion, it is granting a more precise comparison of event series, distribution of the events by association with the objects, and revelation of connections among them.
The technique proposed in this paper allows outlining of different types of objects and connections between them, but it does not allow uniquely identifying objects as well as differentiating malicious and legitimate objects at this stage. The Common Platform Enumeration (CPE) can be practiced to address software and hardware [
25]. However, within the framework of the CPE, one can declare a range of ambiguities impeding the revelation [
26]. The obstacles of the unambiguous revelation are not within the scope of this paper. At this stage, our goal is to identify infrastructure objects through tracing data in the infrastructure. The revelation precision will depend on the precision/recall of the recorded event entries list. Moreover, the event logs of different systems have different specifications. Therefore, a great prior activity is required, connected to the analysis of the event logs. The advantage of the proposed technique in this paper is that it takes as input data unspecified input logs and thus it is flexible, i.e., compatible with different data management systems.
Our technique is focused on correlation means. Currently, the most promising approaches to correlation are the self-learning methods, for instance, Bayesian models, immune networks, and artificial neural networks [
27]. Despite these schemes being applied to detect attacks, we state that the data correlation could be used for automated disclosure of information objects as well. We argue that dynamic analysis and computation of the static and dynamic indicators will enable resolution of the principal event sources (i.e., objects and their types), their criticality, and connections between them. Both types of indicators include time rate features of event categories, volatility of event characteristics, pair exploitation degree of event characteristics, and entire exploitation degree of the characteristics. The next section describes the proposed technique in detail.
3. Asset Inventory Technique
The common plan of the proposed approach is represented in
Figure 1. Any object (or asset) of information system have characteristics (or properties). In process of its life cycle (it can include such stages as creation, connection to other objects, and changing of a state) an object produces the events. The events in their turn incorporate information on the object’s characteristics. In our research, we explore the events (
Section 3.1) to determine the assets (
Section 3.2) and their connections (
Section 3.3).
First, let us determine an analyzed information system infrastructure. Assume we do not hold any anticipatory awareness of the end system. An infrastructure S consists of a range of objects O and a range of relations : . The objects can belong to various types (e.g., “sensor”, “host”, “file”, “software”). These types belong to various classes: physical objects and logical objects. The physical assets cover asset categories, for instance, “sensor”, “host”, and others. The logical assets incorporate such object types as “file”, “software”, “service”, “process”, etc.
Each object type
is specified using the unique set of characteristics (or properties)
,
,
:
. Every asset
o is determined by a range of pairs
x:
where
r—an overall quantity of possible properties,
—a value of , ,
—a set of possible values, , ,
k—number of possible values of ,
V—a range of all object properties, .
The properties x of information infrastructure objects can be static or dynamic. The value of a static property on average is changed considerably less frequently than the value of a dynamic property. For instance, static properties can be “process name” or “host name”. At the same time, the value of a dynamic property varies several times whereas the value of static property remains unaffected. An example of a dynamic property is “process identifier”. The static properties enable tracing the behavior of the same asset in time since they stay unaltered. The dynamic properties enable tracing an object’s death and its new emergence since their values vary in process of time. For example, it can be an extra process start.
We investigate the log entities (or events) the different assets create. An event e is evidence/outcome of an operation. It can be a try of operation, the start of the operation, an intermediate outcome of the operation, and the end outcome of the operation.
Specification resulting from different assets consists of characteristics of the corresponding assets (
in Equation (
1)). Every event
e is determined by the range of pairs:
where
—an event characteristic,
,
,
P—a range of all event characteristics, ,
d—the complete amount of properties,
—an event property value, ,
—a range of the possible values, ,
h—number of possible values of the property , ,
V—a range of full list of event characteristics, .
Depending on the event type the properties can belong to one object o or to several objects, i.e., or . In the process of the technique operation we regard each event e and outline the event characteristics p that emerge purely together. Let us call these ones characteristics x of an asset o. The constructed technique covers the next phases:
object specification, i.e., in this phase one can conduct statistical data analysis of available data in order to check the categories of characteristics, the categories of assets of the target infrastructure, and the specific assets of the system;
determination of objects hierarchy and connections between the objects.
Moreover, there is a preliminary stage related to income collecting and preliminary handling. According to this phase, one can obtain information about the events from logs and unify these for the sake of the next treatment.
The details of the technique stages are given in the next subsections.
3.1. Input Data Collecting and Preprocessing
First, we collect events from the data logs. These events are produced by the physical and information objects of the information system. The range of events
E represents income for the statistical analysis. It is specified as follows:
, where
m—the entire amount of events and
e is specified by means of Equation (
2). To perform processing of the event properties (
p in Equation (
2)), one must unify the values (
v in Equation (
2)). Otherwise, the accuracy of revealing characteristic categories and asset categories would be decremented.
3.2. Assets Determination
Determination of assets (or both physical and information objects of the information system) comprises the following steps: (1) identification of event characteristic categories via analysis of the possible values of characteristics in the event log (for example, process id represented as a number, or process name represented as a text)—these event characteristic categories correspond to the property categories of physical and information objects and are required for their further determination; (2) identification of object types via analysis of event characteristic types that occur together to identify the object types (for example, process identifier and name that represent the process); (3) identification of objects via analysis of characteristic values of object types in time to reveal the objects (for example, to distinguish one process from another process of the same type).
Identification of event characteristic categories. Here we analyze a range of all event characteristics P (as soon as the events are produced by the information and physical objects, these characteristics represent objects’ properties) to identify a range of the property categories . The range of characteristic categories is described as follows: , where n—the entire amount of categories. The sets P and are associated by the relation of belongingness. This allows mapping the semantically equivalent characteristics whose names differ (for example, properties that represent process Id can be called processId or procID). Our solution consists of the exploitation of a pair variability index for the characteristic values to identify if the properties belong to a certain type of data. The characteristics (both of events and objects) can be static and dynamic. For example, the name of the device usually is not changed (it is conditionally static), while the process identifier will change over time. It should be considered while calculating the variability of characteristics. Namely, for dynamic characteristics the lifetime should be considered.
To identify the dynamics of characteristics, all values of all characteristics are regarded considering their variation. The authors decided to use the index —an absolute value of characteristic variability, and the index —the mean use rate of values for each characteristic p, to identify the dynamics of characteristic.
is calculated on the basis of the entire amount of observed values as follows:
where
—the entire amount of watched values of
p.
is calculated as follows:
where
—number of event instances containing the characteristic,
—the entire amount of the observed values of the characteristic.
For the static properties the following expressions are valid:
while for the dynamic properties the expressions take the following form:
The index of pair variability for characteristic values in the case of static characteristics is computed as follows:
where
—values of the characteristic
p.
It means that the characteristics and belong to one data type if their values are equivalent.
For the dynamic characteristics, the authors additionally regard the lifetime of the characteristic values when identifying the types, i.e., consider the variability of characteristic values on the lifetime gap.
Identification of object types. Here the authors outline the groups of characteristics using the pair use rate. For the characteristics
and
it is calculated as follows:
where
—a set of events that use the characteristic
p.
The outlined using the predefined threshold groups specify the object types in the first nearness. To determine the object types more precisely, the groups should be checked.
Identification of objects. Here the authors identify objects of various types through the analysis of values of object type characteristics in time.
It is assumed that information objects (assets) are specified using static and dynamic characteristics within the considered infrastructure. Static characteristics, such as process/host name, are necessary for the revelation of process/host objects in space, respectively. Dynamic characteristics, such as process/session identifier, are necessary for the isolation of the lifetime of the objects. For instance, from the process beginning to its finishing. An extra function of these identifiers is to isolate various object instances that “live” at the same time gaps.
3.3. Connections Determination
This stage includes the following steps: (1) determination of objects hierarchy using the total use rate of objects’ properties; (2) determination of relations between the objects based on the event’s type.
Determination of objects hierarchy. Let us clarify first what the hierarchy of objects is, in our opinion. There are multiple objects within the system. These objects can be divided by levels on high-level objects, such as hardware with installed software or firmware, and low-level objects such as software. In its turn, the software can also be divided into levels: ports, interfaces, applications, and operation systems. Thus, there is a hierarchy of objects within each high-level object. Each of such object types has its own properties. In process of communication some of these properties will appear in every event, while others will appear or not depending on the goal of communication. Thus, the identifier of the device will appear in every event related to this device, while the specific port number will appear only in the case of operations that go through this port. Therefore, we construct our hierarchy based on the total use rate of objects’ properties to divide high-level and low-level objects. The total use rate of the property
is calculated as follows:
where
E—the ratio of the characteristic useation number in the events,
n—the total number of events.
The higher the use rate object’s properties, the higher the object in the hierarchy.
Determination of relations between the objects. Here the technique generates the connections between the objects. These connections depend on the event type. We outline the following types of events: (1) changing of the object state and (2) interaction between the objects that determines the existence of a connection between the object types.
Discussion on assets’ criticality. Outlined object types, their hierarchy and connections between them can be further used for criticality assessment of the assets and determination of possible cyber attack paths against the information systems.
The critical objects can be considered the most used objects of infrastructure. In this case, the hierarchy of objects and the total use rate of the property specified above can be applied as follows: (1) determine an object’s place in the hierarchy as the ordering number of the object in the hierarchy (object types are ordered from the less used to the most used); (2) determine the object’s relative criticality via normalization by the total number of levels l in the hierarchy: .
The disadvantage of the approach described above is that rarely used but critical assets are not considered. We plan to consider this issue in future research. Moreover, in future research the authors plan to use considered dynamic infrastructure for cyber attacks simulation to calculate probabilities of attacks. The probabilities of attacks together with objects’ criticalities will be used to analyze cyber security risks for the information system.
4. Implementation and Empirical Studies
The developed technique was instrumented by means of Python 3.5 language and several libraries, including numpy, scipy, and pandas. The outcome is presented by the GraphViz module. We performed the primary empirical studies by using a 6-core processor Intel(R) Xeon(R) CPU E5-2603 v3 @ 1.60 GHz and 64 GB RAM. In our previous research [
10], we demonstrated the applicability of our technique in the scope of one host—we used the security log of the host running OS Windows 8. In this paper, we describe experiments conducted using the Windows security events log of the test network from National Collegiate Penetration Testing Competition 2019 (National CPTC 2019) [
28]. It should be noticed that our technique is developed to automatically reveal unspecified objects (including information system assets and malicious objects) considering that the logs under analysis can be unspecified. For the experiments, we selected the specified Windows security events log to be able to check the results of the technique operation on the example of information objects. We tested in the experiments two first steps of the proposed technique: (1) identification of event characteristic categories, and (2) identification of object types, and previously demonstrated identification of the objects’ hierarchy. Experiments on the determination of the connections will be conducted in future research.
Input for the empirical studies. We conducted experiments using the dataset from the National CPTC 2019 [
28]. The dataset is gathered in process of attacks against the fictitious company DinoBank which is a financial institution. The personalities of this company are represented using over 40 character roles [
29]. The dataset incorporates event logs of different systems of DinoBank gathered during regional and national competitions in Splunk format [
30]. Currently, we used for experiments just Windows security events log from the described dataset. The regarded log has the following features: the number of events ∼45,000,000; log size is 57 GB in the CSV format; the number of event characteristics (particularly the characteristics with the only zero watched value)—118; log record time ∼1 day 9 h 15 min.
Data preprocessing. This stage included the following steps:
converting the security events dataset from the proprietary Splunk format to the CSV format, which is more suitable for automated analysis;
normalization of event characteristics and their values for further proper examination.
Now the normalization activity runs through an assessment of expert opinions. The normalization outcome is presented below on an example of the following Windows events:
These events contain the property “ProcessID”. Its name differs from other process ID properties “ProcessId”. This minor imprecision can considerably decrease both the quality of the identification of characteristic types and the quality of the identification of object types. A possible solution is transforming the names of characteristics into one case. In the considered case, the name “ProcessID” was transformed to “ProcessId”. Further analysis should regard the possible gaps in the input data in case of unmatched structures of event type characteristics.
Identification of event characteristic categories. In the empirical studies, the authors applied the indexes introduced in
Section 3 to identify the types of characteristics (the pair variability of characteristic values) and objects (the pair use rate of characteristics).
Identification of event characteristic types is necessary to produce the list of characteristics of information objects. The set of these characteristics describes the type of specific object.
We checked values of all characteristics from the point of view of their varying using Equations (3) and (4) first. The outcome of measurements of dynamic indexes values for the analyzed log is represented in
Figure 2 for the following properties:
NetworkInformation.WorkstationName (NetInf.WNam),
NetworkInformation.SourceAddress (NetInf.SAddr),
NetworkInformation.NetworkAddress (NetInf.NAddr),
NetworkInformation.ClientAddress (NetInf.CAddr),
TargetServer.TargetServerName (TServ.TSNam),
ProcessInformation.ProcessID (PInf.PId),
Process.ProcessID (Proc.PId),
ProcessInformation.NewProcessID (PInf.NewPId).
In
Figure 2,
index corresponds to the “entire quantity of values” and
index corresponds to the “average quantity of events per one property value”.
Figure 2 shows that the “ProcessInformation.ProcessID” property and “ProcessInformation.NewProcessID” property are the most dynamic. However, this estimation is rather rough because property dynamics should be estimated in time.
The authors measured the dynamic indexes at each time point for the whole period from the start of the examinations. The variability index reaches specific boundary values on the observed time gap. This circumstance does not mean achieving the available peak for the successive assessments. However, these charts show the dynamics of characteristics in connection to each other. For example, the “NetworkInformation.SourceAddress” characteristic is quite static (Equation (
5)), whereas the “ProcessInformation.ProcessID” characteristic is quite dynamic (Equation (
6)). As a drawback, the developed approach for the assessment of characteristic dynamics uses the absolute values of the chosen indexes. Specifically, it is reasonable to compare characteristic dynamics on the base of these indexes if the pair use rate of characteristics is quite great. In another way, a relative value of dynamics should be used. This represents a prospective study for the future.
Within the performed empirical studies the properties were grouped semantically rightly. For instance, the “ProcessInformation.ProcessID” and “ProcessInformation.New-ProcessID” characteristics are mapped with 0.96 pair variability index from Equation (
7) (that changes from 0 to 1, where 1 indicates complete mapping), whereas the “NetworkInformation.WorkstationName” and “TargetServer.TargetServerName” characteristics are mapped with 0.28 pair variability index. This means that they are semantically different.
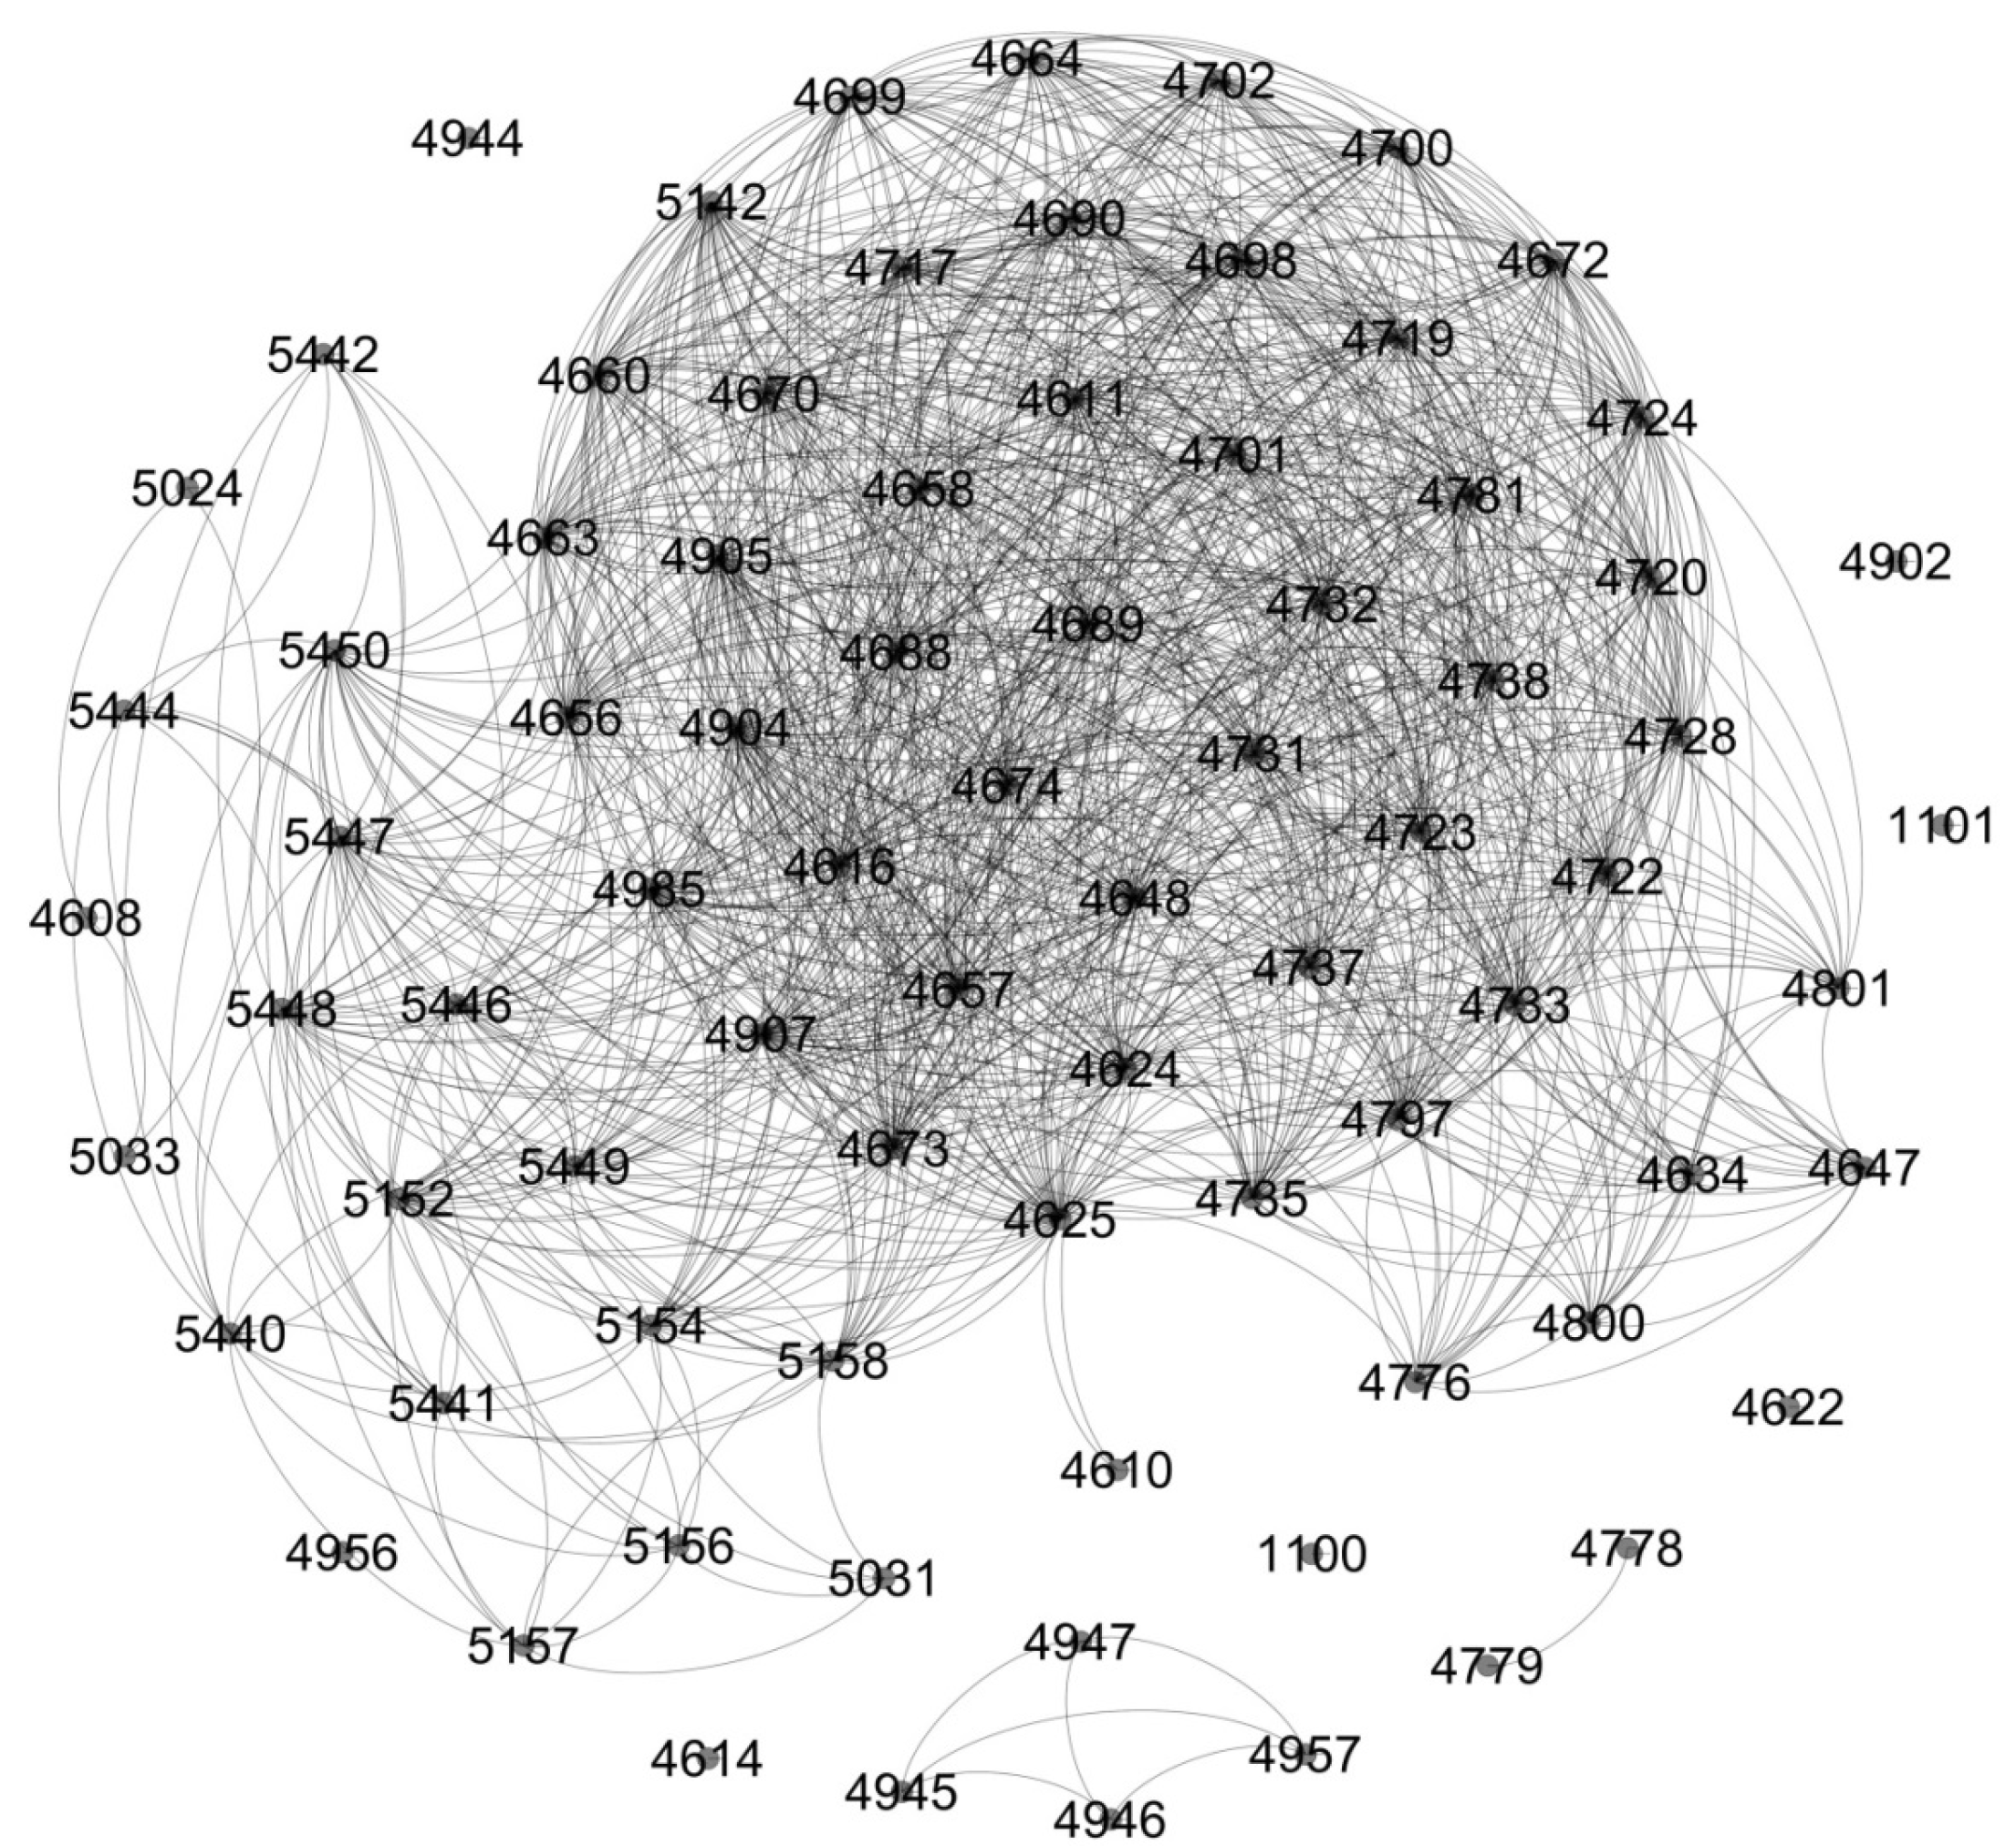
Identification of object types and their hierarchy. To identify object types and their interconnections we determined the interconnections between the event characteristics first (
Figure 11). Some of these interconnections represent relation to one object type, while others—interconnection between the object types.
While identification of object types using the pair use rate of characteristics (Equation (
8)) the following hypothesis was used: the same use of event characteristics means their belongingness to one or more object types of the same level. The empirical studies allowed outlining 60 groups of characteristics.
It should be noted that characteristics of one group are used in event types only jointly.
Figure 12 exposes an example of characteristic groups describing object types for OS Windows. Characteristic groups 1 and 2 correspond to the object types “Subject” and “Object” of interaction in the infrastructure, accordingly, while characteristic groups 3 and 4 correspond to the object types “Source” and “Destination” of network connection, accordingly.
Figure 12 presents the entire use rate of group characteristics for each group.
The outcome of the experiment previously approves the hypothesis above. Further clarification of object type determination demands more exhaustive consideration. For instance, it can be based on computing correlation coefficients.
It can be noticed that the higher the entire use rate of group characteristics for each group, the higher the object type in the objects’ hierarchy (
Figure 12).
There are also characteristics with different pair use rate. This indicates relation between the properties of different objects and, consequently, interconnection of information objects. Thus, for example, interconnections between the “Source” and “Destination” object types that are related to more general type “Network Resource” are represented in
Figure 13. Further determination of specific objects and their interconnections require additional research.
Determination of information system objects and their types as well as determination of their interconnections and criticality (the experiments are planned in future work) is essential for cyber security. Namely,
automated determination of information system objects and their types is the basis for analysis of object’s behavior and detection of anomalies that can indicate successful cyber attacks [
31];
object criticality is the basis for the security risk assessment and further security decision support, namely, abnormal behavior of the critical object can be a reason for the countermeasures implementation [
31];
determination of information system objects (their vulnerabilities) and interconnections is the basis for the construction of possible paths of cyber attacks and their further elimination [
31].


