
A Coupling Analytical Method of a Fuel Control System under Electromagnetic Pulses

1
College of Energy and Power Engineering, Nanjing University of Aeronautics and Astronautics, Nanjing 210016, China
2
College of Field Engineering, Army Engineering University of PLA, Nanjing 210000, China
*
Author to whom correspondence should be addressed.
Electronics 2022, 11(14), 2264; https://doi.org/10.3390/electronics11142264
Submission received: 13 June 2022
/
Revised: 15 July 2022
/
Accepted: 19 July 2022
/
Published: 20 July 2022
(This article belongs to the Section Systems & Control Engineering)
Abstract
:This study presents an electromagnetic coupling analytical method of a fuel control system under electromagnetic pulses. With the increasing complexity of the electromagnetic environment, improving the survivability of the aero-engine fuel control system is of great importance. By analyzing the electromagnetic interference of the aero-engine fuel control system under electromagnetic pulses, a coupling analytical method of an aero-engine fuel control system under electromagnetic pulses was proposed. The method tested the control system to obtain the coupling signal of the controller through the bulk current injection (BCI) test. Subsequently, the numerical model of the terminal coupling signal of the controller under an electromagnetic pulse was established, and the influence of the terminal coupling signal on the terminal circuit was investigated by numerical simulation. The method locates sensitive components of the control system and determines if the internal mechanism of the electromagnetic pulse effect is the interference of the pulse signal to control signal links. The coupling signal model is established to predict the coupling signal of the main fuel regulation control system. It identifies potential solutions to BCI method limitations that have an impact on reducing test costs.
1. Introduction
The complex electromagnetic environment makes all kinds of electromagnetic sensitive devices more susceptible. When the aero-engine control system is disturbed, the electromagnetic pulse will be coupled into the equipment through radiation and conduction which causes the system to malfunction [1,2]. To enhance the survivability of the aero-engine control system under electromagnetic interference, the coupling analysis of the control system under electromagnetic pulses becomes important research in the field of electromagnetic compatibility.
The aero-engine control system is mainly composed of the fuel regulation control system, airflow control system, cooling system, and other subsystems. The fuel control system converts the control command into the actual fuel flow, as shown in Figure 1. When the system is interfered with by an electromagnetic pulse, it will be sensitive, which will affect the working state of the aero-engine.
When measuring the electromagnetic emission and susceptibility of equipment under test (EUT), there are commonly two simulation test methods: the injection method and the radiation method. To simulate the electromagnetic sensitivity of the system in a real electromagnetic (EM) environment such as a nuclear explosion and electromagnetic pulse weapon, the radiation method obtains the electromagnetic sensitive characteristics of the control system and provides a theoretical basis for the protection of the system. However, due to the limitation of laboratory conditions, the current injection test method was developed to replace the radiation test [3,4].
Reference [5] proposed a statistical modeling technique known as the random coupling model (RCM). This study predicts effects on sensitive electronic targets in large, real-world, lossy enclosures such as office buildings, ship compartments, and aircraft compartments. Reference [6] presents a new method for calculating the cavity modes of cylindrically symmetric cavities and applies the method to stacked dielectric resonators (DRs) inside a conducting cylindrical shell. Reference [7] developed a hybrid method based on the combination of electromagnetic topology and analytical or full-wave simulation. The results of the proposed method are in good agreement with the result of a commercial full-wave tool, which confirms its validity. Reference [8] developed an efficient analytical model based on electromagnetic (EM) topology for predicting the EM field coupling with a lossless penetrated transmission line (TL), for which the termination loads are located in two enclosures. The finite difference time domain method has successfully verified the analytical model over a broad frequency range. Reference [9] proposed a wideband coupling analysis method for arbitrarily incoming sources based on the EMT technique for complex waveguide structures, including a printed circuit board. The validity of the approach is verified by comparing the CST MICROWAVE STUDIO (MWS) and measurement results. There is less literature research on the degrees of controller’s electromagnetic coupling effect of the main fuel control system by a hybrid analytical method. Therefore, that will be researched in this paper.
Many studies reveal that electromagnetic power is converted into voltage variations on the signal links [10,11,12]. Therefore, the simulation and test methods are proposed, which have achieved good results [13,14,15]. In addition, numerous studies have analyzed the coupling of electronic systems under the action of electromagnetic pulses [16,17,18,19]. Reference [20] studied the electromagnetic coupling of the wiring harness in the bulk current injection and analyzed the effect of the termination impedance on the coupled signal. Conventional analytical and numerical approaches are inefficient for the analysis of the electromagnetic coupling effect on a printed circuit board (PCB) in complicated electric systems. Reference [21] assessed the electromagnetic sensitivity of the UAV sensors system utilizing the radiation test. The electromagnetic sensitivity of the engine was studied by the radiation test method, and the interference of electromagnetic pulse on the engine injection system was obtained [2]. Compared with the electromagnetic radiation sensitivity test method, the current injection test method replaces the radiation sensitivity test with the current conduction sensitivity test, which requires relatively simple test equipment. At the same time, the current can be injected for a specific frequency. In addition, when a strong electromagnetic pulse enters the electronic equipment, the control system will not completely produce electromagnetic effects. The separate analysis of equipment is not that important. In this paper, regarding the coupling signal of the aero-engine fuel control system under an electromagnetic pulse by the bulk current injection, the electromagnetic pulse coupling law of the control system is obtained, and the numerical coupling model of the controller under an electromagnetic pulse is established. The coupled numerical model is tested and verified. The analytical method determines the coupling mechanism of the control system and locates the sensitive components of the control system accurately, which determines that the internal mechanism of the electromagnetic pulse effect is the interference of the pulse signal to the control signal link, assisting the optimal design of the controller’s terminal circuit. At the same time, the method reduces the cost of repeating experiments.
This section briefly describes the related research in recent years. Section 2 introduces the coupling analytical method of the fuel control system under an electromagnetic pulse. Section 3 introduces the test system, test equipment, and test conditions, and completes the extraction of test results. Section 4 analyzes the test results and establishes the numerical model of the terminal coupling signal of the control system. Based on the predicted signal, the control terminal circuit is numerically simulated, and the electromagnetic sensitivity of the control terminal under an electromagnetic pulse is obtained. Section 5 is the conclusion.
2. The Electromagnetic Coupling Analytical Method
The electromagnetic sensitive analytical method of the engine control system under the electromagnetic pulse is predominantly tested by the experiment method. This method can only detect the electromagnetic susceptibility of the system and each component, but cannot precisely locate the sensitive position, and is not clear about the internal connection. Subsequently, this paper proposes a coupling analytical method for the controller terminal coupling under electromagnetic pulse, as shown in Figure 2.
Based on the results of the BCI test, a numerical model of the coupled signal at the controller’s terminal under an electromagnetic pulse is established. At the same time, the terminal circuit is constructed by numerical simulation calculation method, the terminal circuit of the controller is analyzed, and the sensitive electronic devices of the controller terminal are obtained.
The terminal circuit of the aero-engine controller is principally composed of a functional module, a power module, and a control module. When the controller is impacted by an external electromagnetic pulse, the pulse will couple into the terminal circuit of the controller to cause electromagnetic interference or damage to the electronic components. The coupling signals will be generated due to the different loads of the terminal circuit of the controller. Therefore, this paper monitors the terminal signal of the speed signal cable. The cable passes through the current injection probe and is at a certain height from the ground, and its two ends are respectively connected with the controller and the sensors. The current injection probe is placed at a certain distance from the controller, and the pulse signal source is connected with the current injection probe through a wire.
During the test, pulse current signals with different frequencies are injected into the cables of the control system. The pulse signal is gradually increased until the amplitude of the signal reaches the peak value. To monitor whether the performance of the control system is decreased, the sensitivity and damage threshold of the aero-engine fuel control system is determined by monitoring the coupling signal of the control terminal, which provides the analytical method for the electromagnetic protection of the controller in the future. The sensitivity of the aero-engine fuel control system is the amplitude of the coupling voltage of the controller when the sensitive phenomenon occurs in the system under a strong electromagnetic pulse. The damage threshold of the aero-engine fuel control system is the amplitude of the coupling voltage of the controller when the controller is destroyed under a strong electromagnetic pulse. The injecting signal at 100 MHz is shown in Figure 3. In the experiment, the frequencies selected for the injected signal were 10 kHz, 100 kHz, 1 MHz, 10 MHz, 30 MHz, and 100 MHz.
3. Experiment
Referring to Figure 1, the aero-engine fuel control system is the investigative object in this study. It is mainly composed of 6 parts, as shown in Figure 4. It contains a controller, a rotating electrical motor, a linear motor, a speed sensor, a linear differential variable transformer (LVDT) sensor, and a DC power supply. The electromagnetic coupling effect of the system can be obtained by monitoring the differential mode voltage of the PCB ports and monitoring the sensitive phenomenon of the control system. The system controls the engine through the speed closed-loop control of the rotating electrical motor and the displacement closed-loop control of the linear motor. Among them, the speed closed-loop simulates the engine rotor speed acquisition, and the displacement closed-loop simulates the engine fuel metering, as shown in Figure 5.
Referring to MIL-STD-461F [22], this research injects the current signal into the controller’s connection cable. The injecting position is shown in Figure 6. The injecting displacement is 0.05 m away from the connector of the controller, the monitoring probe is placed away from the injection probe at 0.05 m. The experiment equipment is listed in Table 1. The probes monitor the input signal of the controller’s PCB and the injection signal. The sensitivity of the engine fuel control system is monitored. During the test, it is mainly ensured that the reference ground of the measurement system is consistent with the injection source, that is, the reference potential is consistent. If the potential is inconsistent, the pulse signal injected into the control system will have a larger ground bounce voltage, which will damage the PCB and power drive accessories. It is necessary to carry out the electromagnetic pulse sensitive test to analyze the coupling effect of the fuel control system under the action of an electromagnetic pulse. Figure 7 shows the test process.
Firstly, it is essential to ensure that the operating state of the control system remains normal. Secondly, to select the test port to conduct the test on the control system. Subsequently, to select pulse signals with different frequencies to inject into the control system and monitor the working state of the control system to determine whether the performance of the system has changed. Thereafter, to monitor the sensitive phenomena of the control system and carry out the above test procedure on other components of the control system. Lastly, to determine the electromagnetic sensitivity of the control system by the working states and sensitive phenomena of the control system.
4. Results and Analysis
4.1. Experimental Results and Phenomenon
In the test process, the electromagnetic sensitive effect and sensitivity of the aero-engine fuel control system under an electromagnetic pulse can be obtained by monitoring the working state of the control system. To inject the pulse current signal into the speed sensor, the system is sensitive when the frequency of the injected signal is 30 MHz. With the repeated injection of pulse current signal, the sensitive phenomenon occurs repeatedly, the speed of the DC motor will be abnormal, and the linear motor will have repeated displacement changes. When a sensitive phenomenon occurs, the voltage between the detection ports of the speed sensor is 80 V. Now, the electromagnetic pulse coupling signal causes the measured speed of the engine to change. According to the control strategy of the fuel control system in Figure 5, there is a linear correspondence between the speed and the fuel quantity. During the engine’s operation process, it is necessary to ensure the engine speed is stable. When the speed collected by the speed sensor increases, the fuel control system controls the output level of the linear motor to reduce the opening of the fuel pump valve needle. It reduces the amount of simulated fuel and changes the position of the valve needle of the simulated fuel pump. Then, the displacement of the linear motor shortens. Meanwhile, the LVDT sensor collects the displacement of the fuel pump valve needle. When the amplitude of the voltage signal is reduced, the rotation speed of the DC motor is reduced, and the closed-loop control of the rotation speed and displacement is completed.
4.2. Numerical Model of the Monitoring Port
By analyzing the coupling signal of the monitoring port injected into different positions, the electromagnetic pulse signal coupled into the terminal of the control system can be obtained. By analyzing the pulse signal of the component port under the test, the coupling signal model of the port is established. Under the condition of pulse signal injection, the influence of the coupled signal injected into the controller port on the output of each integrated chip of the controller is calculated by numerical simulation. At the same time, by analyzing the pulse signal and the coupling signal of the control system, the numerical model of the coupling signal of the control system under the electromagnetic pulse is established, which is verified by experiments.
In this paper, we attempt to select the signal of the speed acquisition port for analysis and establish the coupling model of the speed acquisition terminal under an electromagnetic pulse. The responsive signal is shown in Figure 8.
Through the numerical fitting of the pulse current injection signal, the pulse injection signal function related to frequency is established and normalized to obtain the pulse injection signal model, which is shown as
where I is the pulse current injection signal, A is the pulse current amplitude coefficient, B is the pulse current attenuation coefficient, f is the frequency of the injection signal, and t is the injection time. Table 2 shows the parameters of A and B.
The terminal coupling signal can be obtained by separating the monitoring signal of the speed port. Through numerical fitting of pulse signals, the response model of speed acquisition terminal under strong electromagnetic pulse is established and is shown as
where is the pulse current injection signal, is the pulse current amplitude coefficient, is the pulse current attenuation coefficient, is the frequency of the coupling signal, and t is the injection time. Table 3 shows the parameters of and .
The transfer function refers to the ratio of the input of the signal outgoing port to the input of the signal incoming port, that is, the ratio of the signal from the pulse interference source port to the signal from the response port. According to Equations (1) and (2), α and β are defined as signal amplitude transfer coefficient and signal attenuation coefficient as follows:
Through the analysis of the pulse signal and port coupling signal, we establish the coupling transfer function of the control system, as shown in Equation (6). The coupled transfer function model can predict the port coupling signal of the control system in this paper under a strong electromagnetic pulse, which greatly reduces the test cost and simplifies the analytical process. The coupling parameters were numerically fitted and normalized by polynomial fitting, and α(ζ) and β(ζ) are shown in Equation (7). The parameters of ai and bi (i = 1, 2, 3, …, 6) are listed in Table 4.
Firstly, we extract the parameters of the pulse injection signal. The amplitude coefficient and attenuation coefficient of the current injection signal is determined and the pulse injection signal model is established. Secondly, we infer the terminal coupling transfer function of the system. Finally, the prediction model of the terminal coupling function of the controller is obtained through reasonable derivation. The terminal coupling signal prediction process is shown in Figure 9. The established model can predict the port coupling signal of the control system in this paper under the electromagnetic pulse, which reduces the test cost and simplifies the analytical process. The numerical results of the controller’s coupling signal are verified by experiments, as shown in Figure 10. The amplitude of the injecting currents in Figure 10a,b are 5 A and 10 A.
The error analysis of the prediction model and measured data is shown in Equation (8), where VP is the amplitude of the prediction signal and VM is the amplitude of the measurement signal. The analytical results are shown in Figure 11. It can be seen from the figure that the error between the port coupling signal obtained by the prediction model and the port coupling signal by the measurement is less than 7.3%, which can replace the measured result and has a good application value. By comparing the coupling signal of the controller at 10 kHz to 100 MHz, the error analysis of the numerical and the measured data is carried out, and the results are shown in Figure 11.
4.3. Numerical Analysis
The terminal circuit of the speed sensor is composed of filter capacitors, integrated chips, and other passive devices. The principal function is to realize the regulation of the speed sinusoidal signal. Through the integrated chip MAX9926, the sine signal collected by the speed sensor is converted into a square wave signal, and the rotational speed is measured by collecting the number of square waves per unit time. It is shown in Figure 12. Under the condition of BCI, the monitoring signal of the terminal circuit is shown in Figure 13.
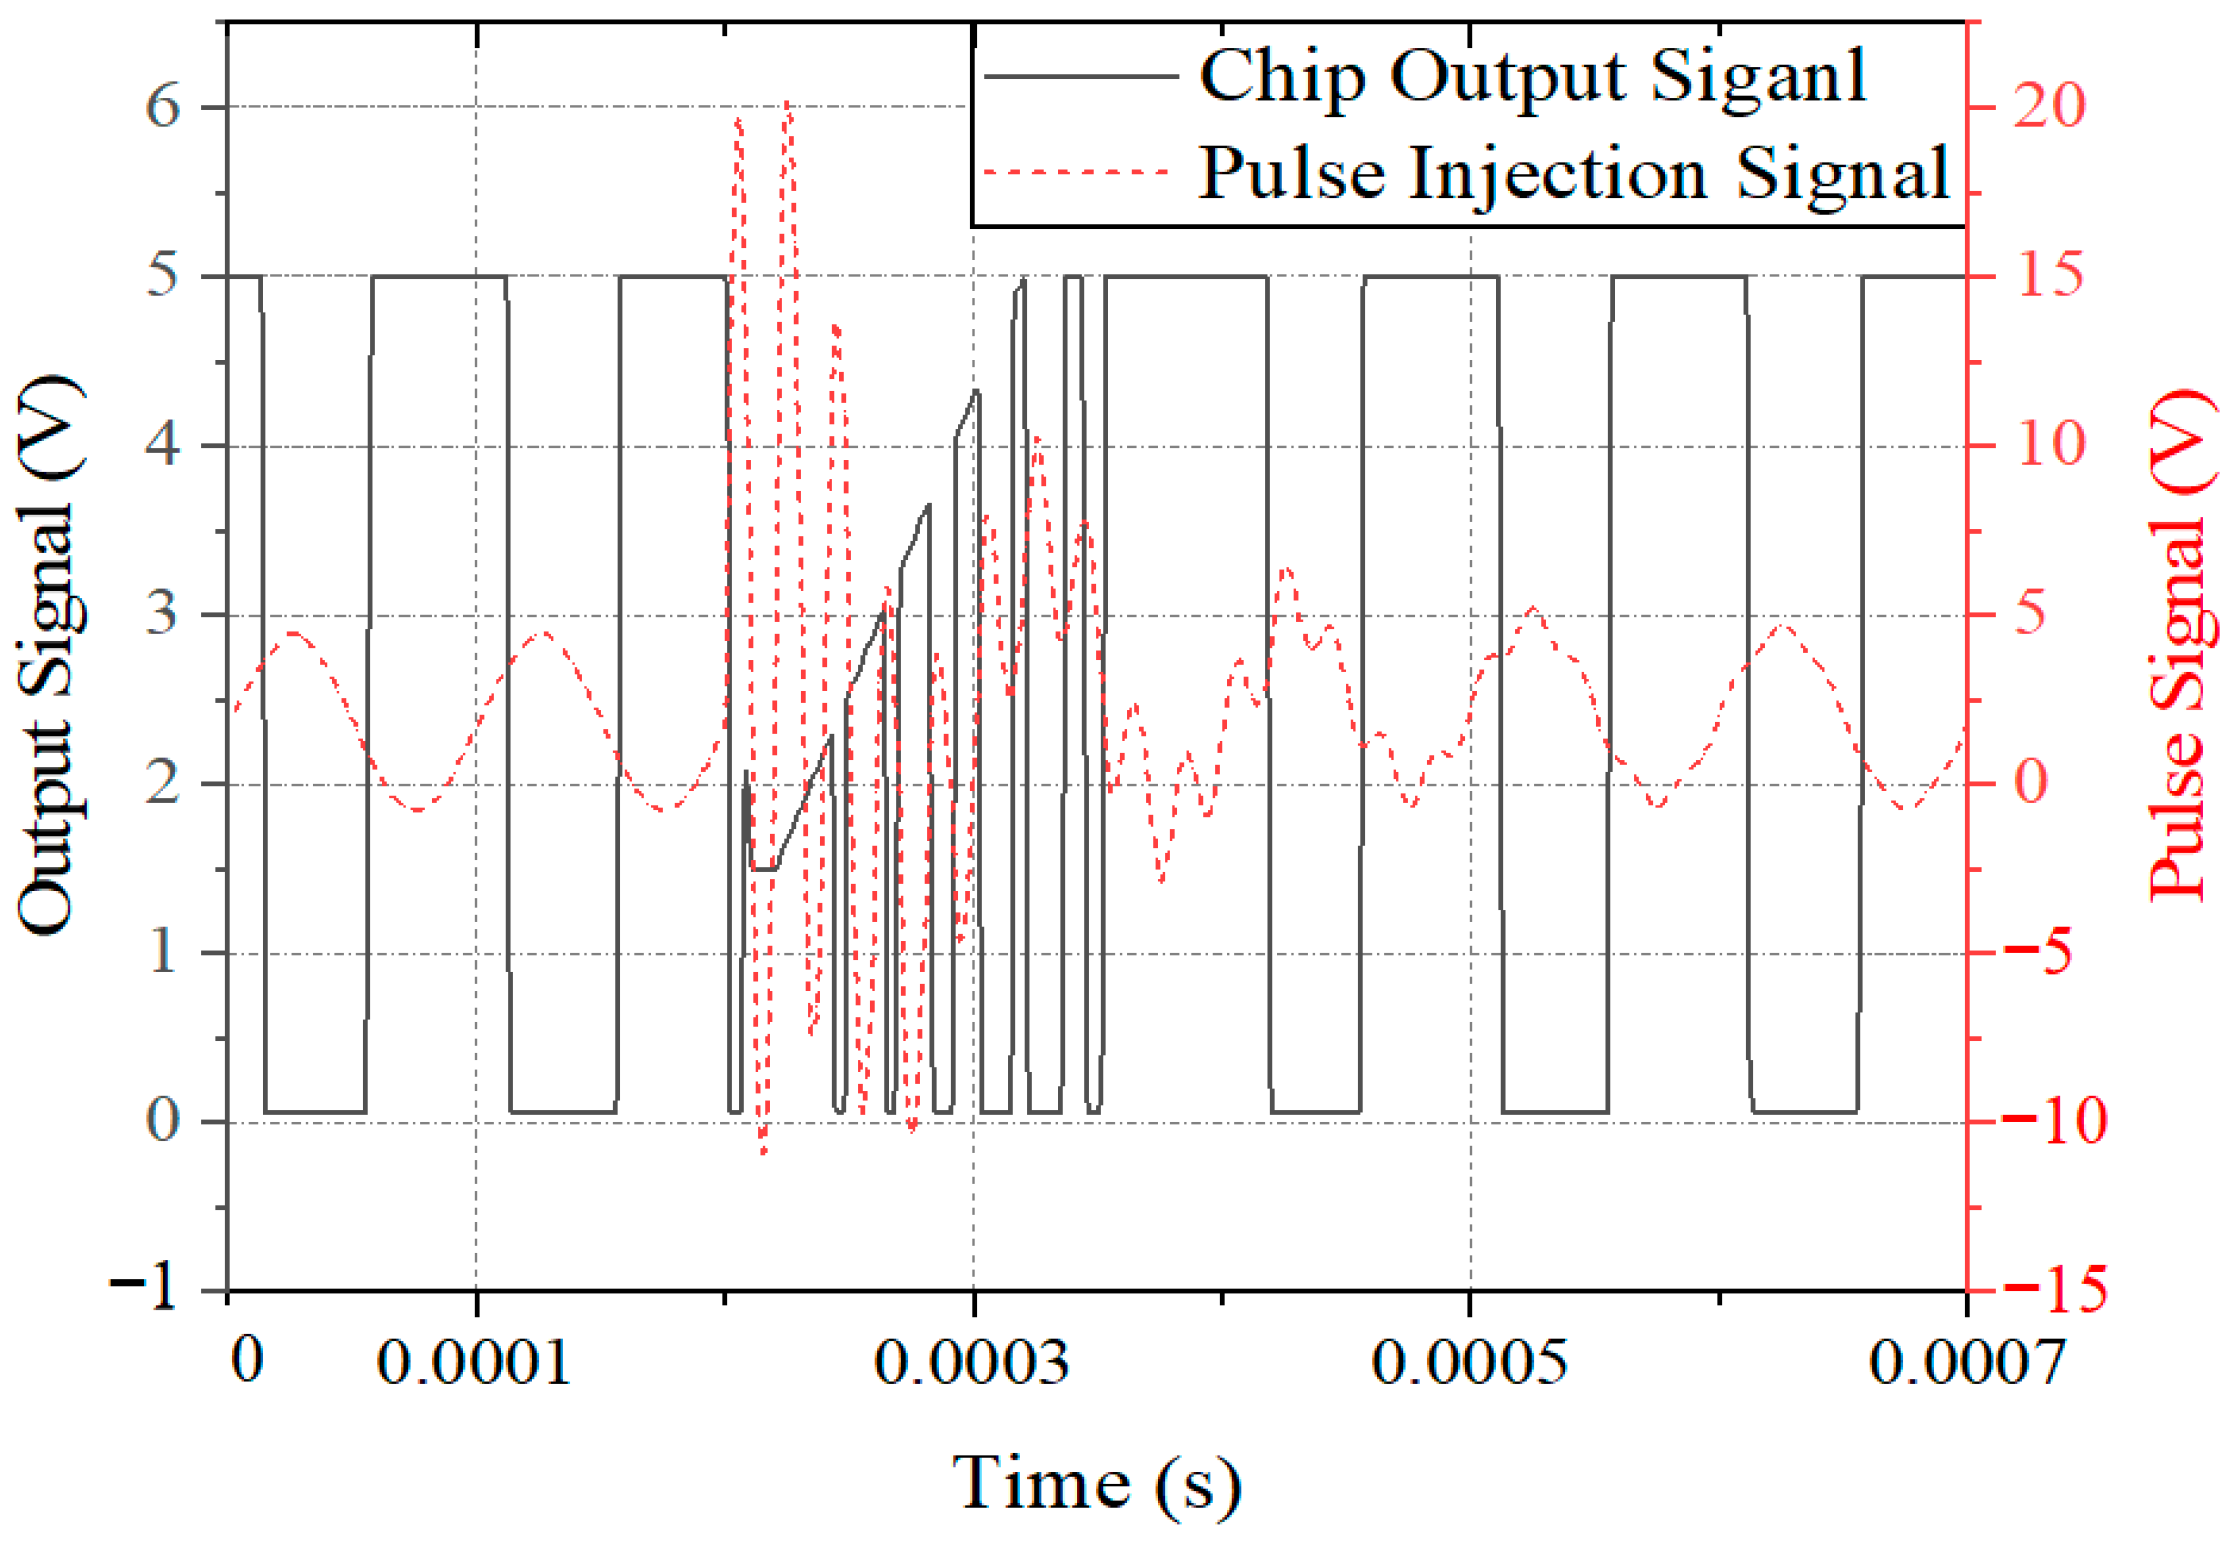
The pulse coupling signal causes the sinusoidal signal collected by the MAX9926 to be distorted, and the pulse signal is partially coupled with the sinusoidal signal. To further analyze the mechanism of electromagnetic susceptibility in the control system under an electromagnetic pulse, this paper establishes the controller terminal circuit model in Multisim, detects the typical port signal of the controller, and analyzes the influence of the pulse coupling signal on the controller’s terminal circuit. The pulse signal is coupled into each functional module through the controller connector port, causing interference or damage to electronic components and integrated chips. A typical port detection signal is shown in Figure 14.
In Figure 14, it is noticeable that the pulse coupled signal interferes with the signal transmitted to the microcontroller unit (MCU). Since the MCU collects the speed signal by counting the number of square waves in a certain period of time, the number of square waves collected is greater than the number of square waves generated by the actual speed, resulting in abnormal speed collection. When the speed signal is input to the MCU, the MCU adjusts the fuel quantity according to the fuel control strategy and reduces the engine speed, which will affect the normal operation of the engine.
5. Conclusions
In this paper, based on the electromagnetic topology theory, an electromagnetic coupling analytical method for the aero-engine control system under electromagnetic pulses is proposed, which uses a combination of experimental methods and numerical calculation methods. The coupling signal at the port of the control system is monitored through a bulk current injection test. On this basis, a numerical model for the coupling signal of the controller under an electromagnetic pulse is established. Through the simulation, the electromagnetic sensitivity of the controller terminal under an electromagnetic pulse and the sensitive elements of the controller are well-defined. Meanwhile, the influence of the port coupling signal on the control link is analyzed.
In general, the electromagnetic coupling analytical method has great significance to study the electromagnetic sensitivity of the control system under the electromagnetic pulse, which effectively reduces the test cost and the limitations of the test method. It provides a basis for the measured technology and PCB design improvement of the control system. In the future, the author will conduct electromagnetic coupling analysis on more electronic systems to improve the safety of systems in complex electromagnetic environments.
Author Contributions
J.C.: Writing—original draft preparation; M.W.: Review and editing; D.Z.: Validation. All authors have read and agreed to the published version of the manuscript.
Funding
This research received no external funding.
Data Availability Statement
Data are available on request to the authors.
Conflicts of Interest
The authors declare no conflict of interest.
References
- Lee, G.; Kim, M.Y.; Lee, C.; Jang, D.; Kim, J.H. Electromagnetic field tests of a 1-mw wireless power transfer system for light rail transit. Energies 2021, 14, 1171. [Google Scholar] [CrossRef]
- Guo, L.Y.; Xiao, L.; Chen, J.F.; Yang, M.; Yang, J.X. Electromagnetic pulse coupling effect analysis for outboard engine system of vehicle. In Proceedings of the 2020 IEEE MTT-S International Microwave Workshop Series on Advanced Materials and Processes for RF and THz Applications (IMWS-AMP), Suzhou, China, 29–31 July 2020. [Google Scholar] [CrossRef]
- Sun, J.; Pan, X.; Lu, X.; Wan, H.; Wei, G. Test method of bulk current injection for high field intensity electromagnetic radiated susceptibility into shielded wire. IEEE Trans. Electromagn. Compat. 2021, 64, 275–285. [Google Scholar] [CrossRef]
- Tang, Y.; Zhu, F.; Chen, Y. For more reliable aviation navigation: Improving the existing assessment of airport electromagnetic environment. IEEE Instrum. Meas. Mag. 2021, 24, 104–112. [Google Scholar] [CrossRef]
- Gil, J.G.; Drikas, Z.B.; Andreadis, T.D.; Anlage, S.M. Prediction of induced voltages on ports in complex, three-dimensional enclosures with apertures, using the random coupling model. IEEE Trans. Electromagn. Compat. 2016, 58, 1535–1540. [Google Scholar] [CrossRef]
- Miller, K.G.; Meehan, M.; Spencer, R.L.; Colton, J.S. Resonance of complex cylindrically symmetric cavities using an eigenfunction expansion in empty cavity modes. IEEE Trans. Microw. Theory Technol. 2016, 64, 3113–3120. [Google Scholar] [CrossRef]
- Xiao, P.; Du, P.A.; Ren, D.; Nie, B.L. A hybrid method for calculating the coupling to PCB inside a nested shielding enclosure based on electromagnetic topology. IEEE Trans. Electromagn. Compat. 2016, 58, 1701–1709. [Google Scholar] [CrossRef]
- Gong, Y.F.; Hao, J.H.; Jiang, L.H. Efficient analytical method for the coupling to penetrated transmission line in multiple enclosures based on electromagnetic topology. IET Sci. Meas. Technol. 2018, 12, 335–342. [Google Scholar] [CrossRef]
- Han, J.H.; Ju, S.H.; Kang, N.W.; Lee, W.S.; Choi, J.S. Wideband coupling modeling analysis by arbitrarily incoming source fields based on the electromagnetic topology technique. IEEE Trans. Microw. Theory Tech. 2019, 67, 28–37. [Google Scholar] [CrossRef]
- Hackl, H.; Ibel, M.; Auinger, B.; List, D.; Stockreiter, C. 3D model of a commercial 9V alkaline battery for EMC simulation. E I Elektrotech. Inf. 2020, 137, 70–75. [Google Scholar] [CrossRef] [Green Version]
- Tsukada, A.; Okamoto, K.; Okugawa, Y.; Kato, J.; Nagata, M. System-level response of ethernet linkage to bulk current injection into cables. In Proceedings of the 2020 International Symposium on Electromagnetic Compatibility-EMC EUROPE, Rome, Italy, 23–25 September 2020. [Google Scholar] [CrossRef]
- Sun, L.; Taylor, J.; Guo, X.; Cheng, M.; Emadi, A. A linear position measurement scheme for long-distance and high-speed applications. IEEE Trans. Ind. Electron. 2021, 68, 4435–4447. [Google Scholar] [CrossRef]
- Lee, Y.; Kim, K.; Heo, J.; Park, Y.; Yoon, I.J. Analysis on the Correlation Between Vehicle RFI and Component EMI Tests Using BCI and RI Methods. In Proceedings of the 2019 International Symposium on Electromagnetic Compatibility-EMC EUROPE, Barcelona, Spain, 2–6 September 2019. [Google Scholar] [CrossRef]
- Nayak, B.P.; Ramesh, S.; Rajeev, S.; Devi, A.; Tsuda, T.; Gope, D. Model-based system-level EMI/EMC simulation for BCI pass-fail prediction. IEEE Lett. Electromagn. Compat. Pract. Appl. 2020, 2, 28–33. [Google Scholar] [CrossRef]
- Zhou, Y.; Xie, Y.Z.; Zhang, D.Z.; Jing, Y. Modeling and performance evaluation of inductive couplers for pulsed current injection. IEEE Trans. Electromagn. Compat. 2021, 63, 710–719. [Google Scholar] [CrossRef]
- Bendicks, A.; Dorlemann, T.; Osterburg, T.; Frei, S. Active cancellation of periodic EMI of power electronic systems by injecting artificially synthesized signals. IEEE Electromagn. Compat. Mag. 2020, 9, 63–72. [Google Scholar] [CrossRef]
- Tang, Y.; Wan, L.; Hou, J. Full electromagnetic transient simulation for large power systems. Glob. Energy Interconnect 2019, 2, 29–36. [Google Scholar] [CrossRef]
- Invernizzi, A.; Haykal, S.; Faro, V.L.; Pennisi, V.; Choritz, L. Influence of electromagnetic radiation emitted by daily-use electronic devices on the eyemate system in-vitro: A feasibility study. BMC Ophthalmol. 2020, 20, 357. [Google Scholar] [CrossRef] [PubMed]
- Ridder, S.D.; Spina, D.; Toscani, N.; Grassi, F.; Ginste, D.V.; Dhaene, T. Machine-learning-based hybrid random-fuzzy uncertainty quantification for EMC and SI assessment. IEEE Trans. Electromagn. Compat. 2020, 62, 2538–2546. [Google Scholar] [CrossRef]
- Cheaito, H.; Diop, M.S.; Ali, M.; Clavel, E.; Vollaire, C. Investigation of common mode (CM) impedance: Comparison of pure CM and bulk current injection. In Proceedings of the 2017 International Symposium on Electromagnetic Compatibility-EMC EUROPE, Angers, France, 4–7 September 2017. [Google Scholar] [CrossRef]
- Lubkowski, G.; Lanzrath, M.; Lavau, L.C.; Suhrke, M. Response of the UAV sensor system to HPEM attacks. In Proceedings of the 2020 International Symposium on Electromagnetic Compatibility-EMC EUROPE, Rome, Italy, 23 September 2020. [Google Scholar] [CrossRef]
- MIL-STD-461F; Requirements for the Control of Electromagnetic Interference Characteristics of Subsystems and Equipment. Department of Defense, United States of America: Arlington, VA, USA, 2007. Available online: https://standards.nasa.gov/standard/NASA/MIL-STD-461 (accessed on 12 June 2022).
Figure 1.
Aircraft engine electronic control system composition diagram.
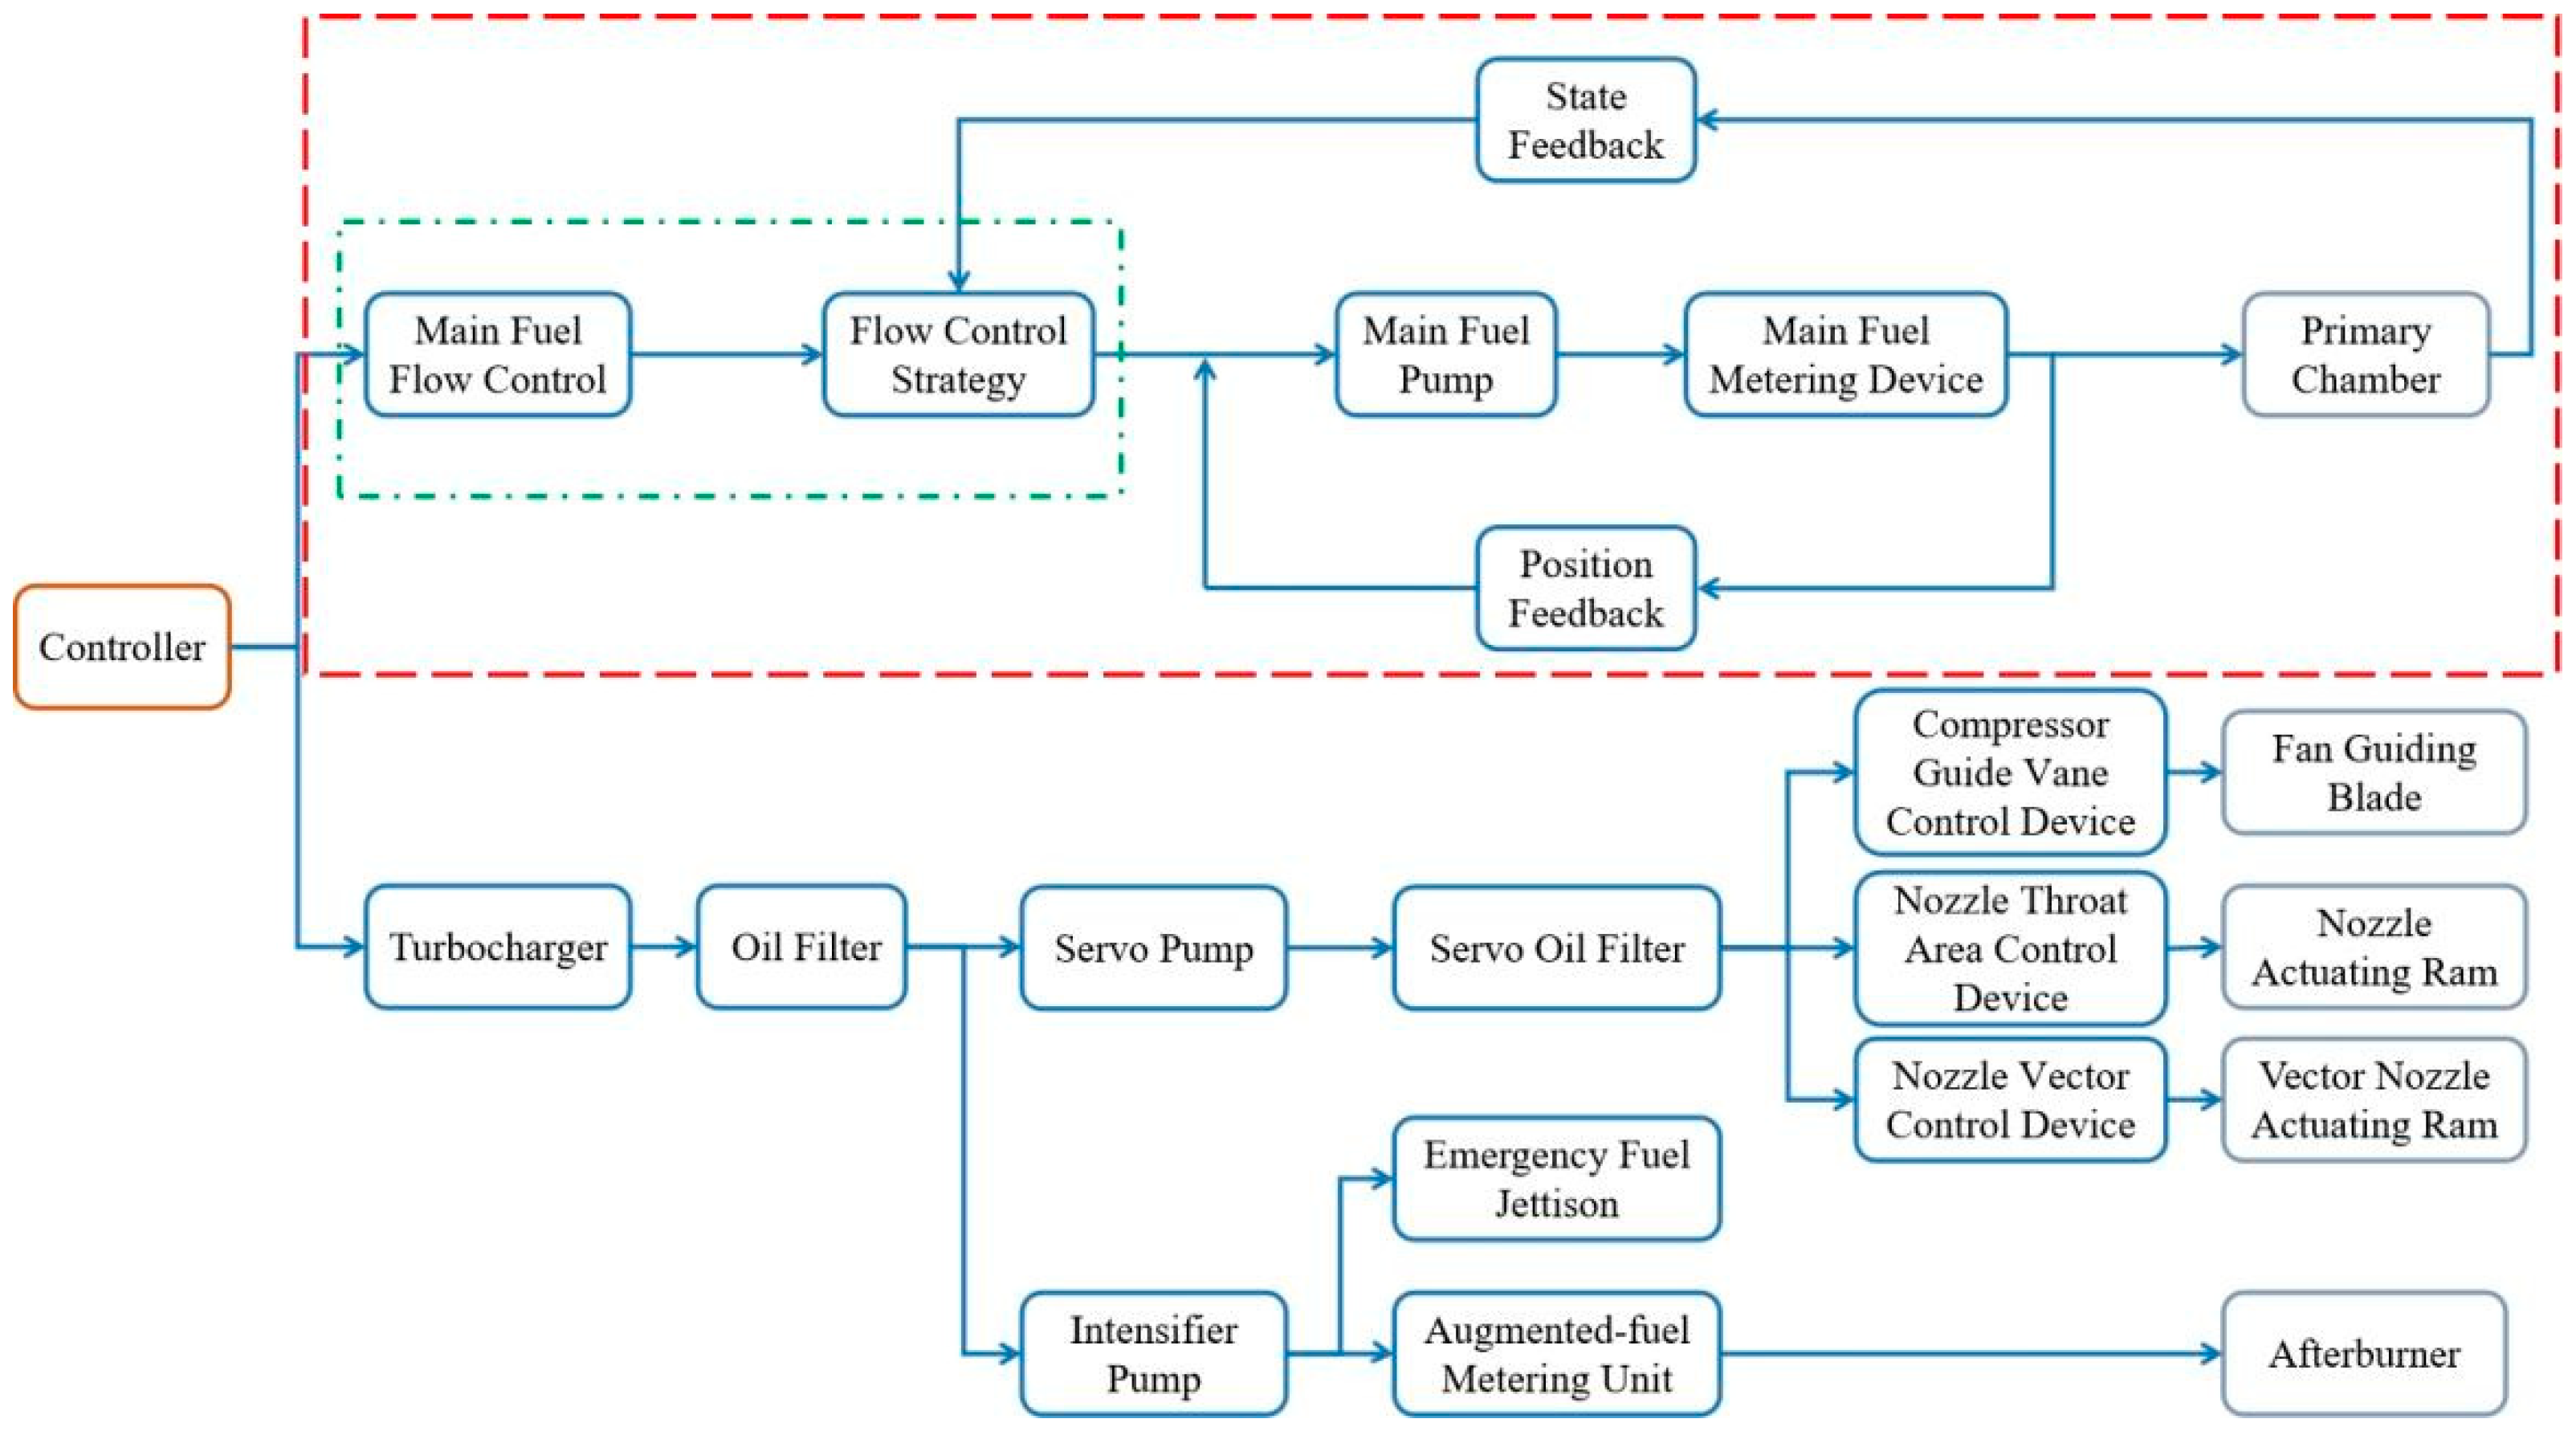
Figure 2.
Coupling analytical method under electromagnetic pulses.
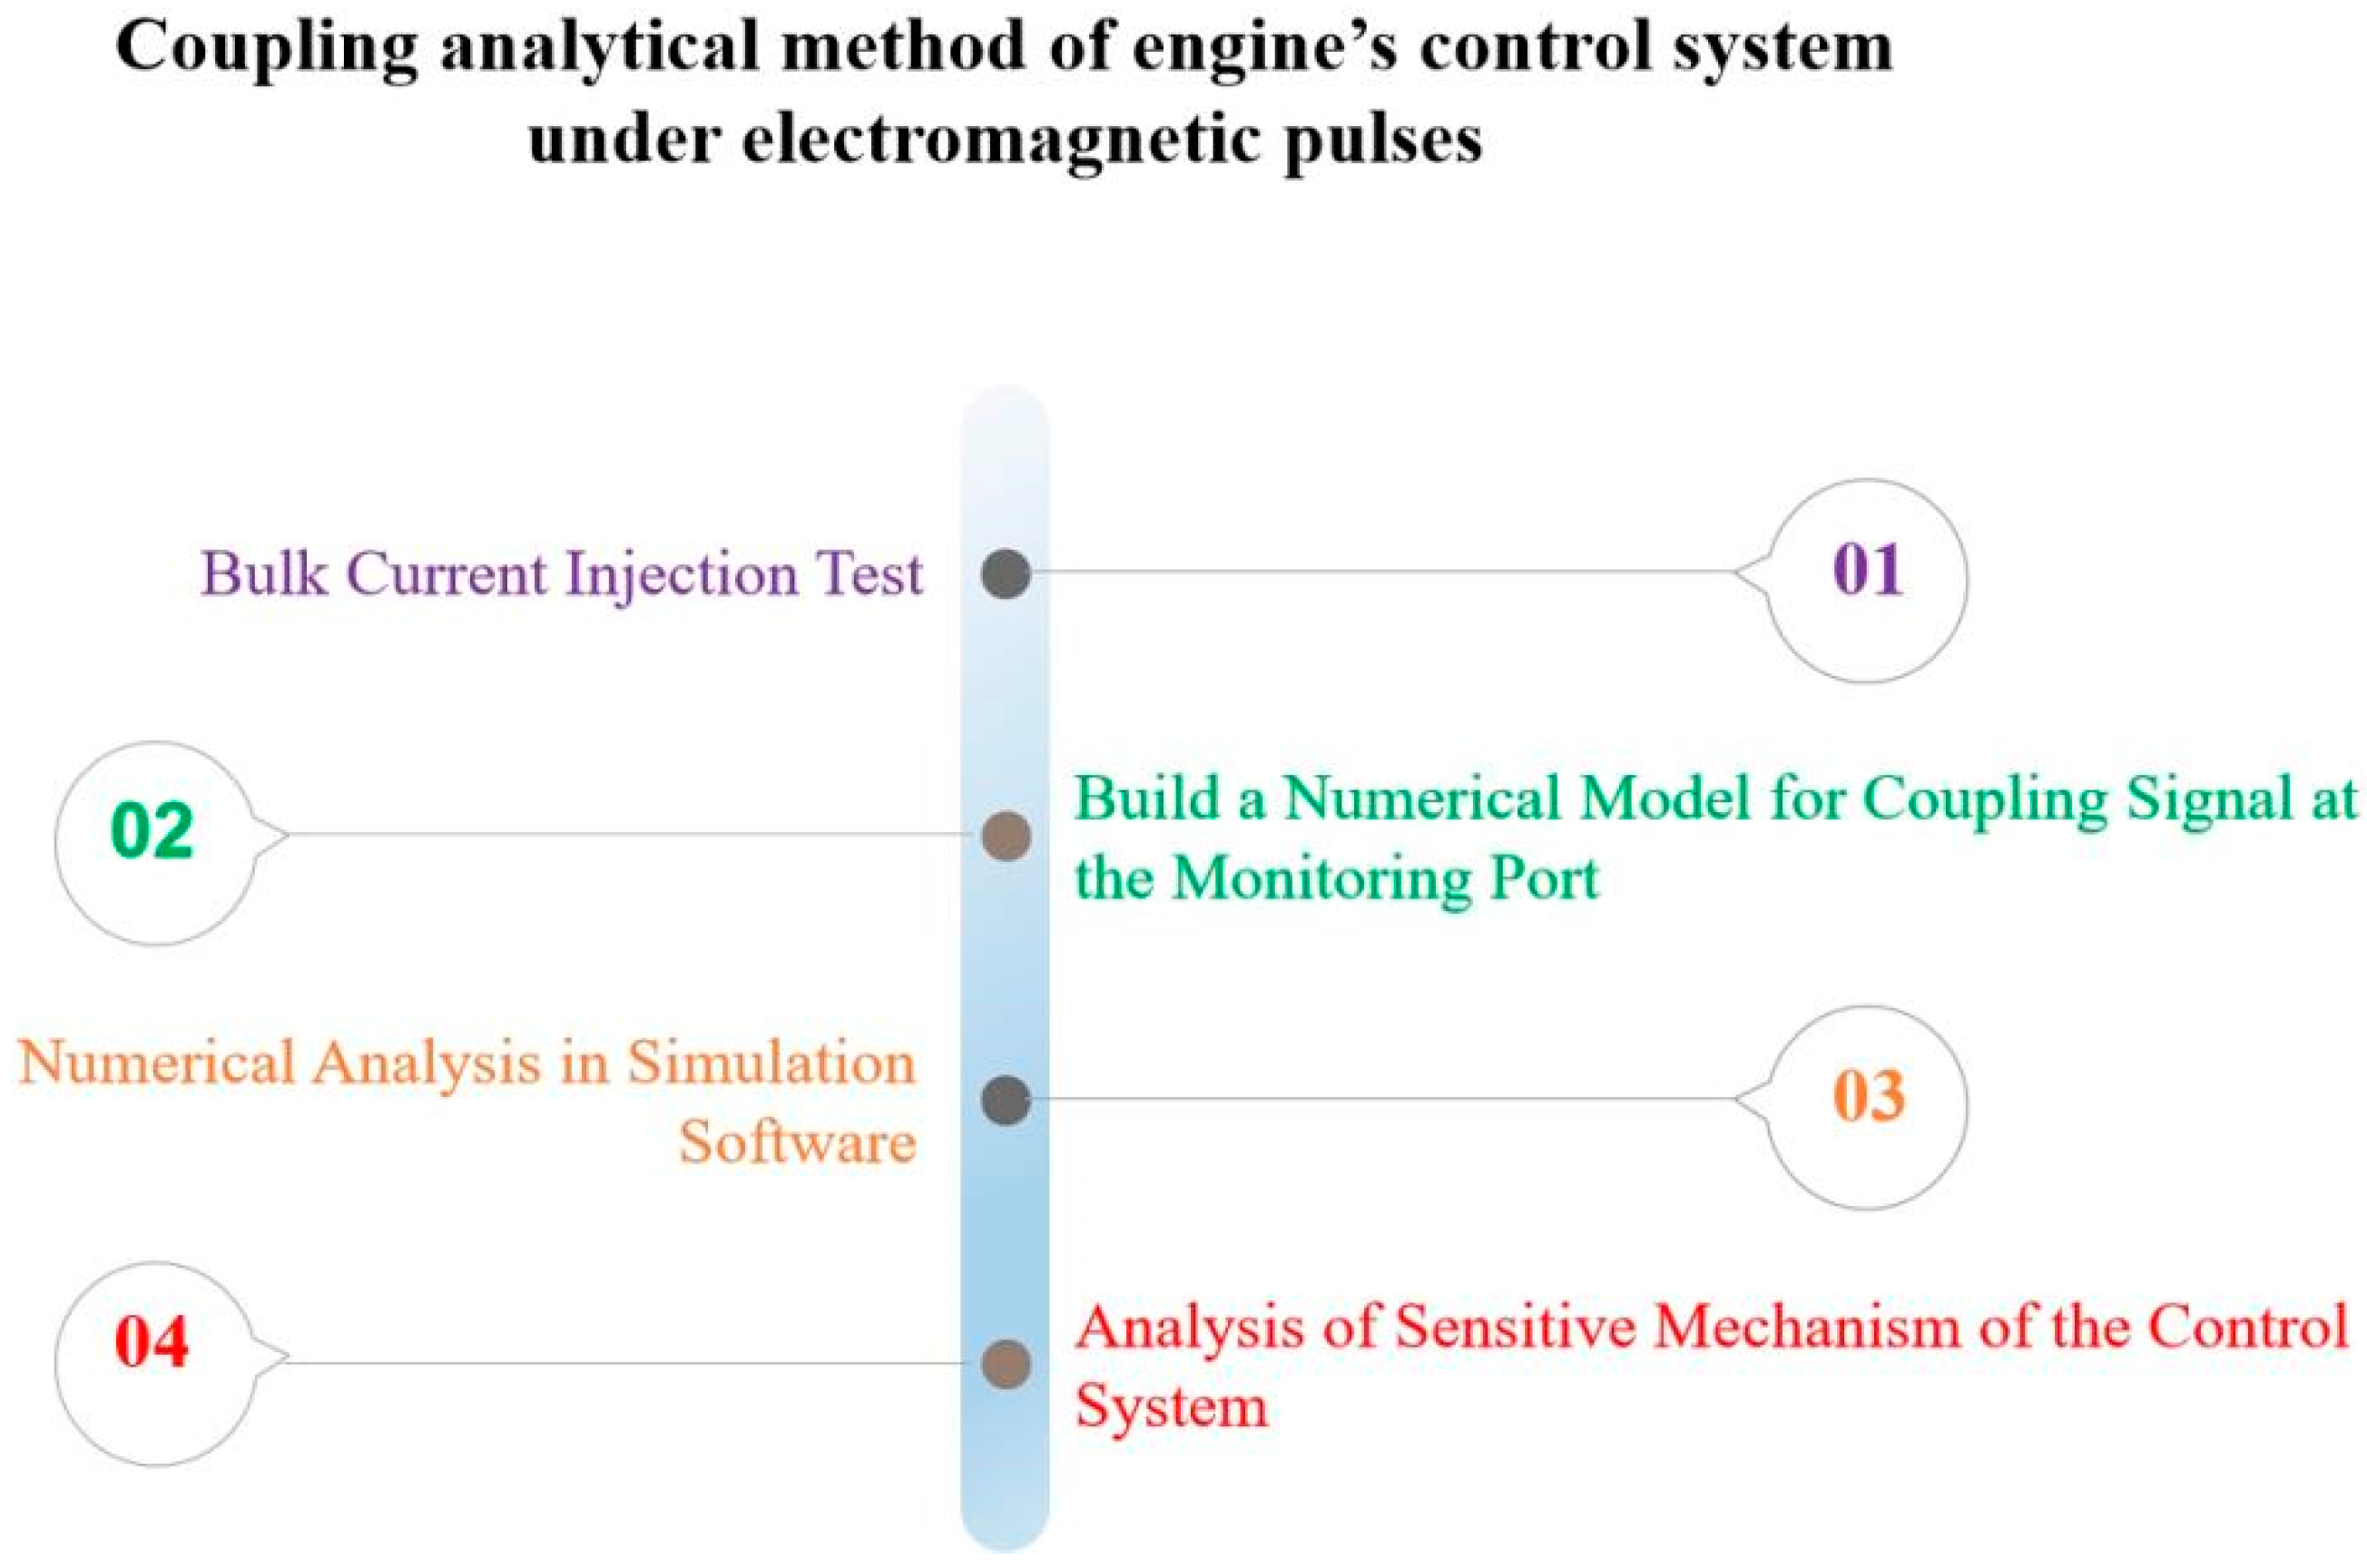
Figure 3.
Pulse current injecting signal at 100 MHz.

Figure 4.
The composition of the aero-engine fuel control system.
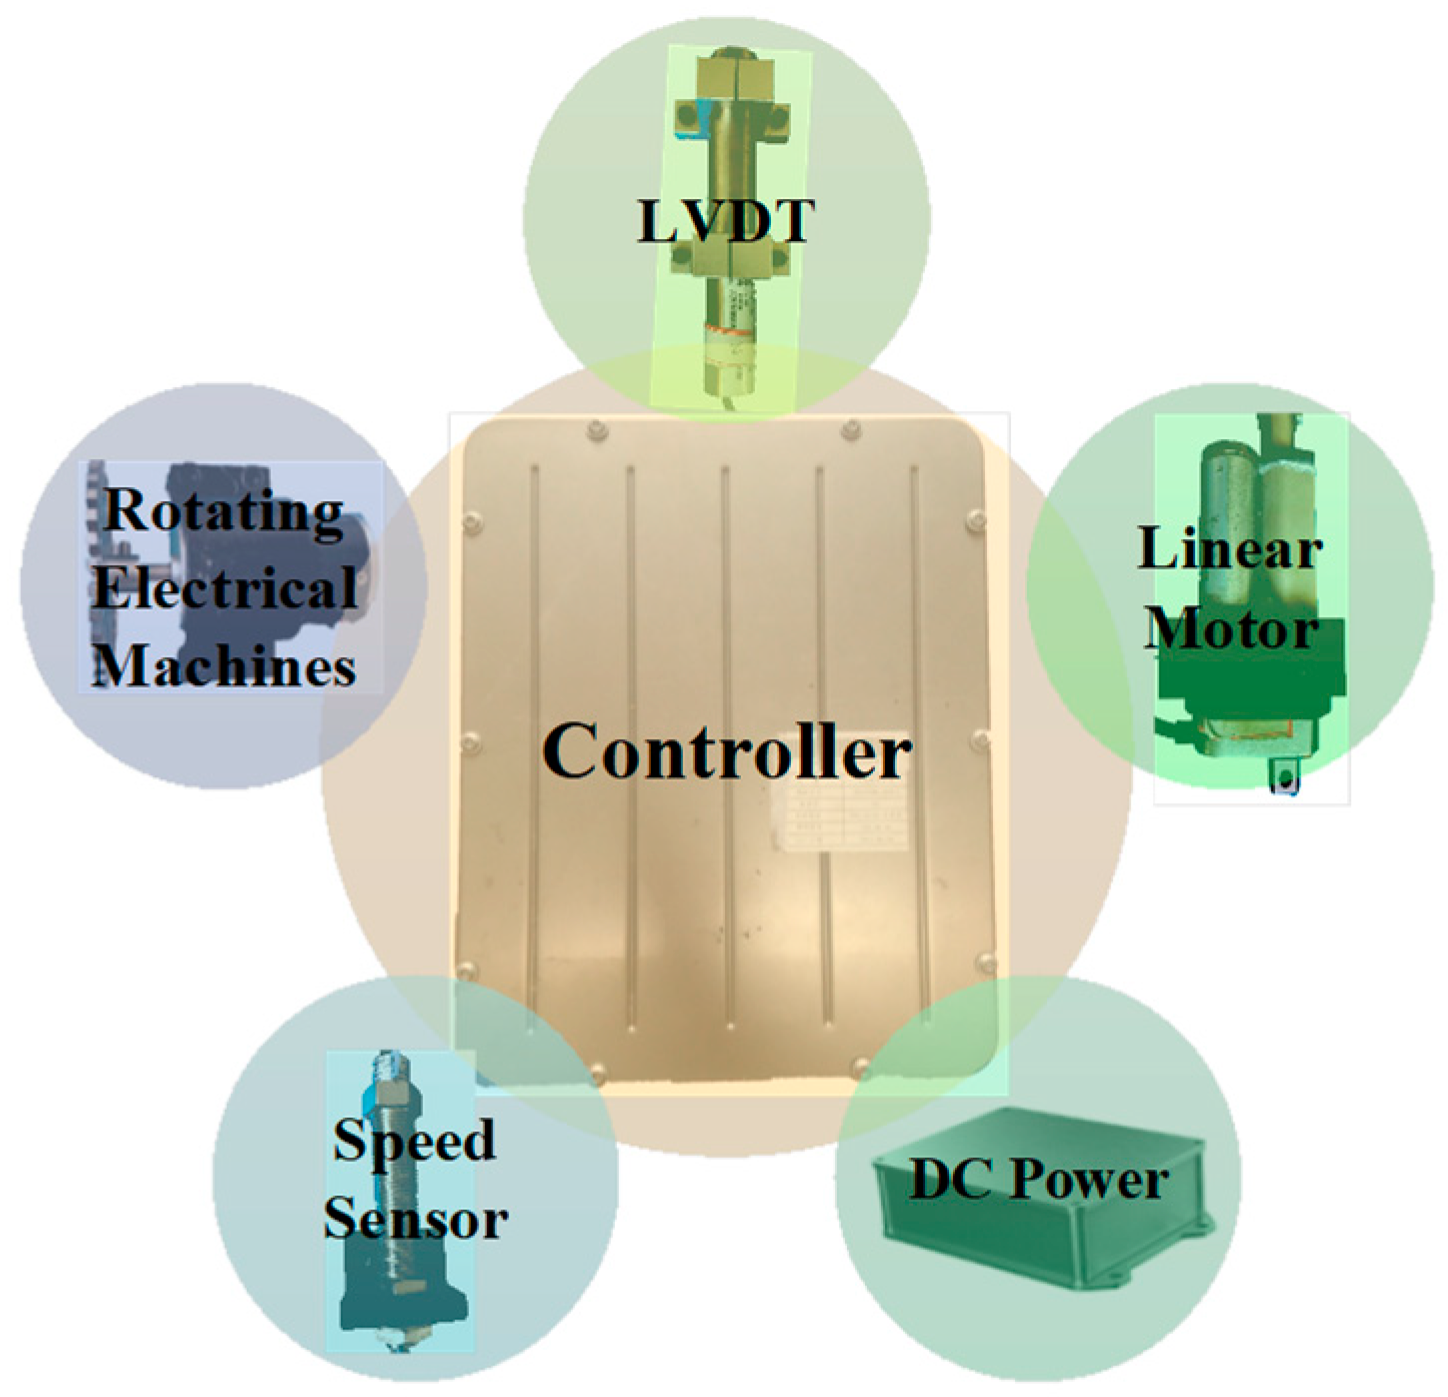
Figure 5.
The working principle of the control system.

Figure 6.
Bulk current injection test layout.
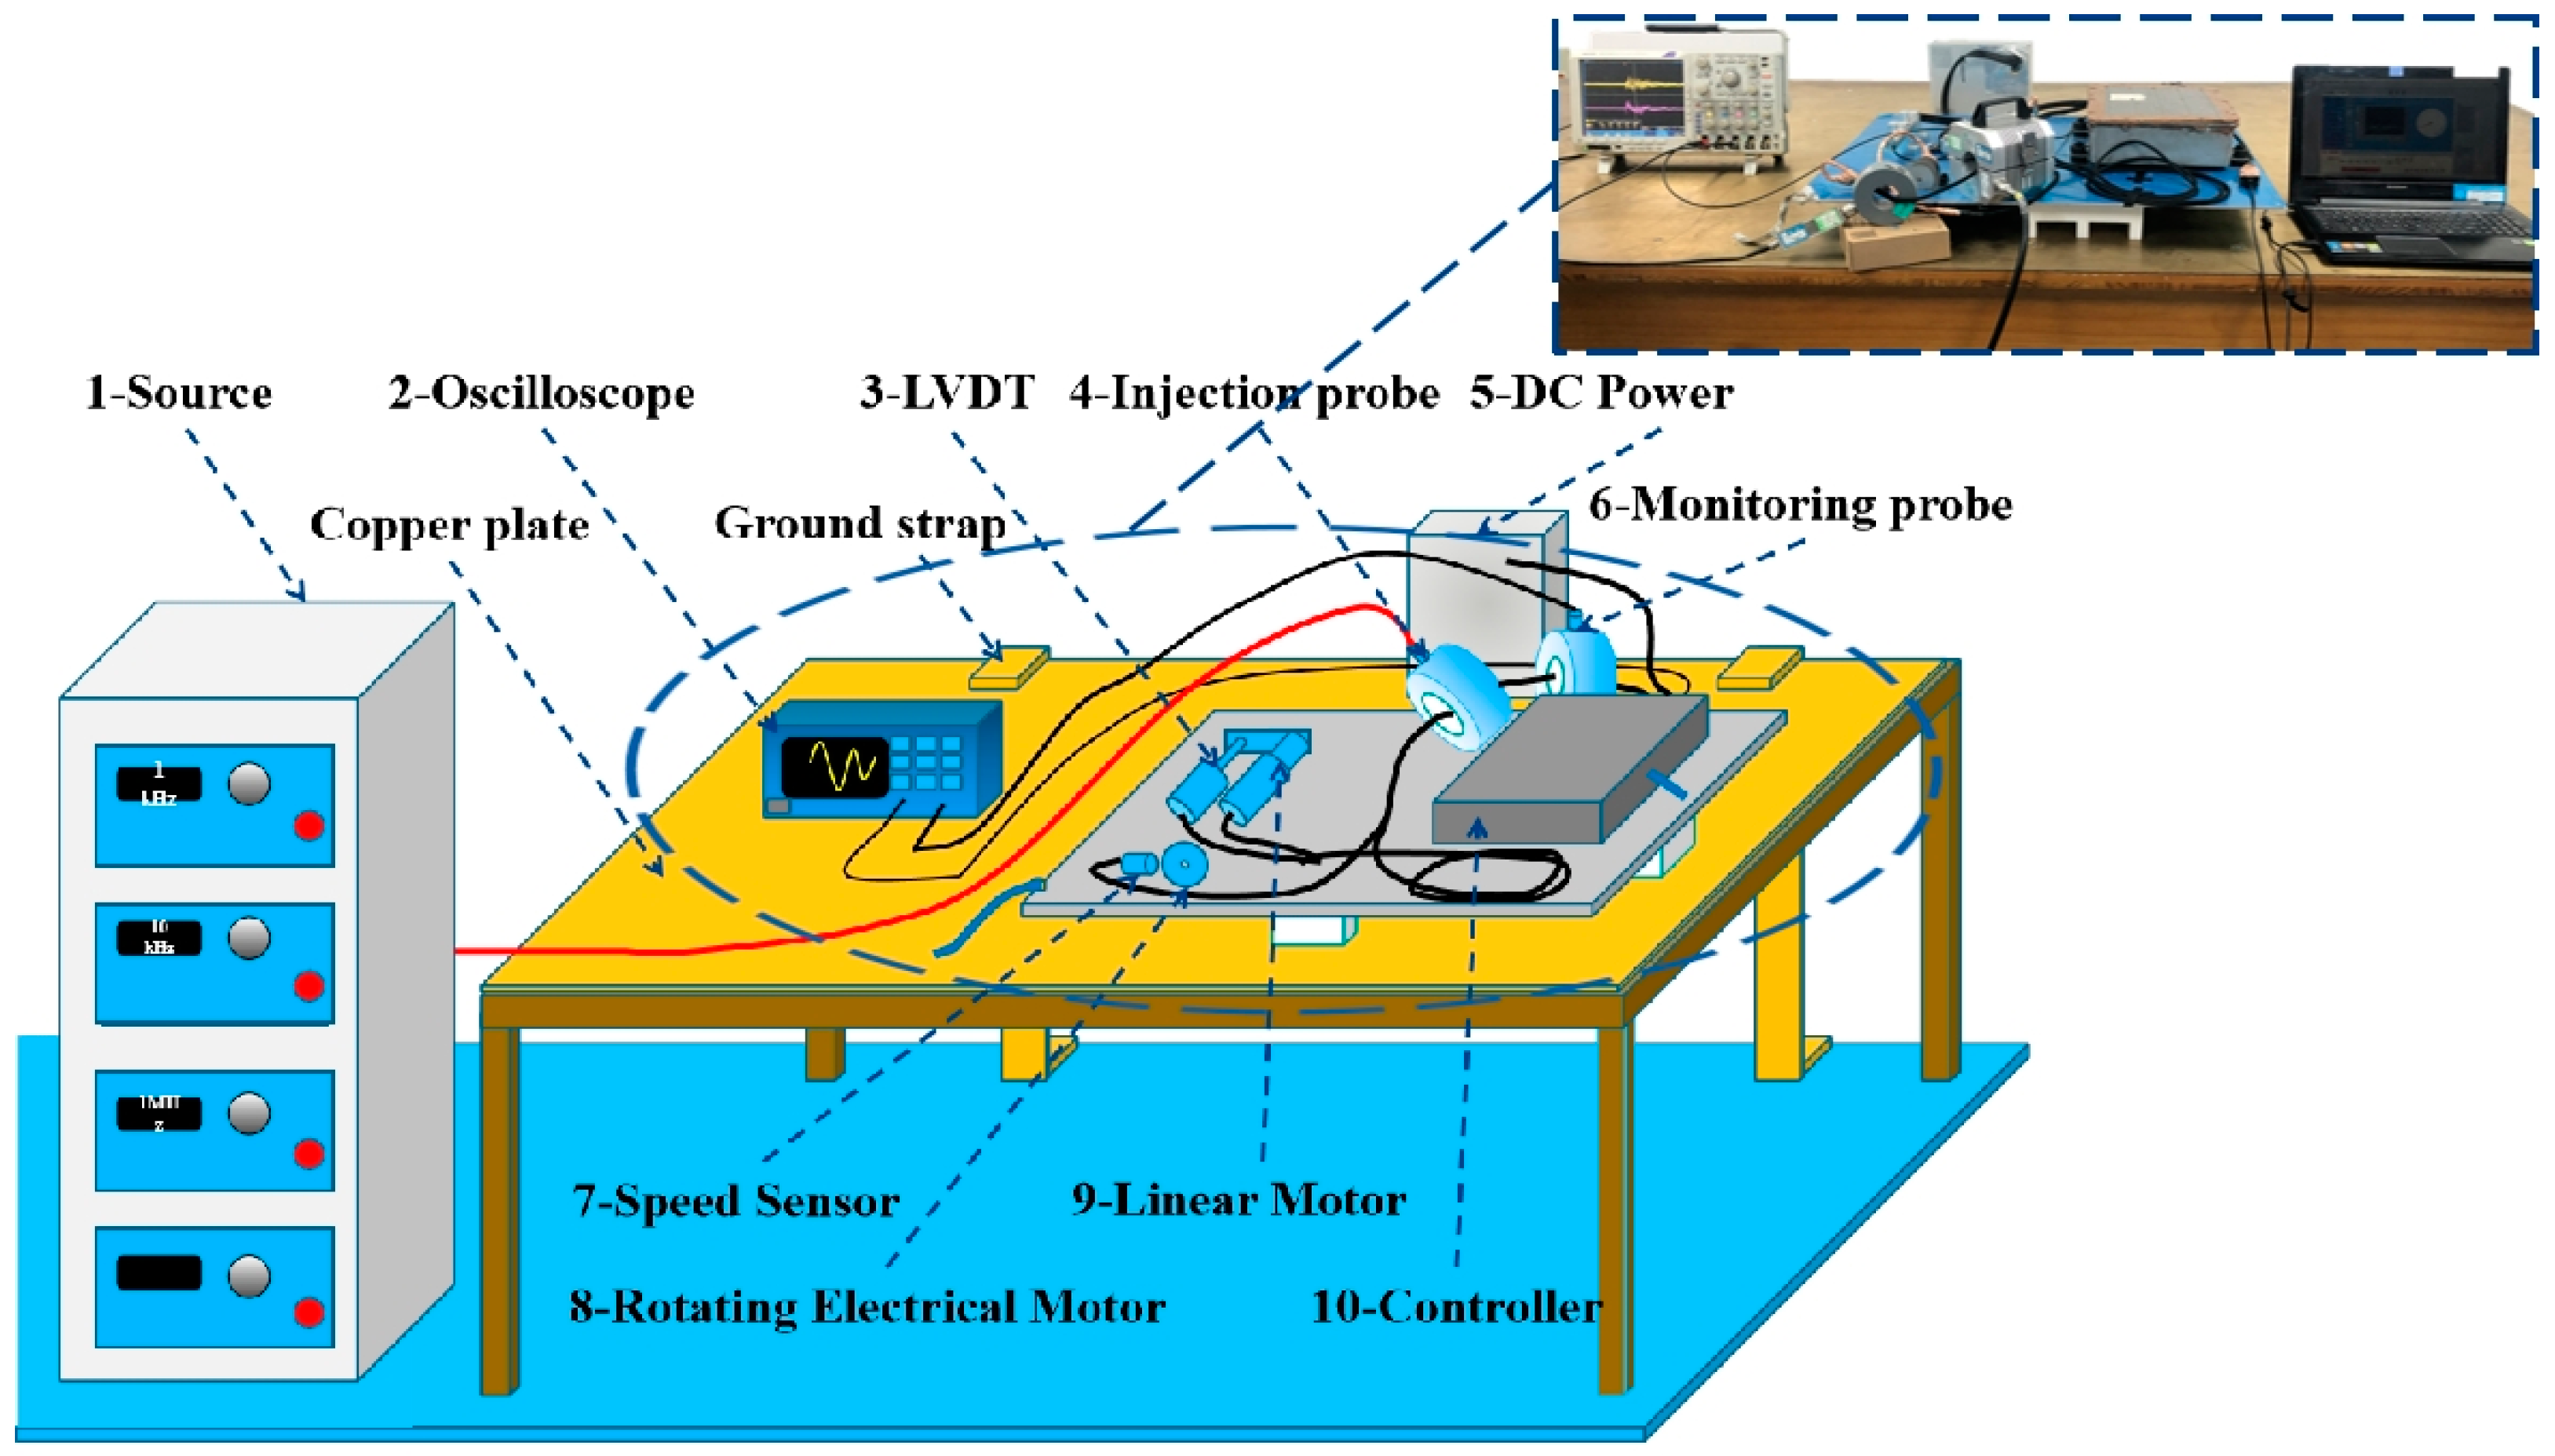
Figure 7.
BCI test flow.
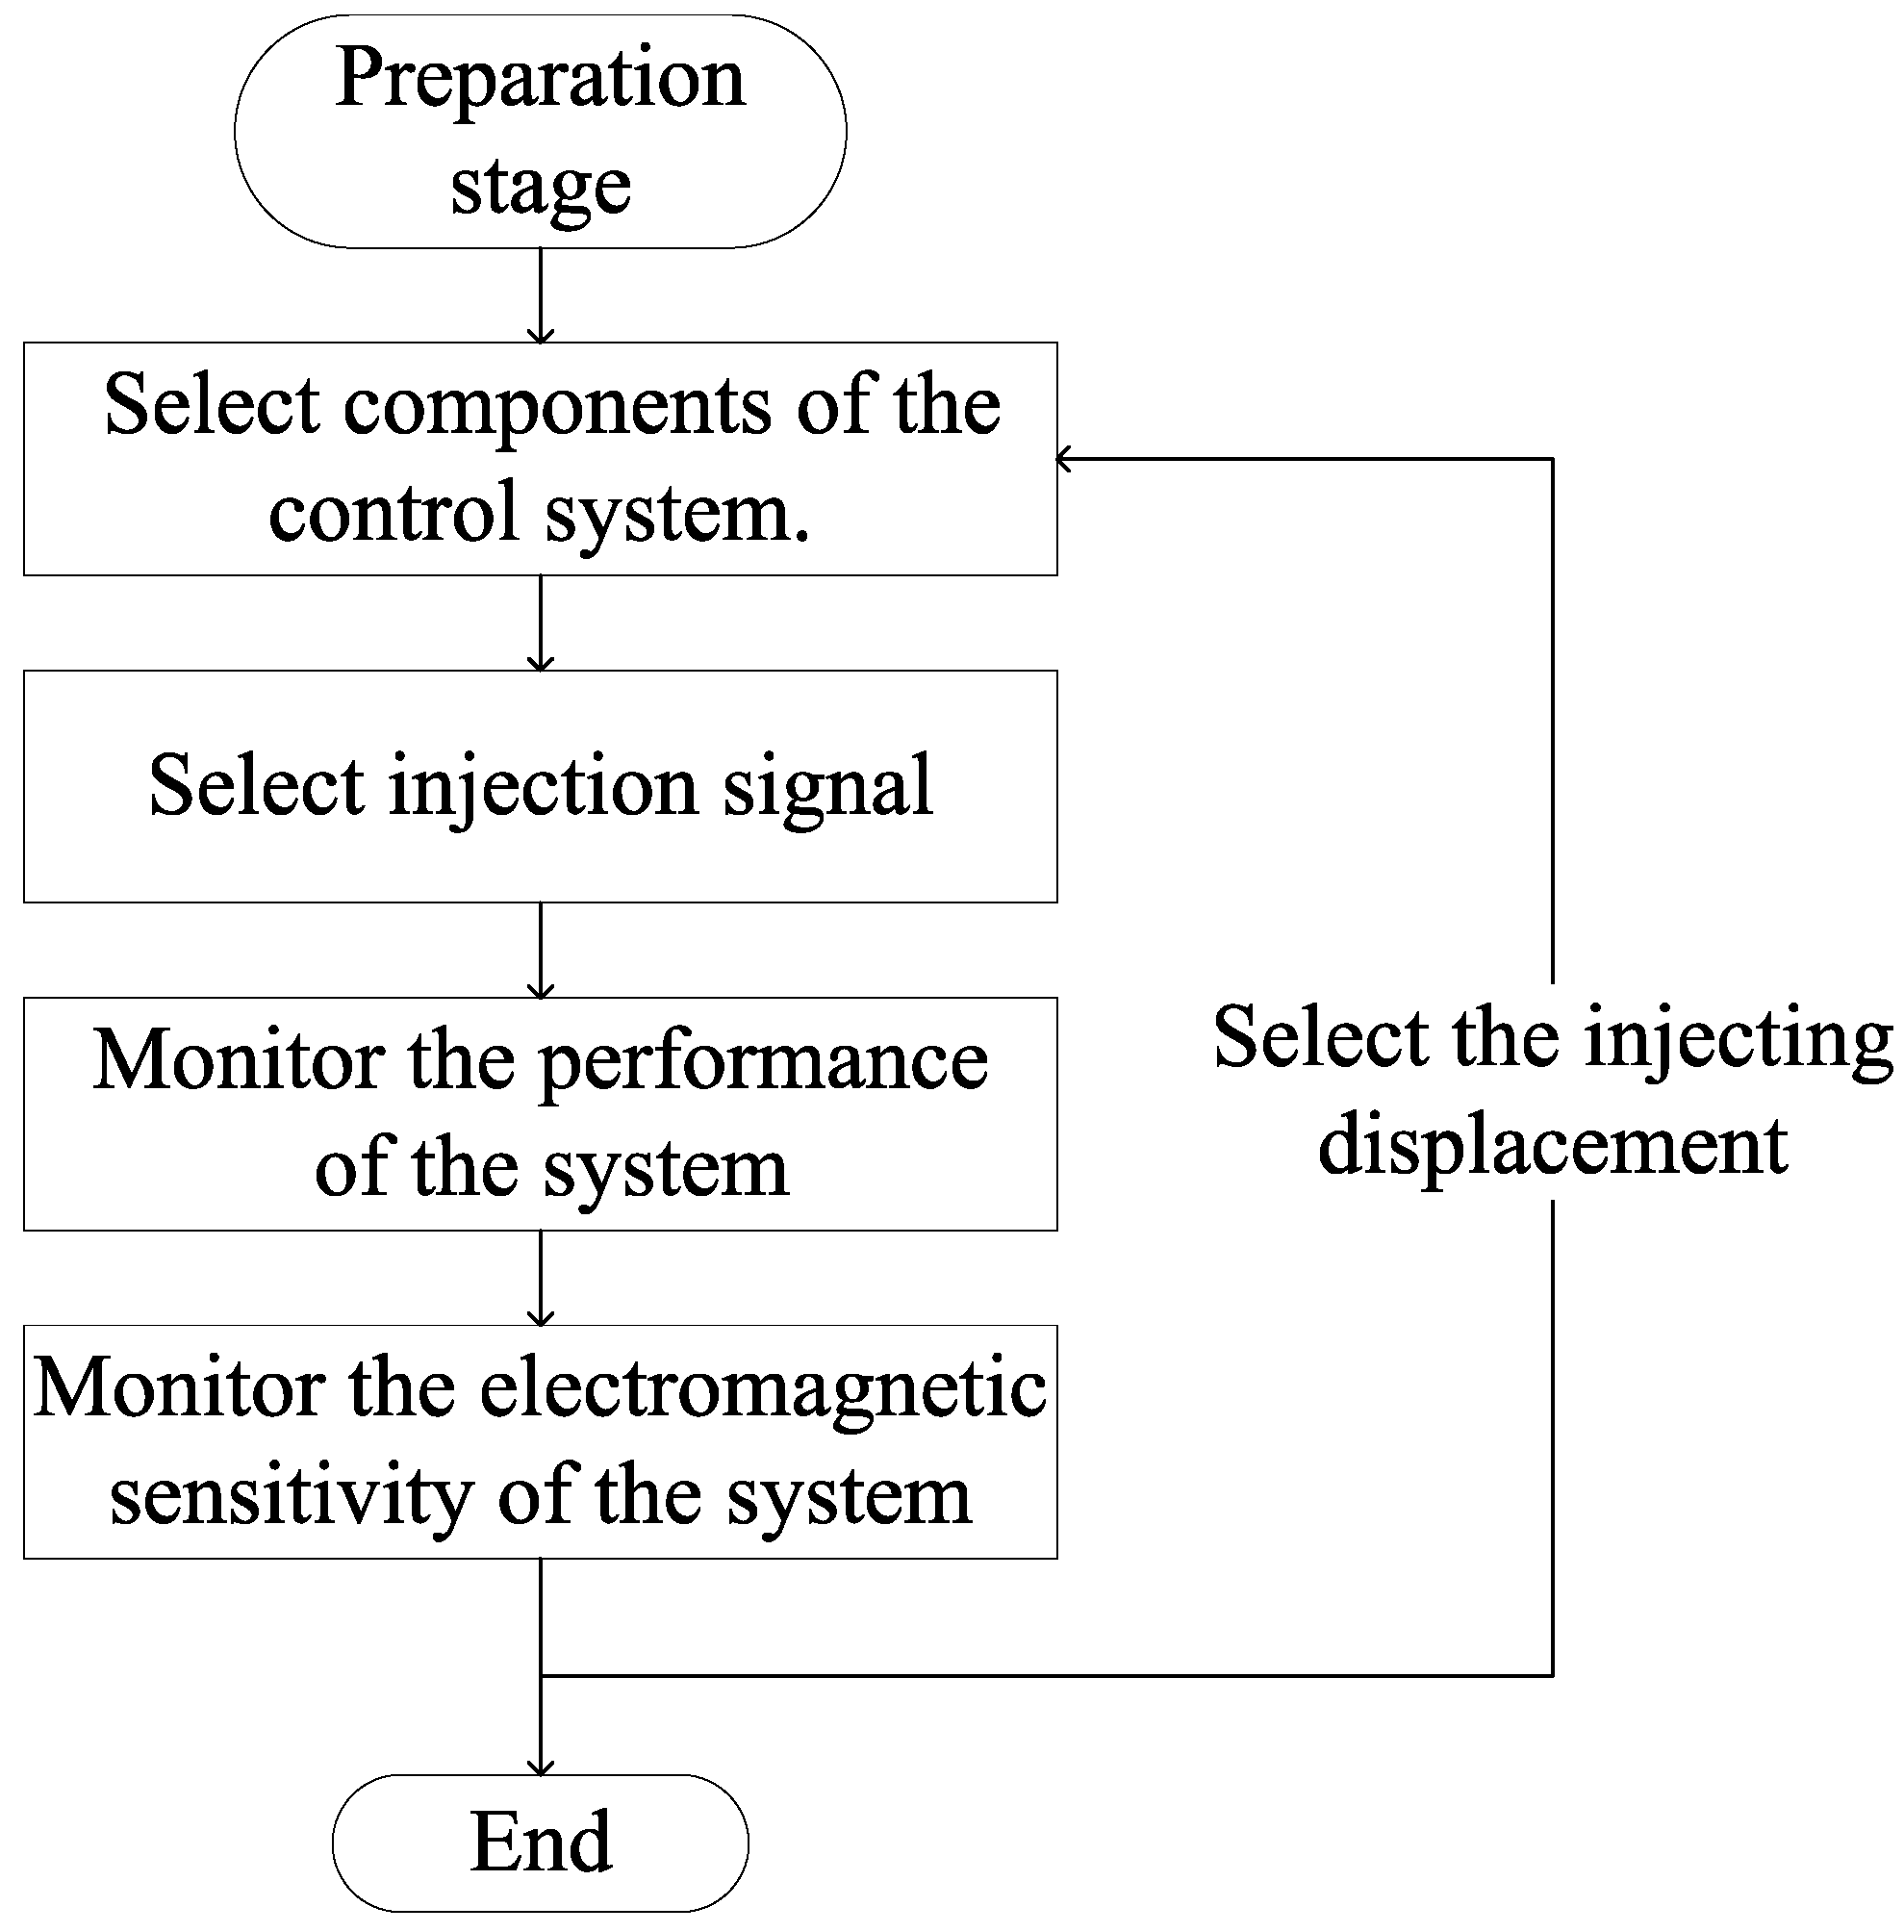
Figure 8.
The coupling signal of the monitoring port.
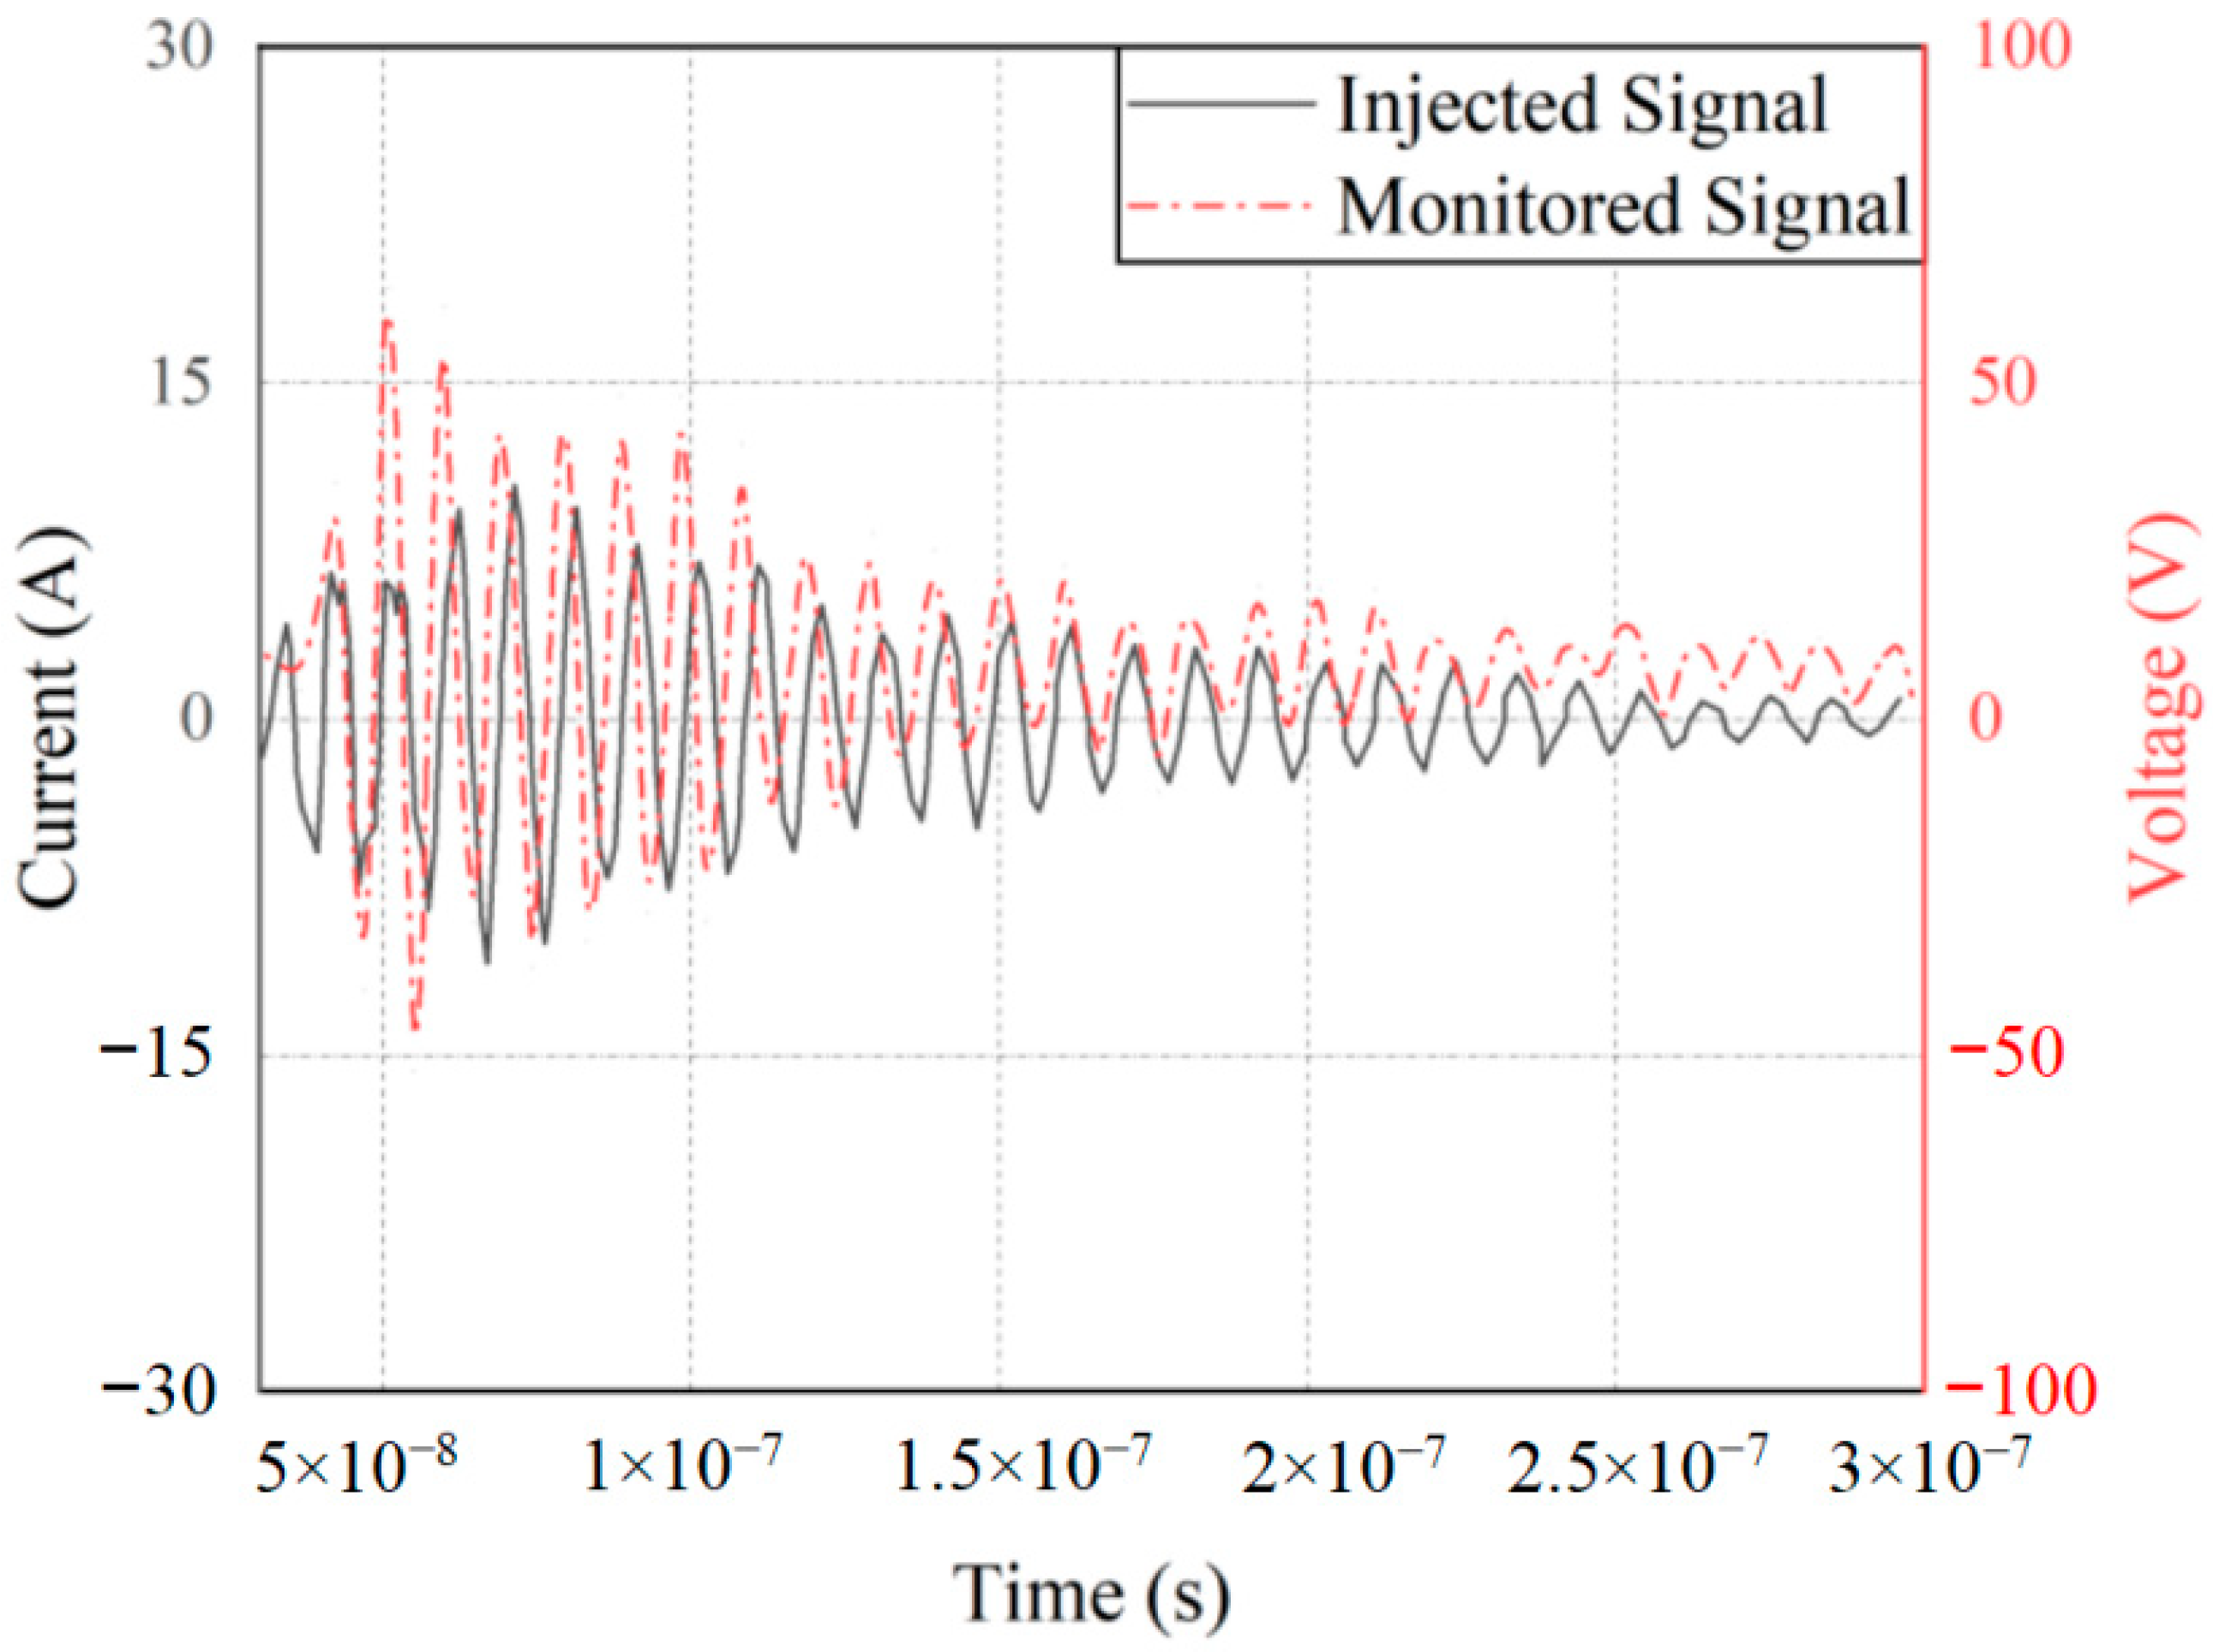
Figure 9.
The prediction method of the numerical model.

Figure 10.
Comparison of numerical and measured curves.

Figure 11.
Error analysis of the numerical model.
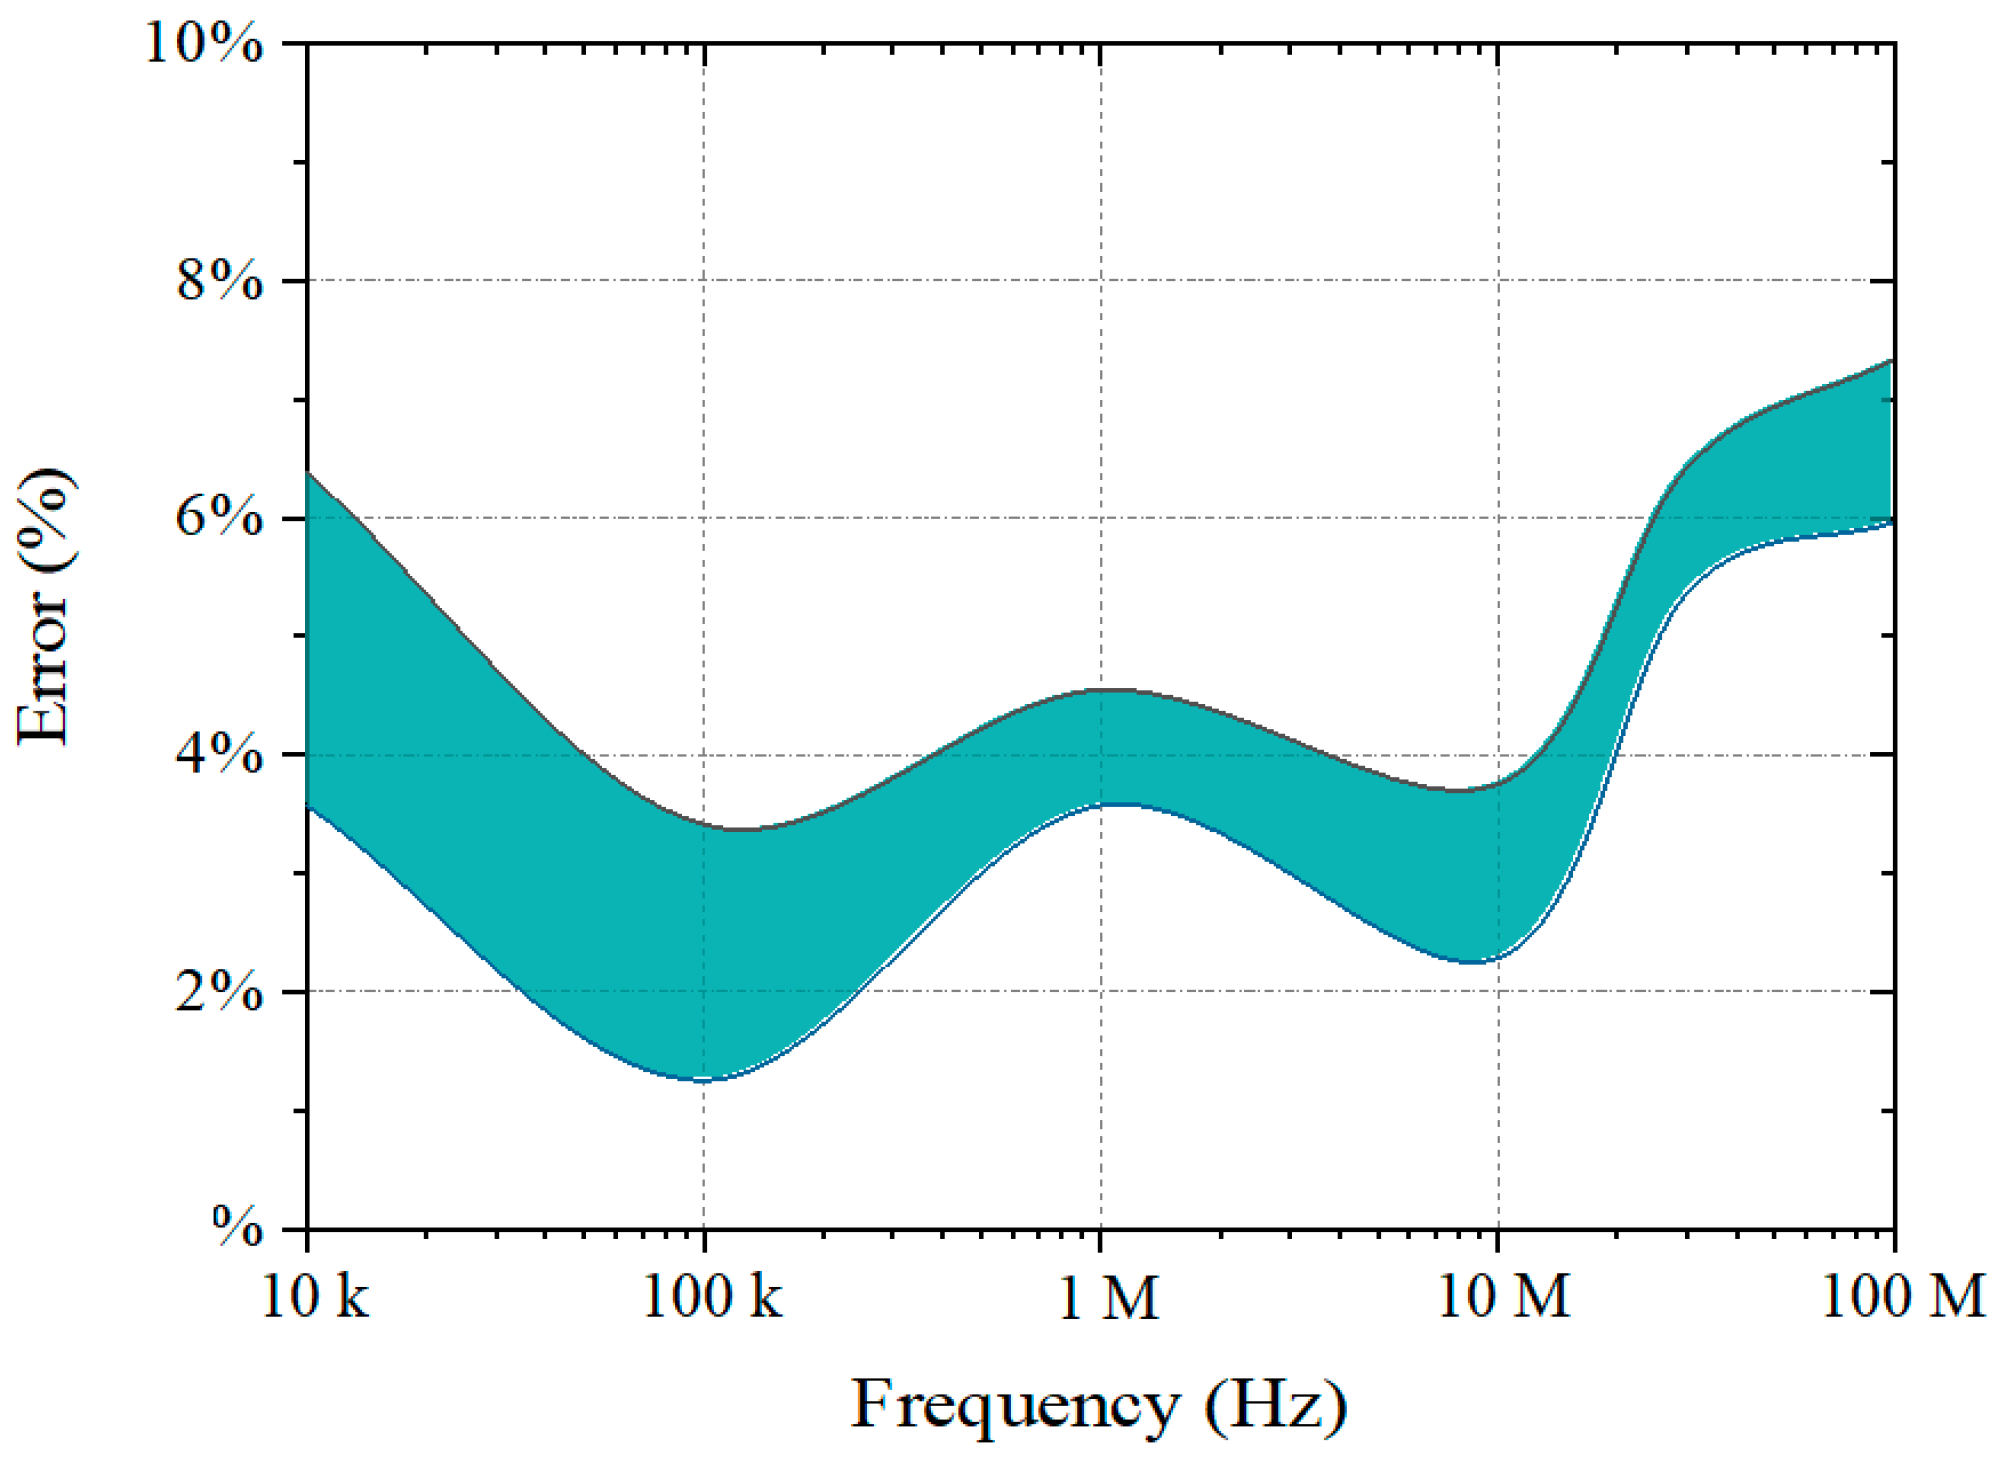
Figure 12.
The terminal conditioning circuit of the speed signal cable.

Figure 13.
The monitoring signal of the speed port in BCI.
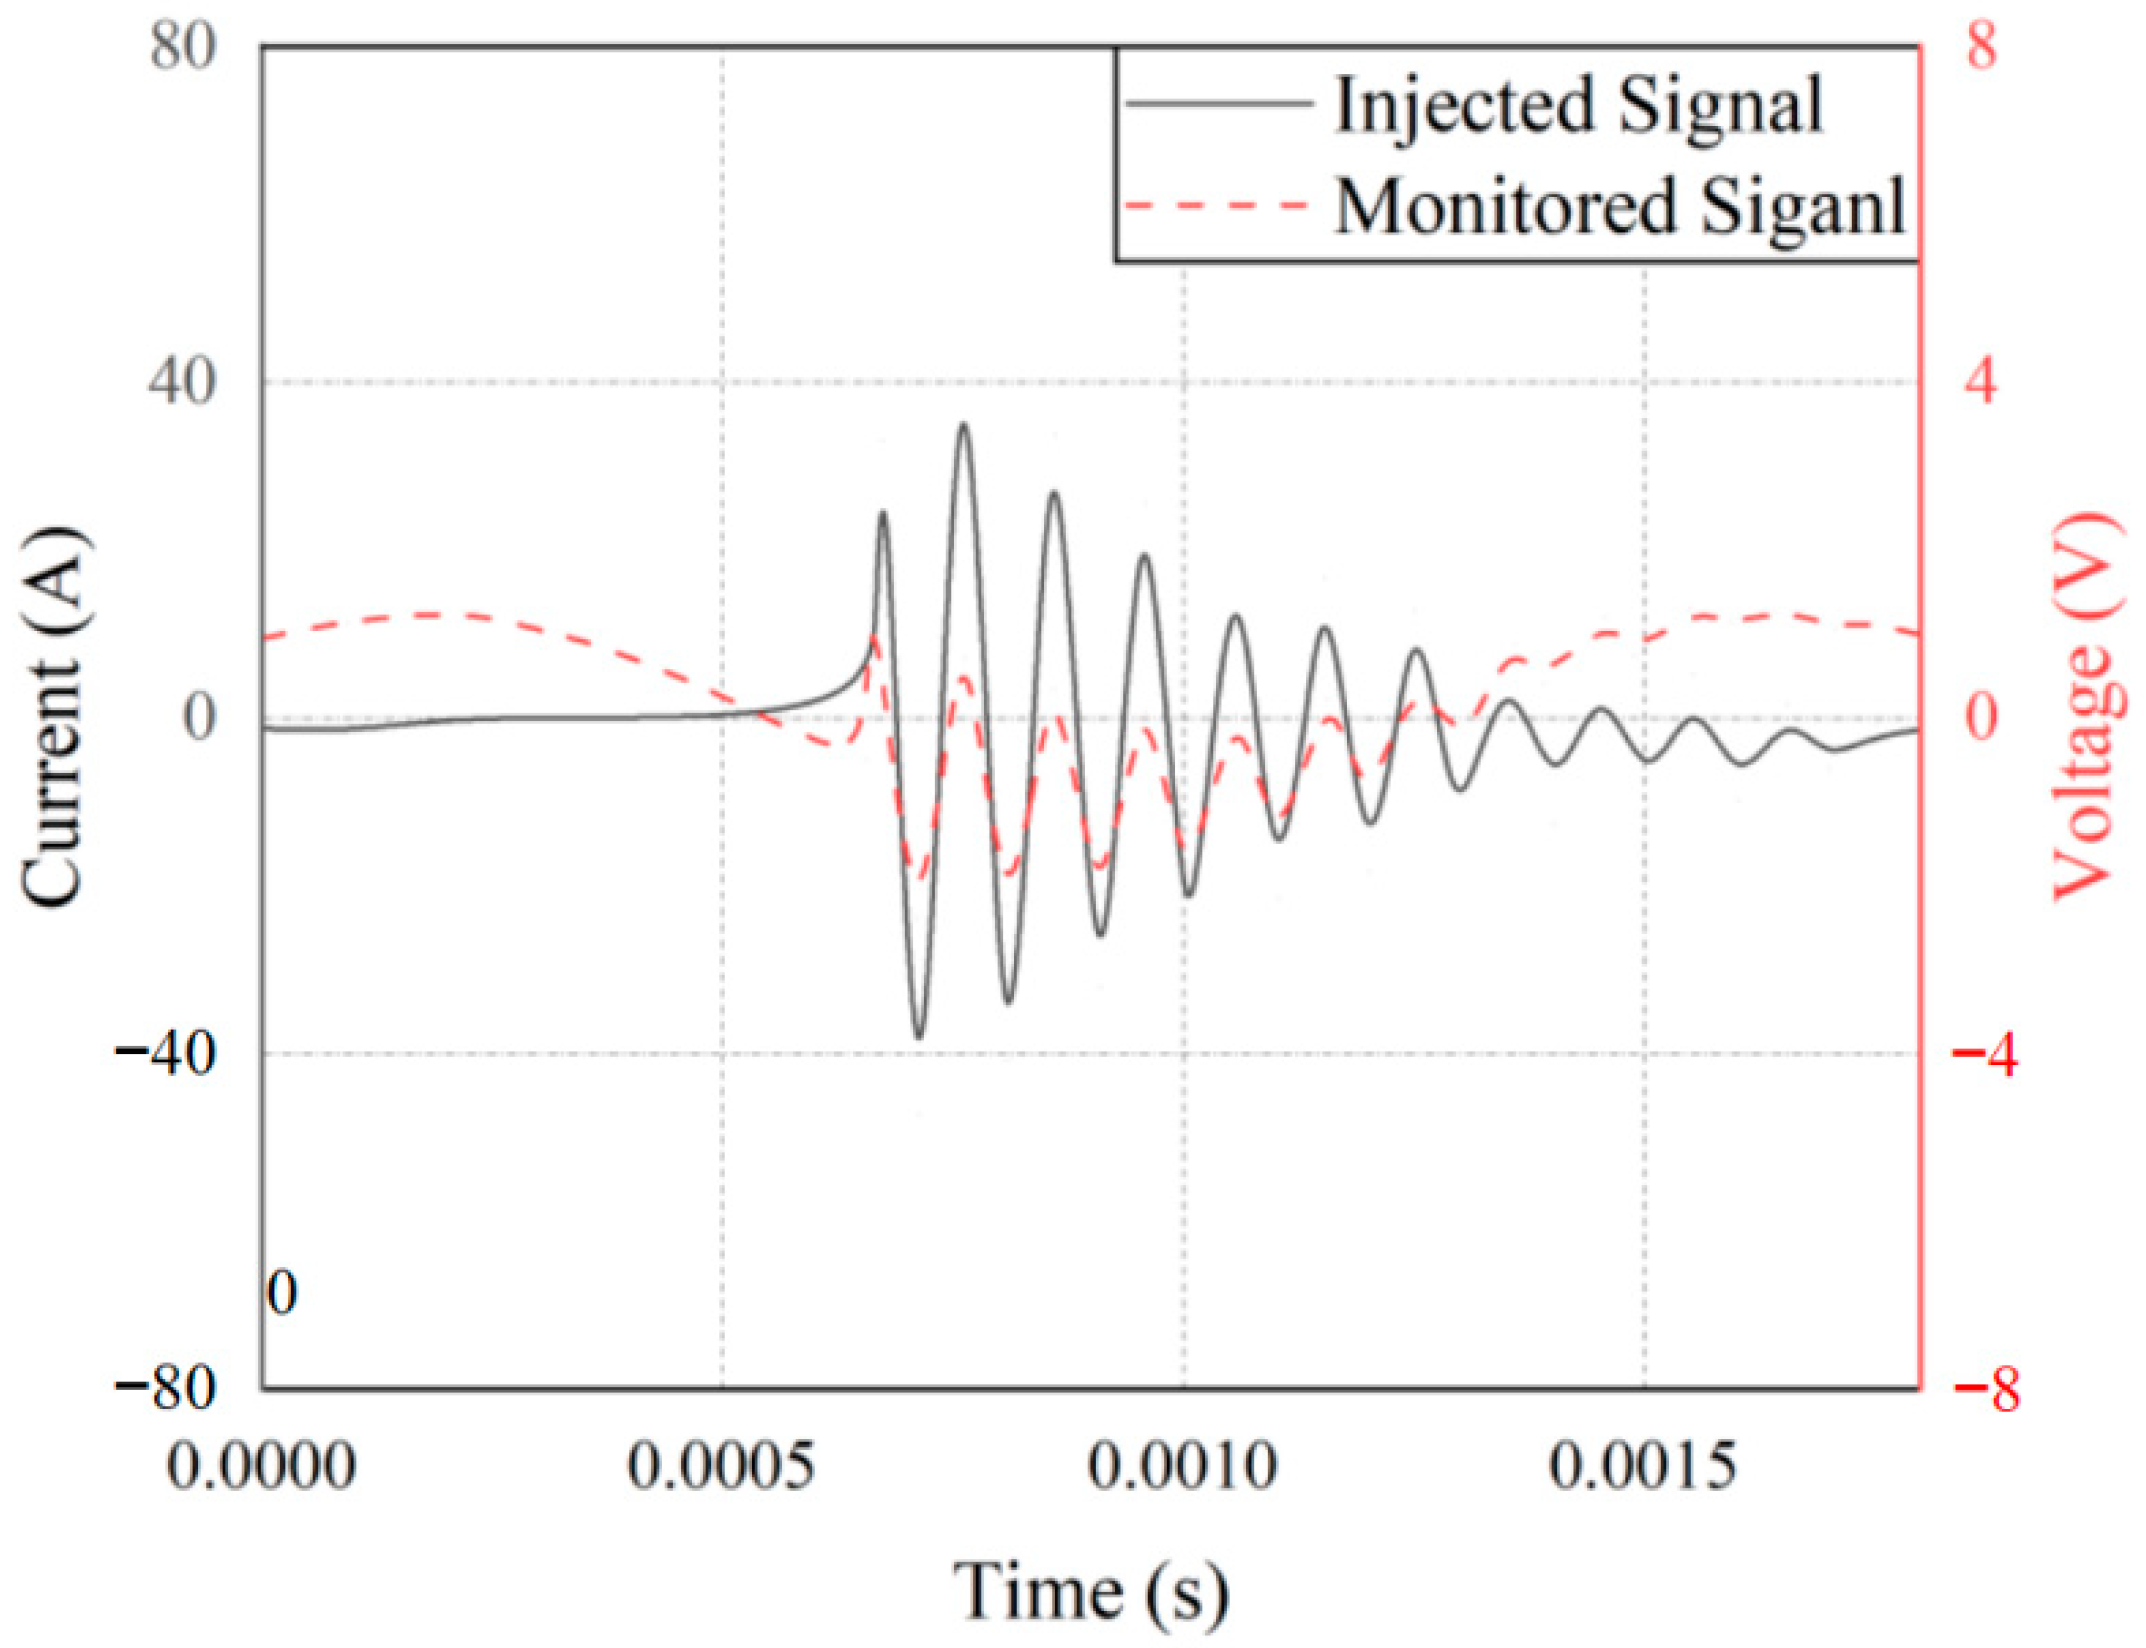
Figure 14.
The monitoring signal of the speed acquisition chip port.

Table 1.
Bulk current injection test equipment.
| Serial Number | Equipment | Type |
|---|---|---|
| 1 | Source | R&S TS 9982 |
| 2 | Oscilloscope | Tektronix DRO 4104B |
| 3 | LVDT | L-20 |
| 4 | Injection probe | PRANA DR-250 |
| 5 | DC Power | - |
| 6 | Monitoring probe | TYPE 9123 |
| 7 | Speed Sensor | CV-CD-0100 |
| 8 | Rotating Electrical Motor | XD-WS38SRZ |
| 9 | Linear Motor | BMXTL |
| 10 | Controller | - |
Table 2.
The parameters of A and B.
| The Frequency of Injected Signal | A | B |
|---|---|---|
| 10 kHz | 2.7 | |
| 100 kHz | 1.2 | |
| 1 MHz | 2.1 | |
| 10 MHz | 0.5 | |
| 30 MHz | 1.7 | |
| 100 MHz | 2.8 |
Table 3.
The parameters of and .
| The Frequency of Injected Signal | ||
|---|---|---|
| 10 kHz | 0.23 | |
| 100 kHz | 0.25 | |
| 1 MHz | 0.4 | |
| 10 MHz | 1.7 | |
| 30 MHz | 3.1 | |
| 100 MHz | 13.8 |
Table 4.
The parameters of ai and bi.
| i | ||
|---|---|---|
| 1 | 0.039 | |
| 2 | −0.551 | |
| 3 | 2.853 | |
| 4 | −6.435 | |
| 5 | 5.596 | |
| 6 | −0.602 |
Publisher’s Note: MDPI stays neutral with regard to jurisdictional claims in published maps and institutional affiliations. |
© 2022 by the authors. Licensee MDPI, Basel, Switzerland. This article is an open access article distributed under the terms and conditions of the Creative Commons Attribution (CC BY) license (https://creativecommons.org/licenses/by/4.0/).
Share and Cite
MDPI and ACS Style
Cao, J.; Wei, M.; Zhou, D. A Coupling Analytical Method of a Fuel Control System under Electromagnetic Pulses. Electronics 2022, 11, 2264. https://doi.org/10.3390/electronics11142264
AMA Style
Cao J, Wei M, Zhou D. A Coupling Analytical Method of a Fuel Control System under Electromagnetic Pulses. Electronics. 2022; 11(14):2264. https://doi.org/10.3390/electronics11142264
Chicago/Turabian StyleCao, Jie, Minxiang Wei, and Dong Zhou. 2022. "A Coupling Analytical Method of a Fuel Control System under Electromagnetic Pulses" Electronics 11, no. 14: 2264. https://doi.org/10.3390/electronics11142264
Note that from the first issue of 2016, this journal uses article numbers instead of page numbers. See further details here.