Article

Objective Assessment of Walking Impairments in Myotonic Dystrophy by Means of a Wearable Technology and a Novel Severity Index

1
Department of Electronic Engineering, Tor Vergata University of Rome, 00133 Rome, Italy
2
Department of Information Engineering, Electronics and Telecommunication, Sapienza University of Rome, 00185 Rome, Italy
3
Department of Systems Medicine, Section Neurology, Tor Vergata University of Rome, 00133 Rome, Italy
*
Author to whom correspondence should be addressed.
Electronics 2021, 10(6), 708; https://doi.org/10.3390/electronics10060708
Submission received: 30 January 2021 / Revised: 26 February 2021 / Accepted: 15 March 2021 / Published: 17 March 2021
(This article belongs to the Special Issue Wearable Electronics for Assessing Human Motor (dis)Abilities)

Abstract

:
Myotonic dystrophy type 1 (DM1) is a genetic inherited autosomal dominant disease characterized by multisystem involvement, including muscle, heart, brain, eye, and endocrine system. Although several methods are available to evaluate muscle strength, endurance, and dexterity, there are no validated outcome measures aimed at objectively evaluating qualitative and quantitative gait alterations. Advantageously, wearable sensing technology has been successfully adopted in objectifying the assessment of motor disabilities in different medical occurrences, so that here we consider the adoption of such technology specifically for DM1. In particular, we measured motor tasks through inertial measurement units on a cohort of 13 DM1 patients and 11 healthy control counterparts. The motor tasks consisted of 16 meters of walking both at a comfortable speed and fast pace. Measured data consisted of plantar-flexion and dorsi-flexion angles assumed by both ankles, so to objectively evidence the footdrop behavior of the DM1 disease, and to define a novel severity index, termed SI-Norm2, to rate the grade of walking impairments. According to the obtained results, our approach could be useful for a more precise stratification of DM1 patients, providing a new tool for a personalized rehabilitation approach.

1. Introduction

Type I myotonic dystrophy (DM1) is a rare autosomal dominant disease, and it is the most common muscular dystrophy in adult patients. For instance, in Italy, where this study was conducted, the prevalence of DM1 is estimated to be 9.65/100,000 [1]. DM1 is a multi-systemic disorder with characteristic clinical features, such as bilateral facial weakness, ptosis, premature baldness, and a predominant involvement of muscles, heart, central nervous system (CNS), eyes, endocrine glands, and gastrointestinal system. The disease is due to the expansion of CTG–repeats in the non–coding 3′ UTR of the myotonic dystrophy protein kinase (DMPK) gene on chromosome 19. Based on the number of CTG repeats, it is possible to identify three categories, named E1, E2, and E3, roughly corresponding to different phenotypes and age at onset. Intergenerational and somatic instability of the CTG repeats is responsible for the high degree of variability in this disease [2,3]. Usually, in the classic adult-onset form, the first symptoms reported are myotonia and (slow progression of) strength loss at distal muscles. Congenital form and late-onset adult form represent the two extremes of a wide range of phenotypic variability and clinical presentation. Even if muscle strength is relatively preserved, patients commonly report postural instability and gait abnormalities, fall risk and a general reduction of life quality. Beyond the loss of muscle strength, the CNS may be involved in the pathophysiology and progression of balance and gait abnormalities in DM. However, deeper investigation aimed at selecting pertinent outcome measures is essential to design a tailored therapeutic and rehabilitation approach [4].
MIRS (muscle impairment rating scale) supports mainly eye-based, operator dependent evaluation of the disease stage and progression [5] and it includes five different stages: MIRS 1 (no muscular impairment); MIRS 2 (myotonia, jaw and temporal wasting, facial weakness, neck flexors weakness, ptosis, nasal speech, no distal weakness except isolated digit flexor weakness); MIRS 3 (distal weakness, no proximal weakness except isolated elbow extensor weakness); MIRS 4 (mild to moderate proximal weakness); MIRS 5 (severe proximal weakness).
Advantageously, in occasion of the “Outcome Measures in Myotonic Dystrophy type 1” workshop (OMMYD-3), some outcome measures were recommended in clinical trials: (1) The Six-Minute Walk Test (6-MWT) (walking capacity over longer distances); (2) The 10-meterWalk Test (10-mWT) (walking speed over a short distance); (3) The 30-second chair-stand test (30-sCST) (lower limb strength and dynamic balance); (4) The Nine-Hole Peg Test (9-HPT) (upper extremity function, specifically fine dexterity and coordination) [6]. Those outcome measures have been specifically validated for DM1 patients [7,8].
Disadvantageously, those measures address different functions, such as strength, endurance, speed, dexterity and balance, whereas a qualitative and quantitative tool for the analysis of gait alteration in DM1 clinical practice is needed. One example would be motion capture systems, able to perform joint angle calculation and gait analysis. The recognized gold standard is the optoelectronic system as used by Galli et al. in their gait analysis on myotonic dystrophy patients [9], featuring 6 cameras, two force platforms, electromyography, and a video-recording.
On the other end, wearable technology has been proving to produce convincing and useful results in evaluating motor impairments of subjects suffering from (among others) Parkinson disease [10,11,12], attention deficit hyperactivity disorder/developmental coordination disorder (ADHD/DCD) [13], neuro-degenerative diseases [14], or spinal cord injury [15], when measured in a clinical environment, and in evaluating motor (dis)abilities of subjects when doing daily chores in home environment too [16,17,18]. The effective sensitivity of instruments as accelerometers, gyroscopes [19,20], and electromyography (EMG) [21], supports and extends the naked-eye analysis of the medical doctors [22] for the balance and gait analysis: Chapron et al adopted wearable IMUs on patients during physical rehabilitation programs within domestic environments [23]. Storm et al found that IMUs applied to the six-minute walk trial can provide clinically meaningful information [24].
All in all, wearable technology can potentially result a valuable ally for motor assessment and, so far, only a few studies have addressed this issue in DM1 [25,26]. However, to our best knowledge, there is a lack of works related to inertial sensors used for gait analysis of DM1 patients, no one providing a severity index and a comparison to the MIRS scale. Within this frame, here we present a new approach, derived from the measure and the analysis of kinematic parameters, in order to furnish a score of gait-related dynamic foot alterations in a cohort of DM1 patients. This is because myotonic dystrophy is a rare disease and, despite great efforts, it does not allow for measuring a large number of patients and, consequently, implementing advanced analysis techniques. Therefore, we propose a novel method that, at low computational cost, provides reliable results by exploiting a peculiarity of the disease such as foot drop. The low computational cost required allows for integrating this technique in future low-cost hardware devices.
Therefore, this work aims at improving DM1 patient severity discrimination by providing objective ranking parameters and identifying MIRS 3 and 4 patients. This could be very useful, together with the MIRS scale, to support both clinical diagnosis and follow-up. We provide details, in the materials and methods paragraph, on the enrolment criteria of the patient cohort, the motor tasks performed by the subjects, and the wearable system used to gather the measurements. A description of the data analysis strategies and the scoring algorithm closes the section. We then report the algorithm results and discuss them focusing on the capability of the proposed method to detect gait anomalies.

2. Materials and Methods

2.1. Subjects

Thirteen consecutive DM1 patients were recruited at “Policlinico Tor Vergata” Neuromuscular outpatient clinic in Rome (Italy).
In order to evaluate the presence and characteristics of gait alterations in ambulant patients, we omitted considering early or late stages of the disease, and so, we enrolled for the study 6 men (50 ± 8.2 SD yo) and 7 women (42 ± 11.6 SD yo) with genetically confirmed DM1, scoring MIRS 3 or MIRS 4.
For our tests, exclusion criteria for subjects were the necessity to wear foot orthoses or to use a cane or walker, and a history of previous fractures in the lower limbs or other comorbidities which could alter the gait performances. Due to the rarity of the disease and the difficulty of finding DM1 patients meeting the inclusion and exclusion criteria, it was not possible to test a larger number of subjects and the enrolled patients required a whole year to complete the measurements. A sex- and age-matched healthy control group, (4 men 40 ± 15.6 SD yo and 7 women 43 ± 11 SD yo) were recruited among patients’ partners (wife, husband or relatives with a negative genetic test for DM1) and staff of the hospital, all showing normal strength at limbs and no gait abnormalities.
All subjects underwent a complete neurological examination and performed a clinical evaluation of muscle strength with MRC score (Medical Research Council). The MRC score is as follows: 5/5 movement possible against maximum resistance; 4/5 movement possible only against minimal resistance; 3/5 movement possible only against gravity; 2/5 movement possible only in absence of gravity; 1/5 reference to movement; 0/5 on the MRC scale: the absence of movement.
This study was approved by the ethics committee of “Policlinico Tor Vergata” (Reference: 188.20) and is conformed to the Declaration of Helsinki. All participants signed an informed consent.

2.2. Wearable Sensors

In order to measure motor tasks, we used a network of four inertial measurement units (IMUs), each termed “Movit G1” (firmware v.3.1, by Captiks, Rome, Italy), proved to perform for gait analysis similarly to gold-standard vision-based ones [27], but lower in cost, complexity and calibration time. Each IMU is equipped with a 3-axes accelerometer (set at ± 2 g), a 3-axes gyroscope (set at ± 2000 dps), and a compass, the latter not used since a manufacturer patented calibration procedure allows obtaining roll, pitch, and yaw without the need of compass data. The IMUs can send data in wireless mode (ZigBee-based protocol) to a receiving unit at 50 Hz clock frequency or can store data in built-in memories at 200 Hz (the same working frequency of the internal sensors), synchronously for all four IMUs, and so we adopted the latter to avoid reduction in the information content. The “Motion Studio®” software (3D edition v.2.3.47) synchronized data flowing from the sensors and provided a real-time representation of the patient movements.
The four IMUs were placed, in turn, on each subject performing motor tasks on both insteps and shins, so to gather information related to the ankles, as detailed in Figure 1. To correctly detect the ankle joint angles, two MOVIT® sensors (Rome, Italy, #1 and #4 in Figure 1) were placed externally on the shank over the malleolus. Two other sensors (#2 and #3 in Figure 1) were placed on the dorsalis pedis: the proper shape of the Velcro® band (Cheshire, UK), and the two thin elastic bands to retain the position, granted a comfortable walk.
The “Motion Analyzer®” software (by Captiks, Rome, Italy), in bundle with the four “Movit G1”, provides the values of the angles (in degrees) assumed by the ankles during walking, from differentiating measurements from IMUs on insteps and shins, respectively.

2.3. Motor Tasks

All subjects, wearing the sensors, performed 16 meters walking tasks first at comfortable speed and later at as fast as possible pace (but without running). The MOVIT® sensors were calibrated before performing each walking test, so as to assure the needed measurement accuracy. Furthermore, the short time required to complete the walking task allowed maintaining the calibration of the accelerometer and gyroscope during measurements.

2.4. Data Analysis

During walking, the ankles rotate in plantar-flexion and dorsi-flexion, assuming negative-angles and positive-angles, respectively, with respect to the floor.
From considering the number of times we measured “the same” angle, i.e. angles within a “narrow” interval, during walking we could establish the elapsed times in both plantar-flexion and dorsi-flexion conditions. These “narrow” interval angles come by empirically dividing into 30 regular intervals the overall angular span so obtaining, in a Cartesian plane, a distribution of rectangles “narrow” in degrees (x-axis) and “heights” proportional to the time spent within that “narrow” interval of angles (y-axis). We obtained one distribution of rectangles for each subject’s motor task, clearly with its peak at zero (i.e. with the ankle at 90° within the error of the “narrow” interval), with plantar-flexion on the left of the Cartesian plane (negative values) and dorsi-flexion on the right (positive values). By fitting the distribution with a Kernel smoothing function, we finally converted the distribution of rectangles into a math function, as Figure 2 shows.

2.4.1. Area Ratio (AR)

By integrating the left-side and the right-side of the function, we obtained information of the amount of time spent in plantar-flexion and in dorsi-flexion, respectively.
Naming PI the integral of the function representing the plantar-flexion and DI the equivalent for dorsi-flexion conditions, we defined the Area Ratio as AR = PI/DI, so that when AR > 1 the subject spends more time in plantar-flexion conditions, typical of a foot-drop behavior of the DM1 disease.

2.4.2. Power Ratio (PR)

By focusing on the dynamic aspect of the motor tests, we removed the DC component from the function, so to avoid considering the very starting and ending parts of the walking tasks (corresponding to rest conditions). A fast Fourier transform (FFT) was applied on the function to analyze its frequency contents, while rectification and FFT shift cancelled misleading negative peaks and frequencies. In addition, we adopted a pass-band FIR equiripple filtering within 0.2–8 Hz range, to mainly eliminate noise contents but maintaining only the higher order harmonics that we empirically considered as the ones with useful information content.
After these procedures, we computed the power spectral density (PSD, a commonly used parameter in gait analysis [28]) of the signal as the squared value of the FFT, scaled according to the sampling frequency value (200 Hz, in our case) and the signal length.
This was prodromal to evidence power content of the fundamental frequency, named P1, with respect the power content of the higher order harmonics, named PH. Specifically, P1 was calculated 0.2–1.5 Hz band-pass filtering to isolate the fundamental frequency and integrating the resulting spectrum; PH was calculated 1.5–5 Hz band-pass filtering to isolate the harmonics up to the fifth one and integrating the resulting spectrum. All in all, we defined the so-called power ratio as PR = P1/PH. According to the experienced medical examiner, a PR > 1 value highlights a foot-drop behavior of the subject performing motor tasks.

2.4.3. Severity Index (SI) and Si-Norm2

Both the aforementioned AR and PR values are powerful indicators, each highlighting different (somehow complementary) aspects, of walking abilities/disabilities, and so are here considered converging to a unique parameter, named severity index (SI), as detailed in the following.
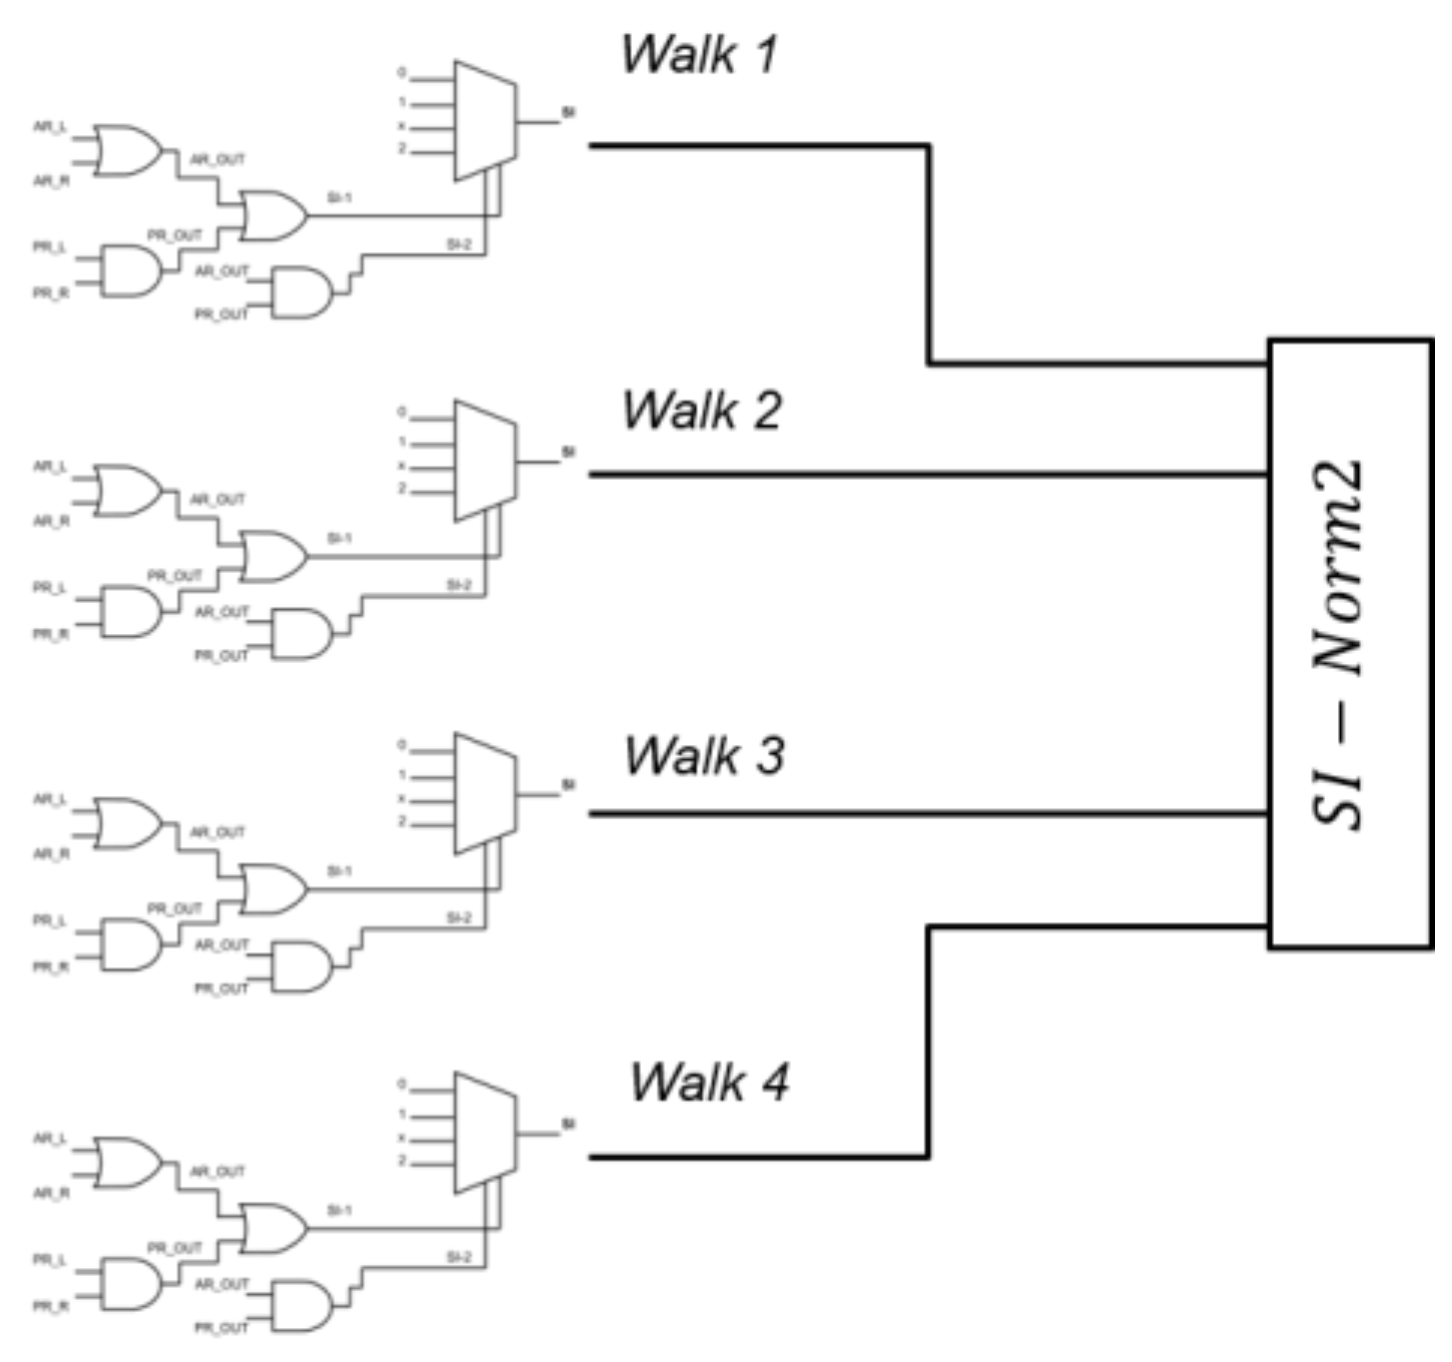
For the sake of simplicity, here we considered adopting a binary logic gates decision tree (Figure 3), so that previously determined AR and PR values lower than “1” were set to “0” and higher than “1” were set to “1”.
AR and PR must be considered both for left and right legs, and so can be referred as AR_L, AR_R and PR_L, and PR_R, respectively.
An OR logic gate fed by AR_L, AR_R produces a AR_OUT output that is “1” if at least one of the two feet behaves as dropping-foot. An AND logic gate with inputs PR_L, PR_R furnishes a PR_OUT output that is “1” if both feet behave as dropping-foot. Then, AR_OUT and PR_OUT fed an OR gate to determine a first severity index, as SI-1 (that reveals if one between Area Ratio and Power ratio reveals a foot-drop issue), while fed an AND gate to determine a second severity index, as SI-2 (that reveals if both Area Ratio and Power ratio reveal a foot-drop issue).
Both SI-1 and SI-2 enter a decision multiplexer that furnishes a final SI vector, with values of 0”, “1” or “2”, according to the Table 1. The value “0” identifies a motor test with a regular walking pattern; “1” highlights mild “walking anomalies”; “2” relates of “severe anomalies”. We obtained four SI values, one for each of the four motor tasks (16m back and 16m forth walk at a comfortable and at fast pace, respectively.
As shown in Figure 4, for each subject we had four SI values, one for each walk task, that entered a squared norm algorithm to determine an overall severity index named “SI-Norm2” (SI stands for Severity Index, Norm2 for Squared Norm), which can result as an integer value in the 0–16 range.

3. Results

3.1. Area Ratio (AR)

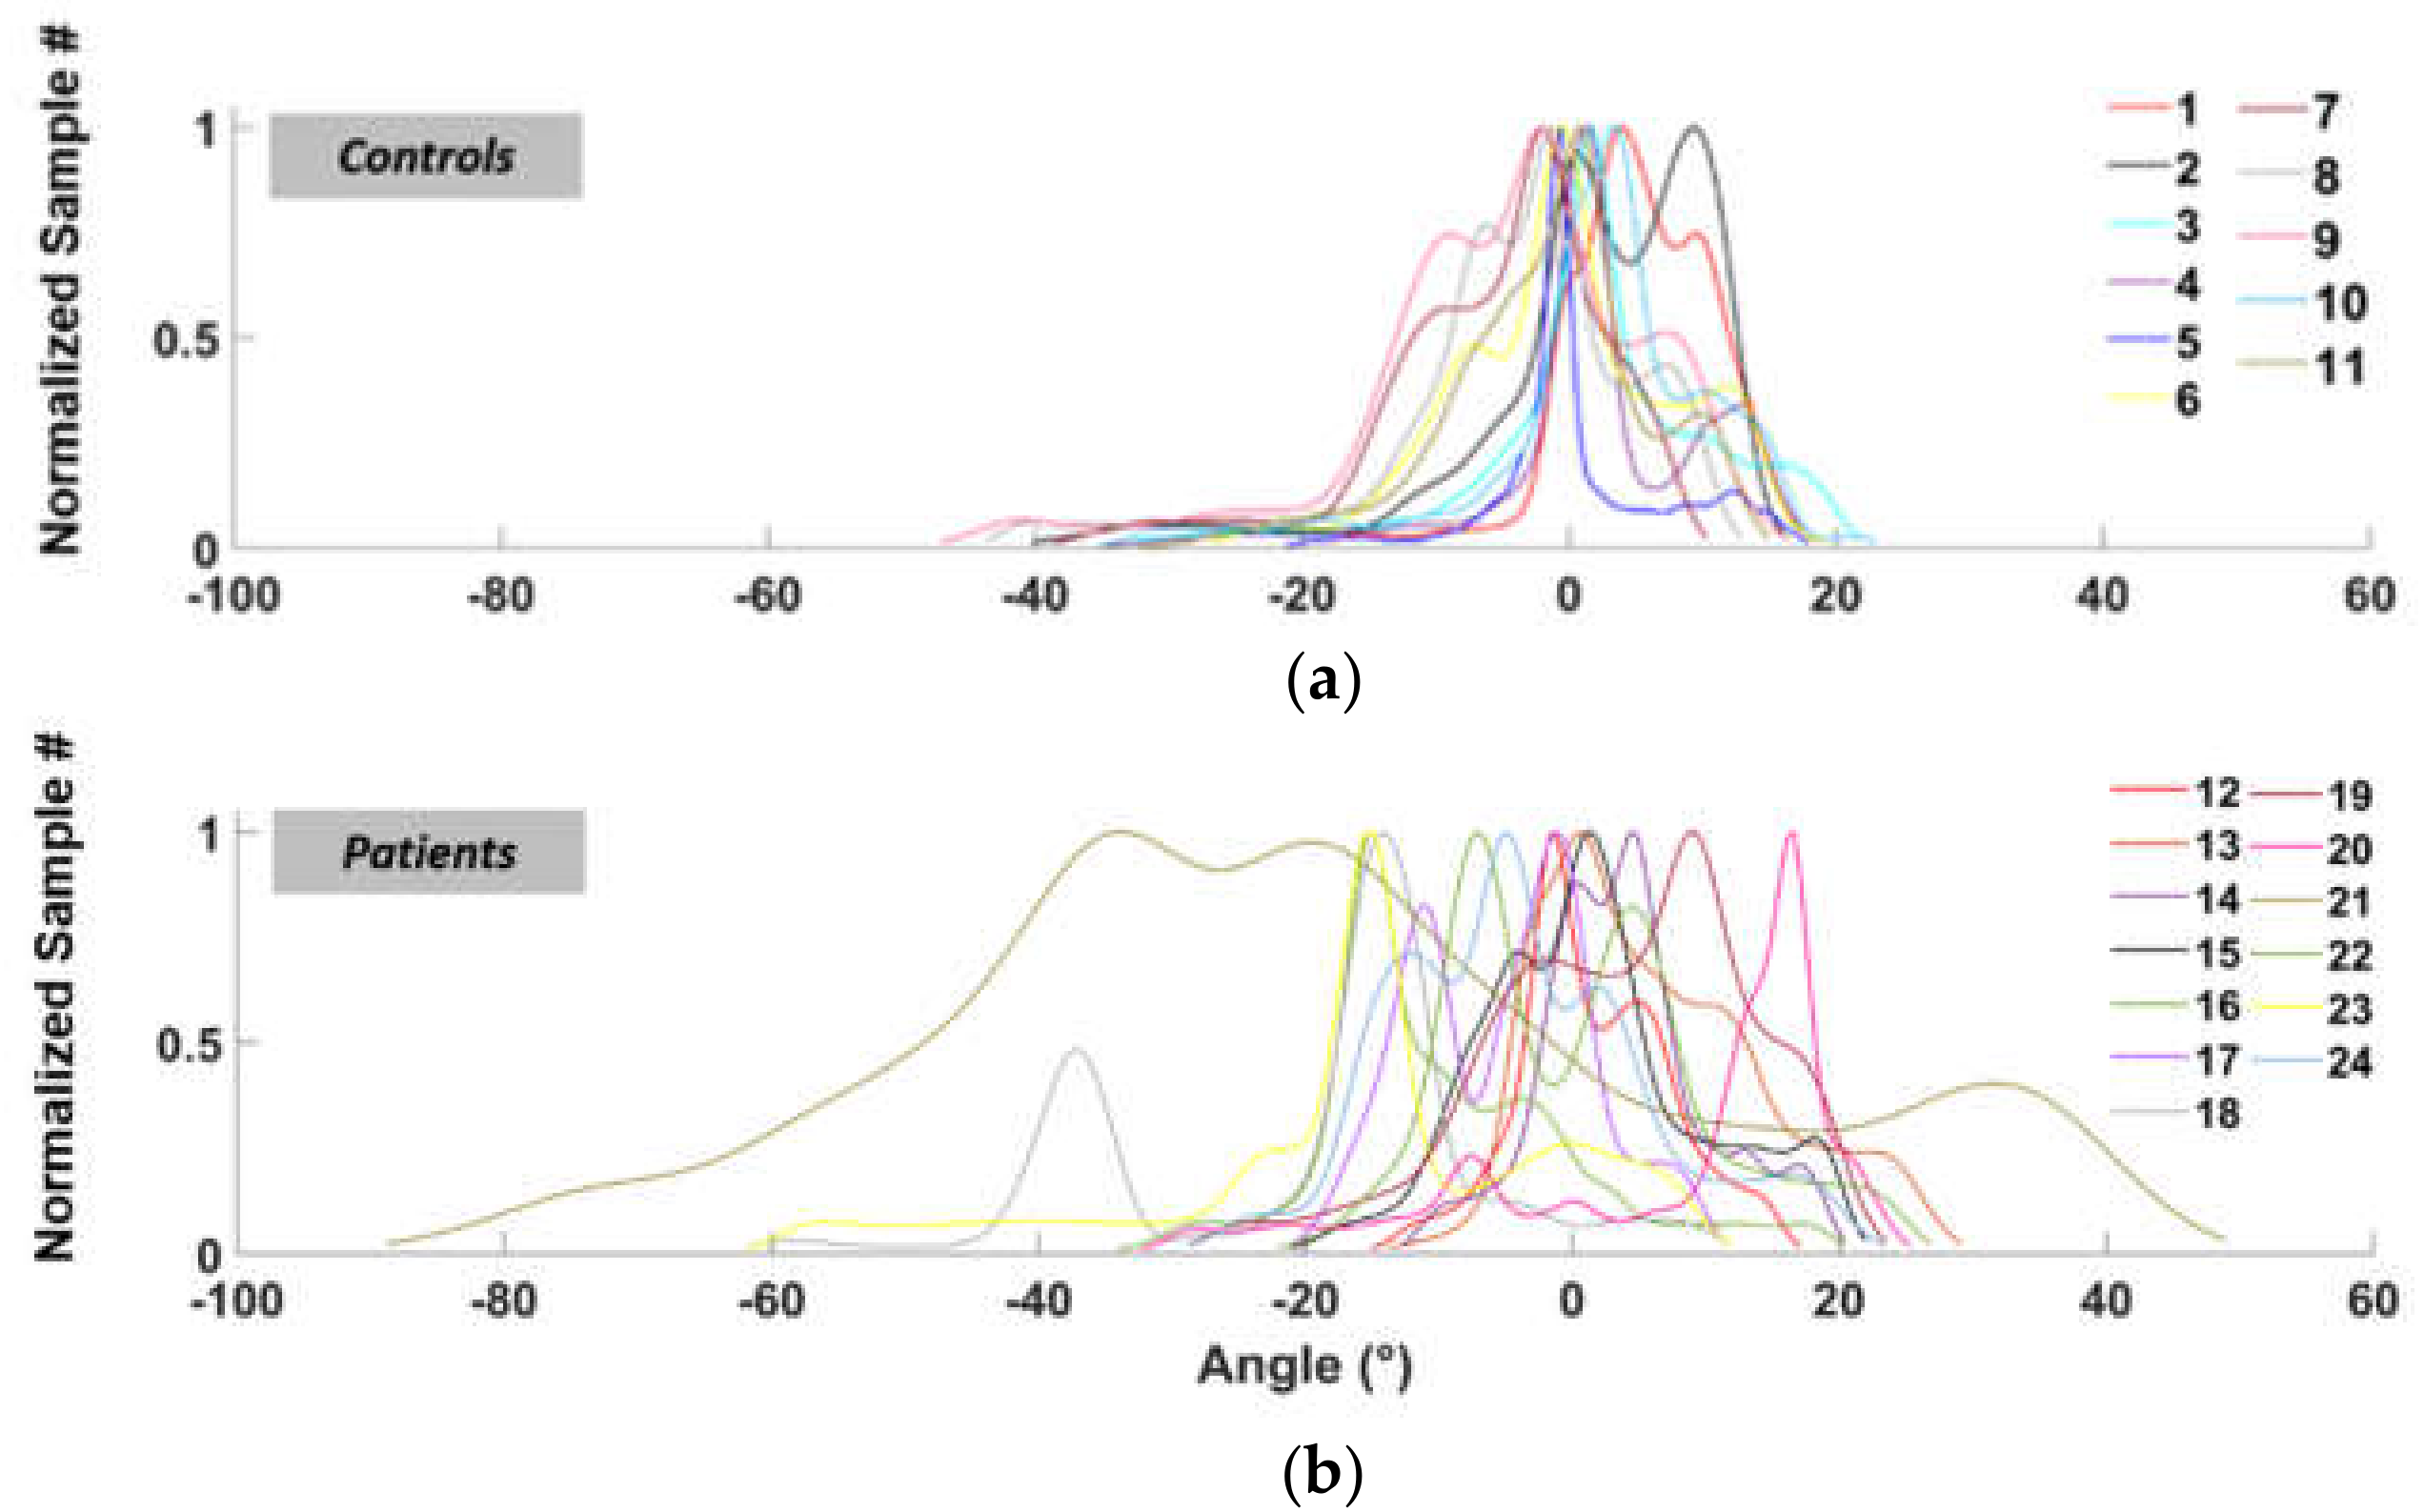
Figure 5 shows the functions (previously defined in Section 2.4 “Data analysis”) relate to the number of occurrences of each angle during walking, for healthy subjects (Figure 5a) and patients (Figure 5b), respectively.
Table 2 shows AR values obtained, for both healthy subjects (controls, hereafter) and patients, for the two 16m tasks at comfortable speed (CS) and the two 16 m at fast pace (FP), related to the right leg (R postfix) and left leg (L postfix). Column CS_1L, for example, represents the AR values of the left foot in the first walk at comfortable speed. For the most part, controls mainly exhibit AR < 1 (“normal” walking), while patients AR > 1 (“footdrop-”), but some control presents “drop-like” foot behavior (AR > 1), and some patients exhibit “regular” performances (AR < 1). This can be due to different reasons such as individual walking attitudes or temporary joint problems. As such, we did not consider AR alone but in ensemble with PR parameter.
In order to evaluate if AR reflects the clinical foot drop impairment, we performed a Spearman correlation between AR values and the MRC score of foot dorsiflexor muscles for each side. We found a moderate, inverse correlation that was significant for the left side (r = −0.59, p = 0.04) but not for the right side (r = −0.46, p = 0.11). We interpret this discrepancy as possibly due to the small sample and to the low sensitivity of the MRC score.

3.2. Power Spectral Density and PR (Power Ratio)

Table 3 shows PR values obtained at normal speed (Test_CS) and fast pace (Test_FP) walking tests, for right leg (R postfix) and left leg (L postfix), for both controls and patients.
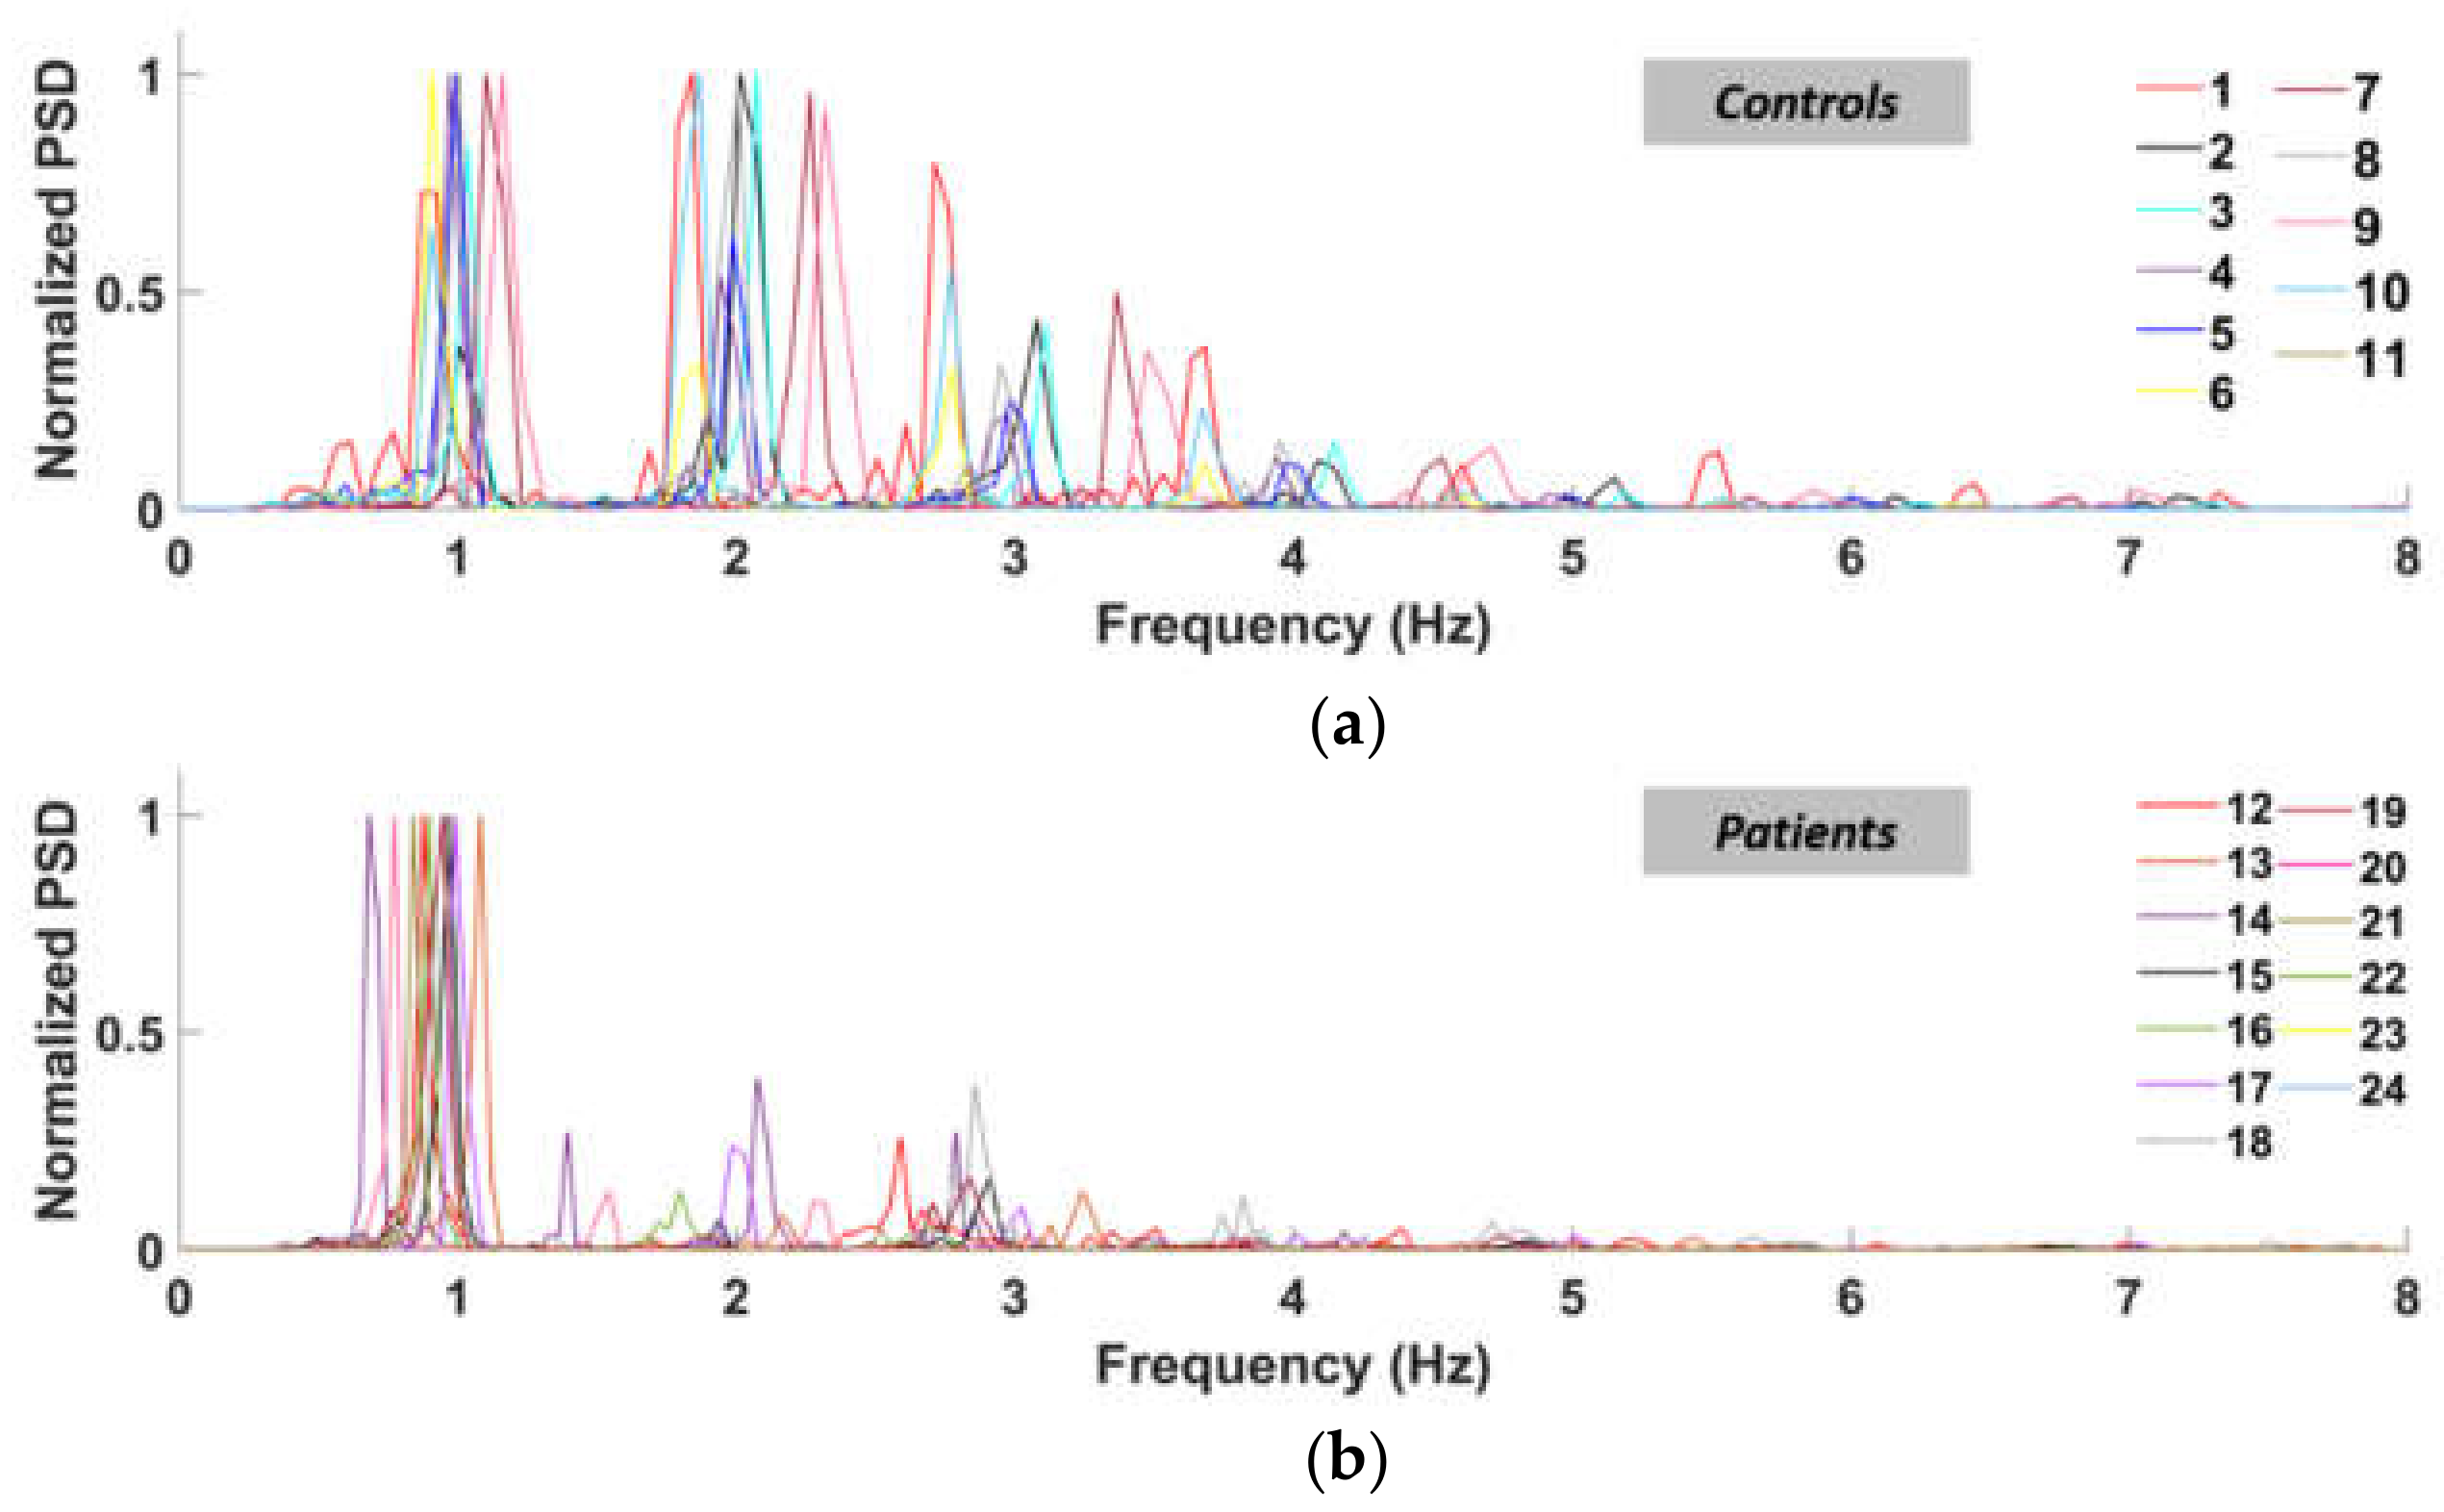
As expected, controls behaved mostly as PR < 1, whilst patients mostly as PR > 1. This happens because the patients lack power in their higher-order harmonics, while the control subjects retain comparable peaks between almost all the significant harmonics, as clearly represented in Figure 6. For these reasons, PSD must be considered in assessing gait performances.

3.3. Severity Index (SI-Norm2)

Table 4 reports information, MIRS and SI-Norm2 values for the 24 subjects.
According to Figure 7, SI-Norm2 results a powerful indicator for distinguishing controls (SI-Norm2 = 3) vs. DM1 patients (SI-Norm2 = 7), except for one subject (#19) only.

4. Discussion

By measuring plantar-flexion and dorsi-flexion of both ankles during walking tasks of DM1 patients vs. controls, we were able to detect objective differences so to discriminate the two groups and to introduce a novel parameter for ranking the motor impairment. In particular, we focused on the time spent in both plantar-flexion and dorsi-flexion conditions to determine a so-called Area Ratio, or AR, parameter and to determine a so-called Power ratio, or PR, parameter. A suitable combination of AR and PR gives rise to an overall Severity Index, or SI-Norm2. In addition, the SI-Norm2 assesses the severity rating of the disease with respect to the walking capabilities of subjects. In Table 4, controls are numbered from 1 to 11, MIRS 3 patients from 12 to 19, and MIRS 4 from 21 to 24. In the last column is reported the SI-Norm2 value as from the automated decision algorithm. For clarity, in Figure 7, we report the SI-Norm2 values as a function of the subject number (representing controls with squares, MIRS 3 patients with diamonds, and MIRS 4 patients with triangles). We found an interesting correspondence between the SI-Norm2 value and the clinical classification between controls and patients. To emphasize this result, Figure 7 is separated into two sections by a dotted line at SI-Norm2 = 4.5: below the line (SI-Norm2 < 4.5) subjects have regular ankle pattern, while above the line (SI-Norm2 > 4.5) subjects manifest anomalies of the ankle pattern during gait. According to our results, the SI-Norm2 furnishes a valuable index to detect the gait-related dynamic foot alterations in DM1 patients as compared to normal controls, with the exception of one patient that showed a normal SI-Norm2 values despite a MIRS 3 score. MIRS 3 comprehends patients with a wide range of distal weakness, ranging from minor signs confined only to upper extremities to a more severe and diffuse strength loss. In this case, MIRS 3 corresponded to reduced strength in hand muscles with a relative sparing of foot muscles. Other to the discrimination capability (healthy vs. DM1 patients), the SI-Norm2 can furnish a severity index strictly related to the walking capability (specifically the foot-drop) of the subject under test. This is why we cannot assume a correlation with the MIRS index, which is qualitative in nature and takes into account an all-body evaluation of strength loss.
According to our results, the key role of the Si-Norm2 can be to provide a novel tool for objectively ranking in the MIRS 3 and 4 subject, so to support and enhance the clinical evaluation for diagnosis and follow-up purposes.

5. Conclusions

MIRS scale supports clinicians to evaluate the severity of DM1 patients. As a new approach, to the best of our knowledge this work represents the first research adopting wearable sensors (IMUs in particular) for measuring gait of DM1 patients, and providing a novel severity index (named “SI-Norm2”) as an objective score of foot drop evaluation. Our strategy combines the analysis from the ankle angular distribution and the power spectral density. Thus, in order to automatically discerning the ankle patterns anomaly, we propose a kinematic severity scale for DM1 patients. Interestingly, despite the fact that this scale is not representative of the whole clinical condition of the patients, it results in good agreement with the MIRS scale. Advantageously, such a severity scale results from an automatic low-computational procedure, not demanding complex technical skills to be applied. According to our results, wearable technologies and data analysis can objectively assess DM1 disease from a gait analysis point of view. Specifically, wearables allowed a non-invasive and time- and cost-effective inertial measurement of DM1.
In conclusion, we propose an alternative low-cost computational method that still provides reliable results by exploiting peculiarities of the disease such as foot drop. The low computational cost required allows integrating this technique in future low-cost hardware. This approach may be useful for a precise stratification of DM1 patients based on kinematic gait parameters, providing a new sensitive tool for a personalized rehabilitation approach to this disease. Future longitudinal studies on the natural history and correlation with known clinical parameters will help in evaluating the possible role of this method as an outcome measure for DM1.

Author Contributions

Conceptualization: G.S., V.E., R.M., E.F.; methodology: G.S., A.M., V.E., R.R., R.M., E.F.; software: A.M., V.E., I.M., R.R.; validation: G.S., V.E.; formal analysis: G.S., V.E., A.M., F.I., I.M.; investigation: G.S., V.E., A.M., R.R., R.M., E.F.; resources: G.S.; data curation: A.M., V.E., I.M., R.R., E.F.; writing—original draft preparation: G.S., A.M., V.E., F.I., R.M., E.F.; writing—review and editing: G.S., A.M., F.I., R.M., E.F.; visualization: V.E., A.M., R.R., I.M.; supervision: G.S., V.E., F.I., R.M; project administration: G.S., F.I.; funding acquisition: G.S. All authors have read and agreed to the published version of the manuscript.

Funding

This research received no external funding.

Institutional Review Board Statement

This study was approved by the ethics committee of “Policlinico Tor Vergata” (Reference: 188.20, Approved: 7 October 2020) and is conformed to the Declaration of Helsinki.

Informed Consent Statement

Informed consent was obtained from all subjects involved in the study.

Data Availability Statement

The data presented in this study are all available in this article.

Conflicts of Interest

The authors declare no conflict of interest.

References

  1. Vanacore, N.; Rastelli, E.; Antonini, G.; Bianchi, M.L.E.; Botta, A.; Bucci, E.; Casali, C.; Costanzi-Porrini, S.; Giacanelli, M.; Gibellini, M.; et al. An Age-Standardized Prevalence Estimate and a Sex and Age Distribution of Myotonic Dystrophy Types 1 and 2 in the Rome Province, Italy. Neuroepidemiology 2016, 46, 191–197. [Google Scholar] [CrossRef]
  2. Tomé, S.; Gourdon, G. DM1 Phenotype Variability and Triplet Repeat Instability: Challenges in the Development of New Therapies. Int. J. Mol. Sci. 2020, 21. [Google Scholar] [CrossRef] [Green Version]
  3. De Antonio, M.; Dogan, C.; Hamroun, D.; Mati, M.; Zerrouki, S.; Eymard, B.; Katsahian, S.; Bassez, G. Unravelling the Myotonic Dystrophy Type 1 Clinical Spectrum: A Systematic Registry-Based Study with Implications for Disease Classification. Rev. Neurol. 2016, 172, 572–580. [Google Scholar] [CrossRef]
  4. Okkersen, K.; Jimenez-Moreno, C.; Wenninger, S.; Daidj, F.; Glennon, J.; Cumming, S.; Littleford, R.; Monckton, D.G.; Lochmüller, H.; Catt, M.; et al. Cognitive Behavioural Therapy with Optional Graded Exercise Therapy in Patients with Severe Fatigue with Myotonic Dystrophy Type 1: A Multicentre, Single-Blind, Randomised Trial. Lancet Neurol. 2018, 17, 671–680. [Google Scholar] [CrossRef] [Green Version]
  5. Mathieu, J.; Boivin, H.; Meunier, D.; Gaudreault, M.; Bégin, P. Assessment of a Disease-Specific Muscular Impairment Rating Scale in Myotonic Dystrophy. Neurology 2001, 56, 336–340. [Google Scholar] [CrossRef]
  6. Gagnon, C.; Heatwole, C.; Hébert, L.J.; Hogrel, J.-Y.; Laberge, L.; Leone, M.; Meola, G.; Richer, L.; Sansone, V.; Kierkegaard, M. Report of the Third Outcome Measures in Myotonic Dystrophy Type 1 (OMMYD-3) International Workshop Paris, France, June 8, 2015. J. Neuromuscul. Dis. 2018, 5, 523–537. [Google Scholar] [CrossRef] [Green Version]
  7. Cutellè, C.; Rastelli, E.; Gibellini, M.; Greco, G.; Frezza, E.; Botta, A.; Terracciano, C.; Massa, R. Validation of the Nine Hole Peg Test as a Measure of Dexterity in Myotonic Dystrophy Type 1. Neuromuscul. Disord. 2018, 28, 947–951. [Google Scholar] [CrossRef]
  8. Jimenez-Moreno, A.C.; Nikolenko, N.; Kierkegaard, M.; Blain, A.P.; Newman, J.; Massey, C.; Moat, D.; Sodhi, J.; Atalaia, A.; Gorman, G.S.; et al. Analysis of the Functional Capacity Outcome Measures for Myotonic Dystrophy. Ann. Clin. Transl. Neurol. 2019, 6, 1487–1497. [Google Scholar] [CrossRef] [Green Version]
  9. Galli, M.; Cimolin, V.; Crugnola, V.; Priano, L.; Menegoni, F.; Trotti, C.; Milano, E.; Mauro, A. Gait Pattern in Myotonic Dystrophy (Steinert Disease): A Kinematic, Kinetic and EMG Evaluation Using 3D Gait Analysis. J. Neurol. Sci. 2011, 314, 83–87. [Google Scholar] [CrossRef]
  10. Ricci, M.; Di Lazzaro, G.; Pisani, A.; Mercuri, N.B.; Giannini, F.; Saggio, G. Assessment of Motor Impairments in Early Untreated Parkinson’s Disease Patients: The Wearable Electronics Impact. IEEE J. Biomed Health Inform. 2020, 24, 120–130. [Google Scholar] [CrossRef]
  11. Mazzetta, I.; Zampogna, A.; Suppa, A.; Gumiero, A.; Pessione, M.; Irrera, F. Wearable Sensors System for an Improved Analysis of Freezing of Gait in Parkinson’s Disease Using Electromyography and Inertial Signals. Sensors 2019, 19, 948. [Google Scholar] [CrossRef] [PubMed] [Green Version]
  12. Zampogna, A.; Manoni, A.; Asci, F.; Liguori, C.; Irrera, F.; Suppa, A. Shedding Light on Nocturnal Movements in Parkinson’s Disease: Evidence from Wearable Technologies. Sensors 2020, 20, 5171. [Google Scholar] [CrossRef]
  13. Ricci, M.; Terribili, M.; Giannini, F.; Errico, V.; Pallotti, A.; Galasso, C.; Tomasello, L.; Sias, S.; Saggio, G. Wearable-Based Electronics to Objectively Support Diagnosis of Motor Impairments in School-Aged Children. J. Biomech. 2019, 83, 243–252. [Google Scholar] [CrossRef]
  14. Zampogna, A.; Mileti, I.; Palermo, E.; Celletti, C.; Paoloni, M.; Manoni, A.; Mazzetta, I.; Costa, G.D.; Pérez-López, C.; Camerota, F.; et al. Fifteen Years of Wireless Sensors for Balance Assessment in Neurological Disorders. Sensors 2020, 20, 3247. [Google Scholar] [CrossRef] [PubMed]
  15. Popp, W.L.; Schneider, S.; Bär, J.; Bösch, P.; Spengler, C.M.; Gassert, R.; Curt, A. Wearable Sensors in Ambulatory Individuals With a Spinal Cord Injury: From Energy Expenditure Estimation to Activity Recommendations. Front. Neurol. 2019, 10, 1092. [Google Scholar] [CrossRef] [PubMed] [Green Version]
  16. Howcroft, J.; Kofman, J.; Lemaire, E.D. Prospective Fall-Risk Prediction Models for Older Adults Based on Wearable Sensors. IEEE Trans. Neural Syst. Rehabil. Eng. 2017, 25, 1812–1820. [Google Scholar] [CrossRef] [PubMed]
  17. Errico, V.; Ricci, M.; Pallotti, A.; Giannini, F.; Saggio, G. Ambient assisted living for tetraplegic people by means of an electronic system based on a novel sensory headwear: Increased possibilities for reduced abilities. In Proceedings of the 2018 IEEE International Symposium on Medical Measurements and Applications (MeMeA), Rome, Italy, 11–13 June 2018; pp. 1–6. [Google Scholar] [CrossRef]
  18. Reeder, B.; Chung, J.; Stevens-Lapsley, J. Current Telerehabilitation Research with Older Adults at Home: An Integrative Review. J. Gerontol. Nurs. 2016, 42, 15–20. [Google Scholar] [CrossRef] [PubMed]
  19. Leoni, A.; Ulisse, I.; Pantoli, L.; Errico, V.; Ricci, M.; Orengo, G.; Giannini, F.; Saggio, G. Energy Harvesting Optimization for Built-in Power Replacement of Electronic Multisensory Architecture. AEU Int. J. Electron. Commun. 2019, 107, 170–176. [Google Scholar] [CrossRef]
  20. Saggio, G.; Cavallo, P.; Ricci, M.; Errico, V.; Zea, J.; Benalcázar, M.E. Sign Language Recognition Using Wearable Electronics: Implementing k-Nearest Neighbors with Dynamic Time Warping and Convolutional Neural Network Algorithms. Sensors 2020, 20, 3879. [Google Scholar] [CrossRef]
  21. Miozzi, C.; Errico, V.; Saggio, G.; Gruppioni, E.; Marrocco, G. UHF RFID-Based EMG for Prosthetic Control: Preliminary Results. In Proceedings of the 2019 IEEE International Conference on RFID Technology and Applications (RFID-TA), Pisa, Italy, 25–27 September 2019; pp. 310–313. [Google Scholar]
  22. Muñoz, B.; Valderrama, J.; Orozco, J.; Castaño, Y.; Montilla, L.; Rincon, D.; Navarro, A. Smart Tracking and Wearables: Techniques in Gait Analysis and Movement in Pathological Aging. Smart Healthc. 2019. [Google Scholar] [CrossRef] [Green Version]
  23. Chapron, K.; Plantevin, V.; Thullier, F.; Bouchard, K.; Duchesne, E.; Gaboury, S. A More Efficient Transportable and Scalable System for Real-Time Activities and Exercises Recognition. Sensors 2018, 18, 268. [Google Scholar] [CrossRef] [Green Version]
  24. Storm, F.A.; Cesareo, A.; Reni, G.; Biffi, E. Wearable Inertial Sensors to Assess Gait during the 6-Minute Walk Test: A Systematic Review. Sensors 2020, 20, 2660. [Google Scholar] [CrossRef]
  25. Naro, A.; Portaro, S.; Milardi, D.; Billeri, L.; Leo, A.; Militi, D.; Bramanti, P.; Calabrò, R.S. Paving the Way for a Better Understanding of the Pathophysiology of Gait Impairment in Myotonic Dystrophy: A Pilot Study Focusing on Muscle Networks. J. Neuroeng. Rehabil. 2019, 16, 116. [Google Scholar] [CrossRef]
  26. Jimenez-Moreno, A.C.; Charman, S.J.; Nikolenko, N.; Larweh, M.; Turner, C.; Gorman, G.; Lochmüller, H.; Catt, M. Analyzing Walking Speeds with Ankle and Wrist Worn Accelerometers in a Cohort with Myotonic Dystrophy. Disabil. Rehabil. 2019, 41, 2972–2978. [Google Scholar] [CrossRef] [Green Version]
  27. Saggio, G.; Tombolini, F.; Ruggiero, A. Technology-Based Complex Motor Tasks Assessment: A 6-DOF Inertial-Based System Versus a Gold-Standard Optoelectronic-Based One. IEEE Sens. J. 2021, 21, 1616–1624. [Google Scholar] [CrossRef]
  28. Das, K.D.; Saji, A.J.; Kumar, C.S. Frequency Analysis of Gait Signals for Detection of Neurodegenerative Diseases. In Proceedings of the 2017 International Conference on Circuit, Power and Computing Technologies (ICCPCT), Kollam, India, 20–21 April 2017; pp. 1–6. [Google Scholar]
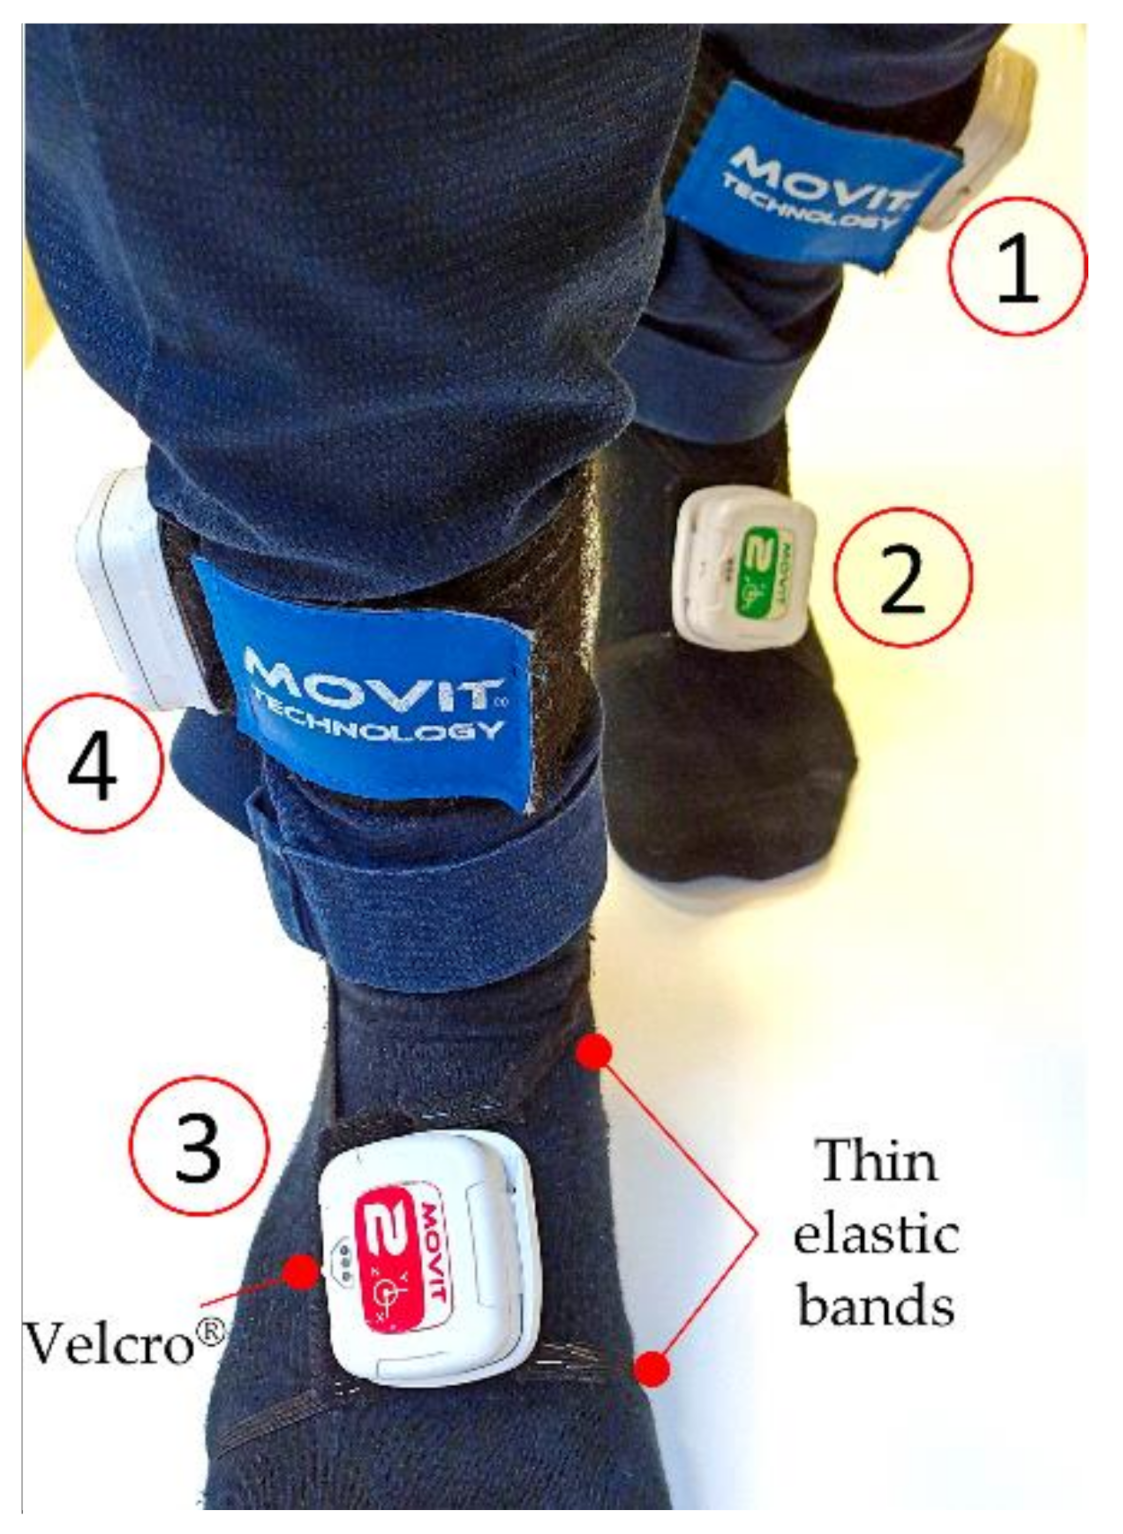
Figure 1. IMUs are placed, by means of Velcro strips, on both insteps (#2, #3) and on both shins (#1, #4).
Electronics 10 00708 g001
Figure 2. Fit curve divided into Plantarflexion Area (left of the solid vertical line) and Dorsiflexion Area (right of the solid vertical line).
Electronics 10 00708 g002
Figure 3. Logic gates decision branch for the single test.
Electronics 10 00708 g003
Figure 4. Four SI values enter a squared norm algorithm to determine an overall “SI-Norm2” severity index.
Electronics 10 00708 g004
Figure 5. Normalized fit functions for the left ankle angles distribution (normal speed walking) for control subjects (a) and patients (b).
Electronics 10 00708 g005
Figure 6. Normalized power spectral density curves of the left ankle (normal speed walking) for control subjects (a) and patients (b).
Electronics 10 00708 g006
Figure 7. SI-Norm2 classification of all tested subjects. The dashed black line SI-Norm2 = 4 separates the controls (squares) from the patients (diamonds and triangles).
Electronics 10 00708 g007
Table 1. SI-1 and SI-2 combinations for severity estimation.
SI-1SI-2SISeverity Grade
000Regular
101Mild
112Severe
01XImpossible
Table 2. AR values.
Table 2. AR values.
#CS_1LCS_1RFP_2LFP_2RCS_3LCS_3RFP_4LFP_4R
CONTROLS10.6730.7770.5940.6720.3750.7490.9570.715
20.5820.7710.2510.2680.7200.5780.5060.420
30.8670.8200.8660.8730.7610.7970.7600.750
40.8800.8380.8590.4920.5060.6500.9760.632
50.8321.0210.6890.6270.5580.5680.8630.408
60.9980.9110.6480.5990.8810.6730.5640.515
71.5420.2401.4860.7340.5961.1820.4711.055
81.4151.7810.7270.8870.7641.6831.1620.791
91.1891.1741.0151.3851.0860.7320.7740.946
101.4950.9081.3660.6831.2261.0901.7121.076
111.3351.5491.1811.9861.5700.6881.0922.118
PATIENTS120.4680.8600.6340.5040.4301.7390.6160.794
130.4190.3929.6810.7710.9610.6800.8020.570
141.4231.94112.0281.9191.3582.0251.6982.105
151.0481.9050.2201.5111.8860.5911.4870.473
160.4561.8340.6981.3740.4650.6050.4041.911
172.2464.1540.9151.3332.4320.5260.2311.189
181.4880.9481.6901.5231.9701.1731.6311.843
191.8874.5320.8130.8210.5890.7130.6730.660
201.7362.1382.1002.8642.7521.9862.1412.459
211.1441.6210.6361.5550.8041.9000.6361.545
221.9922.1701.5381.9241.7382.1881.0711.697
231.0251.0000.9060.8553.1173.1921.4610.796
240.9390.8370.6170.6200.4582.2610.4640.494
Table 3. PR values.
Table 3. PR values.
#CS_1LCS_1RFP_2LFP_2RCS_3LCS_3RFP_4LFP_4R
CONTROLS10.3810.5000.9021.2420.1880.4490.1400.818
20.2030.2390.2070.4160.3480.3570.4070.345
30.5210.4330.5860.6150.5590.4620.7610.572
40.7750.6400.8990.6880.8130.6580.8830.596
50.8120.8710.6820.7410.6050.4120.5400.447
60.9210.8600.7640.8170.7411.0890.6721.090
70.6220.7880.8640.8870.9080.9620.8371.063
80.4780.6130.6030.5600.4900.5890.8360.940
90.4720.6420.6790.7310.6640.5470.3150.192
100.3430.1710.3650.1650.3100.3880.3730.423
110.6020.8252.0710.5580.6850.6910.8470.638
PATIENTS121.0221.3881.1801.0771.0511.3221.2161.149
131.9711.4461.9281.2491.8271.4712.5121.476
141.2272.9450.9761.8741.3792.6950.9171.637
151.8801.0971.4491.0591.9060.6831.7640.673
161.1151.9711.1451.6790.9842.0171.0301.772
171.9871.6120.6351.2912.0082.3392.1322.079
181.8531.2401.5361.2961.4612.6411.3972.706
190.7750.2610.3650.1540.6670.4740.6020.318
203.1422.5063.1912.5502.5351.9452.9591.882
211.6241.7381.8861.9041.5821.7191.8871.905
221.8512.0711.3422.2232.8644.5601.2881.757
237.6228.9776.6929.2462.9072.6402.6482.939
242.1111.1671.8281.1251.5841.2201.4571.288
Table 4. Si-Norm2 results for the 11 controls and the 13 patients analyzed.
SUBJECT #AGEGENDERMIRSSI-Norm2
Controls162M-1
259F-0
348F-0
441M-0
528M-1
630M-0
746F-4
846F-3
929F-4
1046F-4
1128F-4
Patients1248M37
1347F37
1453F310
1555M310
1638F312
1738F316
1855M316
1952F32
2052M416
2157M416
2233M416
2353M413
2422F47
Publisher’s Note: MDPI stays neutral with regard to jurisdictional claims in published maps and institutional affiliations.