
Recognition of Eye-Written Characters with Limited Number of Training Data Based on a Siamese Network

Department of Computer Engineering, Pukyong National University, Busan 48513, Korea
*
Author to whom correspondence should be addressed.
Electronics 2021, 10(23), 3009; https://doi.org/10.3390/electronics10233009
Submission received: 15 November 2021
/
Revised: 26 November 2021
/
Accepted: 30 November 2021
/
Published: 2 December 2021
(This article belongs to the Collection Image and Video Analysis and Understanding)
Abstract
:Developing a hum–computer interface (HCI) is essential, especially for those that have spinal cord injuries or paralysis, because of the difficulties associated with the application of conventional devices and systems. Eye-writing is an HCI that uses eye movements for writing characters such that the gaze movements form letters. In addition, it is a promising HCI because it can be utilized even when voices and hands are inaccessible. However, eye-writing HCI has low accuracy and encounters difficulties in obtaining data. This study proposes a method for recognizing eye-written characters accurately and with limited data. The proposed method is constructed using a Siamese network, an attention mechanism, and an ensemble algorithm. In the experiment, the proposed method successfully classified the eye-written characters (Arabic numbers) with high accuracy (92.78%) when the ratio of training to test data was 2:1. In addition, the method was tested as the ratio changed, and 80.80% accuracy was achieved when the number of training data was solely one-tenth of the test data.
1. Introduction
According to a report from the National Spinal Cord Injury Statistical Center in 2021, 290,000 patients are physically paralyzed owing to acquired spinal cord damage or degenerative neurological diseases such as amyotrophic lateral sclerosis (ALS) in the United States [1]. There have been several studies on applications to aid the communication of paralyzed patients using bio-signals by developing human–computer interaction (HCI) tools.
Among various bio-signals, electrooculograms have garnered the attention of researchers because eye movements are one of the few communication methods for ALS patients at the later stages. Muscular controllability decreases as the degree of the disease becomes severe; however, the muscles related to eye movements operate even in the later stages of ALS. Utilizing gaze movements is a common communication method for patients with ALS [2]. The common way to track eye movements is to utilize camera and image recognition techniques. However, recently, electrooculogram (EOG) devices have been studied for tracking gaze movements. The advantages of EOG-based eye-tracking are the low cost of the devices and the ease of use because they can detect eye movements even in closed-eye states.
The main challenge in utilizing EOG-based eye-tracking devices is the instability of the EOG because the signals are often contaminated with noise and artifacts [3]. EOG-based gaze recognition has been widely used to estimate the directions of instantaneous eye movements. Controlling wheelchairs [4,5] or game interfaces [6,7] in two to four directions are the main applications of EOG-based eye-tracking; in addition, keyboard-typing systems have been developed using four- to eight-directional eye movements [8,9].
In 2007, Tsai et al. demonstrated that EOG signals can be utilized to directly write letters by moving the gaze in a letter form [10]. Heuristic features were derived from directional changes in the EOG signals to recognize 10 Arabic numerals and four mathematical symbols. The results indicated that 75.5% believability and 72.1% dependability were achieved.
Lee et al. proposed a method to recognize eye-written English alphabets of 26 patterns using dynamic time warping (DTW) to obtain 87.38% accuracy [11]. Fang et al. recognized 12 basic patterns of eye-written Japanese katakana, achieving 86.5% accuracy by utilizing a neural network and a hidden Markov model [12]. Chang et al. achieved the highest accuracy of 95.93% in recognizing eye-written letters by combining a support vector machine (SVM) and dynamic positional warping [13].
One of the major issues in recognizing eye-written characters is the instability of EOG signals [3]. EOG is often contaminated with crosstalk, drift, and other artifacts related to body status and movements, which cause the misrecognition of eye-written patterns. There are some methods for removing noise and artifacts from EOG, including band-pass and median filters, along with wavelet transforms to extract saccades [11,12,13,14,15,16]. However, it is very difficult to extract eye-movement signals accurately because they can be easily hidden in the artifacts over a short distance. Moreover, the recognition accuracy can be reduced if the EOG signals are distorted when noise is removed.
Over the past decade, the application of deep neural networks (DNNs) has become a popular approach to manage these preprocessing issues [17]. The raw data are used directly after the minimum data processing, and noise is expected to be removed or ignored with convolutions. One of the limitations of DNNs is that they require numerous data to correctly recognize complicated signals. For example, a DNN achieved 98.8% of the top-5 image classification accuracy; however, it should be noted that there were 14 million images in the dataset [18,19]. Obtaining a large dataset is unfeasible in several cases, especially when the data should be measured by human participants, such as eye-written characters. Measuring EOG signals from many participants is often difficult because of research budgets, participants’ conditions, or privacy issues.
This study presents a method to utilize a Siamese network structure [20,21] to address the limitation of the small dataset. The Siamese network was developed to recognize images by comparing the two signals. The network does not learn to classify but is trained to recognize whether the two given images are in the same group. A classification problem for multiple groups is simplified into a binary classification with the Siamese network. Because the simpler network requires less data for training, it is suitable for the problems with a limited number of training data.
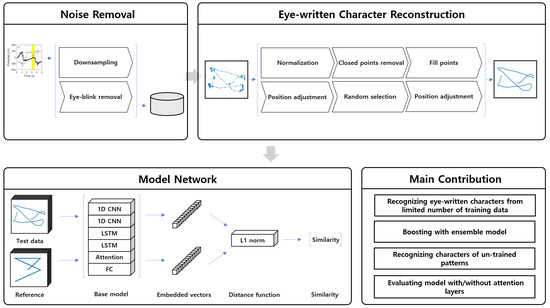
The main contribution of this paper is that a methodology was proposed to recognize the eye-written characters to overcome the data size issue. A neural network structure was proposed by employing the concept of the Siamese network, and a boasting methodology was suggested to be utilized to enhance the performance of the network. The proposed method was validated as reducing the number of the training data.
This paper is organized as follows: Section 2 presents the methodology to preprocess and classify eye-written characters; Section 3 shows the experimental results to evaluate the proposed method in different perspectives; and Section 4 summarizes the current study and indicates the further research issues.
2. Methodology
2.1. Dataset
A public EOG dataset of eye-written characters was utilized [13]. Presumably, this dataset is the sole public dataset of eye-written characters. The dataset comprises eye-written Arabic numbers from 0–9, written by 18 participants. The shapes of the Arabic numbers were designed for ease of writing (refer to Figure 1). Each participant wrote the numbers three times each, such that the dataset comprised 540 characters in total.
Figure 2 illustrates a sample set of the eye-written characters. The written characters have a form similar to that of the pattern designs; however, they are often distorted because of noise and artifacts.
2.2. Pre-Processing
Four pre-processing steps—downsampling, eye-blink removal, normalization, and data resampling—were conducted as the minimum processes to utilize the data for deep neural networks.
In the pre-processing steps, eye blinks in the signals were removed using the maximum summation of the first derivative within a window (MSDW) [22] after signal down-sampling to 64 Hz. The ranges of the eye-blink region () were determined using the following equation:
where represents the MSDW filter output that emphasizes eye blink signals, and and are the time points of the ith local maximum and minimum, respectively [22]. The detected regions were removed and interpolated using the beginning and end points of each range.
After the eye blink removal, the characters were normalized to have x–y coordinate values between −1 and 1. The characters were translated for the starting point to be the coordinate origin (0,0), and divided by the length from the starting to the farthest points. Each character exists within a circle with a radius of 1, and the aspect ratio is reserved in the normalization process.
The normalized signals were resampled for each point to be placed uniformly in the Euclidian space. The resampling procedure comprised five steps (refer to Figure 3).
The first step of the resampling procedure is to remove the data points placed near the others because gaze is often fixed on a certain position when eye-writing (e.g., refer to Figure 2). In this step, all the points of a character are divided into segments, and each segment has points. The points in a group are substituted by its central points if the standard deviation of the points () is smaller than a threshold. The threshold is denoted as , where is the mean of the s in the character, and is a constant determined experimentally. The second step of data resampling is to fill points between consecutive points by over-sampling. The distance between each pair of two consecutive points is calculated, and the number of points to be inserted for the pair () is defined as follows:
where is the distance between the ith point and the next and is the minimum distance between consecutive points in a character. The segment is filled with points using linear interpolation. The third step of data resampling is to adjust the point positions to have the same distances between all consecutive points in a character. The mean distance was set as the standard distance (), and the positions of each point were adjusted using linear interpolation to have a distance of from the consecutive points. The fourth step is to ensure that the number of points in each character is the same for further use in deep convolutional neural networks. Points were randomly selected and removed to have the same number of points as the standard number of points (). Random selection does not distort the original shapes of characters because there are a sufficient number of points in a character throughout the preceding steps. In the experiments, was set to 190 to preserve the shape of the original characters while minimizing the number of points. The positions of the points were adjusted again after the fourth step to keep the same distance between consecutive points. An example of the data resampling procedure is illustrated in Figure 4 and Figure 5.
2.3. Reference Data
The Siamese network is a process of determining whether two input data are in the same group by checking their similarity. Koch et al. presented a method of utilizing a Siamese network for classification challenges by selecting training data randomly [20]; however, we observed that it is not suitable for the eye-written characters due to the noise and shape variations among different people.
In this study, reference data for the standard form for each class were generated and utilized. Reference data were generated with the same number of points as the actual data in the dataset using the original pattern design of Arabic numbers (Figure 1). The shape of the reference dataset is the same as the shapes in Figure 1.
2.4. Network Architecture
The basic network structure of the proposed method follows the Siamese network in [20]. The Siamese network was published for image classification issues as a similarity metric [21,23], and a one-shot classification method was proposed by comparing the input data to a set of random data from the dataset [20,24]. The Siamese network has two base models that have the same network structure and sharing weights. The two models generate feature vectors from the input data, and the distance between vectors is measured by applying a distance function (L1 norm, L2 norm, etc.).
The network, illustrated in Figure 6, receives inputs from two data sequences, where one is a target and the other is comparative data. The outputs of the base model are two vectors which are the encoded features of each input vectors. L1 distance is calculated as follows:
where is the ith value of the output vector from the target input, is the ith value of the output vector from the comparative input, and is the size of each output vector. The output of a whole network () is derived by applying the sigmoid function to L1 distance as follows:
where the sigmoid function () is as follows:
The network is trained to minimize the distance if the input data belong to the same class and to maximize the distance if they are in different classes. Siamese networks can learn to compare input data even with a limited number of data for each class [25].
In this study, the base model for the Siamese network for EOG signals was designed using two convolutional and two long short-term memory (LSTM) layers connected sequentially, where batch normalization and dropout layers were attached to avoid overfitting. We also utilized a hierarchical attention mechanism [26,27] to the output of the LSTM layer for enabling the network to focus on more important parts of the signals. The attention mechanism is utilized for the network to focus on specific source or features from input data [28]. Figure 7 and Figure 8 illustrate the structure of the proposed base model.
With the proposed base model, the Siamese network receives two input data as a factor. Each input is passed through the base model to obtain a pair of embedding vectors. The similarity is obtained by applying a sigmoid function to the distance between the two vectors. The distance is calculated using the L1 distance layer.
2.5. Train and Test Batch
The Siamese network compares two input data and determines whether they belong to the same group (matched) or in different groups (unmatched). The network was trained or tested batch by batch, with a batch comprising 40 characters (Figure 9). A batch is a set of pairs of eye-written characters. Half of the batches were matched pairs, and the others were unmatched pairs. The target values of the batch were a vector with a length of 20. The first half of the vectors had a value of 0, and the left half had a value of 1. The network learnt to estimate the similarity between data pairs.
A data pair comprises two characters, one in the target batch and the other in the comparative batch. The data of the target batch for the matched pairs were selected from the training data sequentially, and the pairs of the selected data were the reference (Figure 9a,b) of each target data or the data selected randomly within the same class (Figure 9c). The data of the unmatched pairs were selected randomly while ignoring the class information because the combinations of the unmatched pairs were significantly more than the combinations of the matched pairs.
This study proposed three options to generate a comparative batch for training, as illustrated in Figure 9. Figure 9a illustrates the use of reference data solely for the comparative batch. The data of the matched pairs were fixed, and that of the unmatched pairs were randomly selected. The second option is to utilize eye-written characters for the unmatched pairs to avoid overfitting (Figure 9b). The third option is to utilize the eye-written characters for both unmatched and matched pairs (Figure 9c). We assumed that using a limited amount of data for the comparative batch could cause overfitting issues.
The training procedure is described in Algorithm 1. The network model was trained by switching the comparative batches of Figure 9. The reference data (or mix of reference and eye-written characters) were used as the comparative batch when the epoch number was odd (see Figure 9a,b), and a selection of the eye-written characters were used as the comparative batch when the epoch number was even (see Figure 9c). Target batches were selected randomly from training datasets. One half of a target batch is the unmatched pairs and the other is the matched pairs (see the target batches in Figure 9). After the selection of the target and comparative batches, the network was trained with the batches. This process was repeated for each epoch.
| Algorithm 1. Training procedure (Before) |
 |
The data batch used for the test is illustrated in Figure 10. There are 10 eye-written characters, which are the copies of a single character, and 10 reference data, which are the representatives of each class. After calculating the similarities between each data pair with the trained network, it is expected that the similarity of the matched reference will be higher than that of the other references.
2.6. Ensemble Method
An ensemble method was employed to stabilize the network training procedure because the performance of the trained model varies according to the initial weights of the network and the data selections and orders in the training phases. We trained a network model times and calculated the mean of the outputs for each data pair at the test phase to obtain the final similarities. The final output vector is defined as follows:
where is the input vector, is the output vector of the ith trained model, and is the number of trained models.
3. Results
3.1. Ratio of Training and Test Data
The performance of the proposed method was evaluated by altering the ratio of the training data to the test dataset. This experiment was conducted with five different cases, varying the ratio from 1:10 to 2:1 (Table 1). The data were selected randomly when separating the training and test data, while the data for each class were the same. Please note that there are solely five eye-written characters for each class in Case 1.
3.2. Accuracy According to the Type of Comparative Batch
An experiment was conducted by altering the training–test ratio and the type of comparative batch. The experiment was repeated 10 times to verify the stability of the method.
First, reference data were utilized solely for the comparative batch. The results are presented in Table 2. Case 5, in which the number of training data was the largest, achieved the highest mean accuracy of 90.79%. The accuracy dropped as the number of training data was decreased, but the mean accuracy remained over 80%, even when solely 50 data points were provided to train the network. Notably, the learning stability dropped suddenly when the number of training data decreased from 90 to 50 (the standard deviations of the first case were three times larger than the second case).
Table 3 presents the results when both the reference and the eye-written characters were used together for the comparative batch. There were no significant differences between the two experiments. The accuracies with both types of characters were slightly higher than the accuracies with the reference data when the size of the training data was larger than that of the test data (Case 5). Based on the results of this section, all subsequent experiments utilized the reference data together with the eye-written characters for the comparative batch.
3.3. Evaluation of Attention Mechanism
An experiment was conducted to determine the importance of the attention mechanism. Table 4 lists the accuracies when the attention layer is removed from the network. The highest accuracy of Case 5 was 86.11%, with the average being limited to 71.11%. As illustrated in Figure 11, the difference between the two groups was significant for all the cases of the train–test ratio. This result indicates that the attention mechanism is an important factor in the performance of the proposed method.
3.4. Ensemble Method
It has been reported that an ensemble model comprising weak learners improves recognition accuracy and stabilizes performance. We trained the five models of weak learners with the same training set and obtained the average output as the final similarities.
In our experiment, the accuracy became stable with the ensemble method as the minimum accuracy was 91.67%, while the minimum accuracy for each learner was 88.89%. When we repeated the experiment five times, the accuracies were increased for all trials as compared with the mean accuracies of the weak learners (Table 5). A training–test ratio of 2:1 was used in this experiment.
Table 6 compares the accuracies of the proposed method with other methods. The mean accuracy of the proposed method was 92.78%, which is the 6th grade among the 11 methods. The primary contribution of the proposed method is that it achieved high accuracy with an extremely limited number of training data. The accuracy of the proposed method was 2.98% lower than the best accuracy in [13]; however, the number of training data was solely 11.7% of the previous method.
3.5. Recognition of Non-Trained Patterns
Because the Siamese network is a model that measures the similarity between two input data, it can be utilized to calculate the similarities of untrained patterns. To verify our hypothesis, we designed an experiment in which data from nine classes were used for training, and the other class was used for testing. We trained the network with the eye-written characters of the Arabic numbers from 0–8 and tested it with the characters of number 9. A training-test ratio of 2:1 was applied in this experiment, and an ensemble model was applied to enhance the accuracy. The experiments were repeatesd 10 times to check the stability.
The mean accuracy of the non-trained pattern was 51.53%, as presented in Table 7. Classification accuracy varied according to the trials. The worst accuracy was 26.42%, which is better than the coincidence; however, the accuracy is quite low when all the patterns were utilized for training. The best accuracy was 77.53%, which is close to the accuracy of Case 1 when all patterns were used. This result implies the possibility of minimizing the number of training patterns when new patterns are added to a pre-trained model.
4. Conclusions and Outlooks
This study proposed a method with a Siamese network and an attention mechanism to classify eye-written characters with a limited set of training data. The proposed method achieved 92.78% accuracy with a train–test ratio limited to 2:1. This is an impressive achievement because previous studies used 90–94.4% of data for training and tested with the rest. It was indicated that the recognition accuracy of the proposed method remained approximately 80% even when the proposed model was trained with 50 data and tested with 490 data. Moreover, this study showed the possibility of classifying an untrained pattern by utilizing the Siamese network.
One of the limitations of this study is that a single dataset of Arabic numbers was utilized to validate the proposed method. Although this is the only public database to the best of our knowledge, this issue should be treated in a future study by collaborating with other research groups.
Another limitation of this study is that the study was conducted in a writer-dependent manner, which does not guarantee the performance when a new user’s data is included to test. Although it is assumed that the proposed method may achieve high performance in writer-independent validation because the training–test ratio was lowered to 1:10, experimental results will be required to prove this assumption.
In future studies, the validity of the proposed method using other time-series signals such as online handwritten characters, electrocardiograms, and electromyograms requires further research. In addition, this study can be extended by calculating the similarities for untrained patterns. The performance of the Siamese network is believed to be improved as the variations of the training patterns increase because it learns to calculate the difference between two images in various classes. We are planning to study the accuracy changes according to the number of classes and training patterns in the recent future.
Author Contributions
Conceptualization, D.-H.K. and W.-D.C.; methodology, D.-H.K.; software, D.-H.K.; validation, D.-H.K. and W.-D.C.; formal analysis, D.-H.K. and W.-D.C.; investigation, D.-H.K. and W.-D.C.; writing—original draft preparation, D.-H.K.; writing—review and editing, W.-D.C.; visualization, D.-H.K.; supervision, W.-D.C.; project administration, W.-D.C.; funding acquisition, W.-D.C. All authors have read and agreed to the published version of the manuscript.
Funding
This work was supported by a grant from the Basic Science Research Program through the National Research Foundation of Korea (NRF) funded by the Ministry of Education (NRF-2020R1F1A1077162).
Data Availability Statement
[dataset] Won-Du Chang; Ho-Seung Cha; Do Yeon Kim; Seung Hyun Kim; Chan-Hwang Im. 2016. Eye-written Characters of Arabic Numbers; https://github.com/EyeWriting/EyewritingNumber (accessed on 1 June 2021).
Conflicts of Interest
The authors declare no conflict of interest.
References
- Spinal Cord Injury Facts and Figures at a Glance. Available online: https://www.nscisc.uab.edu/Public/Facts%20and%20Figures%20-%202021.pdf (accessed on 3 July 2021).
- Beukelman, D.; Fager, S.; Nordness, A. Communication support for people with ALS. Neurol. Res. Int. 2011, 2011, 714693. [Google Scholar] [CrossRef] [PubMed] [Green Version]
- Chang, W.-D. Electrooculograms for human-computer interaction: A review. Sensors 2019, 19, 2690. [Google Scholar] [CrossRef] [PubMed] [Green Version]
- Barea, R.; Boquete, L.; Mazo, M.; López, E. Wheelchair guidance strategies using EOG. J. Intell. Robot. Syst. Theory Appl. 2002, 34, 279–299. [Google Scholar] [CrossRef]
- Huang, Q.; He, S.; Wang, Q.; Gu, Z.; Peng, N.; Li, K.; Zhang, Y.; Shao, M.; Li, Y. An EOG-based human-machine interface for wheelchair control. IEEE Trans. Biomed. Eng. 2018, 65, 2023–2032. [Google Scholar] [CrossRef] [PubMed]
- Kumar, D.; Sharma, A. Electrooculogram-based virtual reality game control using blink detection and gaze calibration. In Proceedings of the 2016 International Conference on Advances in Computing, Communications and Informatics, Jaipur, India, 21–24 September 2016; pp. 2358–2362. [Google Scholar]
- Lin, C.T.; King, J.T.; Bharadwaj, P.; Chen, C.H.; Gupta, A.; Ding, W.; Prasad, M. EOG-Based Eye Movement Classification and Application on HCI Baseball Game. IEEE Access 2019, 7, 96166–96176. [Google Scholar] [CrossRef]
- Yamagishi, K.; Hori, J.; Miyakawa, M. Development of EOG-based communication system controlled by eight-directional eye movements. In Proceedings of the 2006 International Conference of the IEEE Engineering in Medicine and Biology Society, New York, NY, USA, 30 August–3 September 2006; pp. 2574–2577. [Google Scholar]
- Xiao, J.; Qu, J.; Li, Y. An electrooculogram-based interaction method and its music-on-demand application in a virtual reality environment. IEEE Access 2019, 7, 22059–22070. [Google Scholar] [CrossRef]
- Tsai, J.-Z.; Lee, C.-K.; Wu, C.-M.; Wu, J.-J.; Kao, K.-P. A feasibility study of an eye-writing system based on electro-oculography. J. Med. Biol. Eng. 2008, 28, 39–46. [Google Scholar]
- Lee, K.-R.; Chang, W.-D.; Kim, S.; Im, C.-H. Real-time “eye-writing” recognition using electrooculogram. IEEE Trans. Neural Syst. Rehabil. Eng. 2017, 25, 37–48. [Google Scholar] [CrossRef] [PubMed]
- Fang, F.; Shinozaki, T. Electrooculography-based continuous eye-writing recognition system for efficient assistive communication systems. PLoS ONE 2018, 13, e0192684. [Google Scholar] [CrossRef] [PubMed] [Green Version]
- Chang, W.-D.; Cha, H.-S.; Kim, D.Y.; Kim, S.H.; Im, C.-H. Development of an electrooculogram-based eye-computer interface for communication of individuals with amyotrophic lateral sclerosis. J. Neuroeng. Rehabil. 2017, 14, 89. [Google Scholar] [CrossRef] [PubMed] [Green Version]
- Chang, W.-D.; Cha, H.-S.; Im, C.-H. Removing the interdependency between horizontal and vertical eye-movement components in electrooculograms. Sensors 2016, 16, 227. [Google Scholar] [CrossRef] [PubMed] [Green Version]
- Bulling, A.; Roggen, D.; Tröster, G. Wearable EOG goggles: Seamless sensing and context-awareness in everyday environments. J. Ambient Intell. Smart Environ. 2009, 1, 157–171. [Google Scholar] [CrossRef] [Green Version]
- Barbara, N.; Camilleri, T.A. Interfacing with a speller using EOG glasses. In Proceedings of the 2016 IEEE International Conference on Systems, Man, and Cybernetics, Budapest, Hungary, 9–12 October 2016; pp. 1069–1074. [Google Scholar]
- Torres, J.F.; Hadjout, D.; Sebaa, A.; Martínez-Álvarez, F.; Troncoso, A. Deep Learning for Time Series Forecasting: A Survey. Big Data 2021, 9, 3–21. [Google Scholar] [CrossRef] [PubMed]
- Pham, H.; Dai, Z.; Xie, Q.; Luong, M.-T.; Le, Q.V. Meta Pseudo Labels. In Proceedings of the Conference on Computer Vision and Pattern Recognition 2021, Virtual Conference, 19–25 June, 2021; pp. 11557–11568. [Google Scholar]
- Russakovsky, O.; Deng, J.; Su, H.; Krause, J.; Satheesh, S.; Ma, S.; Huang, Z.; Karpathy, A.; Khosla, A.; Bernstein, M.; et al. ImageNet Large Scale Visual Recognition Challenge. Int. J. Comput. Vis. 2015, 115, 211–252. [Google Scholar] [CrossRef] [Green Version]
- Koch, G.; Zemel, R.; Salakhutdinov, R. Siamese Neural Networks for One-shot Image Recognition. In Proceedings of the International Conference on Machine Learning 2015, Lille, France, 6–11 July 2015. [Google Scholar]
- Chopra, S.; Hadsell, R.; Lecun, Y. Learning a Similarity Metric Discriminatively, with Application to Face Verification. In Proceedings of the Conference on Computer Vision and Pattern Recognition 2005, Sandiego, CA, USA, 20–26 June 2005; pp. 1–8. [Google Scholar]
- Chang, W.-D.; Cha, H.-S.; Kim, K.; Im, C.-H. Detection of eye blink artifacts from single prefrontal channel electroencephalogram. Comput. Methods Programs Biomed. 2016, 124, 19–30. [Google Scholar] [CrossRef] [PubMed]
- Liu, X.; Tang, X.; Chen, S. Learning a Similarity Metric Discriminatively with Application to Ancient Character Recognition; Springer International Publishing: New York, NY, USA, 2021; Volume 12815, ISBN 9783030821357. [Google Scholar]
- Vinyals, O.; Blundell, C.; Lillicrap, T.; Kavukcuoglu, K.; Wierstra, D. Matching networks for one shot learning. Processings of the 30th Conference on Neural Information Processing Systems, Barcelona, Spain, 5–10 December 2016; pp. 3637–3645. Available online: https://papers.nips.cc/paper/2016/file/90e1357833654983612fb05e3ec9148c-Paper.pdf (accessed on 25 November 2021).
- Lake, B.M.; Salakhutdinov, R.; Gross, J.; Tenenbaum, J.B. One shot learning of simple visual concepts. In Proceedings of the The 33rd Annual Conference of the Cognitive Science Society, Boston, MA, USA, 20–23 July 2011; pp. 2568–2573. [Google Scholar]
- Yang, Z.; Yang, D.; Dyer, C.; He, X.; Smola, A.; Hovy, E. Hierarchical attention networks for document classification. In Proceedings of the Proceedings of the 2016 Conference of the North American Chapter of the Association for Computational Linguistics: Human Language Technologies, San Diego, CA, USA, 12–17 June 2016; pp. 1480–1489. [Google Scholar]
- Vaswani, A.; Shazeer, N.; Parmar, N.; Uszkoreit, J.; Jones, L.; Gomez, A.N.; Kaiser, L.; Polosukhin, I. Attention Is All You Need. In Proceedings of the The 31st Conference on Neural Information Processing Systems, Long Beach, CA, USA, 4–9 December 2017; pp. 1–11. [Google Scholar]
- Liu, S.; Lin, T.; He, D.; Li, F.; Wang, M.; Li, X.; Sun, Z.; Li, Q.; Ding, E. AdaAttN: Revisit Attention Mechanism in Arbitrary Neural Style Transfer. In Proceedings of the International Conference on Computer Vision, Virtual Conference, 19–25 June 2021; pp. 6649–6658. [Google Scholar]
- Jang, S.; Lee, J.; Jang, J.; Chang, W. Gaze Tracking with Low-cost EOG Measuring Device. J. Korea Converg. Soc. 2018, 9, 53–60. [Google Scholar]
- Chang, W.; Choi, J.; Shin, J. Recognition of Eye-Written Characters Using Deep Neural Network. Appl. Sci. 2021, 11, 11036. [Google Scholar] [CrossRef]
Figure 1.
Pattern designs of Arabic numbers [13]. The red dots denote the starting points.
Figure 1.
Pattern designs of Arabic numbers [13]. The red dots denote the starting points.

Figure 2.
Eye-written characters [13].
Figure 2.
Eye-written characters [13].

Figure 3.
Flow of data resampling after normalization.

Figure 4.
Changes of a signal throughout the resampling procedure.

Figure 5.
Magnified view for detail.

Figure 6.
Siamese network structure. The input data of the network is a pair of two eye-written characters: one is a target data to recognize and the other is a comparative character. The base model consists of two networks that share a network structure and weights. The outputs of the base model are two feature vectors from the two input characters. The output of the whole network is calculated by employing L1 distance and sigmoid functions with the feature vectors.

Figure 7.
Network structure of base model. It consists of two convolutional blocks, two LSTM blocks, and a fully connected network. A convolutional block consists of a convolutional layer, a batch normalization layer, and a dropout layer, and an LSTM layer consists of a batch normalization layer and a dropout layer. An attention layer is inserted into the second LSTM layer to improve the network performance. The network parameters are as described in the figures.

Figure 8.
Structure of hierarchical attention network [26]. The attentions were implemented twice consequently. The first attention is implemented with a fully connected layer and a lambda function, and the second attention was implemented with the input vector and the output of the first attention. The output of the second attention was concatenated with the output of the lambda function, which becomes the input of the fully connected layer to generate the output of the attention network.

Figure 9.
Data batch pairs for training with different conditions for comparative batch. (a) Reference data only, (b) eye-written characters for unmatched pairs, and reference data for the matched pairs, (c) eye-written characters only.
Figure 9.
Data batch pairs for training with different conditions for comparative batch. (a) Reference data only, (b) eye-written characters for unmatched pairs, and reference data for the matched pairs, (c) eye-written characters only.

Figure 10.
Data batches for test.

Figure 11.
Boxplot of the accuracy distribution with and without attention layer.


Table 1.
Train and test data separation with different ratios.
| Case | Train | Test | Train to Test Ratio |
|---|---|---|---|
| Case 1 | 50 | 490 | ≒ 1:10 |
| Case 2 | 90 | 450 | 1:5 |
| Case 3 | 180 | 360 | 1:2 |
| Case 4 | 270 | 270 | 1:1 |
| Case 5 | 360 | 180 | 2:1 |
Table 2.
Recognition accuracy with reference data solely for the comparative batch.
| Case | Trial | Best | Avg. | Std. | |||||||||
|---|---|---|---|---|---|---|---|---|---|---|---|---|---|
| 1st | 2nd | 3rd | 4th | 5th | 6th | 7th | 8th | 9th | 10th | ||||
| Case 1 | 78.78 | 83.67 | 82.04 | 83.67 | 74.29 | 73.67 | 74.08 | 86.53 | 83.47 | 87.76 | 87.76 | 80.80 | 4.99 |
| Case 2 | 85.11 | 83.78 | 84.22 | 87.56 | 86.89 | 85.33 | 82.89 | 86.67 | 85.33 | 82.22 | 87.56 | 85.00 | 1.66 |
| Case 3 | 86.67 | 89.44 | 86.94 | 89.17 | 89.17 | 85.56 | 84.72 | 90.28 | 85.28 | 88.89 | 90.28 | 87.61 | 1.91 |
| Case 4 | 90.00 | 88.89 | 91.11 | 89.63 | 90.00 | 90.00 | 89.26 | 90.74 | 89.63 | 87.41 | 91.11 | 89.67 | 0.97 |
| Case 5 | 88.89 | 93.33 | 89.44 | 90.00 | 89.44 | 92.78 | 88.89 | 90.56 | 91.67 | 92.78 | 93.33 | 90.79 | 1.63 |
Table 3.
Recognition accuracy with reference and eye-written data together for the comparative batch.
Table 3.
Recognition accuracy with reference and eye-written data together for the comparative batch.
| Case | Trial | Best | Avg. | Std. | |||||||||
|---|---|---|---|---|---|---|---|---|---|---|---|---|---|
| 1st | 2nd | 3rd | 4th | 5th | 6th | 7th | 8th | 9th | 10th | ||||
| Case 1 | 82.24 | 76.12 | 82.44 | 78.57 | 81.43 | 76.33 | 80.61 | 77.96 | 78.57 | 81.22 | 82.24 | 79.55 | 2.23 |
| Case 2 | 87.33 | 84.00 | 89.11 | 81.56 | 86.22 | 85.78 | 85.78 | 86.00 | 87.56 | 87.56 | 89.11 | 85.98 | 2.16 |
| Case 3 | 88.05 | 85.00 | 90.56 | 86.94 | 90.56 | 89.72 | 87.50 | 89.72 | 89.72 | 91.11 | 91.11 | 88.89 | 1.85 |
| Case 4 | 89.26 | 83.33 | 92.59 | 91.11 | 87.78 | 86.30 | 90.37 | 92.59 | 92.22 | 90.74 | 92.59 | 89.63 | 2.87 |
| Case 5 | 92.22 | 90.00 | 92.78 | 91.67 | 90.56 | 92.22 | 91.67 | 90.00 | 92.22 | 91.11 | 92.28 | 91.45 | 0.94 |
Table 4.
Recognition accuracy without attention layer.
| Case | Trial | Best | Avg. | Std. | |||||||||
|---|---|---|---|---|---|---|---|---|---|---|---|---|---|
| 1st | 2nd | 3rd | 4th | 5th | 6th | 7th | 8th | 9th | 10th | ||||
| Case 1 | 35.51 | 31.43 | 50.82 | 52.44 | 53.06 | 54.89 | 44.48 | 46.53 | 63.26 | 55.71 | 63.26 | 48.80 | 9.61 |
| Case 2 | 39.55 | 38.22 | 76.88 | 66.00 | 45.33 | 56.88 | 14.66 | 44.66 | 66.66 | 72.22 | 76.88 | 58.10 | 23.27 |
| Case 3 | 58.61 | 83.89 | 40.83 | 83.06 | 38.06 | 84.72 | 70.00 | 77.50 | 73.61 | 49.17 | 84.72 | 67.04 | 19.10 |
| Case 4 | 61.85 | 82.60 | 83.70 | 61.48 | 78.15 | 67.78 | 76.63 | 84.81 | 62.59 | 85.19 | 85.19 | 74.48 | 10.02 |
| Case 5 | 56.67 | 86.11 | 73.88 | 56.11 | 73.88 | 80.56 | 75.55 | 65.00 | 66.11 | 77.22 | 86.11 | 71.11 | 9.90 |
Table 5.
Results of five ensemble models.
| Trial | Weak Learner | Best | Avg. | Std. | Ensemble Acc. | ||||
|---|---|---|---|---|---|---|---|---|---|
| Model A | Model B | Model C | Model D | Model E | |||||
| 1st | 91.11 | 91.67 | 90.56 | 91.67 | 90.00 | 91.67 | 91.00 | 0.72 | 92.22 |
| 2nd | 92.78 | 90.00 | 91.67 | 91.67 | 90.00 | 92.78 | 91.22 | 1.20 | 92.22 |
| 3rd | 90.56 | 88.89 | 91.11 | 91.11 | 93.33 | 93.33 | 91.11 | 1.59 | 93.33 |
| 4th | 90.00 | 90.56 | 90.56 | 88.89 | 87.89 | 90.56 | 89.58 | 1.17 | 91.67 |
| 5th | 92.22 | 92.78 | 95.00 | 88.89 | 91.11 | 95.00 | 92.00 | 2.24 | 94.44 |
| Avg. | 92.78 | ||||||||
Table 6.
Recognition accuracies of eye-written characters with different methods.
| Method | Character Set (Number of Patterns) | Number of Participants | Train to Test Ratio | Accuracies (Metrics) |
|---|---|---|---|---|
| DPW [29] | English alphabets with 3 directional symbols | 19 | 4:1 | 50.47 (accuracy) |
| Heuristic [10] | Arabic numbers, arithmetic symbols (14) | 11 | Rule-based system | 75.5 (believability) |
| DTW [11] | English alphabets (26) | 20 | 4:1 | 87.38% (F1 score) |
| HMM [12] | Japanese katakana (12) | 6 | 9:1 | 86.5% (F1 score) |
| DTW [12] | 77.6% (F1 score) | |||
| DNN-HMM [12] | 93.8 % (accuracy) | |||
| GMM-HMM [12] | 93.5 % (accuracy) | |||
| DTW [13] | Arabic numbers (10) | 18 | 17:1 | 92.41% (accuracy) |
| DPW [13] | 94.07% (accuracy) | |||
| DTW-SVM [13] | 94.08% (accuracy) | |||
| DPW-SVM [13] | 95.74% (accuracy) | |||
| DNN [30] | Arabic numbers (10) | 18 | 17:1 | 97.78 (accuracy) |
| Siamese (proposed) | Arabic numbers (10) | 18 | 2:1 | 92.78% (accuracy) |
Table 7.
Recognition accuracy for non-trained class (trained classes: 0–8, non-trained class: 9).
| Trial | Best | Avg. | Std. | |||||||||
|---|---|---|---|---|---|---|---|---|---|---|---|---|
| 1st | 2nd | 3rd | 4th | 5th | 6th | 7th | 8th | 9th | 10th | |||
| 47.17 | 67.92 | 39.63 | 69.81 | 26.42 | 60.38 | 39.62 | 49.06 | 37.74 | 77.53 | 77.53 | 51.53 | 16.6 |
Publisher’s Note: MDPI stays neutral with regard to jurisdictional claims in published maps and institutional affiliations. |
© 2021 by the authors. Licensee MDPI, Basel, Switzerland. This article is an open access article distributed under the terms and conditions of the Creative Commons Attribution (CC BY) license (https://creativecommons.org/licenses/by/4.0/).
Share and Cite
MDPI and ACS Style
Kang, D.-H.; Chang, W.-D. Recognition of Eye-Written Characters with Limited Number of Training Data Based on a Siamese Network. Electronics 2021, 10, 3009. https://doi.org/10.3390/electronics10233009
AMA Style
Kang D-H, Chang W-D. Recognition of Eye-Written Characters with Limited Number of Training Data Based on a Siamese Network. Electronics. 2021; 10(23):3009. https://doi.org/10.3390/electronics10233009
Chicago/Turabian StyleKang, Dong-Hyun, and Won-Du Chang. 2021. "Recognition of Eye-Written Characters with Limited Number of Training Data Based on a Siamese Network" Electronics 10, no. 23: 3009. https://doi.org/10.3390/electronics10233009
Note that from the first issue of 2016, this journal uses article numbers instead of page numbers. See further details here.