
Cross-Modal Guidance Assisted Hierarchical Learning Based Siamese Network for MR Image Denoising
by
 , and
, and
Rabia Naseem
1,* ,
,
Faouzi Alaya Cheikh
1,
Azeddine Beghdadi
2,
Khan Muhammad
3,* and
and
Muhammad Sajjad
1 1
Department of Computer Science, Norwegian University of Science and Technology, 2815 Gjøvik, Norway
2
L2TI, Institut Galilée, Université Sorbonne Paris Nord, 93430 Villetaneuse, France
3
Visual Analytics for Knowledge Laboratory (VIS2KNOW Lab), School of Convergence, College of Computing and Informatics, Sungkyunkwan University, Seoul 03063, Korea
*
Authors to whom correspondence should be addressed.
Electronics 2021, 10(22), 2855; https://doi.org/10.3390/electronics10222855
Submission received: 16 August 2021
/
Revised: 10 November 2021
/
Accepted: 11 November 2021
/
Published: 19 November 2021
(This article belongs to the Special Issue Machine Learning Technologies for Big Data Analytics)
Abstract
:Cross-modal medical imaging techniques are predominantly being used in the clinical suite. The ensemble learning methods using cross-modal medical imaging adds reliability to several medical image analysis tasks. Motivated by the performance of deep learning in several medical imaging tasks, a deep learning-based denoising method Cross-Modality Guided Denoising Network for removing Rician noise in T1-weighted (T1-w) Magnetic Resonance Images (MRI) is proposed in this paper. uses a guidance image, which is a cross-modal (T2-w) image of better perceptual quality to guide the model in denoising its noisy T1-w counterpart. This cross-modal combination allows the network to exploit complementary information existing in both images and therefore improve the learning capability of the model. The proposed framework consists of two components: Paired Hierarchical Learning (PHL) module and Cross-Modal Assisted Reconstruction (CMAR) module. PHL module uses Siamese network to extract hierarchical features from dual images, which are then combined in a densely connected manner in the CMAR module to finally reconstruct the image. The impact of using registered guidance data is investigated in removing noise as well as retaining structural similarity with the original image. Several experiments were conducted on two publicly available brain imaging datasets available on the IXI database. The quantitative assessment using Peak Signal to noise ratio (PSNR), Structural Similarity Index (SSIM), and Feature Similarity Index (FSIM) demonstrates that the proposed method exhibits 4.7% and 2.3% gain (average), respectively, in SSIM and FSIM values compared to other state-of-the-art denoising methods that do not integrate cross-modal image information in removing various levels of noise.
1. Introduction
Magnetic Resonance Imaging (MRI) is preferred for the structural and functional analysis of several organs in the clinical setting thanks to its non-ionizing nature and ability to highlight structures with high contrast. In particular, MR neuroimaging is widely employed in the screening and diagnosis of brain cancers and neurodegenerative dysfunctions such as Alzheimer’s disease and multiple sclerosis [1]. MRI can highlight tissue with various contrasts using different sequences of Radio-Frequency (RF) pulses. Specific pathologies are accurately analyzed and interpreted when captured using a particular RF pulse sequence. For instance, ‘substantia nigra’, a brain area affected due to Parkinson’s disease can be visualized clearly on T2-w images compared to T1-w [2], whereas, T1-w images are preferred in the quantification of atrophy, an irreversible loss of neurons associated with multiple sclerosis [3]. However, certain pathologies possess uncertain features and assorted topography, whose existence needs to be validated by multiple modalities especially if their surgical resection is essential. A cohort study comprising 200 surgically treated Craniopharyngiomas (CPs), an infiltrative brain tumor concluded that several key radiological variables recognized on both T1-w and T2-w MR images correctly predicted the CP topography in 86% of cases [4].
During MRI acquisition, noise is mainly introduced due to motion of charged particles in the radio frequency coils. This noise affects the reliability of diagnosis and image analysis tasks including feature extraction and segmentation [5,6]. Denoising of the images then becomes indispensable to make them suitable for further analysis. and Y denote the ideal and observed MR images, respectively, and N is the noise contained in the MRI signal. The noisy observation Y of X can be expressed in the case of an additive model as:
The objective of denoising algorithms is to reduce the noise content N in Y to obtain an estimate of the original image X. The noise in MR images follows Rician distribution whose probability density function is expressed as:
In the above equation, represents the 0th order Bessel function, N is a Rician distributed random variable. is the unit step Heaviside step function indicating that the pdf expression is valid for non-negative values of N. X is a non-noisy signal as stated above and is the noise variance. The Rician noise is a signal dependant noise and demonstrates gaussian distribution when Signal-to-Noise Ratio (SNR) is high and rayleigh distribution when SNR is low.
Despite the considerable amount of work devoted to image denoising during the two last decades, it is still a challenging problem particularly in the case of signal-dependant and correlated noise [7,8]. This is the case in medical imaging. Most often simplifying assumptions are made to make the denoising problem more or less tractable. This has led to a variety of denoising methods applied to various imaging modalities. Several denoising approaches have been proposed in the past that can be broadly grouped into two types: conventional methods and deep learning-based approaches. The conventional denoising methods include spatial domain methods such as bilateral filter [9], Non-Local Means filter (NLM) [10] and anisotropic filter [11] to name a few. Among these filters, the NLM filter specifically demonstrates superior performance when the image contains regions of various types of textures. Wavelet domain approaches were also widely researched for image quality enhancement [12,13,14]; one such approach applies thresholding on the detail coefficients. The wavelet-based denoising methods well preserve sharp edges in the images compared to spatial domain methods. Optimization-based denoising techniques including total-variation denoising [15] provide more control over preserving details in the image and the extent of noise reduction. Recently, data driven machine learning approaches, particularly deep learning methods are gaining incredible attention due to their promising performance in various areas such as biomedicine [16,17,18,19], video processing. These methods are able to mimic human cognition [20,21]. Similarly, these approaches clearly outperform the conventional approaches in the area of denoising [22,23,24].
Indeed, acquisition of multi-modal medical imaging data during therapeutics is becoming increasingly common [25,26]. Since these diagnostic imaging techniques are one of the largest sources of big data [27,28,29,30,31], their automated analysis is highly desirable to facilitate the computer aided diagnosis of several diseases [32,33,34,35]. For instance, Computed Tomography (CT) and positron emission tomography (PET) are concurrently acquired as a standard treatment protocol in oncology. Similarly, T1 and T2-w MRI provides anatomical and pathological information, respectively. The combination of this complementary information plays a significant role in therapy and surgical planning. The concept of ‘weak learnability’ in ensemble learning further motivates to exploit the strength of this complimentarity. According to this concept, the learner (imaging modality here) can be incorporated into the learning system to elevate its performance, provided it can perform slightly better than random guessing [36].
With technical advancement and the availability of medical imaging techniques, using multi-modal data for the underlying computer-aided tasks is attracting several researchers. It has been exploited in segmentation, classification, super-resolution, and denoising [36,37,38]. For instance, in the context of lung nodule detection, CT and PET images were combined in a CNN-based approach [37]. Similarly, CT, PET, and MRI were also combined for tumor segmentation [36]. It is worth mentioning here that multi-modal information-based methods showed superior performance compared to those relying on a single modality (either CT or PET) [39].
The use of multi-modal medical imaging methods in improving segmentation and object detection motivates the researchers to employ the dual imaging in denoising as well. Few research works presented for medical image denoising [23,40] show improved performance over their single image denoising counterparts. Single image denoising approaches have an intrinsic limitation where the corrupted information in the original image is only hallucinated during the reconstruction process [41]. Consequently, these approaches over smooth certain critical structures in the image at the expense of removing noise [42]. It often leads to compromised performance of segmentation and object detection algorithms [43]. In this context, techniques that rely on cross-modal guidance offer the potential to overcome this limitation. Conventionally, cross-modal denoising methods use an image of better perceptual quality to facilitate the restoration process. Cross-modality guided medical image denoising is a relatively under-explored area; however, there exist a few approaches for natural images. One of the traditional denoising methods attempted to denoise depth maps using corresponding RGB images [44,45]. Deep learning-based cross-modal denoising approaches include [46,47]. One of these methods uses RGB-depth data pair to denoise depth images. Their proposed method consists of two CNNs; first to extract features individually from the RGB (guidance) and depth (target) images; the features are later concatenated to be fed to the third CNN, which selectively transfers the common structures in both images to generate the denoised image [46]. This work was further extended by adding a skip connection between the input image and the network prediction to enforce residual learning [47]. This modification brought significant improvement in the results by leveraging accurate details from the guidance to the target image.
A few cross-modal medical image denoising methods including [23,48,49] are found in the literature. One such work consolidated information from PET and MRI (T1 and T2 FLAIR) to denoise very low-dose PET images of the human brain [23]. The proposed method ResUNet was a residual encoder-decoder network, where residual learning was combined with U-Net. The PET, T1 and T2 FLAIR slices were stacked together and fed to the network. Using 2.5D information offers a way to discriminate structural information from noise. Compared to the ResUNet (PET without MRI), the combination of both modalities not only resulted in improved denoising performance but also improved lesion segmentation. In another similar CNN-based approach, amyloid PET images were concatenated with corresponding T1, T2, and T2 FLAIR images to learn denoising ultra-low-dose PET images using standard dose PET as ground truth. U-Net with residual learning was used in their approach. A similar idea was applied to T1 and T2 brain images [48]. The traditional guided filter was integrated with the deep learning framework, where guidance map generator takes guidance and cross-modal noisy images as input (T1 and T2 MR images). The guidance map generation component was realized using a modification of popular architecture, U-Net; where the encoding path was extended to dual branches for each modality followed by feature concatenation at the last encoding layer. The guidance filter was then incorporated as a differential layer and implemented as a linear combination of the guidance map and input image to yield the restored image. The method claimed to outperform approaches that do not include the guidance information from input image directly in the restoration process and rather only rely on the network prediction as final output.
The above-mentioned approaches are not very effective since simply concatenating the images as network input as in [23] or combining features from all encoding layers [48] does not fully exploit the potential of cross-modal complementarity. It leaves a huge space to further explore the improvement of cross-modal denoising methods and advance in this direction. Therefore, there is a need for a more efficient way of manipulating and combining features. To address the denoising problem in MR images, we present a cross-modality-guided denoising approach in this paper. The proposed model is inspired by the work of Fu et al. [50], where a similar model was used to detect salient objects in RGB-Depth images. Cross-modal image denoising for brain MR images was earlier explored by Stimpel et al. [48]; however, simple feature concatenation at the last encoding layer of their proposed method does not effectively exploit the information in the non-noisy guidance image. Unlike the previous denoising approaches, extracts hierarchical features from the input and guidance image using a siamese network (mirror backbones) that are later combined in the complimentarity-aware mechanism. Although T1 and T2 images belong to different modalities; nonetheless, they capture similar structures and analogous object contours. The guidance image (T2 in our case) has better perceptual quality (noise-free), while T1 is of lower quality due to its sensitivity to acquisition noise. This scenario renders cross-modal feature learning viable in the presence of a guidance image. Our contributions in this work are listed as follows:
- A novel framework based on cross-modal guidance information is designed to denoise T1-w brain MR images. In particular, a siamese network is specifically modified to train the denoising network using both T1 and T2 MR images. By exploiting the diversity of information contained in the two modalities and in particular better perceptual quality of T2 images and the structural information contained in T1 images, the proposed approach seeks additional guidance from these images in the reconstruction process.
- Literature dictates that complementarity-aware cross-modal feature fusion is not well explored in the context of denoising, hence in this work, an effective cross-modal information fusion strategy is incorporated. The experimental results show that this fusion mechanism works well in comparison to single image denoising approaches.
- Comprehensive experiments have been conducted to analyze the performance of the proposed method on different noise levels both on registered as well as unregistered data. Moreover, the role of different loss functions is inspected to analyze their impact on denoising performance.
- In this work, two public datasets are customized keeping in view the requirement of denoising in medical image analysis. The dataset consists of both T1 and T2 MR images, meeting the requirement of learning models based on cross-modal guidance.
This paper consists of five sections. Section 1 gives an introduction to and motivations for the work followed by background and related work. The dataset and proposed methodology are elaborated on in Section 2. Experiments, comparisons with different techniques, and the results are discussed in Section 3. Section 4 summarizes the discussion of results. The conclusion and suggested future work are presented in Section 5.
2. Materials and Methods
In this section, the dataset, experimental setup and proposed methodology are explained.
2.1. Dataset
The experiments in this work are conducted on two datasets which are subset of a publicly available database IXI [51]. Both datasets are collections of T1, T2, and some other brain MR imaging modalities of healthy patients. The detailed configuration and scanning parameters can be found on the Brain IXI website: https://brain-development.org/ixi-dataset/. T1 and T2 MRI have been used in this work. Further details of both datasets and experimental configuration are provided in the following subsections.
2.1.1. Dataset I: Hammersmith Hospital
The first experiment was done on the dataset acquired at Hammersmith Hospital, United Kingdom using Philips 3T system. 70 T1 and T2 volume pairs were randomly chosen, out of which 62 pairs were used for training and 8 for testing the denoising performance. It is pertinent to mention here that the proposed method was tested on registered as well as unregistered data and is explained in the following section. Furthermore, the role of different loss functions with both configurations was also investigated.
2.1.2. Dataset II: Guy’s Hospital
The collection of T1 and T2 MRI acquired at Guy’s Hospital, UK using Philips 1.5T system was also used in this work. Seventy T1 and 70 T2 volumes were randomly selected for this purpose, out of which 62 pairs were used for training and eight for testing.
2.2. Preprocessing
All the volumes (T1 and T2) were resampled to . The proposed model is trained and tested on two types of input-guidance image combinations. In the first case, the model is trained on unregistered data, while in the second case, the corresponding T1 and T2 volumes are registered using 3D slicer, where T2 volume was moved/deformed with reference to the T1 volume that is fixed. Rigid registration with 12 degrees of freedom was used. Rician noise was added to the T1 slices. Min-max intensity normalization was applied to the data. We conducted experiments on unregistered as well as registered data at different levels of Rician noise. The detail of both configurations is elaborated in the next subsection.
2.3. Implementation Details
The proposed method was implemented using the PyTorch library and trained on NVIDIA TITAN RTX GPU with 24 GB RAM. The backbone was initialized using the pre-trained parameters of DSS [52], while other layers were randomly initialized. The network was fine-tuned through end-to-end paired learning. The learning rate and momentum values were 0.00005 and 0.99, respectively. Stochastic Gradient Descent learning was adopted and the network was trained using the loss functions described in Equations (6) and (8) for 50 epochs.
2.4. Proposed Methodology
The conventional deep learning models for image denoising are trained to learn the mapping from noisy image Y to non-noisy image X [41,53]. However, in cross-modality-guided denoising methods, the model incorporates an additional multi-modal image G to learn complementary information and facilitate the learning process.
Therefore, in the proposed method, the model is trained to minimize the loss function as:
The proposed framework PHL-CMAR (Paired Hierarchical Learning-Cross-Modal Assisted Reconstruction) employs CNNs for extracting features as well as combining these features efficiently in the restoration process. PHL-CMAR framework consists of two modules: PHL module and CMAR module. The PHL module is responsible for extracting the features from paired (T1 and T2) images using the Siamese network to conduct joint learning. It discovers commonalities between the dual inputs from a model-based perspective, which is then incorporated in the model via back-propagation. The features extracted are then fed to the CMAR module, where they are combined to ultimately reconstruct the denoised image. Both components of the proposed model are explained in the subsequent sections.
2.4.1. Paired Hierarchical Learning (PHL)
The PHL module accepts two images, noisy T1 image Y and guidance image G, that is T2 as input. ResNet is used as a trunk architecture for feature extraction. For both images, the single-channel is copied three times to correspond with the RGB images which the general VGG or Resnet-like models accept. ResNet uses skip connections to address the issue of vanishing gradients and learns the residuals instead of the function [54]. Pre-trained ResNet-101 was used for feature extraction. Since ResNet’s first convolution layer has a stride of 2, which gives the feature spatial size of 160 × 160 at the shallowest level, conv1_1 and conv1_2 layers from VGG-16 are used to obtain the full feature size of 320 × 320. Therefore, each hierarchical branch (1 to 6) is then connected to conv1_2 (borrowed from VGG-16), conv1, res2, res3(3), res4(22), and res5 layers of the ResNet-101, respectively. Axial slices were used where each image has dimension of 256 × 256 × 3. The shared Siamese backbone extracts features from the dual images in the hierarchical side-output manner [52] and is briefly described below. Since feature extraction is accomplished using short connections, the feature set at every hierarchy contains varying dimensions. Another component Feature Pruning (FP) is therefore introduced in the PHL module [50], which ensures that the feature set from each hierarchy is of uniform size. Let us represent the feature set corresponding to guidance image and input image by and , respectively. Figure 1 shows the structure of PHL module. It is worth mentioning here that directly concatenating the two images has not been found as effective in detection tasks as combining features in a hierarchical way [50]. The combination of ResNet with hierarchical feature manipulation strategy allows the model to combine the complimentary information from both modalities that are later combined using densely connected FE module.
Short Connections
Generally, the feature maps at the shallow layers of CNNs are crude. As the DL network delves deeper, the successive convolution layers refine the feature maps obtained earlier. However, the deeper-level feature maps lack regularity. Using short-connection from following convolution layers to the earlier layers offers learning model a way to consolidate the information from multiple levels. Integrating features in this manner provides deep learning networks with information-rich multi-scale feature maps and therefore improves the results [52]. The idea of using short connections in the CNN to exploit multi-scale information was initially applied to edge detection [55] and later to salient object detection in RGB images [52]. This concept was further incorporated in the saliency detection framework using RGB-depth pair images [50], where the Siamese network was used for feature extraction.
Using short connections similar to [52] can be particularly beneficial in the denoising problem. A reasonable denoising algorithm should also be able to recover the corrupted information while simultaneously preserving the critical structures in the images. Considering medical images, the denoising problem becomes even more sensitive since the results would be later used in diagnosis and image analysis tasks such as segmentation. The capability of exploiting rich information at the feature extraction phase motivates us to include this strategy in our proposed model.
2.4.2. Cross-Modal Assisted Reconstruction (CMAR)
The CMAR module combines the hierarchical features extracted by the PHL module to perform upsampling. CMAR acts as a decoder in our proposed method and consists of two components, i.e., Cross-Modal feature Synthesis (CMS) and Feature Expansion (FE). The detail of the interactions among various elements of the CMS and FE components along with their relationship with the PHL module is depicted in Figure 2. Both components are explained in the subsections below:
Cross-Modal Feature Synthesis (CMS)
Let us denote the feature set provided by the FP module as , where and correspond to the features extracted from noisy image, and guidance image, respectively. CMS does feature multiplication followed by feature addition of the corresponding multi-scale features. This operation can be mathematically expressed as:
⊕ and ⊗ symbols in Equation (5) represents addition and multiplication (element-wise). The addition operation exploits complementary information between both modalities in the feature space, while the multiplication operation combines common information in the cross-modal feature set. The complementarity-aware feature fusion in this manner genuinely exploits superior perceptual quality of guidance image and therefore embeds additional learning capability into the model.
Feature Expansion (FE)
The feature maps from the CMS component are passed to the FE component, which acts as a decoder in our framework and is embedded with dense connections. The dense connections enable effective information flow from each decoder block to the next. Propagating the multi-level features in a densely connected fashion has proven to improve the learning capability of the network [56]. Inception module [57] is incorporated in the FE module and is shown in Figure 3. Up-sampling in this module was done using simple bilinear interpolation. Leveraging varying filter sizes such as 1 × 1, 3 × 3, and 5 × 5 in Conv layers, the inception module allows the network to learn spatial patterns at several scales.
The output from the last FE module, i.e., FE1 is fed to a 1 × 1 convolution layer to acquire the reconstructed image in a supervised manner. The detail of the loss function is given as follows.
2.5. Loss Function
Mean square error (MSE) is a standard objective function used in several image processing problems including image super-resolution and denoising. Using MSE as a loss function allows minimizing the residual error between pixels in the ground truth and the network predicted image, which implies attaining a higher Peak Signal to Noise Ratio (PSNR). MSE loss is expressed as follows:
However, it was observed that optimization using solely MSE sometimes generates blurred images. In this context, an objective function motivated by structural information can be integrated. SSIM is used to define the extent of local structural similarity between two images and can be incorporated with MSE as a loss function to address the over-smoothness phenomena associated with MSE. While the higher the SSIM value, the higher is the structural similarity in images, the objective function is therefore expressed as follows:
The overall loss function of the proposed method is mathematically formulated as:
Equal values of and have been chosen for our experiment, that is 0.5.
3. Experiments and Results
The performance of the proposed method was validated by comparing it with five state-of-the-art methods including Non-local means filter (NLM) [10], Stein’s unbiased risk estimate (SURE) [58], Block-matching and 3D filtering (BM3D) [59], Multi-channel Denoising convolutional neural network (MCDnCNN), referred as MCDN in the paper [24] and FFD-Net [53]. Among the methods chosen, NLM [10] is a popular denoising method that computes the weighted average of not only the local neighborhood but all pixels in the image. Wavelet-based denoising approach SURE does not rely on prior statistical modeling of wavelet coefficients [58]. Instead, it parametrizes denoising by computing parameters that minimize this MSE estimate. BM3D is a popular approach based on stacking similar 2D image patches followed by hard thresholding and Wiener filtering to denoise 3D stacks [59]. Although BM3D was originally developed for removing Gaussian noise in images; however, it has been applied to Rician noise removal as well [60]. MCDN is a 10 convolution layer network embedded with residual learning taking multi-channel input; however, we modified it to take identical slices. FFD-Net [53] is another CNN architecture that is capable of handling a variable range of noise levels in a single model.
Moreover, the denoising performance was also evaluated by using different combinations of loss functions on registered as well as unregistered data. Three metrics were used to quantitatively evaluate the performance. The first metric peak signal-to-noise ratio (PSNR) compares the root mean square error (RMSE) between the ground truth and denoised images. Another metric Structural Similarity Index (SSIM) was also included in the assessment that measures the structural affinity between denoised images and the ground truth. Feature Similarity Index (FSIM) [61] is a full reference image quality assessment (IQA) metric that is often used to evaluate the performance of denoising methods [62]. It computes feature similarity between the two images based on the low-level features including phase congruency and gradient magnitude.
In the following subsections, we describe in detail the experiments conducted on the brain MR images using the proposed method and state-of-the-art methods.
3.1. Configurations
The performance of the proposed method was evaluated on unregistered and registered data with different combinations of loss functions. Different configurations of data and loss functions tested in the proposed method are mentioned in Table 1 and briefly explained below:
3.1.1.
Under this configuration, registration was not performed between T1-w and T2-w volumes. Using MSE as loss function, the model was trained and then tested on both datasets. The results of this configuration are referred as ’’.
3.1.2.
The role of using an additional SSIM-based loss function was analyzed in case of unregistered data under this configuration. Therefore, both SSIM and MSE were combined here.
3.1.3.
In this case, registration was performed between T1 and T2 volumes. Registration was done using 3D Slicer. Rigid Registration with 12 degrees of freedom was applied in all cases where T1 volume was fixed, while T2 was moved with reference to T1 in the registration process. The effect of registration can be better comprehended by visually inspecting the registered and unregistered T2 images with reference to T1 in Figure 4. It can be noticed that T1 and unregistered T2 slices are structurally similar; however, careful insight points to structural mismatches at various regions in the image. After applying registration, the structural similarity in the registered T2 image can be seen in the highlighted areas. In the following experimental sections, we further analyze the impact of registration on denoising and structural preservation in the presence of cross-modal image T2. The loss function used in this case is MSE.
3.1.4.
SSIM was combined with MSE for analyzing the performance of the proposed method on the registered data in this configuration.
Next, we explain the experiments conducted to compare the performance of with other denoising methods.
3.2. Experiment I
The first set of experiments was conducted by comparing the proposed method (‘’ configuration was used in this set of experiments) with state-of-the art denoising methods. The experiments were conducted on the T1 images taken from two datasets, HH and Guy’s, corrupted by Rician noise in the range 5% to 13%.
3.3. Experiment II
The second experiment was conducted to investigate the impact of registration on the denoising performance; besides, the role of using different loss functions was also evaluated. Therefore, the experiments were conducted using the four configurations , , , and , in Table 1.
3.4. Experiment III
Another experiment was conducted to investigate the impact of integrating corresponding cross-modal images in the proposed framework and analyze its impact in denoising and preserving the structural information in the image. In order to do this, a noisy input image (T1) was fed to both the branches of the PHL module instead of the combination of noisy input and cross-modal (guidance) image. The model was then trained using MSE and SSIM losses on Guy’s hospital dataset (contaminated with 13% noise).
4. Discussion
In this section, we summarize the discussion of our results. The results of Experiment I are shown in Figure 5, Figure 6 and Figure 7, where the denoising performance of the proposed method is shown in comparison with state-of-the-art denoising methods. In Figure 5, the input images were contaminated using 13% noise. All the images denoised using different approaches suppress noise to some extent; however, NLM [10] removes important structural details in the image and oversmoothes the contents of the denoised image during the restoration. Wavelet-based technique SURE [58] and BM3D [59] preserve the structural details; however, they do not eradicate noise to a reasonable extent. The deep learning methods clearly show better performance compared to the traditional methods, both in removing noise and maintaining the morphology of the image. Both MCDN [24] and FFD-Net [53] effectively remove the noise. Similarly, also eradicates noise with reasonable preservation of the structural information. The enlarged ROIs are also shown in the figure for careful insight into the denoising performance of all the methods. Figure 6 shows the results of denoising applied on images contaminated with 8% noise. A similar trend can be observed in this case as well where the methods MCDN [24], FFD-Net [53], and preserve important structures in the denoised images. However, NLM [10] produces over-smoothing effects. The performance was quantitatively evaluated using PSNR, SSIM, and FSIM. BM3D [59] works better compared to NLM and SURE [58]; this claim is also supported by the higher PSNR value in Table 2. The performance of FFD-Net [53] and MCDN is very similar when quantitatively evaluated. However, performs best among all the techniques evaluated.
The visual comparison of the performance of the proposed method with other denoising methods conducted on the Guys dataset (13% noise) is shown in Figure 7. NLM and SURE exhibit worse performance among all the methods tested. NLM eradicates significant details from the image while SURE removes minimal noise. BM3D performs slightly better than the two approaches. MCDN preserves structural information of the image; however, it leaves some noticeable noise in the image. The performance of FFD-Net visually in this case is comparable with . The quantitative assessment also validates the visual observations, which are shown in Table 3. For instance, NLM and SURE are ranked low at all the noise levels by PSNR and SSIM. BM3D performs better than both NLM and SURE. It is pertinent to mention that even the more robust conventional denoising methods such as BM3D leveraging the benefits of spatial and transform domains rely on pre-defined assumptions that do not work well under several types and levels of noise. On the other hand, deep learning approaches allow the underlying model to learn various levels of feature representations from raw to the higher level. In the context of denoising, the model thus learns the uncertain noise distributions from the input data. Consequently, these techniques can adapt to several types of noise efficiently. The deep learning methods in the proposed study perform better than the conventional methods on all the metrics. However, the cross-modal image information further enhances the network learning capability. Overall, the images denoised using all the methods still look blurry compared to the ground truth. It is because it is not possible to recover the image contents completely that have been corrupted by noise without any loss of information. However, it can be sensed that the denoising at level 8% introduces less blur compared to the denoising applied to images containing 13% noise. Overall, the proposed method achieves the best performance among all the methods both in PSNR and SSIM. exhibits an average gain of 4.7% in SSIM value compared to the second-best MCDN (0.89 against 0.85).
All the denoising methods included in this study bring improvement in preserving low-level features in the restored images when compared to the input noisy image as can be seen in terms of FSIM values (Table 4 and Table 5). It is worth mentioning here that the FSIM scores for all the methods are very close particularly at low noise levels (5%). However, this difference is more pronounced at the higher noise levels (13%). For instance, at 13% noise, the proposed method shows the best performance on both datasets. The average gain in FSIM values in the case of (FSIM value 0.903) compared to the second-best performing method FFD-Net [53] (FSIM value 0.883) was 2.3%.
Another experiment (Experiment II) was conducted on the HH dataset using 13% noise. The denoising results are shown in Figure 8 along with enlarged regions for careful inspection. Table 6 shows the quantitative assessment results on different variants of data (i.e., registered and unregistered) using two different loss functions. Among the variants of the proposed method, it is observed that registration between the corresponding T1 and T2 images together with employing SSIM as loss function with MSE facilitates in improving the structural similarity between denoised image and ground truth as implied by the higher SSIM values in the case of compared to its corresponding variants and ; however, noticeable improvement in PSNR values was not observed under this configuration.
Role of Cross-Modal Guidance Information
To better understand the motivation of using cross-modal guidance information, the guidance image was bypassed and a noisy T1 image was fed to both branches of the PHL module as explained in Section 3.4. The results of this setup and its comparison with other variants of the proposed method are shown in Figure 9. Visually, the denoised images are similar on the whole; however, the enlarged ROI shows slight structural differences among the results. The model trained using identical noisy images fed to both branches (without guidance image) fails to recover various structures of the input image. Both and yield better results compared to the T1-T1 configuration; however, they also lack in recovering some structural information. shows better performance compared to the three variants in terms of retaining structural similarity with the ground truth. Incorporating SSIM in the registered configuration, that is configuration performs best. It not only retains structural similarity to a considerable extent, moreover, it also gives sharp edges compared to all the other variants. The PSNR-SSIM values for all the configurations tested are shown in Table 7.
5. Conclusions
In this paper, a deep cross-modal guided denoising approach was presented for brain MR images, where the complementary information from the cross-modal image was exploited to embed the model with additional learning capability. Hierarchical feature manipulation combined with densely connected upsampling was particularly used to harness the additional guidance information effectively in image restoration process. Our quantitative and qualitative experimental analysis shows that the cross-modal denoising shows superior results compared to single image denoising approaches. The capability of combining cross-modal image features in a systematic way, rather than simple concatenation proved to be influential in denoising. Furthermore, the experiments show that although the method works well on unregistered data; however, using registered data aids in recovering the structural information of the image. The proposed denoising approach can be used as an effective preprocessing step in various image analysis tasks.
In the future, it would be interesting to extend the research work to other organs such as the liver, lungs, and other multi-modal medical imaging modalities.
Author Contributions
Conceptualization, R.N., F.A.C. and A.B.; methodology, R.N., F.A.C. and M.S.; software, R.N.; validation, R.N. and A.B.; formal analysis, R.N. and M.S.; writing—original draft preparation, R.N., F.A.C. and A.B.; writing—review and editing, R.N., K.M. and F.A.C.; supervision, F.A.C. and A.B.; project administration and funding acquisition F.A.C. All authors have read and agreed to the published version of the manuscript.
Funding
This work is supported by H2020-MSCA-ITN Marie Skłodowska-Curie Actions, Innovative Training Networks (ITN)-H2020 MSCA ITN 2016 GA EU project number 722068 High Performance Soft Tissue Navigation (HiPerNav).
Data Availability Statement
Data available in a publicly accessible repository. The data used in this study is openly available in IXI database at: https://brain-development.org/ixi-dataset/.
Conflicts of Interest
The authors declare no conflict of interest.
References
- Struyfs, H.; Sima, D.M.; Wittens, M.; Ribbens, A.; de Barros, N.P.; Vân Phan, T.; Meyer, M.I.F.; Claes, L.; Niemantsverdriet, E.; Engelborghs, S.; et al. Automated MRI volumetry as a diagnostic tool for Alzheimer’s disease: Validation of icobrain dm. Neuroimage Clin. 2020, 26, 102243. [Google Scholar] [CrossRef]
- Agosta, F.; Galantucci, S.; Filippi, M. Advanced magnetic resonance imaging of neurodegenerative diseases. Neurol. Sci. 2017, 38, 41–51. [Google Scholar] [CrossRef]
- Rocca, M.A.; Battaglini, M.; Benedict, R.H.; De Stefano, N.; Geurts, J.J.; Henry, R.G.; Horsfield, M.A.; Jenkinson, M.; Pagani, E.; Filippi, M. Brain MRI atrophy quantification in MS: From methods to clinical application. Neurology 2017, 88, 403–413. [Google Scholar] [CrossRef] [Green Version]
- Prieto, R.; Pascual, J.; Barrios, L. Topographic diagnosis of craniopharyngiomas: The accuracy of MRI findings observed on conventional T1 and T2 images. Am. J. Neuroradiol. 2017, 38, 2073–2080. [Google Scholar] [CrossRef] [Green Version]
- Satpute, N.; Naseem, R.; Palomar, R.; Zachariadis, O.; Gómez-Luna, J.; Cheikh, F.A.; Olivares, J. Fast parallel vessel segmentation. Comput. Methods Programs Biomed. 2020, 192, 105430. [Google Scholar] [CrossRef]
- Survarachakan, S.; Pelanis, E.; Khan, Z.A.; Kumar, R.P.; Edwin, B.; Lindseth, F. Effects of Enhancement on Deep Learning Based Hepatic Vessel Segmentation. Electronics 2021, 10, 1165. [Google Scholar] [CrossRef]
- Gudbjartsson, H.; Patz, S. The Rician distribution of noisy MRI data. Magn. Reson. Med. 1995, 34, 910–914. [Google Scholar] [CrossRef] [PubMed]
- Sagheer; Sameera, V.; George, S.N. A review on medical image denoising algorithms. Biomed. Signal Process. Control 2020, 61, 102036. [Google Scholar] [CrossRef]
- Tomasi, C.; Manduchi, R. Bilateral filtering for gray and color images. In Proceedings of the Sixth International Conference on Computer Vision (IEEE Cat. No. 98CH36271), Bombay, India, 7 January 1998; pp. 839–846. [Google Scholar]
- Buades, A.; Coll, B.; Morel, J.M. A non-local algorithm for image denoising. In Proceedings of the 2005 IEEE Computer Society Conference on Computer Vision and Pattern Recognition (CVPR’05), San Diego, CA, USA, 20–26 June 2005; Volume 2, pp. 60–65. [Google Scholar]
- Perona, P.; Malik, J. Scale-space and edge detection using anisotropic diffusion. IEEE Trans. Pattern Anal. Mach. Intell. 1990, 12, 629–639. [Google Scholar] [CrossRef] [Green Version]
- Weaver, J.B.; Xu, Y.; Healy, D., Jr.; Cromwell, L. Filtering noise from images with wavelet transforms. Magn. Reson. Med. 1991, 21, 288–295. [Google Scholar] [CrossRef]
- Souidene, W.; Beghdadi, A.; Abed-Meraim, K. Image denoising in the transformed domain using non local neighborhoods. In Proceedings of the 2006 IEEE International Conference on Acoustics Speech and Signal Processing Processing, Toulouse, France, 14–19 May 2006; Volume 2, p. II. [Google Scholar]
- Sdiri, B.; Kaaniche, M.; Cheikh, F.A.; Beghdadi, A.; Elle, O.J. Efficient enhancement of stereo endoscopic images based on joint wavelet decomposition and binocular combination. IEEE Trans. Med. Imaging 2018, 38, 33–45. [Google Scholar] [CrossRef] [PubMed]
- Rudin, L.I.; Osher, S.; Fatemi, E. Nonlinear total variation based noise removal algorithms. Phys. D Nonlinear Phenom. 1992, 60, 259–268. [Google Scholar] [CrossRef]
- Yang, S.; Wang, J.; Hao, X.; Li, H.; Wei, X.; Deng, B.; Loparo, K.A. BiCoSS: Toward large-scale cognition brain with multigranular neuromorphic architecture. IEEE Trans. Neural Netw. Learn. Syst. 2021. [Google Scholar] [CrossRef]
- Yang, S.; Deng, B.; Wang, J.; Li, H.; Lu, M.; Che, Y.; Wei, X.; Loparo, K.A. Scalable digital neuromorphic architecture for large-scale biophysically meaningful neural network with multi-compartment neurons. IEEE Trans. Neural Netw. Learn. Syst. 2019, 31, 148–162. [Google Scholar] [CrossRef] [PubMed]
- Yang, S.; Wang, J.; Deng, B.; Azghadi, M.R.; Linares-Barranco, B. Neuromorphic Context-Dependent Learning Framework With Fault-Tolerant Spike Routing. IEEE Trans. Neural Netw. Learn. Syst. 2021. [Google Scholar] [CrossRef]
- Yang, S.; Wang, J.; Zhang, N.; Deng, B.; Pang, Y.; Azghadi, M.R. CerebelluMorphic: Large-scale neuromorphic model and architecture for supervised motor learning. IEEE Trans. Neural Netw. Learn. Syst. 2021. [Google Scholar] [CrossRef] [PubMed]
- Bolkar, S.; Wang, C.; Cheikh, F.A.; Yildirim, S. Deep smoke removal from minimally invasive surgery videos. In Proceedings of the 2018 25th IEEE International Conference on Image Processing (ICIP), Athens, Greece, 7–10 October 2018; pp. 3403–3407. [Google Scholar]
- Wang, C.; Mohammed, A.K.; Cheikh, F.A.; Beghdadi, A.; Elle, O.J. Multiscale deep desmoking for laparoscopic surgery. In Proceedings of the Medical Imaging 2019: Image Processing, International Society for Optics and Photonics, San Diego, CA, USA, 16–21 February 2019; Volume 10949, p. 109491Y. [Google Scholar]
- Khan, S.; Sajjad, M.; Hussain, T.; Ullah, A.; Imran, A.S. A Review on Traditional Machine Learning and Deep Learning Models for WBCs Classification in Blood Smear Images. IEEE Access 2020. [Google Scholar] [CrossRef]
- Xu, J.; Gong, E.; Ouyang, J.; Pauly, J.; Zaharchuk, G. Ultra-low-dose 18F-FDG brain PET/MR denoising using deep learning and multi-contrast information. In Proceedings of the Medical Imaging 2020: Image Processing, International Society for Optics and Photonics, Houston, TX, USA, 17–20 February 2020; Volume 11313, p. 113131P. [Google Scholar]
- Jiang, D.; Dou, W.; Vosters, L.; Xu, X.; Sun, Y.; Tan, T. Denoising of 3D magnetic resonance images with multi-channel residual learning of convolutional neural network. Jpn. J. Radiol. 2018, 36, 566–574. [Google Scholar] [CrossRef] [Green Version]
- Naseem, R.; Cheikh, F.A.; Beghdadi, A.; Elle, O.J.; Lindseth, F. Cross modality guided liver image enhancement of CT using MRI. In Proceedings of the 2019 8th European Workshop on Visual Information Processing (EUVIP), Rome, Italy, 28–31 October 2019; pp. 46–51. [Google Scholar]
- Naseem, R.; Khan, Z.A.; Satpute, N.; Azeddine, B.; Cheikh, F.A.; Olivares, J. Cross-modality guided contrast enhancement for improved liver tumor image segmentation. IEEE Access 2021, in press. [Google Scholar] [CrossRef]
- Tahmassebi, A.; Ehtemami, A.; Mohebali, B.; Gandomi, A.H.; Pinker, K.; Meyer-Baese, A. Big data analytics in medical imaging using deep learning. In Proceedings of the Big Data: Learning, Analytics, and Applications, Baltimore, MD, USA, 13 May 2019; Volume 10989, p. 109890E. [Google Scholar]
- Elhoseny, M.; Abdelaziz, A.; Salama, A.S.; Riad, A.M.; Muhammad, K.; Sangaiah, A.K. A hybrid model of internet of things and cloud computing to manage big data in health services applications. Future Gener. Comput. Syst. 2018, 86, 1383–1394. [Google Scholar] [CrossRef]
- Tahmassebi, A.; Gandomi, A.H.; McCann, I.; Schulte, M.H.; Goudriaan, A.E.; Meyer-Baese, A. Deep learning in medical imaging: fMRI big data analysis via convolutional neural networks. In Proceedings of the Practice and Experience on Advanced Research Computing, Pittsburgh, PA, USA, 22–26 July 2018; pp. 1–4. [Google Scholar]
- Yang, S.; Gao, T.; Wang, J.; Deng, B.; Lansdell, B.; Linares-Barranco, B. Efficient spike-driven learning with dendritic event-based processing. Front. Neurosci. 2021, 15, 97. [Google Scholar] [CrossRef]
- Yang, S.; Wei, X.; Deng, B.; Liu, C.; Li, H.; Wang, J. Efficient digital implementation of a conductance-based globus pallidus neuron and the dynamics analysis. Phys. A Stat. Mech. Its Appl. 2018, 494, 484–502. [Google Scholar] [CrossRef]
- Kumar, A.; Ramachandran, M.; Gandomi, A.H.; Patan, R.; Lukasik, S.; Soundarapandian, R.K. A deep neural network based classifier for brain tumor diagnosis. Appl. Soft Comput. 2019, 82, 105528. [Google Scholar] [CrossRef]
- Sajjad, M.; Khan, S.; Muhammad, K.; Wu, W.; Ullah, A.; Baik, S.W. Multi-grade brain tumor classification using deep CNN with extensive data augmentation. J. Comput. Sci. 2019, 30, 174–182. [Google Scholar] [CrossRef]
- Wang, C.; Cheikh, F.A.; Beghdadi, A.; Elle, O.J. Adaptive context encoding module for semantic segmentation. Electron. Imaging 2020, 2020, 27-1–27-7. [Google Scholar] [CrossRef]
- Mohammed, A.; Wang, C.; Zhao, M.; Ullah, M.; Naseem, R.; Wang, H.; Pedersen, M.; Cheikh, F.A. Weakly-Supervised network for detection of COVID-19 in chest CT scans. IEEE Access 2020, 8, 155987–156000. [Google Scholar] [CrossRef]
- Guo, Z.; Li, X.; Huang, H.; Guo, N.; Li, Q. Deep learning-based image segmentation on multimodal medical imaging. IEEE Trans. Radiat. Plasma Med. Sci. 2019, 3, 162–169. [Google Scholar] [CrossRef]
- Teramoto, A.; Fujita, H.; Yamamuro, O.; Tamaki, T. Automated detection of pulmonary nodules in PET/CT images: Ensemble false-positive reduction using a convolutional neural network technique. Med. Phys. 2016, 43, 2821–2827. [Google Scholar] [CrossRef]
- Guo, Z.; Guo, N.; Gong, K.; Li, Q. Gross tumor volume segmentation for head and neck cancer radiotherapy using deep dense multi-modality network. Phys. Med. Biol. 2019, 64, 205015. [Google Scholar] [CrossRef]
- Çiçek, Ö.; Abdulkadir, A.; Lienkamp, S.S.; Brox, T.; Ronneberger, O. 3D U-Net: Learning dense volumetric segmentation from sparse annotation. In International Conference on Medical Image Computing and Computer-Assisted Intervention; Springer: Berlin/Heidelberg, Germany, 2016; pp. 424–432. [Google Scholar]
- Kang, S.K.; Yie, S.Y.; Lee, J.S. Noise2Noise Improved by Trainable Wavelet Coefficients for PET Denoising. Electronics 2021, 10, 1529. [Google Scholar] [CrossRef]
- Wang, Y.; Song, X.; Gong, G.; Li, N. A Multi-Scale Feature Extraction-Based Normalized Attention Neural Network for Image Denoising. Electronics 2021, 10, 319. [Google Scholar] [CrossRef]
- Kang, E.; Min, J.; Ye, J.C. A deep convolutional neural network using directional wavelets for low-dose X-ray CT reconstruction. Med. Phys. 2017, 44, e360–e375. [Google Scholar] [CrossRef] [Green Version]
- Satpute, N.; Naseem, R.; Pelanis, E.; Gómez-Luna, J.; Cheikh, F.A.; Elle, O.J.; Olivares, J. GPU acceleration of liver enhancement for tumor segmentation. Comput. Methods Programs Biomed. 2020, 184, 105285. [Google Scholar] [CrossRef]
- Yan, Q.; Shen, X.; Xu, L.; Zhuo, S.; Zhang, X.; Shen, L.; Jia, J. Cross-field joint image restoration via scale map. In Proceedings of the IEEE International Conference on Computer Vision, Sydney, Australia, 1–8 December 2013; pp. 1537–1544. [Google Scholar]
- Shen, X.; Zhou, C.; Xu, L.; Jia, J. Mutual-structure for joint filtering. In Proceedings of the IEEE International Conference on Computer Vision, Santiago, Chile, 7–13 December 2015; pp. 3406–3414. [Google Scholar]
- Li, Y.; Huang, J.B.; Ahuja, N.; Yang, M.H. Deep joint image filtering. In European Conference on Computer Vision; Springer: Berlin/Heidelberg, Germany, 2016; pp. 154–169. [Google Scholar]
- Li, Y.; Huang, J.B.; Ahuja, N.; Yang, M.H. Joint image filtering with deep convolutional networks. IEEE Trans. Pattern Anal. Mach. Intell. 2019, 41, 1909–1923. [Google Scholar] [CrossRef] [PubMed] [Green Version]
- Stimpel, B.; Syben, C.; Schirrmacher, F.; Hoelter, P.; Dörfler, A.; Maier, A. Multi-Modal Deep Guided Filtering for Comprehensible Medical Image Processing. IEEE Trans. Med. Imaging 2019, 39, 1703–1711. [Google Scholar] [CrossRef] [PubMed]
- Chen, K.T.; Toueg, T.N.; Koran, M.E.I.; Davidzon, G.; Zeineh, M.; Holley, D.; Gandhi, H.; Halbert, K.; Boumis, A.; Kennedy, G.; et al. True ultra-low-dose amyloid PET/MRI enhanced with deep learning for clinical interpretation. Eur. J. Nucl. Med. Mol. Imaging 2021, 48, 2416–2425. [Google Scholar] [CrossRef] [PubMed]
- Fu, K.; Fan, D.P.; Ji, G.P.; Zhao, Q. Jl-dcf: Joint learning and densely-cooperative fusion framework for rgb-d salient object detection. In Proceedings of the IEEE/CVF Conference on Computer Vision and Pattern Recognition, Seattle, WA, USA, 13–19 June 2020; pp. 3052–3062. [Google Scholar]
- Brain IXI. Brain IXI Database. Available online: https://brain-development.org/team/ (accessed on 8 April 2021).
- Hou, Q.; Cheng, M.M.; Hu, X.; Borji, A.; Tu, Z.; Torr, P.H. Deeply supervised salient object detection with short connections. In Proceedings of the IEEE Conference on Computer Vision and Pattern Recognition, Honolulu, HI, USA, 21–26 July 2017; pp. 3203–3212. [Google Scholar]
- Zhang, K.; Zuo, W.; Zhang, L. FFDNet: Toward a fast and flexible solution for CNN-based image denoising. IEEE Trans. Image Process. 2018, 27, 4608–4622. [Google Scholar] [CrossRef] [Green Version]
- He, K.; Zhang, X.; Ren, S.; Sun, J. Deep residual learning for image recognition. In Proceedings of the IEEE Conference on Computer Vision and Pattern Recognition, Las Vegas, NV, USA, 27–30 June 2016; pp. 770–778. [Google Scholar]
- Xie, S.; Tu, Z. Holistically-nested edge detection. In Proceedings of the IEEE International Conference on Computer Vision, Santiago, Chile, 7–13 December 2015; pp. 1395–1403. [Google Scholar]
- Huang, G.; Liu, Z.; Van Der Maaten, L.; Weinberger, K.Q. Densely connected convolutional networks. In Proceedings of the IEEE Conference on Computer Vision and Pattern Recognition, Honolulu, HI, USA, 21–26 July 2017; pp. 4700–4708. [Google Scholar]
- Szegedy, C.; Liu, W.; Jia, Y.; Sermanet, P.; Reed, S.; Anguelov, D.; Erhan, D.; Vanhoucke, V.; Rabinovich, A. Going deeper with convolutions. In Proceedings of the IEEE Conference on Computer Vision and Pattern Recognition, Boston, MA, USA, 7–12 June 2015; pp. 1–9. [Google Scholar]
- Luisier, F.; Blu, T.; Unser, M. A new SURE approach to image denoising: Interscale orthonormal wavelet thresholding. IEEE Trans. Image Process. 2007, 16, 593–606. [Google Scholar] [CrossRef] [Green Version]
- Dabov, K.; Foi, A.; Katkovnik, V.; Egiazarian, K. Image denoising by sparse 3-D transform-domain collaborative filtering. IEEE Trans. Image Process. 2007, 16, 2080–2095. [Google Scholar] [CrossRef]
- Hanchate, V.; Joshi, K. MRI denoising using BM3D equipped with noise invalidation denoising technique and VST for improved contrast. SN Appl. Sci. 2020, 2, 1–8. [Google Scholar] [CrossRef] [Green Version]
- Zhang, L.; Zhang, L.; Mou, X.; Zhang, D. FSIM: A feature similarity index for image quality assessment. IEEE Trans. Image Process. 2011, 20, 2378–2386. [Google Scholar] [CrossRef] [PubMed] [Green Version]
- Kaur, R.; Juneja, M.; Mandal, A.K. A comprehensive review of denoising techniques for abdominal CT images. Multimed. Tools Appl. 2018, 77, 22735–22770. [Google Scholar] [CrossRef]
Figure 1.
Paired Hierarchical Learning (PHL).
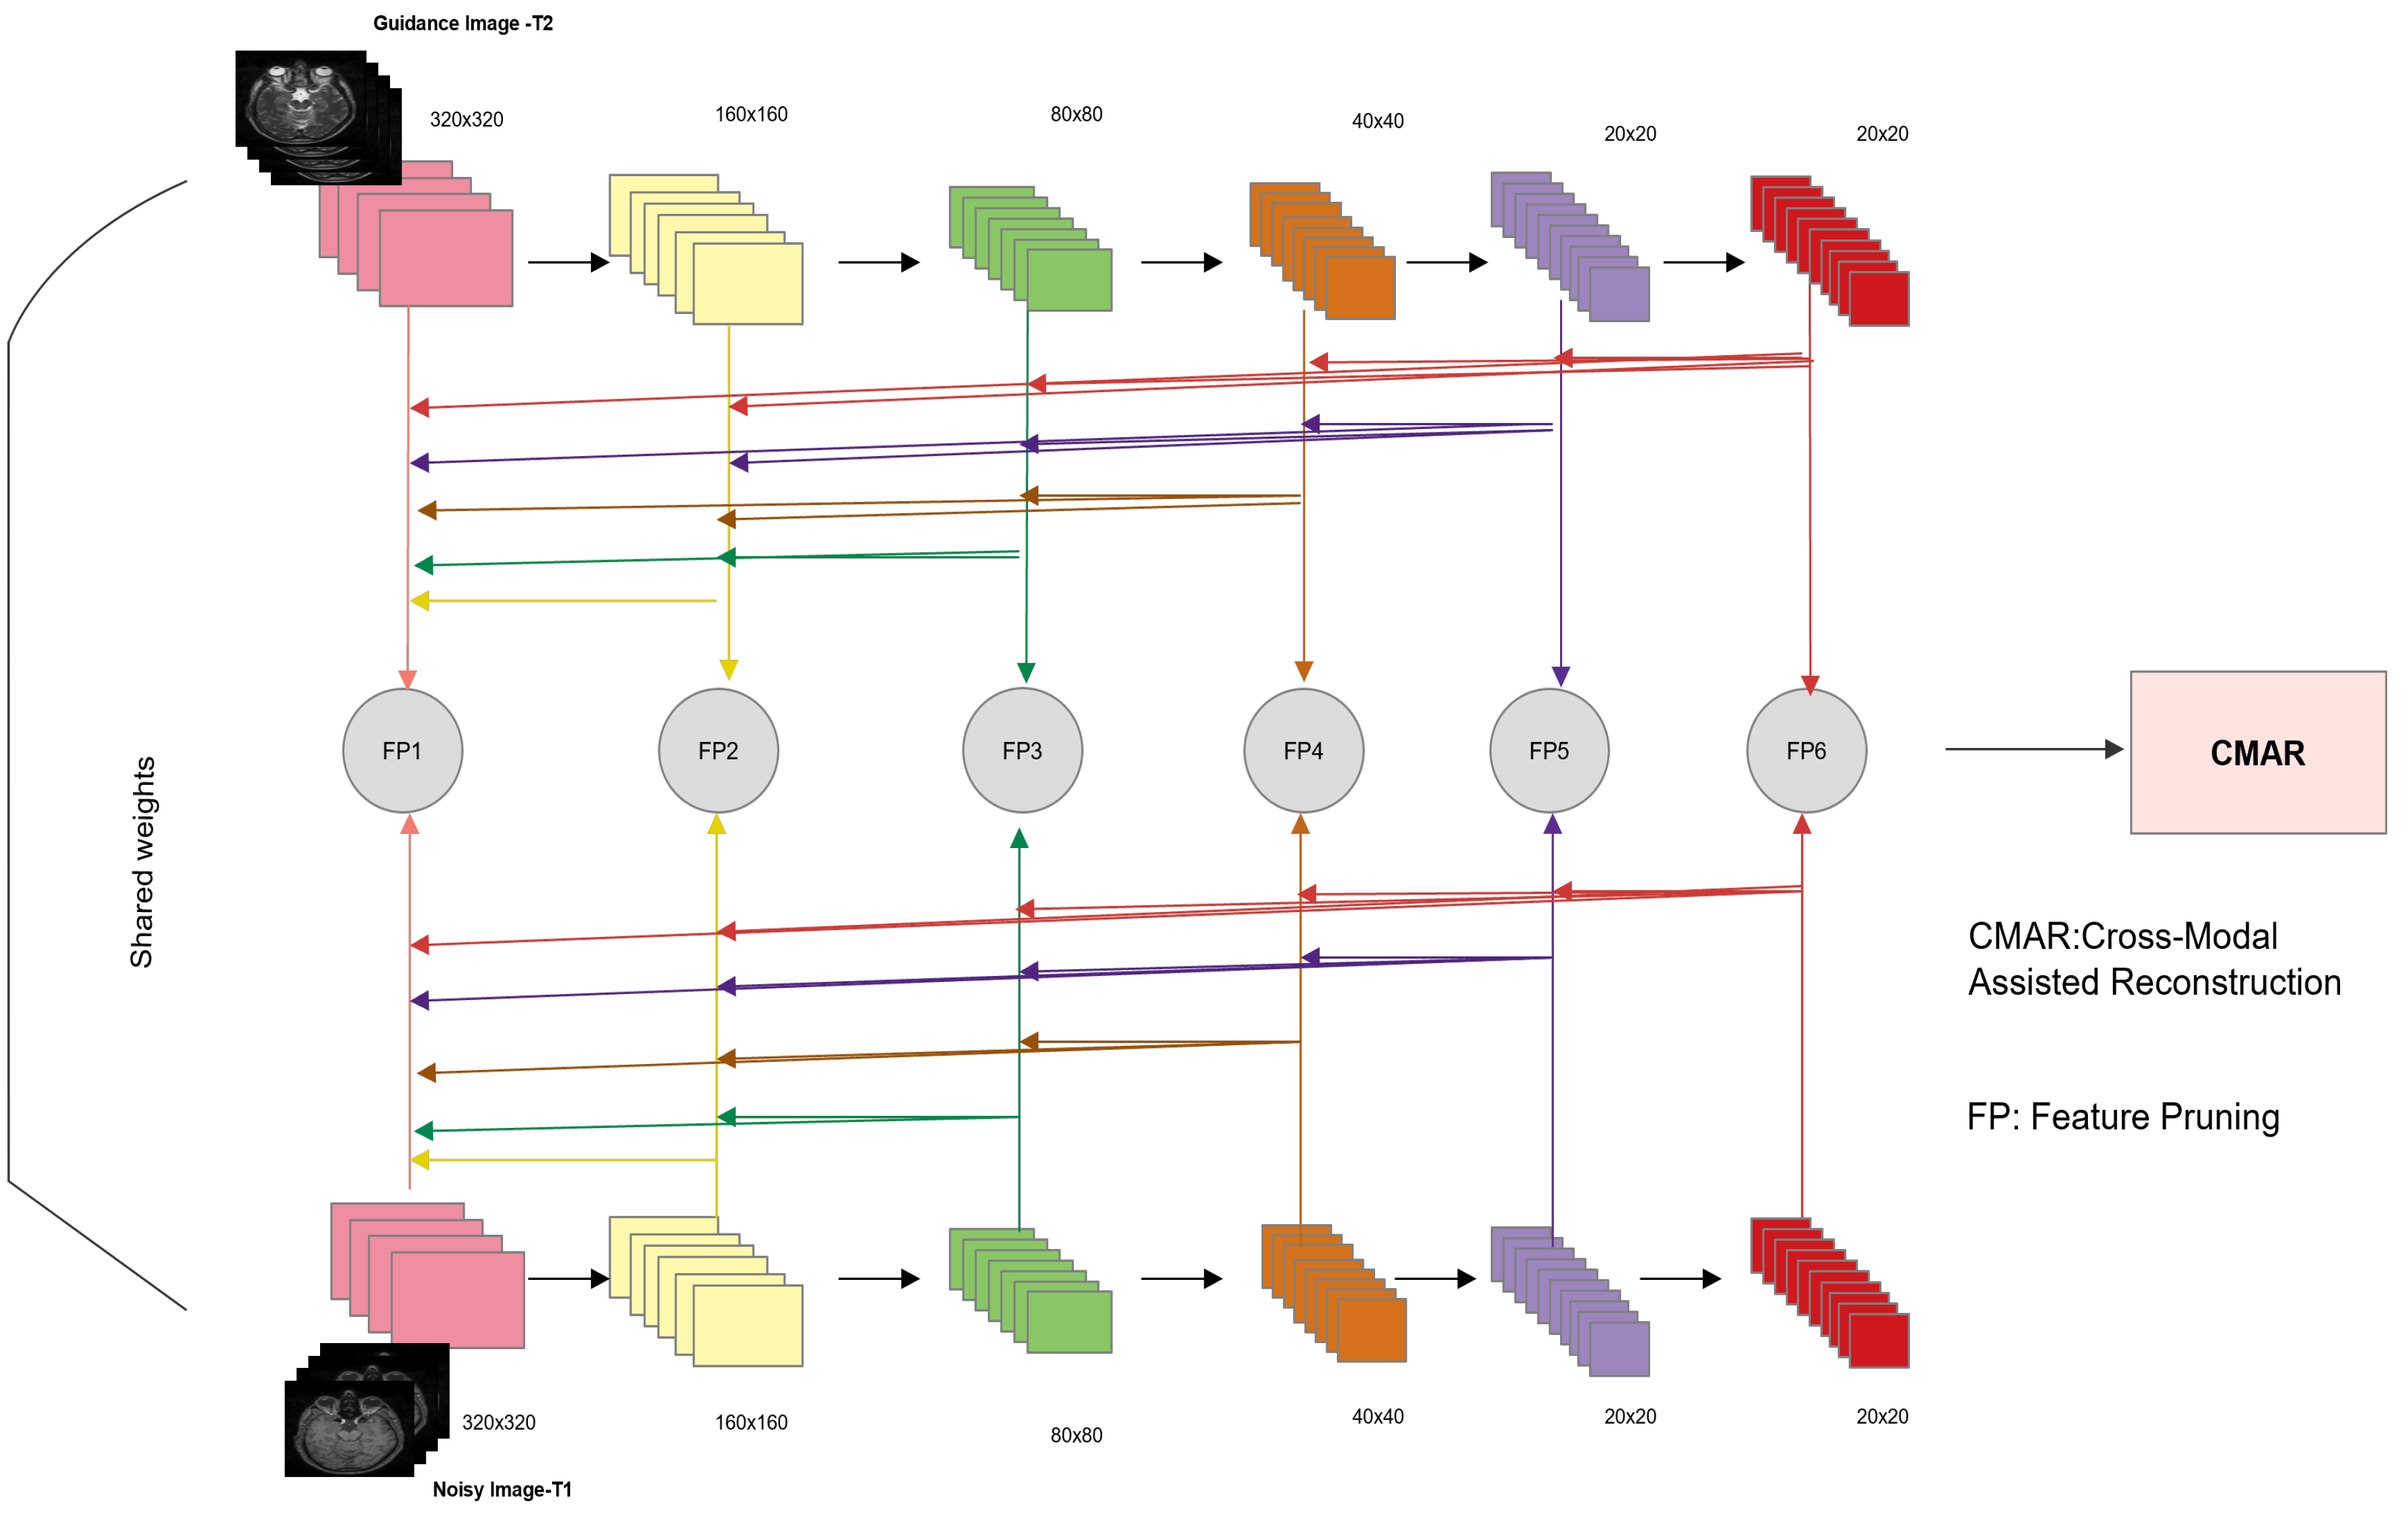
Figure 2.
Cross-Modal Assisted Reconstruction (CMAR).
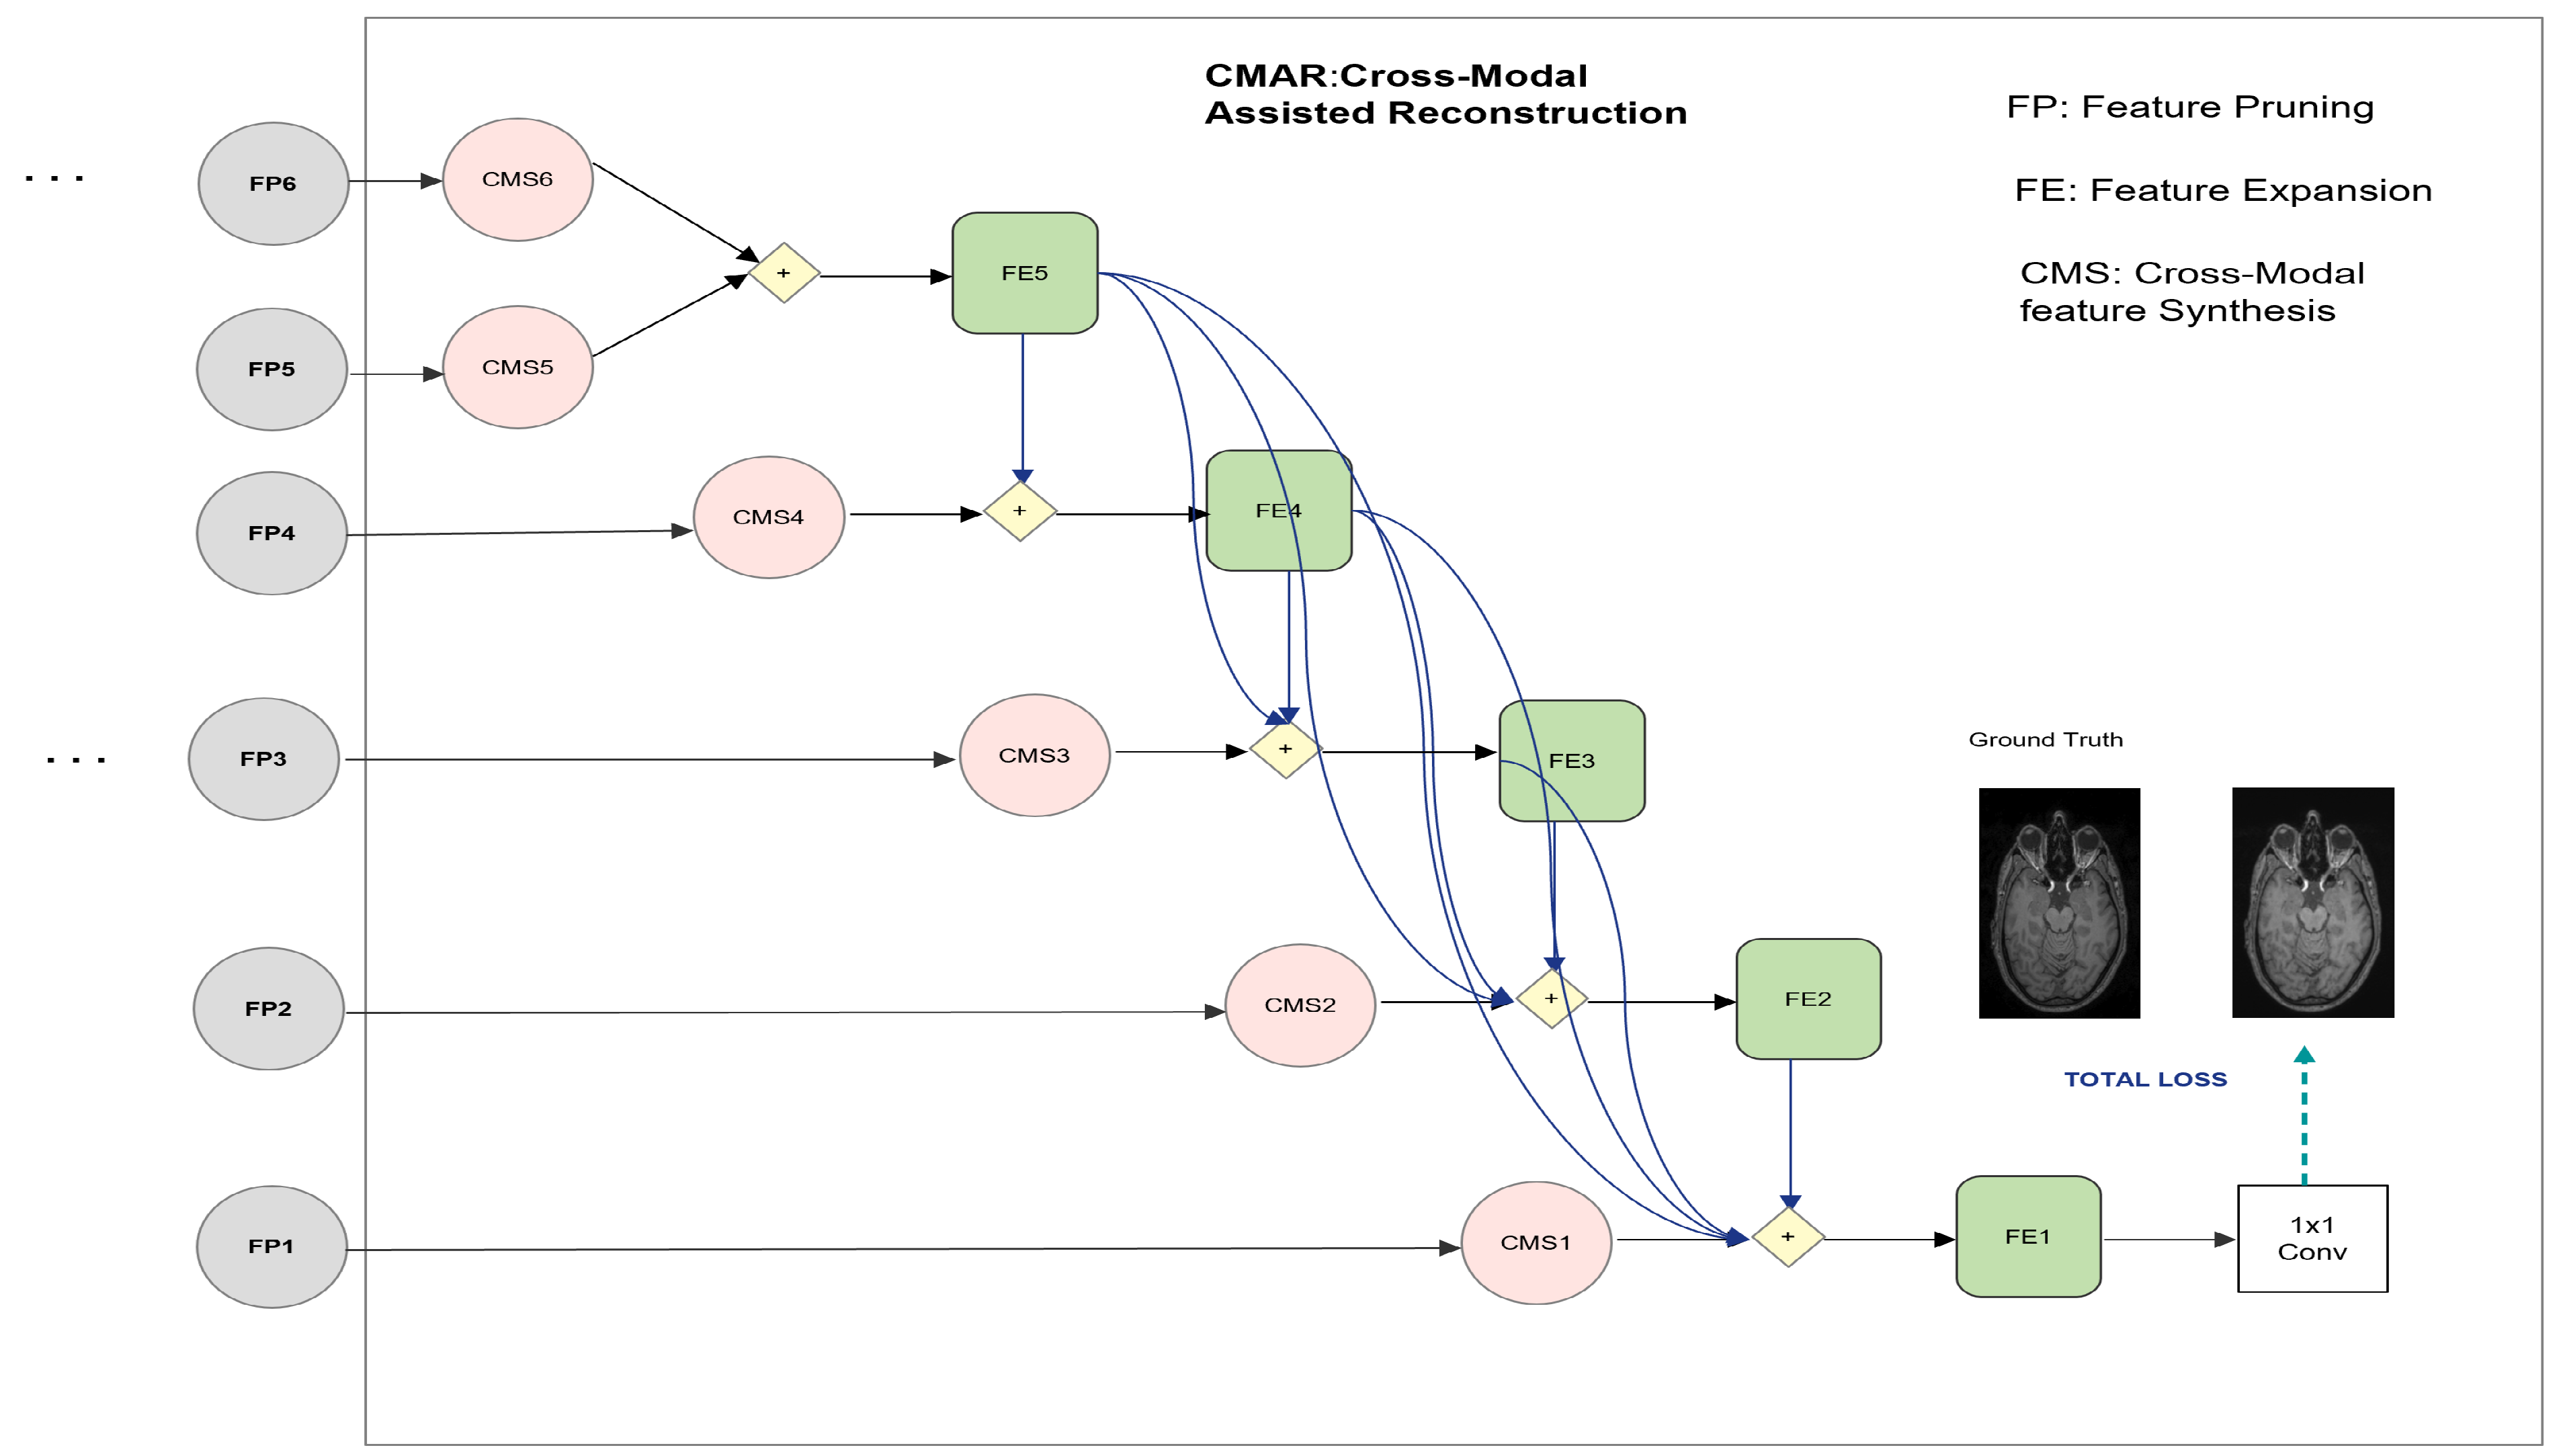
Figure 3.
Structure of Inception module.

Figure 4.
Comparison of registered and unregistered images. (a) T1. (b) T2-Unregist. (c) T2-Regist.

Figure 5.
Comparison of proposed method with state-of-the-art denoising methods: (a1) Noisy. (a2) NLM [10]. (a3) SURE [58]. (a4) BM3D [59]. (a5) MCDN [24]. (a6) FFD-Net [53]. (a7) . (a8) GT, Corresponding enlarged regions of the denoised images: (b1) Noisy. (b2) NLM [10]. (b3) SURE [58]. (b4) BM3D [59]. (b5) MCDN [24]. (b6) FFD-Net [53]. (b7) . (b8) GT.
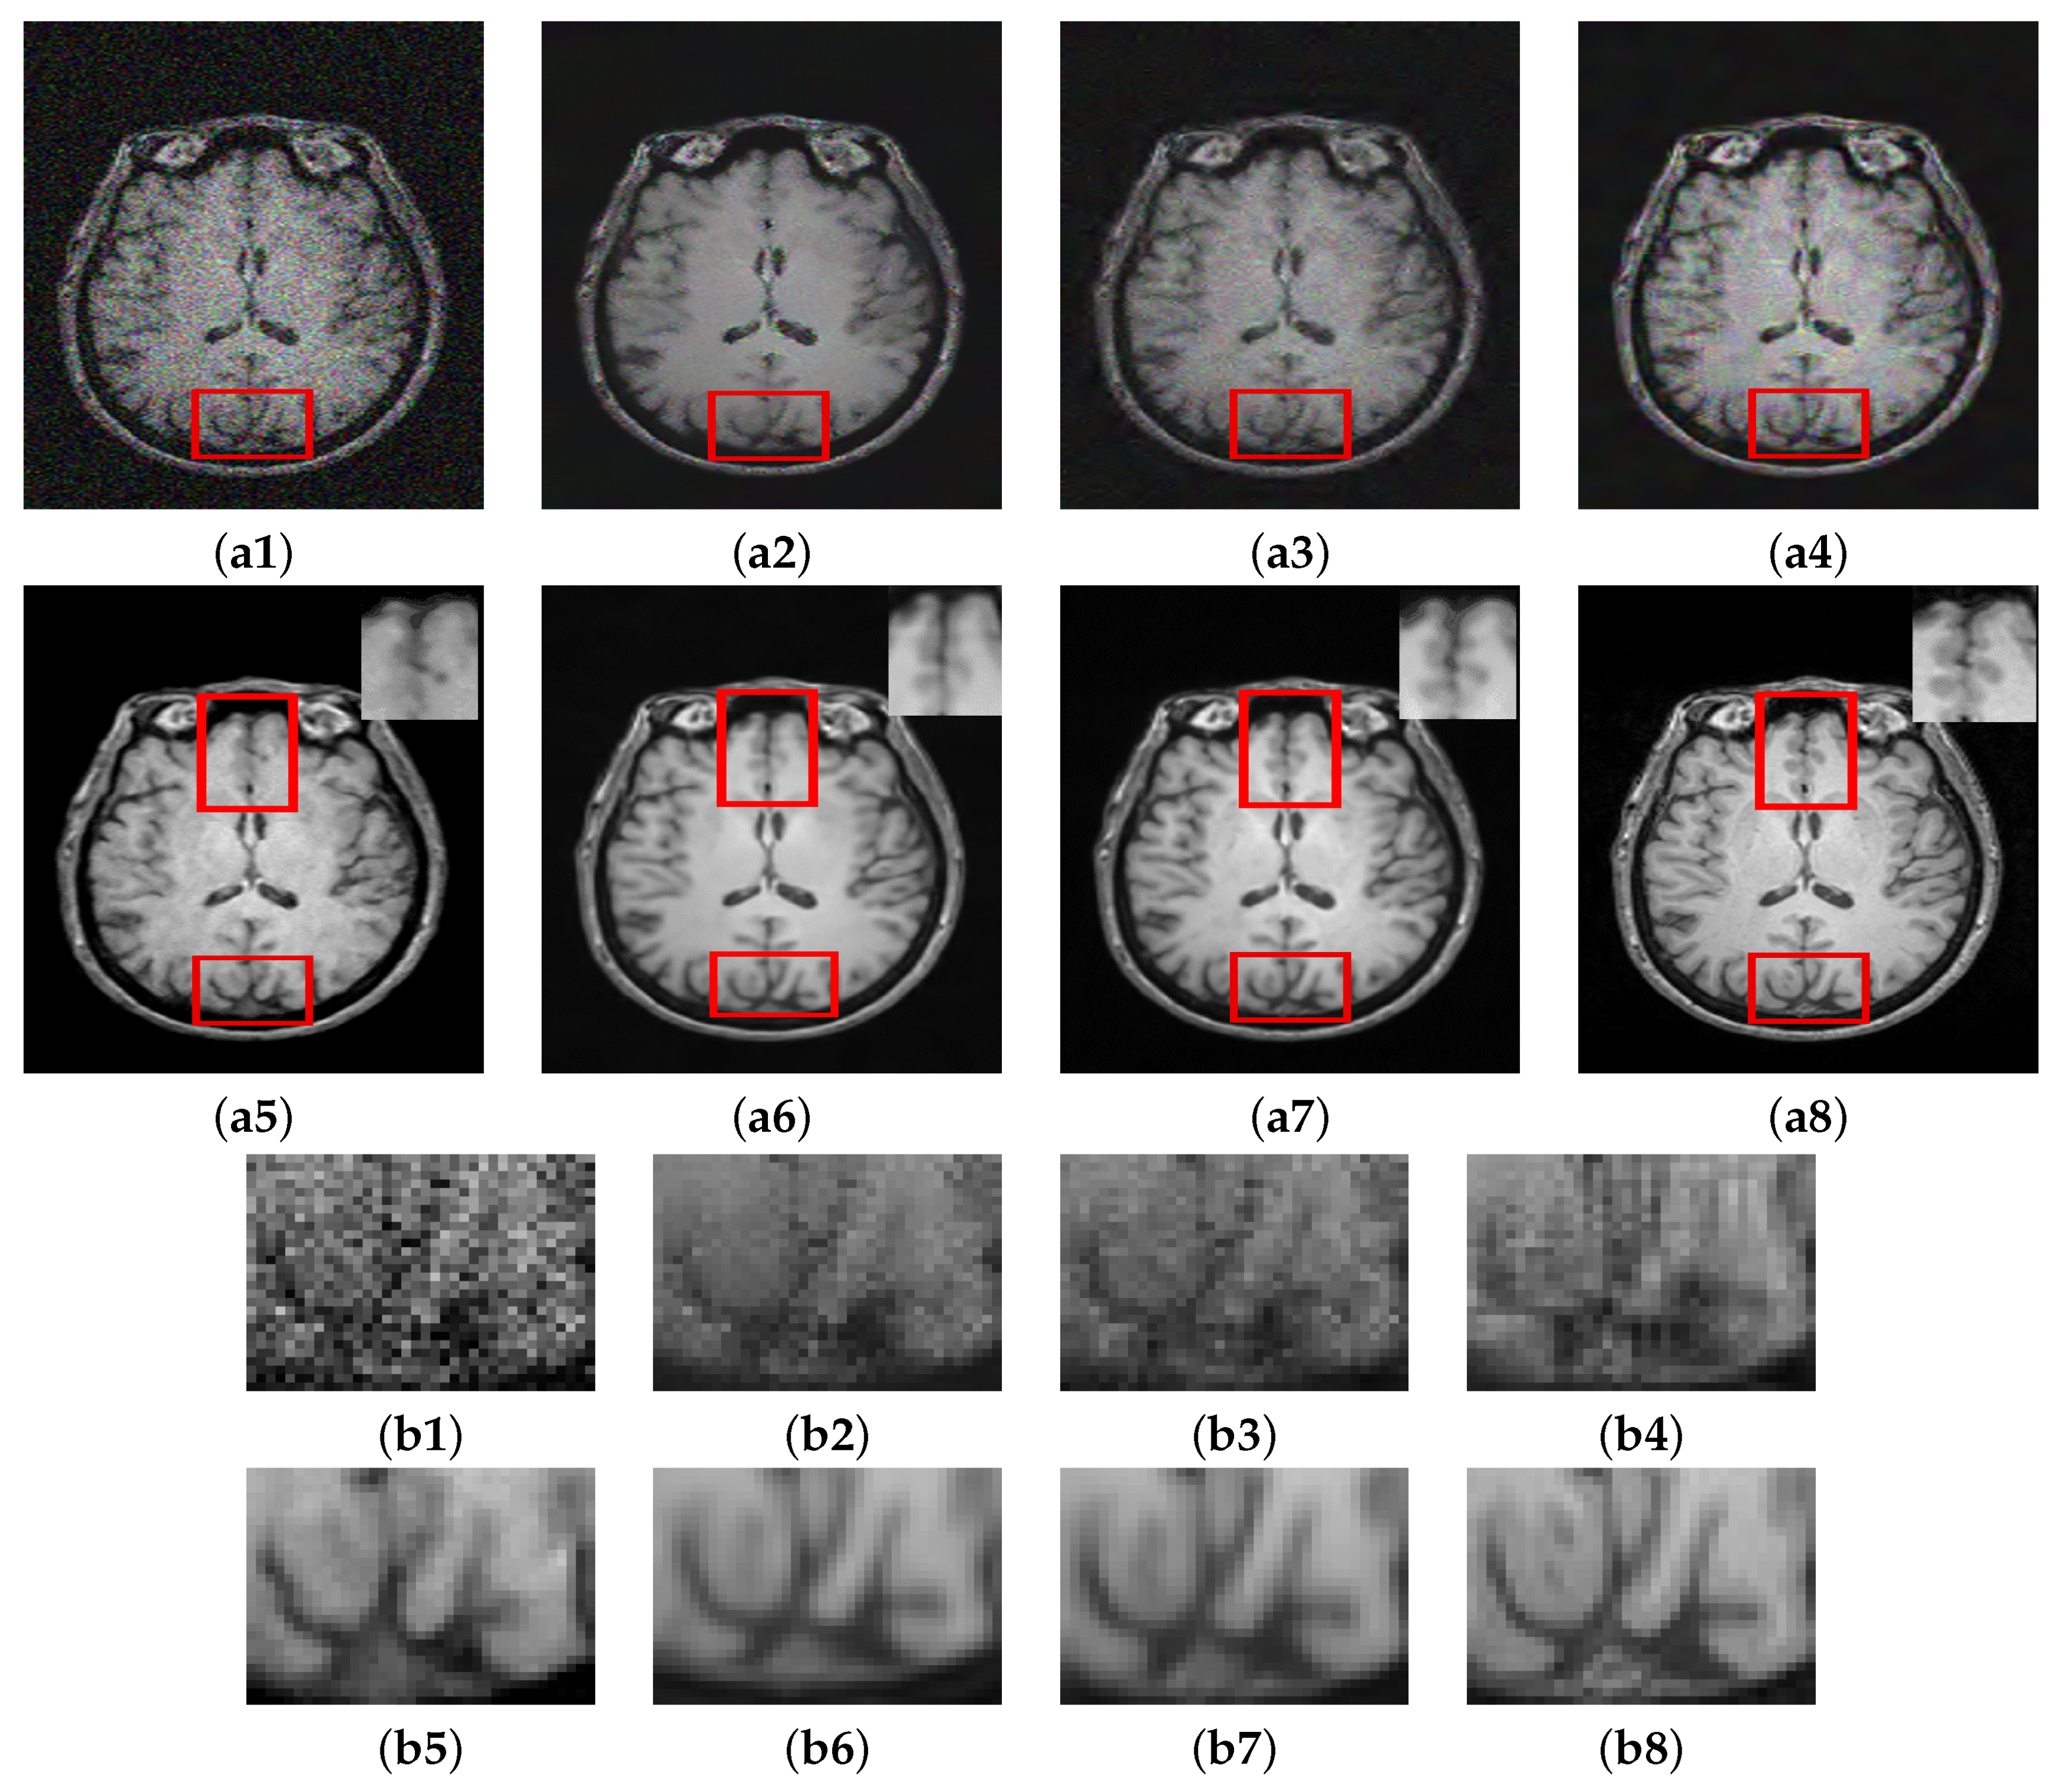
Figure 6.
Denoising Results: Noise Level 8%. (a1) Noisy. (a2) NLM [10]. (a3) SURE [58]. (a4) BM3D [59]. (a5) MCDN [24]. (a6) FFD-Net [53]. (a7) . (a8) GT.

Figure 7.
Comparison of proposed method with state of the art denoising methods. (a1) Noisy. (a2) NLM [10]. (a3) SURE [58]. (a4) BM3D [59]. (a5) MCDN [24]. (a6) FFD-Net. (a7) . (a8) GT.

Figure 8.
Role of using cross-modal guidance information in denoising: Results of method (a1) Noisy. (a2) Unreg. T2. (a3) Reg. T2. (a4) T1-T1. (a5) . (a6) . (a7) . (a8) . (a9) GT, Corresponding enlarged ROI (b1) Noisy. (b2) T1-T1. (b3) . (b4) . (b5) . (b6) . (b7) GT.
Figure 8.
Role of using cross-modal guidance information in denoising: Results of method (a1) Noisy. (a2) Unreg. T2. (a3) Reg. T2. (a4) T1-T1. (a5) . (a6) . (a7) . (a8) . (a9) GT, Corresponding enlarged ROI (b1) Noisy. (b2) T1-T1. (b3) . (b4) . (b5) . (b6) . (b7) GT.
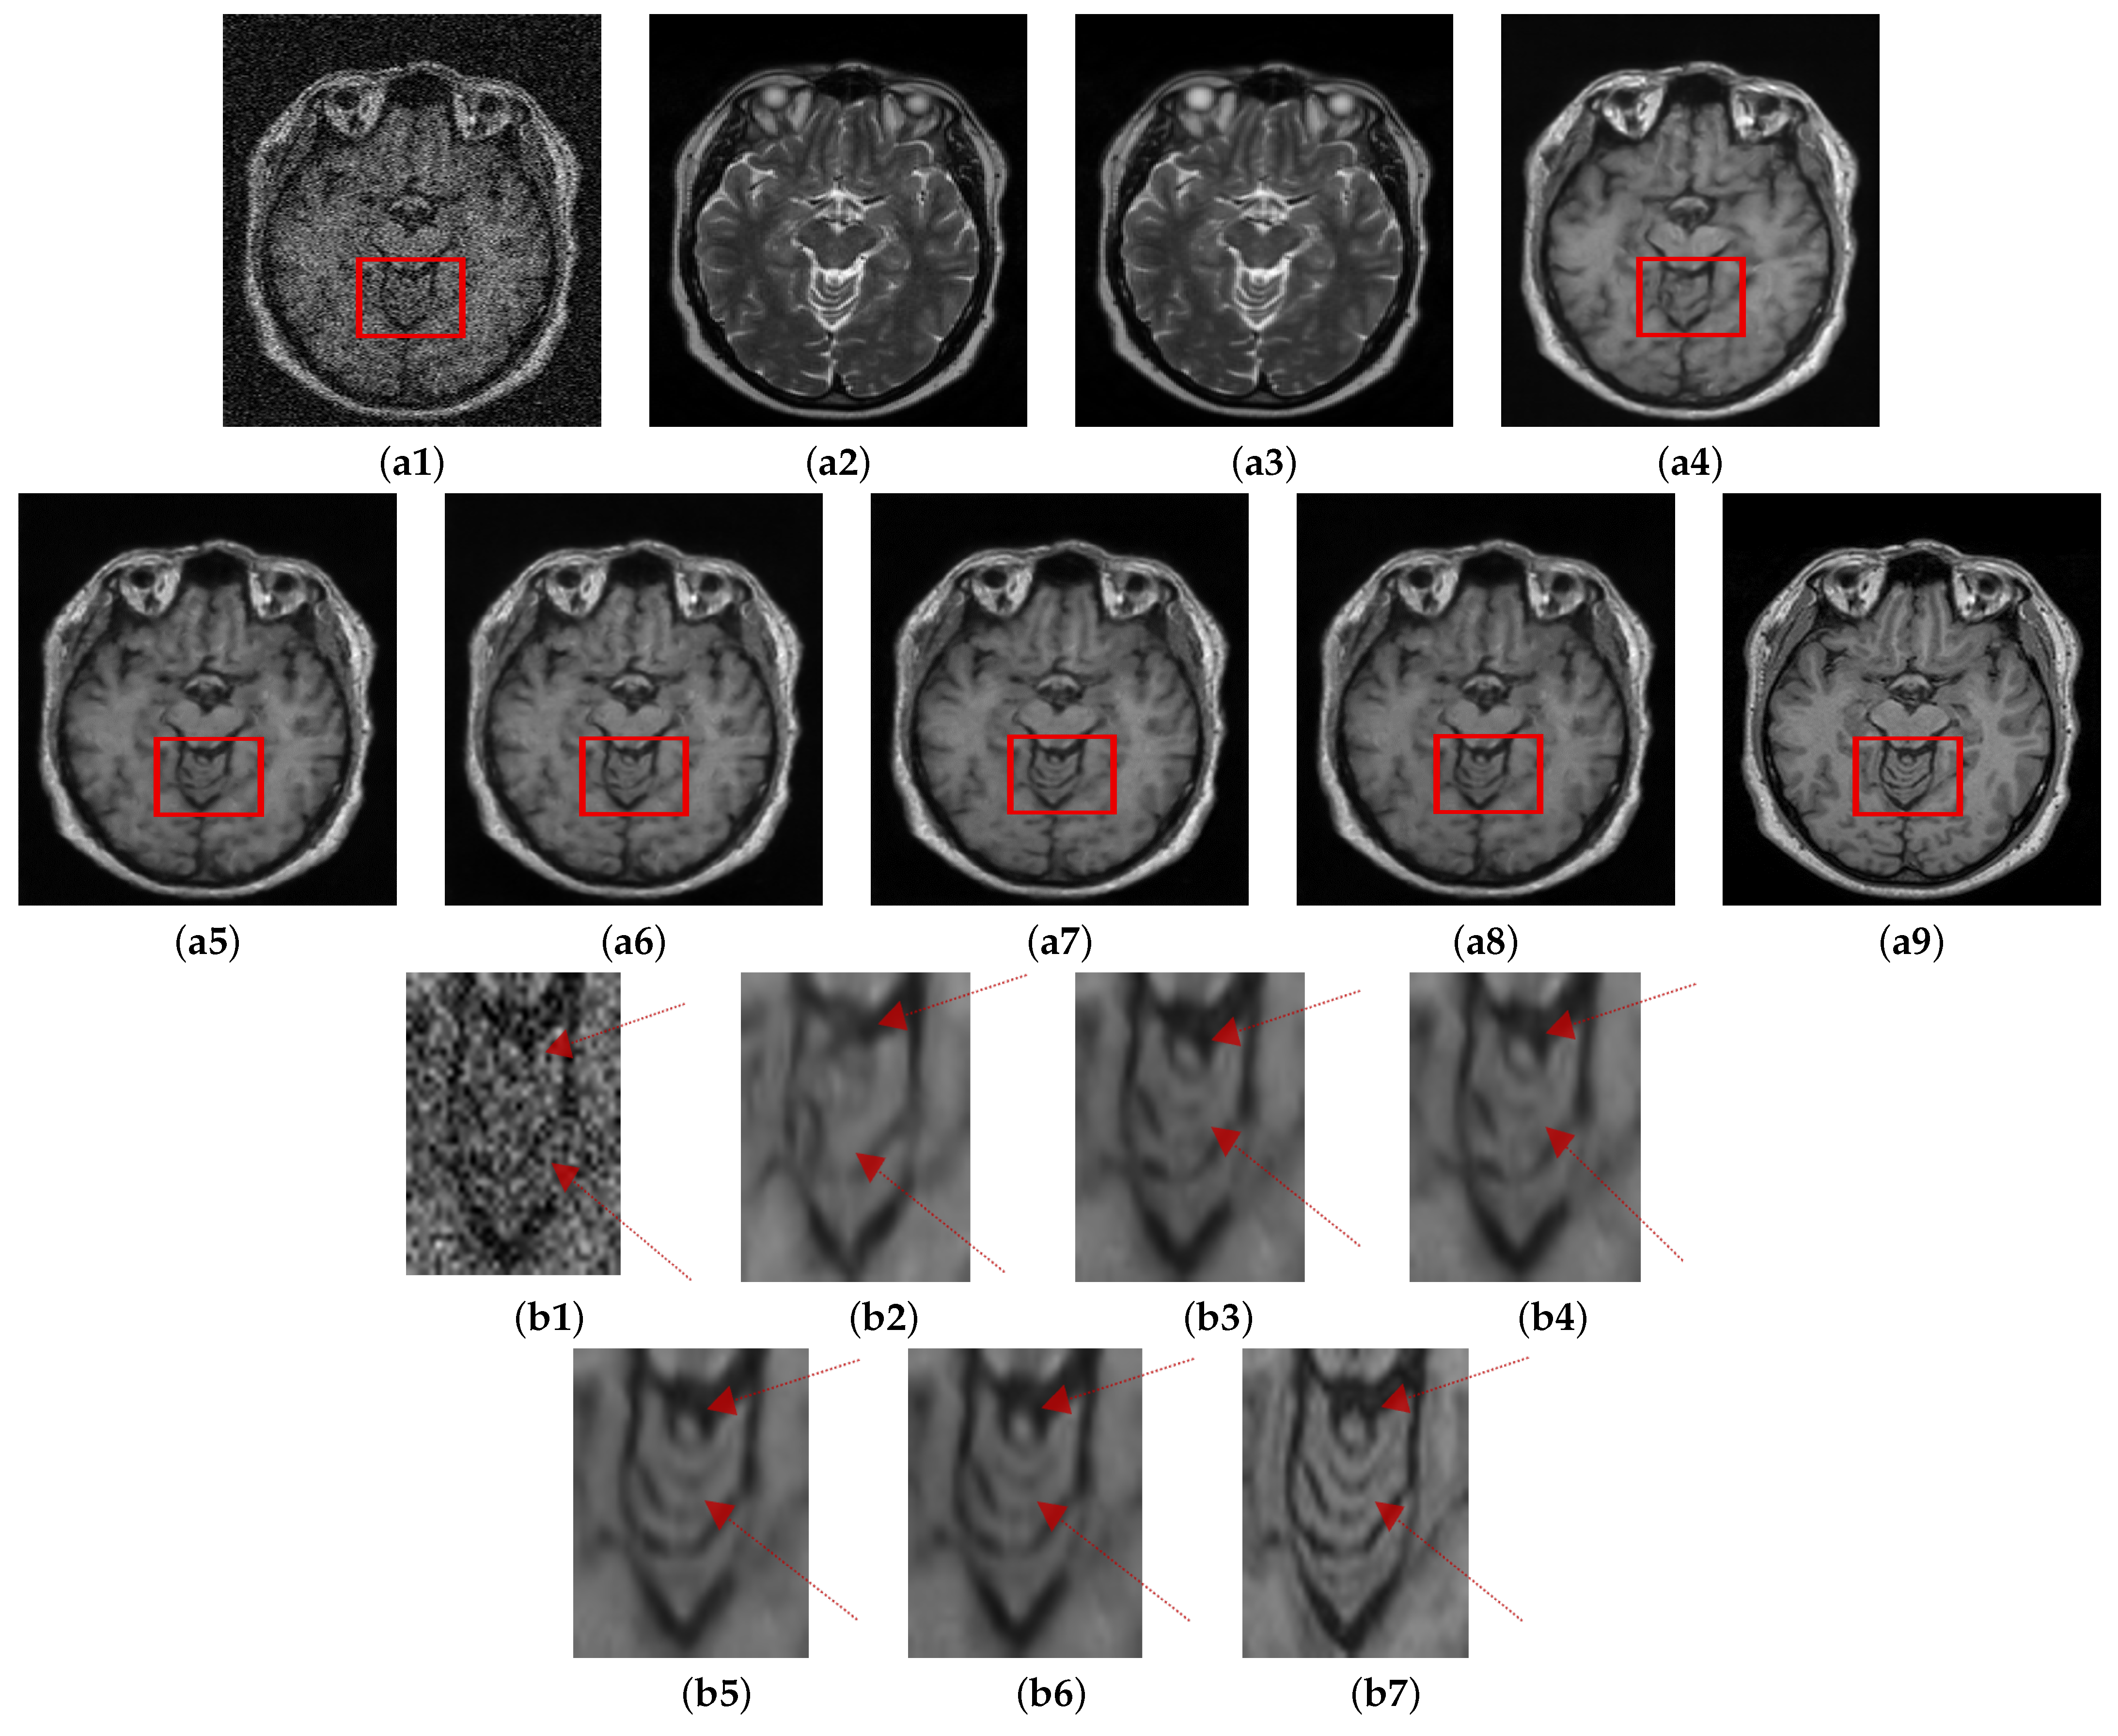
Figure 9.
Comparison of proposed method (different configurations). (a1) Noisy. (a2) Unreg. T2. (a3) Reg. T2. (a4) . (a5) . (a6) . (a7) . (a8) GT, Corresponding enlarged RoI: (b1) Noisy. (b2) . (b3) . (b4) . (b5) . (b6) GT.
Figure 9.
Comparison of proposed method (different configurations). (a1) Noisy. (a2) Unreg. T2. (a3) Reg. T2. (a4) . (a5) . (a6) . (a7) . (a8) GT, Corresponding enlarged RoI: (b1) Noisy. (b2) . (b3) . (b4) . (b5) . (b6) GT.


Table 1.
Variants of .
| Configuration | Data | Loss Function |
|---|---|---|
| Unregistered | MSE | |
| Unregistered | MSE + SSIM | |
| Registered | MSE | |
| Registered | MSE + SSIM |
Table 2.
PSNR(db)-SSIM values—HH Hospital Data.
| Level | Noisy | NLM [10] | SURE [58] | BM3D [59] | MCDN [24] | FFD-Net [53] | |
|---|---|---|---|---|---|---|---|
| 5% | 25.71 | 28.84 | 28.89 | 29.45 | 36.32 | 36.15 | 36.87 |
| 8% | 22.3 | 26.38 | 24.85 | 27.25 | 33.38 | 33.28 | 33.74 |
| 13% | 19.8 | 23.224 | 22.821 | 24.671 | 31.116 | 30.81 | 31.77 |
| Mean | 22.6 | 26.148 | 25.52 | 27.12 | 33.61 | 33.41 | 34.126 |
| 5% | 0.49 | 0.628 | 0.635 | 0.656 | 0.914 | 0.911 | 0.951 |
| 8% | 0.413 | 0.565 | 0.532 | 0.628 | 0.834 | 0.822 | 0.885 |
| 13% | 0.278 | 0.488 | 0.461 | 0.514 | 0.803 | 0.79 | 0.836 |
| Mean | 0.4 | 0.561 | 0.542 | 0.6 | 0.85 | 0.841 | 0.89 |
Table 3.
PSNR(db)-SSIM values—Guys Hospital Data.
| Level | Noisy | NLM [10] | SURE [58] | BM3D [59] | MCDN [24] | FFD-Net [53] | |
|---|---|---|---|---|---|---|---|
| 5% | 23.45 | 26.96 | 28.07 | 30.41 | 31.67 | 33.14 | 33.12 |
| 8% | 20.58 | 24.92 | 22.41 | 25.65 | 28.07 | 28.82 | 30.37 |
| 13% | 17.37 | 22.74 | 21.33 | 23.28 | 25.68 | 27.56 | 28.81 |
| Mean | 20.46 | 24.87 | 23.93 | 26.44 | 28.47 | 29.84 | 30.76 |
| 5% | 0.43 | 0.585 | 0.652 | 0.731 | 0.802 | 0.861 | 0.864 |
| 8% | 0.367 | 0.519 | 0.481 | 0.543 | 0.782 | 0.794 | 0.81 |
| 13% | 0.24 | 0.426 | 0.408 | 0.484 | 0.741 | 0.752 | 0.786 |
| Mean | 0.345 | 0.51 | 0.513 | 0.586 | 0.775 | 0.803 | 0.82 |
Table 4.
FSIM values—HH Hospital Data.
| Level | Noisy | NLM [10] | SURE [58] | BM3D [59] | MCDN [24] | FFD-Net [53] | |
|---|---|---|---|---|---|---|---|
| 5% | 0.868 | 0.9116 | 0.932 | 0.922 | 0.9414 | 0.946 | 0.954 |
| 8% | 0.825 | 0.922 | 0.914 | 0.922 | 0.9385 | 0.936 | 0.946 |
| 13% | 0.702 | 0.828 | 0.753 | 0.862 | 0.89 | 0.882 | 0.92 |
| Mean | 0.798 | 0.887 | 0.866 | 0.902 | 0.923 | 0.921 | 0.94 |
Table 5.
FSIM values—Guys Hospital Data.
| Level | Noisy | NLM [10] | SURE [58] | BM3D [59] | MCDN [24] | FFD-Net [53] | |
|---|---|---|---|---|---|---|---|
| 5% | 0.824 | 0.89 | 0.85 | 0.896 | 0.91 | 0.918 | 0.925 |
| 8% | 0.77 | 0.884 | 0.877 | 0.888 | 0.881 | 0.89 | 0.91 |
| 13% | 0.66 | 0.758 | 0.715 | 0.813 | 0.822 | 0.841 | 0.874 |
| Mean | 0.751 | 0.844 | 0.814 | 0.865 | 0.871 | 0.883 | 0.903 |
Table 6.
PSNR-SSIM values—HH Hospital Data (Variants of ).
| Metric | Noisy | ||||
|---|---|---|---|---|---|
| PSNR | 19.8 | 31.12 | 30.86 | 31.62 | 31.77 |
| SSIM | 0.278 | 0.787 | 0.764 | 0.811 | 0.836 |
Table 7.
PSNR-SSIM values—Guys Hospital Data (Variants of ).
| Metric | Noisy | T1-T1 | ||||
|---|---|---|---|---|---|---|
| PSNR | 17.37 | 26.52 | 28.44 | 28.21 | 28.63 | 28.81 |
| SSIM | 0.24 | 0.7 | 0.73 | 0.72 | 0.75 | 0.786 |
Publisher’s Note: MDPI stays neutral with regard to jurisdictional claims in published maps and institutional affiliations. |
© 2021 by the authors. Licensee MDPI, Basel, Switzerland. This article is an open access article distributed under the terms and conditions of the Creative Commons Attribution (CC BY) license (https://creativecommons.org/licenses/by/4.0/).
Share and Cite
MDPI and ACS Style
Naseem, R.; Alaya Cheikh, F.; Beghdadi, A.; Muhammad, K.; Sajjad, M. Cross-Modal Guidance Assisted Hierarchical Learning Based Siamese Network for MR Image Denoising. Electronics 2021, 10, 2855. https://doi.org/10.3390/electronics10222855
AMA Style
Naseem R, Alaya Cheikh F, Beghdadi A, Muhammad K, Sajjad M. Cross-Modal Guidance Assisted Hierarchical Learning Based Siamese Network for MR Image Denoising. Electronics. 2021; 10(22):2855. https://doi.org/10.3390/electronics10222855
Chicago/Turabian StyleNaseem, Rabia, Faouzi Alaya Cheikh, Azeddine Beghdadi, Khan Muhammad, and Muhammad Sajjad. 2021. "Cross-Modal Guidance Assisted Hierarchical Learning Based Siamese Network for MR Image Denoising" Electronics 10, no. 22: 2855. https://doi.org/10.3390/electronics10222855
Note that from the first issue of 2016, this journal uses article numbers instead of page numbers. See further details here.