
Survey on Machine Learning Algorithms Enhancing the Functional Verification Process


1
Si-Vision LLC, Cairo 11361, Egypt
2
Electronics Department, German University in Cairo, Cairo 11835, Egypt
3
Integrated Electronic Systems Lab, Technische Universität Darmstadt, 64283 Darmstadt, Germany
*
Author to whom correspondence should be addressed.
Electronics 2021, 10(21), 2688; https://doi.org/10.3390/electronics10212688
Submission received: 19 September 2021
/
Revised: 29 October 2021
/
Accepted: 30 October 2021
/
Published: 3 November 2021
(This article belongs to the Section Industrial Electronics)
Abstract
:The continuing increase in functional requirements of modern hardware designs means the traditional functional verification process becomes inefficient in meeting the time-to-market goal with sufficient level of confidence in the design. Therefore, the need for enhancing the process is evident. Machine learning (ML) models proved to be valuable for automating major parts of the process, which have typically occupied the bandwidth of engineers; diverting them from adding new coverage metrics to make the designs more robust. Current research of deploying different (ML) models prove to be promising in areas such as stimulus constraining, test generation, coverage collection and bug detection and localization. An example of deploying artificial neural network (ANN) in test generation shows 24.5× speed up in functionally verifying a dual-core RISC processor specification. Another study demonstrates how k-means clustering can reduce redundancy of simulation trace dump of an AHB-to-WHISHBONE bridge by 21%, thus reducing the debugging effort by not having to inspect unnecessary waveforms. The surveyed work demonstrates a comprehensive overview of current (ML) models enhancing the functional verification process from which an insight of promising future research areas is inferred.
1. Introduction
Design verification is the continuous process of checking whether a design meets the specification or not. Ideally, all possible inputs and internal design states should be exercised. Exhaustively testing all design state space is impractical [1] and the approach of writing independent test vectors to verify each state becomes highly infeasible given that about 70% of overall design activity is consumed by verification activities [1]. The practical approach used today to solve this problem is constrained random verification CRV. A verification plan is formed with the design features to cover and then input stimulus is randomly generated and fed to the design under test DUT with constraints to exercise the main state space. The constraints are manually adjusted to trigger corner cases, which were not covered using earlier constraints. For areas that are hard-to-hit, directed tests are written to trigger them [2]. This process of writing the constrained random and directed tests keeps the engineers busy and if improved, will free-up valuable time to be used for adding more features to be covered in the verification plan.
Another area that consumes time is the debugging process as a large amount of data is generated by the functional simulation of designs. This data is dumped by the simulation tool into a waveform database, which can be viewed to see how the DUT top-level inputs and outputs, internal signals and variables interact [3]. The more complex the design, the more signals are involved, and the more time is consumed in debugging sessions. The main challenge here is to reduce time taken by an engineer inspecting a waveform and converging to the simulation point of time where the bug resides.
Behavioral modelling of analog schematics is also one of the activities conducted during the verification process. Models are written in a behavioral manner to be executed along with other interacting digital modules. Modelling is a key process to speed up the simulation time, as SPICE simulators consume much more time running analog testbenches compared to behavioral model simulations. The behavioral modelling process involves a thorough analysis and understanding of the analog schematics with multiple coding iterations to ensure that an accurate representation of the native schematic is achieved. Traditionally, this modelling step takes a considerable amount of time until a reliable state is reached. This causes an overhead, hindering time-to-market delivery goals.
Regarding the key stages involved in the functional verification process, engineers spend considerable time writing assertions that ensure correct logical and timing relationships between design signals. These assertions are typically written in a manual effort, after extracting the specifications of the design at hand. Transforming a design’s intent into the assertion language of choice can be done in multiple ways, depending on the verification engineer who coded the assertion. Later, when the assertions are revised and/or debugged, often the original intent is lost in the translation. This can cause the testbench environment to hide issues if the assertions are missing some dependencies.
Another vital aspect in the verification process is coverage collection. It is the major factor that guides the process of hardware verification. Coverage metrics provide a means for judging the extensiveness of developed testcases, which exercise the features of a given design. They provide important feedback about areas that are not tested thoroughly enough, which indicates the need for testbench modifications. The process of collecting coverage for some metrics can add a noticeable overhead on a simulation’s performance, especially in the complex designs used today in the industry. Examples are condition coverage and line coverage, due to their nature of tracking a large set of reachable events.
Improving any stage from the aforementioned verification activities will free-up valuable time that can be allocated for functionally covering more design features [4]. The mentioned activities are only some of the promising areas where the flow can be enhanced. Ultimately, the goal is to reduce the time reaching 100% coverage closure. Figure 1 shows an abstract example of how time can be saved by adopting techniques that provide needed information, which closes the loop in the simulation.
Machine learning ML is a great candidate to automate such activities with potential to automate further items in the process. There exists multiple resources in the literature that incorporate ML modelling in the functional verification process. Some early trials date back to the 1990s [5] where genetic algorithm ML modelling is used to generate test cases, with the aim of speeding up coverage closure. Other attempts incorporated additional different ML models such as Markov models and inductive logic programming to reach a faster coverage convergence rate [6,7,8]. More recent research in the domain of stimulus and test generation used a combination of supervised and unsupervised ML models such as neural networks, random forest and support vector machines to reduce the amount of needed input iterations and testcases to reach the planned coverage goals [9,10,11,12,13,14,15,16,17,18,19,20,21,22,23,24,25,26,27,28]. In the scope of coverage collection, there are studies that show improvements in both the runtime of simulations that capture coverage and the percentage of coverage reached, when either a supervised or unsupervised ML model is used [29,30,31]. The commonly used unsupervised model is the k-means clustering algorithm and for the supervised model, the deep neural network. For enhancing the bug detection stage, multiple resources show positive results when ML models. Authors managed to decrease the time consumed in detecting and classifying debugging when ML is integrated into the verification environment [32,33,34,35,36,37,38,39,40]. Examples of the tested models by the authors include support vector machines, k-means clustering and density-based spatial clustering. The process of behaviorally modelling analog schematics also exhibited promising results. Neural networks and Angluin’s modified deterministic finite automata were used by different authors to significantly reduce the simulation time required to verify analog and mixed-signal designs [41,42,43,44]. Finally for the domain of writing and generating assertions, authors utilized different ML algorithms, such as decision trees, modified breadth-first decision trees and neural networks, to mine assertions from previously ran simulation traces. These efforts resulted in the generation of more effective assertions that captured subtle design dependencies, which designers preferred to use over manually written assertions [45,46,47,48,49].
The remainder of the paper is structured as follows. Section 2 presents the methodology followed in the proposed work, showing the approaches for collecting, organizing and synthesizing existing knowledge in the literature. In Section 3, different ML models along with a description of the problems, which they aim to solve are introduced. Research work showing examples of the great potential in different areas in the field is highlighted. Section 4 demonstrates the early work of incorporating ML in the verification process highlighting key models used. In Section 5, current research work in five crucial stages of the functional verification process: stimulus and test generation, coverage collection, bug detection, analog modelling and assertions generation are discussed. Section 6 shows a comparison of a selected set of research studies adopting neural network model for stimulus generation, providing the reader with an overview of ML impact in the verification environment. In Section 7, open challenges in the literature that can be tackled in future research are highlighted. Finally, concluding remarks and future insight are presented in Section 8.
2. Methodology
The methods for locating and identifying resources in the scope of the proposed survey involved accessing IEEE Xplore, Association for Computing machinery ACM, arXiv and Google Scholar databases. Multiple keyword descriptors were used in the search process within the aforementioned online digital libraries. The used keyword descriptors included functional verification, machine learning, neural networks, coverage closure, hardware verification, assertions, analog model, bug detection. During the search process for relevant articles, search engines utilized different combinations of the keyword descriptors. Some of the sentences that resulted in meaningful results included “Faster verification closure using machine learning”, “Accelerating functional verification coverage closure using Machine learning algorithms”, “Verification machine learning assertions”, “Machine learning in functional verification thesis”, “Functional verification neural networks”, “Machine learning hardware verification” and “Speeding up functional verification machine learning”. Another used method for attaining resources was conducted by following the references of relevant articles.
Relevance of found resources was decided using two main factors: (A) The resulting contribution enhances one or more stages in the functional verification process. (B) The contribution is achieved by a machine learning algorithm. For the first factor, the encapsulating stages of a functional verification environment were defined as: input stimulus and testcases generation, simulation traces debugging, assertions checking, coverage collection and RTL modelling. Figure 2 shows the layout of each stage in the verification process and the interconnection between them.
Resulting resources that target enhancements in the formal verification domain were excluded from the proposed work, as functional verification is simulated and executed dynamically while formal verification was ran statically. This key difference renders the performance comparison of the two processes incomparable, as each is utilized for different verification goals and their usage is not interchangeable. The second factor confines the enhancements to be with the means of ML algorithms only. Any improvement that was proposed with means such as scripting, simulation tooling, mixed HDL language coding solely is excluded from the surveyed work. If the resource was found to propose an ML model as the major contributor in the enhancement along with other means, then it was included in the proposed work.
Existing knowledge in the literature was found to be in the forms of journal and conference papers as well as published theses. Relevant resources were grouped thematically according to the functional verification stage in which an enhancement is proposed, as shown in Figure 2. The researched articles were examined quantitatively for information regarding contribution percentage, ML training samples count and number of tested RTL configurations. Qualitative information such as RTL complexity and proposed ML model scalability was also examined. Researched resources of the same thematic nature are synthesized in a tabular form and compared in terms of ML model approach, ML model type, RTL complexity and achieved contribution value, at the end of each respective verification stage section. The proposed survey work started by presenting a brief history regarding early attempts of ML incorporation that date back to late 1990s, in Section 4. The core of the proposed work, where multiple resources were found in the literature that target all the five areas shown in Figure 2, is demonstrated in Section 5.
3. ML Concepts and Adoptions
This section briefly explains key ML theory and shows different problems that ML can solve. Examples of vendors in the industry already incorporating ML in the verification process are presented. Interesting case uses of how ML can help making the process better are demonstrated.
3.1. ML Algorithms
ML algorithms employ a variant set of statistical, probabilistic and optimization techniques in order to learn from previous experience and detect useful patterns from complex, unstructured and large data sets [50]. There are different types of ML algorithms; each differ according to the type of problem it solves, data being input and output, and the approach the algorithm takes. Supervised and unsupervised learning are two types of the most used ML approaches.
Supervised learning SL algorithms are based on building a mathematical model by feeding it a data structure containing both the inputs and the desired outputs [51]. These algorithms learn a function, which is used in the prediction of the output correlated to the new inputs. SL algorithms can be further divided into different types: regression and classification [52]. In regression problems, a relationship is estimated between the outcome variable and one or more input variables, called predictors. Classification problems predict to what group a new input belongs.
Unsupervised learning UL algorithms [53], on the other hand, take a set of data containing only inputs, and try to find structure in that data set, by means such as grouping or clustering the data points. These algorithms learn from an unlabeled testing data that was not classified or categorized beforehand. UL algorithms try to find similarities in the input data and react based on how strong the similarity is. One of the most used unsupervised learning algorithms is clustering. In clustering [54], the input data structure is divided into different groups, and hence the name clustering, in a way that items in the same group share similarities more than items in other groups.
3.2. Adoption in the Industry
There are many areas where ML can be introduced to improve the verification process. Using EDA tools as an example, some of the promising areas are [55]:
- Specification and constraint mining:
- ○
- By adding the ability for a tool to learn from previous simulation waveforms and suggest constraints and assertions to decrease the time of design and verification cycle [56].
- Helping tool for automated troubleshooting:
- ○
- Smart tool capable of responding to questions from the designer by the means of natural language processing NLP about the verification environment like the simulation time of a specific event, drivers of signals, cause of failure, etc.
- Develop automated solver strategy for theorem proving:
- ○
- Automate the process of discovering the complex relationship between the logic to be proved and the suitable method to use for searching the proof.
- Debugging and root cause analysis:
- ○
- By learning from previous database of failures and their root causes, the use of design data can automate the process of tracing waveforms to find the root cause of a design bug.
- Inductive inference for environment modelling:
- ○
- In the area of formal verification and synthesis, structure hypotheses, inductive inference and deductive reasoning are integrated [57] to point out interesting issues in software running timing analysis.
Companies producing electronic design automation EDA tools started to utilize the power of machine learning in their products. For example, Cadence® Xcelium™ Logic Simulator incorporated an ML engine: Xcelium ML claiming to increase the verification throughput with up to 5× faster verification closure when running randomized regressions [58]. Another example is by Synopsys as they enhanced their tool: VC Formal® “Regression Mode Accelerator” with ML in the 2018.09 release. Synopsys claims 10× speed-up in the design and verification cycle [59].
4. Early Research
Early work in introducing ML to functional verification dates back to 1997. It was achieved through the use of genetic algorithms GA [5]. GA was used as a test generator for a cache access arbitration mechanism CAAM in a microprocessor. The GA based generator produces input instruction sets stimulus to trigger CAAM states, which were previously unhit by learning from the results of earlier ran instructions. Results show ≈13% increase in the number of states hit when using GA compared to traditional pseudo-random generator.
Another attempt in implementing ML models in functional verification was through the use of different Markov models [6]. Each model type was fed with a set of allowed design input values along with information about the probability of generating sequences from the inputs. Monitors attached to a simple pipeline reduced instruction set computer RISC processor: DLX acting as the DUT checks how well the DUT inputs are exercised based on specific user predefined key points. The stimulus is steered by the Markov models given the history of previously unhit inputs in order to better stress the design. Results show ≈10× reduction in sequence execution effort.
The work in [7] applied ML by using inductive logic programming ILP in guiding the stimulus generator to produce inputs that target unhit cover items based on the history of coverage analysis. The newly introduced ILP model was tested on a five-staged superscalar DLX processor. Results show improvement in hit rate by up to 20% compared to completely random stimulus generator.
Research in [8] compares between different approaches in incorporating ML in coverage directed test generation CDG. Genetic programming GP, GA, ILP and Markov Model approaches were compared. The study concluded that GA and GP based ML approaches prove to be the most mature and other studied approaches require additional effort to represent the problem at hand along with needed expert knowledge. ILP is a promising model to be used among the other approaches but requires further research to reach the same maturity level of GA and GP. Each approach was used on different DUTs and test environments.
5. ML in the Verification Process
In this section, usage of ML in main areas in the verification process is shown. Both supervised and unsupervised ML models were used. Results from using different models are presented, providing an insight on how a specific model can be useful for a problem at hand. A summary of key ML models used is demonstrated while noting the DUT complexity.
5.1. Stimulus and Test Generation
The work in [9] used both supervised and reinforcement ML algorithms to guide the stimulus generator to hit planned coverage metrics in two DUTs. Supervised DNN was used in the verification of a cache controller and Q-learning is used as the reinforcement learning RL algorithm on a RISCV-Ariane [10]. The cache controller DNN is trained to generate sequences that exercise four FIFOs, one per CPU port. This approach led to significant increase in triggering high average FIFO depth ≥ 4 when compared to normal random stimulus having average depth ≤ 1. Q-learning ML model in the RISCV-Ariane is used to better exploit the victim buffer in the processor’s data cache by increasing the probability of generating victims. Using this method led to an increase of ≈55% in triggering cache victims compared to ordinary random stimulus. Authors did not provide the DNN parameters used for reaching the presented results. This information would have provided the readers with a baseline from which further research can be conducted.
In [11], authors proposed using features in the e language along with universal verification methodology UVM [12] phasing to enable a DNN model learning from coverage results of a processor DUT. Coverage is dynamically read using Specman coverage API. Many tests are run in a regression and the DNN is trained. Results show 33% reduction in simulation time using this approach where the verification environment is dynamically phased to stop the simulation at any point in time, inject newly collected data and restart the phases. Critical modelling parameters such as hidden layers count, number of neurons per layer and activation function per layer are not presented by the authors. Authors in [13] used four-layered and six-layered DNN models on a simple three-level circuit: OR → Adder → Multiplexer. Training and testing were carried out on the Keras platform using JetBrains PyCharm IDE. 100 data sets were used for training. The model was able to predict output coverage hole of interest with ≥85% accuracy in majority of the test cases. Authors did not present the simulation speed up due to the usage of ML. Only the coverage performance is provided and this is not enough for concluding on the efficiency of the proposed model.
Continuing the research in [14], a three-layer ANN model is used as the stimulus generator in the functional verification of a simple CPU DUT to hit assertion coverage metrics. Each layer has a number of 32, 128 and 128 neurons respectively, thus forming the input, hidden and output layers. Rectified linear unit ReLU is chosen to be the activation function. The results from this research show that up to 40.2% of previously used testing stimulus can be eliminated. Simulation time is sped-up by factor up to 24.5× and assertion coverage is improved by factors ranging from 4.37× to 28.94×. Authors claim that DNN usage might not be proper due to the relatively small count of needed stimulus. A comparison between ANN and DNN would have supported this claim.
The work in [15] uses a varying width comparator as DUT with width ranging from one to five bits. Supervised ANN is used to generate the input stimulus. Open source Cocotb platform is used as the testbench. The advantage of using this platform is that it is written in Python where there is existing support for many ML algorithms. Results show significant improvement in terms of the number of iterations required to hit all coverage metrics. Setting the comparator width to 2, improvement is ≈2.75×. For width = 3, improvement is ≈10×. For widths ≥ 4, traditional randomization generator gives a segmentation fault and is not capable of reaching full coverage closure unlike the ANN model. A drawback of this study is that it only showcases a linearly behaving DUT and the results cannot be generalized to more complex non-linear designs. A limitation by this work is that non-linear complex designs are not tested using the proposed approach. This study is important for confirming the scalability of the findings.
In [16], SVM is used as a stimuli generator to remove the redundant stimulus generated by traditional pseudo-random generators. 64-bit RISC processor was used as a DUT. There were two coverage metrics: different sources of the program counter PC and the status transitions of branch target buffer BTB. Results show significant improvements by using SVM, as the total time, including time spent by the model learning, is considerably less than the time spent using the traditional randomization method as simulation is sped up by ≈20.5×. Authors limited their proposal to SVM models only. A performance comparison with other ML models, such as NN, would have exposed gaps, such as the training overhead cost of SVM.
SVM, DNN and random forest RF models were tested by the authors in [17] as stimulus generators for a quad-core cache DUT. Each cache is four-way associative. ML models were built in Python from the libraries: Scikit-Learn and Keras. Results from this work show considerable improvement in the verification process flow; as SVM, DNN and random forest improved the simulation time by 68.5%, 77% and 78%, respectively. Authors did not present how ML hyper-parameters were selected. This would have enabled the reader to form an understanding of how different the complexity is to train each ML model, for the proposed use case.
Focusing on the same area, research carried out in [18] filters tests that are highly likely to hit more coverage on an ALU DUT from a large pool of tests and exclude redundant tests to save simulation time. This is achieved by clustering. A database of 30,000 tests is used in the environment where SVM with a Gaussian kernel is trained with 5000 tests and the remaining 25,000 tests are divided and ordered by two means. First, outliers are applied. Secondly, remainder tests are considered. Results show promising findings as the filtration removed a large number of redundant tests with close final coverage and with much less simulation time. A speedup of ≈ 4× in reaching the same state coverage objective is achieved compared to running the complete test database. A limitation by the proposed work is that the scalability of proposed ML incorporation is not proven on other non-linear complex designs.
Research in [19] classifies tests into groups based on how likely a test is to contribute to code coverage closure. The contribution here is an automatically generated regression test list after changes in the DUT design files are provided clustering information. Unsupervised k-means clustering algorithm is used. Line, branch, condition and toggle coverage is collected and stored individually per test. k value is swept across to try a different number of clusters. Results show ≈77% reduction in the number of tests required to achieve the same coverage result when tested on a queue management DUT. Using the same model on a serial line interface DUT shows 4.6× reduction in the number of tests required. The proposed method of data transformation in R language is not presented by the authors. Providing the algorithm would have enabled the reader to form an understanding of the setup parameters and any accompanying limitations.
Authors in [20] used a recurrent neural network RNN for guiding the pseudo-random stimuli generator. A Codasip [21] uRISC 32-bit RISC processor was used as the DUT. The feedback loop takes input from both functional and code coverage metrics to modify the constraints generating instruction sets for the processor to achieve the coverage goal. Results show ≈28% speed up in reaching 85% of the total coverage goal compared to the traditional stimuli generation method. A key missing comparison in this work is between the proposed RNN model and the more commonly used ANN and DNN models. This would have justified the usage of RNN over traditional NN variations.
The work in [22] uses GA to enhance test generation compared to traditional input stimuli randomization in order to close coverage faster. Testing was carried out on a simple CPU modeled by an ALU, PC register and state machines with fetch and execute states. Coverage metrics were FSM states, Opcodes, carry flag setting and addition instruction carry flag. Results show that using GA, coverage for carry flag setting reached 45% compared to 13% using the typical random approach. For the addition instruction carry flag, GA reached 85% compared to 30% in the typical random approach. Scalability of the presented approach is not tested on more complex blocks in the chosen CPU, such as cache. This would have provided a notion of the portability of the approach to other complex RTLs.
In [23], an SVM classifier is used to select tests from a pool of testcases that will most likely hit new coverage targets. First a set of testcases are chosen for training the SVM model and each is executed individually. Then, coverage is collected from each testcase. Learning takes place by identifying the least hit coverage event and the corresponding driving test case for it. Learning is carried out by using a sequential minimal optimization SMO decomposition algorithm which is part of the quadratic programming QP methodology. Testing is carried out on a complex sub-block in a Bluetooth protocol adapter called: STREAMPROC. Results show 24% time savings when compared to the traditional randomization technique. Authors did not show the algorithm and flow of SVM integration with testbench code. This would have helped the reader form an understanding of the underlying synchronization between ML and the native testbench.
In the same area, research conducted in [24] builds on the work of [25] where the DUT is inspected continuously to see if the objective function, defined to be the planned coverage metric, converges or not. If no improvement occurred, the simulation is rewound, and new random stimulus is generated. A simple variable width comparator is used as the DUT with the assertion of the output when the two inputs match as the functional coverage metric. Two ML models employ learning from how the previous input stimulus affected the objective function. First, linear regression is used, and results show improvement in terms of required simulation iterations by ≈196× when the comparator width = 6. This result cannot be generalized to more complex designs, due to the linear nature of the coverage metric. To test non-linear behavior, ANN is applied with the coverage metric changed to be the cross product of the two input vectors. Results show impressive results as ANN model reached total coverage target using only 96 iterations. A key limitation by this work is that the shown ML enhancing algorithm is not tested on commonly used non-linear designs. This renders the scalability of reached results to be of question.
In the domain of analog and mixed-signal verification, authors in [26] utilized ML models to increase the coverage of process-voltage-temperature PVT simulations. The idea is that PVT simulations are traditionally run for a limited number of corner cases, in which the designers and verification engineers expect the RTL to misbehave. These corner cases are decided based on assumptions and expectations. This leaves other unexplored possible cases where bugs can be causing underlying silicon failures. A full sweep across the PVT range is not practical and is computer intensive. This problem guided the authors to develop a predictive model that can learn from existing PVT corners simulation databases and provide new corner combination that can be used in next simulations. An SVM regression model with a Gaussian kernel RBF is trained on existing PVT simulations of a Low-dropout regulator LDO. The goal is to reach the worst case PVT combination that will stress-test the LDO. The trained SVM model was capable after 76 iterations to locate the worst-case value, opposed to 605 traditional simulation iterations. This is an 87.43% decrease in the simulation cost. A gap exists in this work where authors explored the usage of SVM and stated that its more computationally efficient when compared to ANN. Showing comparative results between both ML models would have supported this claim.
Shifting focus to the digital verification domain, authors in [27] used a genetic algorithm GA to speed up the coverage closure of FIFO regressions. Authors started with the problem that latency stimulus generation, stalls injection, in the typical random manner is not enough for reaching the planned coverage goals. They trained a GA model that learns from existing simulation data and predicts new stimulus that will contribute to coverage. A 5-dimensional genotype vector is used for training the model. The assigned fitness function consists of multiple FIFO coverage metrics such as average fill depth, fill rate and peak RAM occupancy. Testbench consisted of two design units in a GPU. Usage of GA showed an increase in coverage by 163% and 88% in the two units respectively. Authors could have explored the performance of other ML models such as SVM since they are testing a DUT with relatively low complexity. This information would have been useful in comparing which ML model is faster and more accurate.
Authors in [28] proposed the usage of an unsupervised SVM model that selects a smaller number of tests from a given regression test suite, to reduce simulation time needed to reach coverage closure. This technique is based on finding a set of tests that are similar to each other, comparing this set to other test sets in terms of how similar they are, and run the outlying tests which will trigger new coverage items by reducing redundancy in the number of tests that are run. The authors carried out an experiment on an OpenSparc T1 64-bit open-source processor. Its Execution unit EXU which includes an ALU is chosen to test the impact of unsupervised SVM on reducing the redundancy in tests while maintaining a similar coverage outcome. Gaussian kernel is used with two starting domains of knowledge, that decide the definition of test-similarity. First on the ALU 32-bit word-level, the most and least five bits are given a higher weight. Secondly, one-hot tests are biased to be considered dissimilar while non-one-hot are considered similar. This directs the test selection to rarely pick a test from the non-one-hot set. Authors used a regression with 30,000 tests, from which 5000 were used for training the SVM model. Each test consists of a three consecutive ALU sequences. Each one has a combination of three elements: ALU OP, overflow-flag, zero-flag. There are six possible ALU operations. Toggle coverage is planned to be all possible combinations of the three sequences, i.e., (6 × 2 × 2)3 = 243. Two testbenches are run: one that uses the remainder 25,000 and another without the SVM prediction modelling. After running only ≈5500 tests, the SVM based model coverage reached 79% while the non-SVM reached 78%. The traditional testbench required ≈16,000 to reach the 79% mark. This is a decrease in redundancy by 65.6%. A limitation by this work is that it is tested on a relatively simple RTL. To generalize this promising finding, more complex RTLs should be tested, such as Caches, SerDes interfaces, and digital signal processing DSP cores.
Table 1 shows a comparison for the presented resources in this section. Key parameters configured in each work are shown.
5.2. Coverage Collection
Continuing in the clustering scope, work in [29] demonstrates how k-means clustering can be applied to group test that will most probably trigger toggle pair coverage data. In an initial run, a weekly regression consisting of 30,000 tests are run consuming 173.6 million simulation cycles, which resulted in discovering 24 failures with a unique signature of 4. After improvements in the model, a weekly regression of 10,000 tests consuming 59.9 million simulation cycles were run resulting in ≈3.4% improvement in No. of simulation cycles per test. A key gap in this work is that the author did not provide details on the DUT used.
Authors in [30] combined two ML models to optimize line and condition coverage collection from design modules. k-means clustering is used to select a portion of modules that better represent the design. Modules found to be closest to the cluster centroids are defined as “sampled modules”; while others are referred to as “unsampled modules”. DNN model is trained on the “sampled modules” to predict the coverage of “unsampled modules”. After training is complete, coverage of “sampled modules” is directly measured prediction is used to collect coverage from the “unsampled modules”. Results show 10× reduction in simulation runtime as traditional code coverage collection is conducted on only 3% of the design modules and the rest of coverage was predicted with only 2.8% mean absolute error. Although authors showed the code and functional coverage metrics used for evaluation the efficiency of proposed model, they did not mention the nature of tested RTL groups. This is key knowledge to confirm the scalability of the results on different design complexities.
In [31], a two-round clustering algorithm using k-means with Jaccard similarity is used to help narrow down the number of cross coverage items to analyze. In the first round, a binary connectivity matrix encodes the associations between cover-crosses. Cross coverage items with high correlation are clustered together. The second round then further divides the clusters into sub-groups based on the coverage ratio. Resulting clusters are analyzed, checking for largest contributors to low coverage. Results show that the nominated contributors to low coverage output from the two-round k-means clustering framework can add up to 53% additional coverage. In the experimental results section of this work, authors state that different industrial designs are tested, but the exact types are not presented. The given results indicate testing on ALU units, which are a relatively low complex. Validating the proposed results on complex designs is essential for the scalability of the results.
Table 2 shows a comparison for the presented resources in this section. Key parameters configured in each work are shown.
5.3. Bug Detection and Localization
Shifting focus to using ML models in speeding-up the functional verification process by decreasing the time consumed in detecting bugs in simulation waveforms and organizing dumped signals traces into groups; based on how related each one is in triggering an DUT event, authors in [32,33] proposed using k-means clustering to group signals trace segments that show high similarity and detect ones that are rarely triggered while simulating the design. The goal is to decrease the redundancy in simulation traces. Testing was carried out on multiple DUTs obtained from OpenCores [34] and a universal asynchronous receiver transmitter UART from [35]. Results show significant redundancy reduction of design trace dump in most of the tested DUTs. For example, UART-controller showed 51% reduction. AHB-to-WISHBONE Bridge showed 21% reduction. Although authors tested the performance of a proposed ML model in multiple RTL designs, a testing gap remains where the results need to be validated in other complex designs such as CPU caches, network on chips NoCs and PCIE controllers.
For debugging analog waveforms, research in [36] show unsupervised ML models such as k-means and density-based spatial clustering of applications with noise DBSCAN can be used to automate the grouping of scenarios with similar failing cause. Testing was carried out on eight DUTs using transient mixed signal waveforms. The feature to be tested in each DUT was a group of seven voltage signals that resembles the failing metric. Results show that both k-means and DBSCAN proved to be efficient in grouping waveforms with similar failing scenario; but DBSCAN showed to be more effective as it is inherently more immune to noise data, and therefore it is less likely to contain mismatches. Using DBSCAN caused a reduction in manual inspection effort by ≈14×. A gap exists in this work where authors did not mention the type of the tested analog circuit. This information along with further validation on complex designs is necessary for reliably scaling the reached findings.
Work in [37] uses a large database of log files resulting from many simulations to prove that using ML models in both clustering and classification of test failures based on the root cause is effective. For clustering, DBSCAN was used showing a score of 0.593 in the metric of adjusted mutual information AMI [38] and 0.545 in the adjusted rand index ARI [39] metric. k-means was used showing 0.505 and 0.480 results in above two metrics, respectively. The use of these two metrics was essential as we are interested in comparing the quality of the clusters not the labeling of samples. For classification, multiple algorithms were used such as random forest, decision tree, logistic regression and K-neighbors with random forest being the best performer with an accuracy of 0.907. Authors did not show a comparison of the simulation and debugging time saved when the proposed ML models were used. Even though a comparison between the ML models is provided, the major deciding factor for using ML is to speed up the verification process, and thus a timing comparison is essential.
In [40], authors proposed using an SVM classifier to optimize the process of ranking simulation files among different revisions from a version control database based on the probability of the files being the cause of simulation failure. Results show a 68% increase in ranking accuracy by using this model. Testing was done on eight DUTs obtained from OpenCores [34] where each design had a version-controlled repository with the incremental changes in design files versions to be used as input to the model. The scalability of achieved results needs validation on more industrial designs, as authors tested only a single design that falls under the silicon-proven category.
Table 3 shows a comparison for the presented resources in this section. Key parameters configured in each work are shown.
5.4. Analog Modelling
Moving on to the domain of analog designs verification, an early attempt is conducted by authors in [41] where a mealy machine that models the analog schematic behavior is derived from the design’s differential equations. The target is to reach faster simulation turnaround time, as digital simulations are known to be much faster than SPICE. This digital extracted model is a high-level approximation of the transistor-level activity. Authors extended the Angluin’s FSM learning deterministic finite automata DFA algorithm to be able to extract information from the analog simulation traces, which have a continuous-time and continuous-value nature. Authors validated their approach on two different analog blocks: a latch used in a high-speed I/O link and a non-ideal integrator. For the latch block, authors used a 7-clock-cycle unit function sequence that emulate the zero/one transitions observed at a latch’s input. Mealy machines are extracted at different voltage swing values: 2 V, 1.6 V and 1.3 V. For the three voltage swing values, authors claimed that SPICE simulations match the extracted meal machine model. For the integrator block, authors used a 1-s separated eight sequences for training the model. Mealy FSM is extracted at input voltage level: 0.67 V which showed four states where it can be easily seen that when the state value is all ones, the output is saturated at the positive supply value and when the state value is all zeros, the output is saturated at the negative supply value. There exists a noticeable gap in this work where the simulation time saved through the Mealy machine modelling is not compared to traditional SPICE simulation. Moreover, simulation waveforms that compare the response of both SPICE and Mealy machine models, which show the continuous time behavior throughout the simulation in both approaches, are not provided. This would have supported the authors claim of the matching between extracted models and the SPICE simulations.
More recent attempts are present in the literature. In [42], authors proposed the usage of ML to transform analog circuits into a behavioral digital model to speed up the verification of mixed-signal designs. First, authors run SPICE simulations on the transistor level to create a pool of data from which an ML model will be trained. Features are extracted from the SPICE simulations using dynamic mode decomposition DMD technique and are fed to the ML model for training. For the ML models, authors stated that they used decision trees DT to model digital circuitry and neural networks NN for the analog parts. These trained behavioral models are represented in Verilog/Verilog-AMS. A successive approximation register analog-to-digital converter SARADC circuit is used to validate this approach. Authors used the signal-to-noise distortion ration SNDR and output spectrum as the metrics for comparison between the performance of the Verilog ML behavioral model and the SPICE simulation. SPICE simulation showed a value for SNDR = 66.3 dB while the ML model showed a value of 65.6 dB, which are close. Authors state that a speed up >100× is achieved using ML modelling. An important gap in this work is that authors stated the ML models very briefly without mentioning the exact parameters used and how the SARADC sub-modules are decomposed into different ML models.
Authors in [43] presented an experiment where an industrial three-stage cross-coupled charge pump is behaviorally modelled using DNN. The goal is to reduce the time consumed simulating the analog block in SPICE and redirect this effort to faster digital simulations. In the beginning, authors ran the transistor level schematic to generate a dataset to train the ML model with. Training data included: supply voltage with the range: [1.2–3.6 V], load resistance: [100 k–1 M] sept logarithmically, clock frequency: [10–50 MHz]. Total number of training samples is 6870. Training data is pre-processed using Python. Multi-layer perceptron MLP model from the Scikit-learn Python ML library is used to train the dataset. Three hidden layers are used with the number of neurons in each: 50, 20, and 10. Selected activation function is the tanh with adam optimizer. The ML parameters are chosen as a result of a hyper-parameter search that optimizes the minimum requirements to represent the problem. Total time for training and pre-processing is 9 min. Usage of ML model caused a reduction in the simulation time by 96.78%. Simulation in SPICE took 7.77 s while the trained DNN model only took 0.25 s with an error percentage of 0.4%. A limitation in this research that the authors addressed is the tendency of prediction errors to happen at the boundaries of the training dataset. Author’s suggested that adding a safety margin during the training phase is helpful to mitigate this issue. Authors highlighted that more complex charge pump designs need to be investigated to study the generalization of their findings.
The same authors presented an experiment in [44], where they proposed a DNN model that represents the power consumption in behaviorally modelled analog block. The target is to achieve faster power simulations compared to SPICE. Manually written Verilog-AMS models do not represent power consumption of transistor level circuits. This is due to the complex nature of current transients that would be difficult to fully capture manually. Instead, authors worked on developing an ML assisted model capable of approximating the power transients in analog-mixed signals AMS circuitry. As a starting point, transistor level circuit of a low power relaxation oscillator is functionally modeled in Verilog/AMS. Simulations are run to acquire training data for enable, clock and frequency and current traces. Training data is preprocessed in Python and are fed to an MLP regressor model with two hidden layers. The number of neuros per layer are: 50 and 10 respectively. Tanh activation function is selected with a gradient descent optimizer. Training time consumed 3 min and 43 s on a 32-core processor. Authors ran mixed-signal simulations to compare the performance with the proposed DNN model versus the SPICE simulation. Transistor-level simulation took 2 min and 48 s, while the ML assisted sSystemVerilog simulation took only 12 s. This is a reduction of 92.85% in simulation time. This is achieved with an error percentage of only 2.7% in calculating the energy consumption. A gap is present in this research where only the relatively low complexity relaxation oscillator is tested. To confidently generalize the results, more complex oscillators and FSM power-controlled analog blocks need to be investigated.
Table 4 shows a comparison for the presented resources in this section. Key parameters configured in each work are shown.
5.5. Assertions Generation
In the area of writing checkers, [45] shows a novel approach in system Verilog assertions SVA development. Authors proposed the idea of developing a ML model that is capable of taking the assertion command in plain English and outputting the corresponding SVA syntax and vice versa. The problem, which the authors attempted to solve is the complex nature of SVA, where a written assertion can often be difficult to interpret and the original natural language descriptive intent behind the assertion can be lost in the SVA syntax. An SVA decoder ring is developed where the assertion syntax is produced using natural language processing NLP tools. To define the SVA rules on which the ML model is trained, authors used the program Another Tool for Language Recognition ANTLR written in Java language. The produced English language interpretation is not grammatically correct, thus authors need to feed the output to an ML model, which is trained on multiple sentences that are grammatically incorrect and their corresponding correct sentences. The used parameter for measuring for the quality of output language is the bilingual evaluation understudy score BLEU. Authors chose threshold value of 0.3. The training dataset was divided into two portions where 75% was used in training and 0.25% is used in testing. A recurrent neural network RNN is chosen as the ML model. A noticeable gap in this work is that authors provided examples of the SVA translation without stating the percentage of passing and failing translations. Moreover, details for the SVA commands used in training are not shown. This is critical as SVA assertions are complex and have many logical and timing operators. Therefore, the developed ML model can be overfitted to predict only a small portion of the SVA syntax. Finally, details on the used ML model are not provided such as the number of hidden layers, number of neurons per layer, activation function, number of training data samples and time cost for training the model.
Authors in [46] presented a novel approach of SVA generation from existing simulation database traces. This mining technique aims at reducing the manual labor effort of writing all possible assertions that exhaustively check given RTL properties. Authors claim that the auto-generation of assertions would save about 40% of the verification life cycle. A breadth-first decision tree BF-DT searching algorithm is proposed, which takes advantage of the fast search performance of a traditional binary tree, while expanding the tree nodes in a non-binary manner to cover all possible antecedents with automatic rejection of redundant paths. Authors used ≈34 × 106 simulation traces for multiple basic three-input based logic gates including: AND, OR and XOR, from which the full property checks for each gate are extracted. All assertions were generated without any redundancy after an extraction time cost of 87 min on a four-core commercial processor. Although authors show their developed BF-DT algorithm, the tool used for writing and executing the extraction model is not mentioned. Furthermore, the parameters used for modelling the BF-DT model are not presented and there is no information on how the simulation traces are pre-processed for the algorithm. Finally, the proposed BF-DT is not tested on more complex logic functions. This is necessary to confirm whether the proposed model is practical for industrial RTL blocks or not.
Continuing in the assertion extraction domain, work in [47] presents a similar mining technique where assertions are generated at the word level, i.e., for whole bit vectors of a given RTL input and output pins. Their work is extended from [48], which mines the assertions at the bit-level using a developed tool called GoldMine, that utilizes formal verification to extract the assertions. The aim of the work is to prove that word-level assertions are more efficient than bit-level ones in terms of the number of assertions generated, value of input state coverage and number of bugs detected. First, simulations are run to generate a database of traces from which words are grouped. Then, input words from the traces are fed into a supervised decision-based tree DT that employs the GoldMine algorithm. Assertions are generated based on the input words and any redundancy in the propositions are pruned. The model is tested on multiple industrial cores, such as MAC, I2C, Ethernet and OpenRISC written in Verilog. Synopsys VCS is used for simulating the designs and dumping the waveforms. The developed model communicates with the simulation tool through direct programming interface DPI. The assertions generation process finished after about 30 min on a four-core commercial processor. Results show an average reduction by 56% in the number of generated assertions when using the word-level model compared to original bit-level GoldMine. This is reflected into faster simulation runtimes, due to the less computational cost required by the reduction of assertions count. When the input space coverage is compared for the same number of assertions, word-level model was able to reach almost 90% while bit-level approach obtained only 36%. For the tendency of generating overly constrained assertions, word-level model shows an approximate 50% reduction in the average number of propositions compared to bit-level. Finally, word-level assertions where able to detect 31.79% more bugs on average when compared to bit-level assertions. Authors did not mention the size of simulation database traces used to train the model. This information is needed so readers can estimate how the results would vary according to the amount of simulation traces used.
In [49], the same authors expanded their GoldMine model by using a coverage guided assertion mining method, instead of the decision tree DT based model. Authors aimed at increasing the expressiveness of the assertions generated through the DT model, by introducing a coverage feedback loop from the design. Proposed algorithm is composed of a greedy set covering algorithm that is integrated with an association rule mining that runs iteratively. The role of the greedy set algorithm is to cover as high count as possible of uncovered objects, while elements that have not been covered remain. The association rule locates any correlation between multiple objects. For the application of assertions generation, the items to be covered are the Boolean combinations of a logical function’s truth table. Input and output values from previously run simulation traces are used to train the association mining engine. Assertions are generated when design input values are 100% correlated with the corresponding output value throughout the entire simulation cycles. The goal is to iteratively add propositions to an assertion’s antecedent until no more coverage gain increase is possible. Authors tested the proposed coverage guided approach on different RTLs used in the industry such as PCI, USB and OpenRISC. The proposed model is compared to the earlier GoldMine work employing decision trees DT. Simulation database traces of 10 × 103 cycles are used. Target input space coverage value is set to be 99% for both models. A commercial four-core processor with 16 GB of RAM is used for running the tests. For all the tested RTLs, assertions generated from the coverage guided model were able to reach 100% input space coverage after a maximum of 25 iterations exhibited on the PCI RTL. The proposed model had a maximum value of 1 h to run the and finish the algorithm on a USB RTL, with a RAM peak consumption of ≈4 GB. Authors claim that although this is not as fast as decision trees, the numbers are scalable to other industrial designs. Additionally, the novel approach showed a lower tendency of generating overly constrained assertion when compared to the DT model, since an average decrease by 2.75× in the number of propositions is achieved by the proposed model. Assertions show on average a 6.14× increase in coverage contribution when the coverage guided model is used. Some of the assertions exhibited a 30–40% coverage increase, as opposed to the DT generated assertions. Authors did not mention how their novel algorithm is connected to the simulator and whether any proprietary software is needed for the modelling. Knowledge of modelling connection is important for the readers to apply the proposed algorithm to other industrial models. Finally, the scalability claim by the author regarding the algorithm runtime and memory consumption needs to be validated on more complex designs.
Table 5 shows a comparison for the presented resources in this section. Key parameters configured in each work are shown.
6. Highlights of Neural Network Based Stimulus Generation Adoptions
In this section, we focus on an ML model that proved to be promising, due to its versatility among different RTL designs, in the verification process stage of stimulus and test generation. It was the ML model of choice in multiple research studies, shown in Section 4. We begin by first illustrating basic neural network NN theory. Then, we move to comparing the work conducted in three studies; all based on different implementations of NN and selected in a way to demonstrate how NN variations can be the ML model to choose when quick verification flow improvements are expected when bringing up the testbench. Approaches, evaluation processes, and results are the metrics on which the comparison is based on. Although the selected research contributions [13,14,20], differ in conditions on which work is conducted, Table 6 provide a means of contrasting and comparing different contributions.
6.1. Neural Network Concepts
Based on the biological neural network, the artificial neural network ANN was developed. The ANN, like a biological neural network, is made up of nodes that are connected in a way that neurons are. The node structure, network topology, and learning rules are all important aspects of a neural network. The number of inputs and outputs associated with the node, as well as the weight associated with each input and output, and the activation function, are all factors that influence how signals are processed by the node. The way nodes are organized and connected is defined by network topology. How the weights are set up and adjusted is determined by learning rules. Figure 3 shows a typical structure of a neural network NN.
Depending on the complexity for the problem at hand, NN different topologies are chosen. For a wide range of problems, a single hidden layer ANN is sufficient [60]. When the model is not representing the problem accurately enough, adding a second hidden layer can help in representing the state-space, and the model is called DNN. If data is seen to have hysteresis effect, where sequences of information across time result in a certain behavior, an RNN is used [61]. Choosing the number of hidden layers is only one deciding factor. Another important factor is the hidden layer neurons’ count. When the number of neurons is not sufficient, underfitting can happen where the model is not able to detect the input signals of a complex data structure. On the contrary, choosing too many neurons will cause overfitting, where the input information size does not accommodate the large number of neurons and therefore will not be able to train them.
6.2. Approach Comparison
- ML Model:
- ○
- Each selected research contribution is based on a variation of neural network model. The reason for selecting NN as a basis for the comparison is that it capable of modelling complex non-linear as well as linear problems [62]. There are multiple parameters involved in structuring an NN model that describe a problem well at hand with the capability of predicting inputs to the desired accuracy. The high count of degrees of freedom makes NN a versatile ML model suitable for the use case of prediction in stimulus generation in the verification process.
- ○
- Work in [14] used an ANN variant of the NN modelling with a single hidden layer. The input layer has a count of 32 neurons, hidden and output layers have 128 and 128 neurons count, respectively. ReLU is chosen as the activation function.
- ○
- The contribution in [13] uses DNN with a count of two hidden layers in one experiment and a count of four in another trial. The selected activation function was ReLU and it was the choice for the two trails conducted.
- ○
- The study in [20] used an RNN variant of NN which is similar to a traditional ANN, by having a single hidden layer but with the addition of memory effect, where outputs can be used as inputs. A total count of 41 neurons was used in structuring the RNN and a sigmoid function was the activation function of choice.
- DUT Complexity:
- ○
- In order to prove practicality of the novel approach, NN model performance needs to be investigated in a multiple DUTs varying in complexity. Testing performance on a relatively simple DUT, such as simple logic gates, proves the ability of the model to tackle the problem. Moving on to testing complex real-life designs provides confidence in the new technique; and indicates that using it in different cases that are similar in complexity is highly probable to provide positive results.
- ○
- Research in [14] used a dual-core RISC processor as a DUT incorporating a static pipeline with a unified memory. RSIC processors now are mature in the research and industry and are the basis of a new breed of open-source instruction set RISC-V [63], which has been a trending topic in research literature. Testing NN model performance on a case study implementing an RISC processor is of great interest as the results will indicate the performance of the novel approach in block-level testing other than system on chips SoCs.
- ○
- The study in [13] took the opposite approach in selecting the DUT to conduct the study. Authors used simple logic gates in their simulation iterations. They started with individual three-input NAND gate, three-input OR gate and a 2:1 multiplexer. They moved on to model more block level gates by testing on full adder and a 2-bit x 1-bit multiplier. Finally, they experimented on a simple system-level DUT consisting of a three-level circuit: OR → Adder → Multiplexer. The reason this study is of interest as it can be a quick starting point for a researcher to replicate and verify the impact of NN in a verification stimulus generation process and proceed to conducting new research using a more complex DUT.
- ○
- Work in [20] used a similar approach followed by [14], by using a uRISC [64] implementation form Codasip [21]. It is a 32-bit 400MHz four-stage pipelined processor. This approach is of interest as it acts as a stepping stone from [14] and yet not having the complexity imposed by a full RISC implementation used in [13].
- Availability of Simulation Tools:
- ○
- The use of well-known simulation tools and hardware/software languages in performing each research is important as it facilitates the reproduction of results, at the local end of the reader and makes the process of optimizing current findings in literature and reaching new contributions much smoother. Utilizing open-source tools is an added value mitigating the need to obtain licenses for application specific tools.
- ○
- In [14], MATLAB software is used with the included neural net pattern recognition toolbox to model the ANN model. For the DUT SystemVerilog [65] hardware description language HDL is used with the UVM library. MATLAB is not an open-source software. For modelling the DUT there exists cost-free simulators for modelling using RTL using SystemVerilog and UVM.
- ○
- Work in [13] used a complete open-source solution for modelling the DNN. Authors used the platform Keras through JetBrains PyCharm IDE along with Anaconda environment. SystemVerilog is referenced by the authors for modelling the DUT.
- ○
- Research in [20] used open-source Python 2.7 for modelling the RNN model. For structuring the DUT, SystemVerilog and UVM library were used.
6.3. Evaluation Comparison
The study in [14] used assertion coverage groups defined to be the goal of the verification plan. In the conducted experiments, traditional CDG is with random stimulus was the basis of the work and the ANN model was the novel technique to compare the results to. Authors had multiple assertion groups planned to investigate the performance of ANN across diverse targets. Contribution in [13] used a conventional pseudorandom number generator PRNG as the groundwork for driving the different DUTs; with the goal of reaching 100% functional verification coverage of the input combinations of the DUT. The performance of presented DNN contribution is compared to the pure PRNG method in hitting the same functional verification coverage holes. Research in [20] relied on a similar approach as [13] in using a traditional PRNG for driving DUT stimulus as the basis on which experimentation was conducted, targeting a planned set of functional coverage holes. The developed RNN model is used to direct the PRNG stimulus based on a prediction made by the trained model. Effectiveness of the novel technique is measured by comparing the simulation time consumed by both the traditional and novel approach in hitting the same percentage of the earlier defined functional verification coverage holes.
6.4. Results Comparison
The contribution presented by the three selected studies [13,14,20] targeted the same metric in the verification process, which is the reduction of time consumed in running HDL testbenches to verify the functional aspect of the design; while reaching the same percentage of the planned coverage groups. In [14], the use of ANN instead of purely randomizing the input stimulus caused a reduction in time consumed simulating the RTL by a factor up to 24.5×. The result in [13] was also positive where a speed up in the simulation cycle is observed while hitting 85% of the planned verification coverage metric. Finally, in [20] an improvement of 28% in the speed of simulating the testbench is achieved when using RNN for guiding the random stimulus to reach 85% of the complete planned functional cover groups when compared to the purely random approach of solely relying on a PRNG engine.
6.5. Discussion
In this section, we discuss some points in the methodology followed by each study from the selected set of contributions, [13,14,20].
- Choice of DUT:
- ○
- The two studies in [14,37] selected an RTL close to what is used by actual design teams, aiming at silicon fabrication. Choosing an RISC processor variant and testing the incorporation of NN in verifying it is a close trial of relating to industrial designs. However, work in [14] did not mention the number of logic gates to be simulated unlike in [20]. This would have given more insight on mapping the verification process improvement per gate count. DUTs used in [13] are simple logic gates and testing NN modelling in them would be a great starting point as a proof of concept. But the results cannot be generalized to more complex RTL involving thousands of gates with different dependencies between gate connections.
- Selection of NN Model:
- ○
- Work in [14] uses a single hidden layer for modelling the cover groups state space for the RISC processor used, while in [13] 2 and 4 hidden layers were used in forming a DNN to model the sate space for simple logic gates. Study [13] could have demonstrated the performance of a single hidden layer, as using only one can be sufficient for many problems [39] and the time overhead of training deeper NN grows exponentially as the depth increases. [13] also did not show the percentage of improvement in simulation time compared to the tradition simulation technique.
7. Open Challenges for Future Research
From the surveyed work, multiple challenges that can be addressed in future research are revealed. In the domain of stimulus and testcase generation, it is noticed that supervised learning techniques are much more investigated compared to unsupervised modelling. Researched work tends to use existing simulation data where a manual effort of labelling design features is exerted. This process of compiling, selecting and filtering design data for training is time consuming. The unsupervised ML approach aims to solve this issue, where the effort of manually inspecting RTL values and making sense of internal design dependencies is eliminated. Conducting more research involving unsupervised ML modelling is required, to unlock new possibilities of incorporating ML in the functional verification process. In terms of RTL types, more than 50% of the researched articles used ALU-based designs or simple combinational logic gates for testing the ML models. Only 11% of the resources test complex designs that are directly used in common industrial projects, such as processors. Authors would like to indicate that literature resources that include ML algorithms in verifying more complex industrial designs, such as PCIE, AI cores, network on chip NoC and phase locked loop PLL are missing. Figure 4 shows the distribution of supervised and unsupervised ML models in the stimulus and testcase generation domain found in the literature. Distribution of used RTL designs is also presented.
For the coverage collection category, it was found that all surveyed work uses the “k-means” clustering algorithm for predicting coverage results. Other clustering algorithms, such as DBSCAN, BIRCH and OPTICS, are neither tested nor compared against. The discussed resources were published in the late 2010s where multiple open-source ML modelling tools were widely available. This should have facilitated comparative research, where the performance of different clustering algorithms in predicting functional and code coverage is compared. This remains an open area for research.
In the scope of analog modelling, current resources in the literature achieved promising results with the use of ML algorithms, which led to a noticeable speed up in the verification process. Yet a research gap remains where a comprehensive study of the performance of different ML algorithms in modelling analog circuits is missing. Moreover, the tested analog blocks are integrated parts of more complex schematics, that are commonly used in the industry. Conducting future research on larger analog circuits such as PLLs, low-noise amplifiers LNA and whole serializers/deserializers SERDES links will magnify the current literature findings.
Results shown in the domain of assertions generation proved to enhance the functional verification flow in different ways. Assertions were successfully extracted in an automated manner by ML algorithms. Also, assertions were correctly translated from a natural language such as English to HDL syntax, and vice versa. Authors would like to hint that there is still a noticeable gap in the area of translating assertions, where a comprehensive engine capable of producing complex immediate and concurrent assertions is still not available. This is due to the complex nature of HDL assertions syntax, which involves multiple layers such as Boolean, sequences and properties. Developing a fully-integrated natural-language-to-assertions translator that can produce assertions for key industrial scenarios such as protocol alignment, SERDES Tx and Rx packet ordering, clock multipliers and dividers is still missing in the literature.
Finally, with the rapid and dynamic growth of the design and verification information, the traditional metrics used for evaluating the verification progress are not scaling with the same magnitude of the complexity increase of RTL and verification environment files. This issue exists due to the limitations of the conventional simulation analysis, tracking and summarization methods. As an example, verification engineers run multiple regressions per day where a large set of log and simulation trace files are produced. The typical approach of querying the verification progress and the existence of bugs is carried out manually. This is a critical bottleneck in the verification flow, as the needed information to close the verification activity is hidden and scattered in a large set of files. The process of extracting this information is a data mining problem at the core.
This is where big data analytics can help speed up the data processing flow. An example remedy is achieved with the use of ML models that cluster log files, while employing big data processing engines. Based on defined signatures, information such as percentage of the passing and failing tests, nature of existing bugs being a testbench or a design issue, and trend of bug occurrence per RTL module can be mined and reported in a fast and automated manner.
Another bottleneck in verification closure is the coverage reporting, analysis and hole debugging process. The traditional approach followed in the industry today involves querying code coverage metrics such as: line, toggle, branch and finite state machine, and manually planning functional coverage metrics that differ with RTL complexity. After simulations are run, the total coverage is collected by merging a large set of produced databases. The process of dumping and tracking the coverage databases is time consuming, which leads the verification engineers to selectively enable and disable the coverage reporting options in the simulators for the daily regressions. This selective enabling is carried out based on the verification progress, which dictates whether bug-fixing regressions take priority over a stable coverage-collecting regression or not. This can lead to code and functional coverage issues to be reported at a late stage, which will hinder the schedule of project delivery until the shortage in the planned coverage metrics is addressed and resolved. Utilizing big data analytic techniques can be a remedy to this coverage selective enabling tradeoff.
Employing mining ML algorithms with big data processing engines can facilitate the transformation of the unstructured data found in the log files and into coverage related information that can be organized, reported, analyzed and debugged faster than the conventional approach commonly used in the industry. Visual analytics of the collected code and functional coverage can provide insight on important information such as the confidence level of exercising a given RTL, the impact of each testcase in contributing to the total coverage, redundant testcases that are not providing useful coverage, trend of coverage convergence progress over time and an estimate of coverage closure dates.
8. Conclusions
In this paper, we explored how the use of different ML algorithms can speed up the functional verification process. Promising areas in the industry where ML can have immediate results were highlighted; examples of tool providers currently incorporating these techniques were mentioned. Specific areas in the functional verification process in which ML is integrated with the results from each research work were shown. For generating stimulus and tests, the use of multiple neural network NN models, such as ANN, DNN and RNN, show significant results in closing the coverage faster, thus proving to be a versatile model that can be used to model simple and more complex RTL. In the area of coverage collection, we saw that k-means was especially used as a means of grouping simulation data to reduce the manual labor involved in analyzing coverage results. For the scope of bug detection, both k-means and DBSCAN were used to group simulation traces with similar cause of failure and therefore reducing the redundancy in simulation waveforms to debug and speed up the process. In the domain of analog modelling, surveyed resources showed significant speedup in functional simulations with the use of ML models such as DNN and DT, when compared to traditional SPICE simulations. For the process of generating assertions, presented resources managed to extract effective assertions with the use of ML models, such as DT and RNN, from existing designs and from input natural language descriptions. This led to a noticeable reduction in the verification lifecycle timeline as well as coverage increase.
For future research, each ML model discussed can be stress tested on verification environments involving complex designs such as system on chips SoCs on both block and system level verification in each of the mentioned areas. Furthermore, incorporating ML technology to be a native feature in hardware verification methodologies, such as UVM, will significantly speed up coverage closure by converging to the planned coverage metrics faster.
Author Contributions
Conceptualization, K.A.I. and M.A.A.E.G.; methodology, K.A.I. and M.A.A.E.G.; validation, K.A.I. and M.A.A.E.G.; formal analysis, K.A.I. and M.A.A.E.G.; investigation K.A.I. and M.A.A.E.G.; resources K.A.I. and M.A.A.E.G.; data curation, K.A.I. and M.A.A.E.G.; writing—original draft preparation, K.A.I.; writing—review and editing, K.A.I.; visualization, K.A.I.; supervision, M.A.A.E.G.; funding acquisition, N/A. All authors have read and agreed to the published version of the manuscript.
Funding
This research received partial funding from TU Darmstadt.
Conflicts of Interest
The authors declare no conflict of interest.
References
- Vasudevan, S. Still a Fight to Get It Right: Verification in the Era of Machine Learning. In Proceedings of the 2017 IEEE International Conference on Rebooting Computing (ICRC), Washington, DC, USA, 8–9 November 2017; pp. 1–8. [Google Scholar]
- Mehta, A.B. Constrained Random Verification (CRV), ASIC/SoC Functional Design Verification; Springer: Cham, Switzerland, 2018. [Google Scholar]
- Sutherland, S. Extended VCD files. In Verilog—2001 The Springer International Series in Engineering and Computer Science; Springer: Boston, MA, USA, 2002; Volume 652. [Google Scholar]
- Spear, C.; Tumbush, G. SystemVerilog for Verification—A Guide to Learning the Testbench Language Features, 3rd ed.; Springer: Cham, Switzerland, 2012. [Google Scholar]
- Smith, J.E.; Bartley, M.; Fogarty, T.C. Microprocessor design verification by two-phase evolution of variable length tests. In Proceedings of the 1997 IEEE International Conference on Evolutionary Computation (ICEC ’97), Indianapolis, IN, USA, 13–16 April 1997; pp. 453–458. [Google Scholar]
- Wagner, I.; Bertacco, V.; Austin, T. StressTest: An automatic approach to test generation via activity monitors. In Proceedings of the 42nd Design Automation Conference, Anaheim, CA, USA, 13–17 June 2005; pp. 783–788. [Google Scholar]
- Hsueh, H.-W.; Eder, K. Test Directive Generation for Functional Coverage Closure Using Inductive Logic Programming. In Proceedings of the IEEE International High-Level Design Validation and Test Workshop, Monterey, CA, USA, 8–10 November 2006. [Google Scholar]
- Ioannides, C.; Eder, K.I. Coverage-Directed Test Generation Automated by Machine Learning—A Review. ACM Trans. Des. Autom. Electron. Syst. 2012, 17, 7. [Google Scholar] [CrossRef] [Green Version]
- Hughes, W.; Srinivasan, S.; Suvarna, R.; Kulkarni, M. Optimizing Design Verification using Machine Learning: Doing better than Random. In Proceedings of the Design and Verification Conference (DVCON-Europe), Virtual Conference, 26–27 October 2021. [Google Scholar]
- Zaruba, F. Ariane: An Open-Source 64-bit RISC-V Application Class Processor and Latest Improvements; ETH: Zurich, Switzerland, 2018; Available online: https://riscv.org/wp-content/uploads/2018/05/14.15-14.40-FlorianZaruba_riscv_workshop-1.pdf (accessed on 1 November 2021).
- Dinu, A.; Ogrutan, P.L. Opportunities of using artificial intelligence in hardware verification. In Proceedings of the 2019 IEEE 25th International Symposium for Design and Technology in Electronic Packaging (SIITME), Cluj-Napoca, Romania, 23 October 2019; pp. 224–227. [Google Scholar]
- Initiative, A.S. Universal Verification Methodology (UVM) 1.2 User’s Guide; Accellera Systems Initiative: Elk Grove, CA, USA, 2015. [Google Scholar]
- Gaur, P.; Rout, S.S.; Deb, S. Efficient Hardware Verification Using Machine Learning Approach. In Proceedings of the 2019 IEEE International Symposium on Smart Electronic Systems (iSES) (Formerly iNiS), Rourkela, India, 16–18 December 2019; pp. 168–171. [Google Scholar]
- Wang, F.; Zhu, H.; Popli, P.; Xiao, Y.; Bodgan, P.; Nazarian, S. Accelerating Coverage Directed Test Generation for Functional Verification: A Neural Network-Based Framework. In Proceedings of the Great Lakes Symposium on VLSI, ACM, New York, NY, USA, 23–25 May 2018; pp. 207–212. [Google Scholar]
- Varambally, B.; Sehgal, N. Optimising Design Verification Using Machine Learning: An Open-Source Solution. arXiv 2020, arXiv:2012.02453. [Google Scholar]
- Guo, Q.; Chen, T.; Shen, H.; Chen, Y.; Hu, W. On-the-Fly Reduction of Stimuli for Functional Verification. In Proceedings of the 2010 19th IEEE Asian Test Symposium, Shanghai, China, 1–4 December 2010; pp. 448–454. [Google Scholar]
- Gogri, S.; Hu, J.; Tyagi, A.; Quinn, M.; Ramachandran, S.; Batool, F.; Jagadeesh, A. Machine Learning-Guided Stimulus Generation for Functional Verification. In Proceedings of the Design and Verification Conference (DVCON-USA), Virtual Conference, 2–5 March 2020. [Google Scholar]
- Guzey, O.; Wang, L.; Levitt, J.R.; Foster, H. Increasing the Efficiency of Simulation-Based Functional Verification Through Unsupervised Support Vector Analysis. IEEE Trans. Comput.-Aided Des. Integr. Circuits Syst. 2010, 29, 138–148. [Google Scholar] [CrossRef]
- Ikram, S.; Ellis, J. Dynamic Regression Suite Generation Using Coverage-Based Clustering. In Proceedings of the Design and Verification Conference (DVCON-USA), San Jose, CA, USA, 27 February–2 March 2017. [Google Scholar]
- Fajcik, M.; Smrz, P.; Zachariasova, M. Automation of Processor Verification Using Recurrent Neural Networks. In Proceedings of the 2017 18th International Workshop on Microprocessor and SOC Test and Verification (MTV), Austin, TX, USA, 11–12 December 2017; pp. 15–20. [Google Scholar]
- Codasip Ltd. Codix Cobalt Processor Specification. 2017. Available online: https://riscv.org/wp-content/uploads/2016/07/Tue1430_RISC-V_Codasip-SecureRF_2016-07-12.pdf (accessed on 1 November 2021).
- Samarah, A.; Habibi, A.; Tahar, S.; Kharma, N. Automated Coverage Directed Test Generation Using a Cell-Based Genetic Algorithm. In Proceedings of the 2006 IEEE International High Level Design Validation and Test Workshop, Monterey, CA, USA, 8–10 November 2006; pp. 19–26. [Google Scholar]
- Romero, E.; Acosta, R.; Strum, M.; Chau, W.J. Support vector machine coverage driven verification for communication cores. In Proceedings of the 2009 17th IFIP International Conference on Very Large-Scale Integration (VLSI-SoC), Florianopolis, Brazil, 12–14 October 2009; pp. 147–152. [Google Scholar]
- Ambalakkat, S.M.; Nelson, E.G. Simulation Runtime Optimization of Constrained Random Verification using Machine Learning Algorithms. In Proceedings of the Design and Verification Conference (DVCON), San Jose, CA, USA, 25–28 February 2019. [Google Scholar]
- Nelson, E. Improving Constrained Random Testing by Achieving Simulation Design Goals through Target Functions, Rewinding and Dynamic Seed Manipulation. In Proceedings of the Design and Verification Conference, San Jose, CA, USA, 27 February–2 March 2017. [Google Scholar]
- Lin, H.; Ye, Z.; Khan, A.M. Machine Learning based PVT Space Coverage and Worst Case Exploration in Analog and Mixed-Signal Design Verification. In Proceedings of the Design and Verification Conference (DVCON), San Jose, CA, USA, 27 February–2 March 2017. [Google Scholar]
- Dhodhi, S.; Chatterjee, D.; Hill, E.; Godil, S. Deep Stalling using a Coverage Driven Genetic Algorithm Framework. In Proceedings of the 2021 IEEE 39th VLSI Test Symposium (VTS), San Diego, CA, USA, 25–28 April 2021. [Google Scholar]
- Guzey, O.; Wang, L.; Levitt, J.; Foster, H. Functional test selection based on unsupervised support vector analysis. In Proceedings of the 2008 45th ACM/IEEE Design Automation Conference, Anaheim, CA, USA, 8–13 June 2008. [Google Scholar]
- Sokorac, S. Optimizing random test constraints using machine learning algorithms. In Proceedings of the Design and Verification Conference (DVCON), San Jose, CA, USA, 27 February–2 March 2017. [Google Scholar]
- Roy, R.; Duvedi, C.; Godil, S.; Williams, M. Deep Predictive Coverage Collection. In Proceedings of the Design and Verification Conf. (DVCON), San Jose, CA, USA, 26 February–1 March 2018. [Google Scholar]
- Mandouh, E.E.; Salem, A.; Amer, M.; Wassal, A.G. Cross-product functional coverage analysis using machine learning clustering techniques. In Proceedings of the 2018 13th International Conference on Design & Technology of Integrated Systems in Nanoscale Era (DTIS), Taormina, Italy, 9–12 April 2018; pp. 1–2. [Google Scholar]
- El Mandouh, E.; Wassal, A.G. Accelerating the debugging of FV traces using K-means clustering techniques. In Proceedings of the 2016 11th International Design & Test Symposium (IDT), Hammamet, Tunisia, 18–20 December 2016; pp. 278–283. [Google Scholar]
- El Mandouh, E.; Wassal, A.G. Application of Machine Learning Techniques in Post-Silicon Debugging and Bug Localization. J. Electron. Test 2018, 34, 163–181. [Google Scholar] [CrossRef]
- Opencores Benchmarks. Available online: http://opencores.org (accessed on 1 November 2021).
- Allan, G.; Chidolue, G.; Ellis, T.; Foster, H.; Horn, M.; James, P.; Peryer, M. “Coverage Cookbook”, Siemens. Available online: https://verificationacademy.com/cookbook/coverage (accessed on 1 November 2021).
- Reinhold, T.; Seeland, M.; Grabmann, M.; Paintz, C.; Maeder, P.; Glaeser, G. Ain’t got time for this? Reducing manual evaluation effort with Machine Learning based Grouping of Analog Waveform Test Data. In Proceedings of the ANALOG 2020, 17th ITG/GMM-Symposium, Online, 28–30 September 2020; pp. 1–6. [Google Scholar]
- Truong, A.; Hellstrom, D.; Duque, H.; Viklund, L. Clustering and Classification of UVM Test Failures Using Machine Learning Techniques. In Proceedings of the Design and Verification Conference (DVCON), San Jose, CA, USA, 26 February–1 March 2018. [Google Scholar]
- Vinh, N.X.; Epps, J.; Bailey, J. Information theoretic measures for clusterings comparison: Variants, properties, normalization and correction for chance. J. Mach. Learn. Res. 2010, 11, 2837–2854. [Google Scholar]
- Hubert, L.; Arabie, P. Comparing partitions. J. Classif. 1985, 2, 193–218. [Google Scholar] [CrossRef]
- Maksimovic, D.; Veneris, A.; Poulos, Z. Clustering-based revision debug in regression verification. In Proceedings of the 2015 33rd IEEE International Conference on Computer Design (ICCD), New York, NY, USA, 18–21 October 2015; pp. 32–37. [Google Scholar]
- Gu, C.; Roychowdhury, J. FSM model abstraction for analog/mixed-signal circuits by learning from I/O trajectories. In Proceedings of the 16th Asia and South Pacific Design Automation Conference (ASP-DAC 2011), Yokohama, Japan, 25–28 January 2011. [Google Scholar]
- Leng, Y.; Ye, Z.; Xin, J.; Wang, Z.; Wang, Y. Automatic Digital Modeling for Analog Blocks in Mixed-Signal Verification. In Proceedings of the 2021 China Semiconductor Technology International Conference (CSTIC), Shanghai, China, 14–15 March 2021. [Google Scholar]
- Grabmann, M.; Landrock, C.; Glaeser, G. Machine Learning in Charge: Automated Behavioral Modeling of Charge Pump Circuits. In Proceedings of the SMACD/PRIME 2021, International Conference on SMACD and 16th Conference on PRIME, Online, 19–22 July 2021. [Google Scholar]
- Grabmann, M.; Feldhoff, F.; Gläser, G. Power to the Model: Generating Energy-Aware Mixed-Signal Models using Machine Learning. In Proceedings of the 2019 16th International Conference on Synthesis, Modeling, Analysis and Simulation Methods and Applications to Circuit Design (SMACD), Lausanne, Switzerland, 15–18 July 2019. [Google Scholar]
- Gulliya, N.; Bora, A.; Chaudhary, N.; Kaur, A. Using Machine Learning in Register Automation and Verification. In Proceedings of the Design and Verification Conference (DVCON), San Jose, CA, USA, 25–28 February 2019. [Google Scholar]
- Hanafy, M.; Said, H.; Wahba, A.M. Complete Properties Extraction from Simulation Traces for Assertions Auto-generation. In Proceedings of the 2015 IEEE 24th North Atlantic Test Workshop, New York, NY, USA, 11–13 May 2015. [Google Scholar]
- Liu, L.; Lin, C.; Vasudevan, S. Word level feature discovery to enhance quality of assertion mining. In Proceedings of the 2012 IEEE/ACM International Conference on Computer-Aided Design (ICCAD), San Jose, CA, USA, 5–8 November 2012. [Google Scholar]
- Vasudevan, S.; Sheridan, D.; Patel, S.; Tcheng, D.; Tuohy, B.; Johnson, D. GoldMine: Automatic assertion generation using data mining and static analysis. In Proceedings of the 2010 Design, Automation & Test in Europe Conference & Exhibition (DATE 2010), Dresden, Germany, 8–12 March 2010. [Google Scholar]
- Sheridan, D.; Liu, L.; Kim, H.; Vasudevan, S. A Coverage Guided Mining Approach for Automatic Generation of Succinct Assertions. In Proceedings of the 2014 27th International Conference on VLSI Design and 2014 13th International Conference on Embedded Systems, Mumbai, India, 5–9 January 2014. [Google Scholar]
- Mitchell, T.M. Machine Learning WCB; McGraw-Hill: Boston, MA, USA, 1997. [Google Scholar]
- Russell, S.J.; Norvig, P. Artificial Intelligence: A Modern Approach, 3rd ed.; Prentice Hall: Hoboken, NJ, USA, 2010. [Google Scholar]
- Alpaydin, E. Introduction to Machine Learning, 3rd ed.; MIT Press: Cambridge, MA, USA, 2019; pp. 5–11. [Google Scholar]
- Hinton, G.; Sejnowski, T. Unsupervised Learning: Foundations of Neural Computation; MIT Press: Cambridge, MA, USA, 1999. [Google Scholar]
- Tomasev, N.; Radovanovic, M. Clustering Evaluation in High-Dimensional Data. In Unsupervised Learning Algorithms, 1st ed.; Springer: Cham, Switzerland, 2016; pp. 71–107. [Google Scholar] [CrossRef]
- Pandey, M. Machine learning and systems for building the next generation of EDA tools. In Proceedings of the 2018 23rd Asia and South Pacific Design Automation Conference (ASP-DAC), Jeju, Korea, 22–25 January 2018; pp. 411–415. [Google Scholar]
- Giantamidis, G.; Tripakis, S.; Basagiannis, S. Learning Moore machines from input–output traces. Int. J. Softw. Tools Technol. Transfer 2021, 23, 1–29. [Google Scholar] [CrossRef] [Green Version]
- Seshia, S.A. Sciduction: Combining induction, deduction, and structure for verification and synthesis. In Proceedings of the DAC Design Automation Conference 2012, San Francisco, CA, USA, 3 June 2012; pp. 356–365. [Google Scholar]
- Available online: https://www.cadence.com/en_US/home/company/newsroom/press-releases/pr/2020/cadence-delivers-machine-learning-optimized-xcelium-logic-simula.html (accessed on 1 November 2021).
- Available online: https://news.synopsys.com/2018-08-27-Synopsys-Delivers-10X-Performance-in-Formal-Property-Verification-with-Breakthrough-Machine-Learning-Technology (accessed on 1 November 2021).
- Heaton, J. Introduction to Neural Networks for Java, 2nd ed.; Heaton Research, Inc.: St. Louis, MO, USA, 2008. [Google Scholar]
- Gron, A. Hands-On Machine Learning with Scikit-Learn and TensorFlow: Concepts, Tools, and Techniques to Build Intelligent Systems, 1st ed.; O’Reilly Media, Inc.: Newton, CA, USA, 2017. [Google Scholar]
- Arbib, M.A. The Handbook of Brain Theory and Neural Networks, 2nd ed.; MIT Press: Cambridge, MA, USA, 2002; pp. 29–31. [Google Scholar]
- Patterson, D.A.; Hennessy, J.L. Computer Organization and Design RISC-V Edition: The Hardware Software Interface, 1st ed.; Morgan Kaufmann Publishers Inc.: Cambridge, MA, USA, 2017. [Google Scholar]
- Jones, D.W. The ultimate RISC. SIGARCH Comput. Archit. News 1988, 16, 48–55. [Google Scholar] [CrossRef]
- IEEE Standard for SystemVerilog–Unified Hardware Design, Specification, and Verification Language. In IEEE Std 1800–2017 (Revision of IEEE Std 1800–2012); IEEE Standards: Piscataway, NJ, USA, 2018; pp. 1–1315. [CrossRef]
Figure 1.
Impact of optimizing loop closure between coverage and stimulus using ML.

Figure 2.
Top-level view of the stages involved in a functional verification process.

Figure 3.
Clustering of multiple signals that represent interesting scenarios.

Figure 4.
(Left): Distribution of supervised and unsupervised ML models in “Stimulus and Testcase Generation” category. (Right) Distribution of used RTL designs for validating proposed ML models.
Figure 4.
(Left): Distribution of supervised and unsupervised ML models in “Stimulus and Testcase Generation” category. (Right) Distribution of used RTL designs for validating proposed ML models.


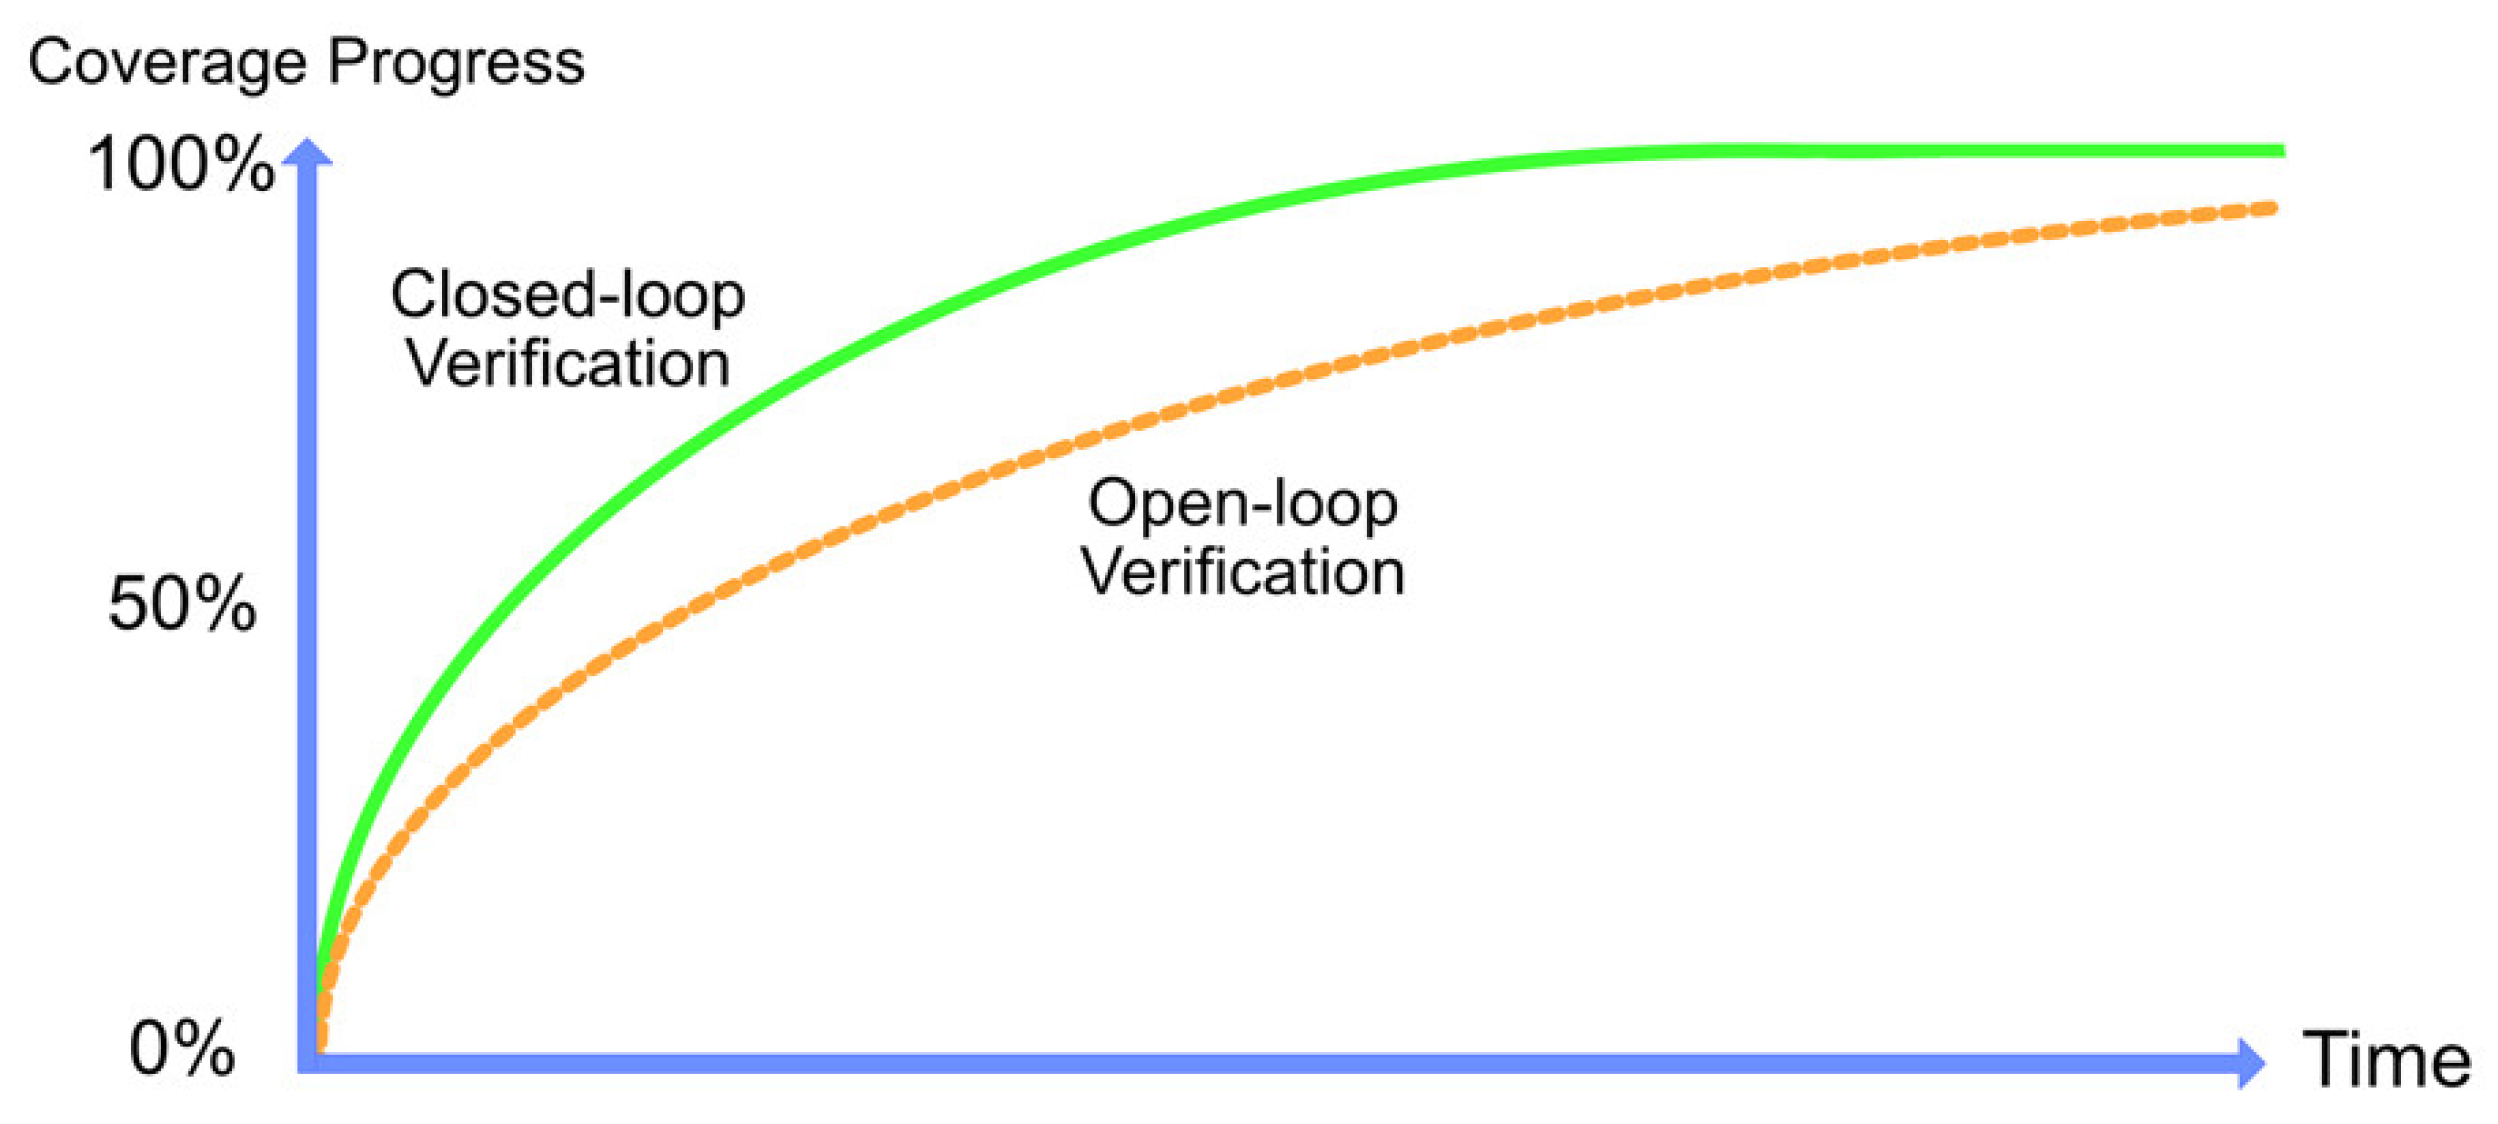
Table 1.
Comparative summary of state of the art ML contributions in Section 5.1.
Table 1.
Comparative summary of state of the art ML contributions in Section 5.1.
| Ref. | Year | ML Approach | ML Model | RTL | TB Language | ML Model Language | Tools Used | Contribution |
|---|---|---|---|---|---|---|---|---|
| [9] | 19 | SL | DNN | [Cache Controller | RISCV-Ariane Cache Victim Buffer] | SV | - | - | 55% (C) |
| [11] | 19 | SL | NN | ALU/Register | e-UVM | - | - | 33% (S) |
| [13] | 19 | SL | DNN | Comb. Circuit: (OR → Adder → Mux.) | SV | Python | K PC | 85% (C) |
| [14] | 18 | SL | ANN | Dual-core RISC: {control hazard, ALU, Memory read/write} | SV-UVM | MATLAB | NNPR | 24.5× (S) |
| [15] | 20 | SL | ANN | Var. width comparator | P-C | Python | K, SL | 86% (S) |
| [16] | 10 | SL | SVM | RISC-processor {Program counter, branch target buffer, others} | - | - | LibSVM | 71% (S) |
| [17] | 20 | SL | [DNN|RF|SVM] | 4-core Cache | SV-UVM | Python | CFS | 70% (S) |
| [18] | 10 | UL | SVM | 8-core OpenSPARC T1: Execution unit EXU ALU | OV | Python | - | 65.6% (T) |
| [19] | 17 | UL | k-Clustering | [Queue management block | Serial line interface] | SV | R | - | 4.6× (T) |
| [20] | 17 | SL | RNN | Codasip uRISC | SV-UVM | Python | - | 28% (S) |
| [22] | 06 | SL | GA | Generic CPU: ALU & Program Counter | SC | C++ | FANN | 1.8× (C) |
| [23] | 09 | SL | SVM | STREAMPROC sub-module of Bluetooth adapter | SC | - | LibSVM | 24% (S) |
| [24] | 18 | SL | ANN | Var. width comparator | SV | TCL | - | 96% (S) |
| [26] | 17 | SL | SVM | Low-dropout regulator | - | Python | LibSVM | 87% (S) |
| [27] | 21 | SL | GA | FIFO in GPU | - | - | - | 1.63× (C) |
| Table abbreviations key for: | ||||||||
| ML Approach | Testbench language | Contribution | ||||||
| SL: Supervised Learning | SV: SystemVerilog | C: Coverage increase | ||||||
| UL: Unsupervised Learning | SC: SystemC | S: Simulation speedup | ||||||
| P-C: Python-Cocotb | T: Testcases count decrease | |||||||
| OV: OpenVera | ||||||||
| UVM: Universal Verification Methodology | ||||||||
| Tools Used | ||||||||
| K: Keras | SL: Scikit-learn | PC: PyCharm | ||||||
| CFS: Certitude Fault Simulator | FANN: TCL Artificial Neural Network extension | NNPR: Neural Net Pattern Recognition Toolbox | ||||||
Table 2.
Comparative summary of state of the art ML contributions in Section 5.2.
Table 2.
Comparative summary of state of the art ML contributions in Section 5.2.
| Ref. | Year | ML Approach | ML Model | Training Samples | K Value | TB Language | ML Language | Tools Used | Contribution |
|---|---|---|---|---|---|---|---|---|---|
| [29] | 17 | UL | k-clustering | 500 tests | 5 | - | - | - | 3.4% (S) |
| [30] | 18 | UL | k-clustering | 10,283 tests | 20 | - | Python | Scikit-learn | 10× (S) |
| [31] | 18 | UL | k-clustering | - | - | SystemVerilog | - | - | 53% (C) |
| Table abbreviations key for: | |||||||||
| ML Approach | Contribution | ||||||||
| UL: Unsupervised Learning | S: Simulation speedup | C: Coverage increase | |||||||
Table 3.
Comparative summary of state of the art ML contributions in Section 5.3.
Table 3.
Comparative summary of state of the art ML contributions in Section 5.3.
| Ref. | Year | ML Approach | ML Model | Training Samples | Training Time | TB Language | ML Language | Tools Used | Contribution |
|---|---|---|---|---|---|---|---|---|---|
| [33] | 18 | UL | k-clustering | Avg: 310 tests | 100 s | SystemVerilog | Python | - | 51% (R) |
| [36] | 20 | UL | DBSCAN | 1000 | - | - | Python | Scikit-learn | 14× (M) |
| [37] | 18 | UL | DBCSAN | 10,000 | 0.007 s | SystemVerilog | Python | Scikit-learn | Comp. |
| [40] | 15 | SL | SVM classifier | 2124 log files | 11.97 s | - | Python | LibSVM | 68% (A) |
| Table abbreviations key for: | |||||||||
| ML Approach | Contribution | ||||||||
| UL: Unsupervised Learning | R: Redundancy reduction in simulation traces | M: Reduction in manual inspection effort | |||||||
| SL: Supervised Learning | Comp.: Best performer among other compared ML clustering models | A: Accuracy increase in ranking actual version control files with errors | |||||||
Table 4.
Comparative summary of state of the art ML contributions in Section 5.4.
Table 4.
Comparative summary of state of the art ML contributions in Section 5.4.
| Ref. | Year | ML Approach | ML Model | Training Samples | Training Time | RTL | ML Language | Tools Used | Contribution |
|---|---|---|---|---|---|---|---|---|---|
| [41] | 11 | SL | Modified-DFA | - | - | [Latch | Integrator] | - | - | PoC |
| [42] | 21 | SL | [DT | NN] | - | - | SARADC | - | - | 100× (S) |
| [43] | 21 | SL | DNN | 6870 | 9 min | Charge Pump | Python | Scikit-learn | 96.78% (S) |
| [44] | 19 | SL | DNN | 4 traces | 3 min 43 s | Low power relaxation oscillator | Python | Scikit-learn | 92.85% (S) |
| Table abbreviations key for: | |||||||||
| ML Approach | Contribution | ||||||||
| SL: Supervised Learning | PoC: Proof of concept. ML algorithm successfully modelled the analog circuit | S: Speed up in the simulation | |||||||
Table 5.
Comparative summary of state of the art ML contributions in Section 5.5.
Table 5.
Comparative summary of state of the art ML contributions in Section 5.5.
| Ref. | Year | ML Approach | ML Model | Training Samples | Training Time | RTL | ML Language | Tools Used | Contribution |
|---|---|---|---|---|---|---|---|---|---|
| [45] | 19 | SL | RNN | - | - | Generic Assertions | Python | Keras | PoC |
| [46] | 15 | SL | BF-DT | 33.5 million traces | 87 min | [AND | OR | XOR] | - | - | 40% (S) |
| [47] | 12 | SL | DT | - | 30 min | [Ethernet MAC | I2C | OpenRISC] | - | GoldMine | 56% (A) |
| [49] | 14 | SL | DT | - | 60 min | [USB | PCI | OpenRISC] | - | GoldMine | 6.14× (C) |
| Table abbreviations key for: | |||||||||
| ML Approach | Contribution | ||||||||
| SL: Supervised Learning | PoC: Proof of concept. ML algorithm successfully generated assertions from natural language input | S: Speed up in the verification life cycle | |||||||
| A: Reduction in number of needed assertions to represent a design | C: Increase in coverage | ||||||||
Table 6.
Comparative Summary of NN contributions in Section 6.
Table 6.
Comparative Summary of NN contributions in Section 6.
| Ref. | Year | Contribution | DUT | NN Type | No. of Hidden Layers | Activation Function | ML Modelling Tool | Testbench HDL |
|---|---|---|---|---|---|---|---|---|
| [13] | 2019 | 85% 2 | OR → Adder → Mux 4 | DNN | 2 & 4 | ReLU | JetBrains PyCharm | SystemVerilog |
| [14] | 2018 | 24.5× 1 | Dual-core RISC CPU | ANN | 1 | ReLU | MATLAB | SystemVerilog UVM |
| [20] | 2017 | 28% 3 | uRISC CPU | RNN | 1 | Sigmoid | Python 2.7 | SystemVerilog UVM |
1 Maximum speed up of 24.5× in simulation time compared to traditional SystemVerilog UVM. 2 Using ML instead of pure randomized inputs, simulation time is sped up with prediction accuracy of 85%. Authors did not specify how much the speed up percentage is. 3 28% speed in simulation time reaching 85% of planned coverage metric, compared to standard method of purely randomized inputs. 4 (OR → Adder → Multiplexer) is the most complex DUT used by the authors. Other tested DUTs include simple logic gates: NAND, OR, MUX, Full-adder and Multiplier.
Publisher’s Note: MDPI stays neutral with regard to jurisdictional claims in published maps and institutional affiliations. |
© 2021 by the authors. Licensee MDPI, Basel, Switzerland. This article is an open access article distributed under the terms and conditions of the Creative Commons Attribution (CC BY) license (https://creativecommons.org/licenses/by/4.0/).
Share and Cite
MDPI and ACS Style
Ismail, K.A.; Ghany, M.A.A.E. Survey on Machine Learning Algorithms Enhancing the Functional Verification Process. Electronics 2021, 10, 2688. https://doi.org/10.3390/electronics10212688
AMA Style
Ismail KA, Ghany MAAE. Survey on Machine Learning Algorithms Enhancing the Functional Verification Process. Electronics. 2021; 10(21):2688. https://doi.org/10.3390/electronics10212688
Chicago/Turabian StyleIsmail, Khaled A., and Mohamed A. Abd El Ghany. 2021. "Survey on Machine Learning Algorithms Enhancing the Functional Verification Process" Electronics 10, no. 21: 2688. https://doi.org/10.3390/electronics10212688
Note that from the first issue of 2016, this journal uses article numbers instead of page numbers. See further details here.