Impact of 3D-Printing Technologies on the Transformation of Industrial Production in the Arctic Zone

1
Graduate School of Economics and Technologies, Peter the Great St. Petersburg Polytechnic University, 195251 St. Petersburg, Russia
2
Marketing Department, St. Petersburg State University of Economics, 191023 St. Petersburg, Russia
*
Author to whom correspondence should be addressed.
Resources 2019, 8(1), 20; https://doi.org/10.3390/resources8010020
Submission received: 16 November 2018
/
Revised: 6 January 2019
/
Accepted: 9 January 2019
/
Published: 16 January 2019
(This article belongs to the Special Issue Management of Comprehensive Development of the Arctic Territory)
Abstract
:Today the process of transition to a new technological order has become evident to everyone, especially in developed countries. One of the most urgent areas for ensuring the long-term competitiveness of industrial enterprises is the development of the Arctic zone. This region has many economic and logistical difficulties, the solution of which may lie in the use of advanced technologies of the new technological order, for example, 3D-printing technologies. The aim of the article is to study the transformation of the cost structure of industrial products as a result of integration of 3D-printing technologies into the production process of industrial enterprise operating in the Arctic zone. It was found that the structure of the main cost elements varies greatly, due to the ambiguity of replacing computer numerical control (CNC) (or other classical shaping technologies) with 3D-printing technologies, as well as the specifics of supply chains, which is quite urgent for the Arctic region. The results of empirical study necessitate the development of tools for predicting the economic viability of integrating 3D-printing technologies into the technological processes of industrial enterprises operating in the Arctic zone. Within the article, the authors substantiated and developed a fuzzy-multiple model for assessing the level of investment attractiveness of integration of 3D-printing technologies into the production process of an industrial enterprise operating the Arctic zone. One of the aims of this model is to answer the question of whether an enterprise should invest in a technological transition to 3D-printing technologies.
1. Introduction and Statistics Overview
Industry, primarily manufacturing, plays a key role in the development of the world economy. According to L. Young (United Nations Industrial Development Organization (UNIDO) Industrial Development Report, 2016), development is impossible without industrialization, and industrialization is impossible without technology and innovation. Industry generates jobs with higher wages than agriculture, which contributes to structural economic changes in low-income countries and their transfer to the category of countries with medium and sometimes high incomes. According to UNIDO specialists, it is employment in industry that is crucial in terms of poverty eradication and the achievement of sustainable development goals of the United Nations [1].
Analyzing the dynamics of the world gross product by main sectors (agriculture, industry, services) from 1970 to 2000, services sector grew at a faster rate than industry (up 4.5% per year), but since 2000, the annual growth of all three sectors has been equalized and stabilized at about 2.5% [2].
As for geographical specifics, all countries are characterized by dynamic fluctuations in the industrial development index with the absence of an explicitly expressed trend. The BRICS countries (Brazil, Russia, India, China, South Africa) have maintained their leadership in the world industrial growth over the past four decades (especially China, but not Russia) [3,4,5,6].
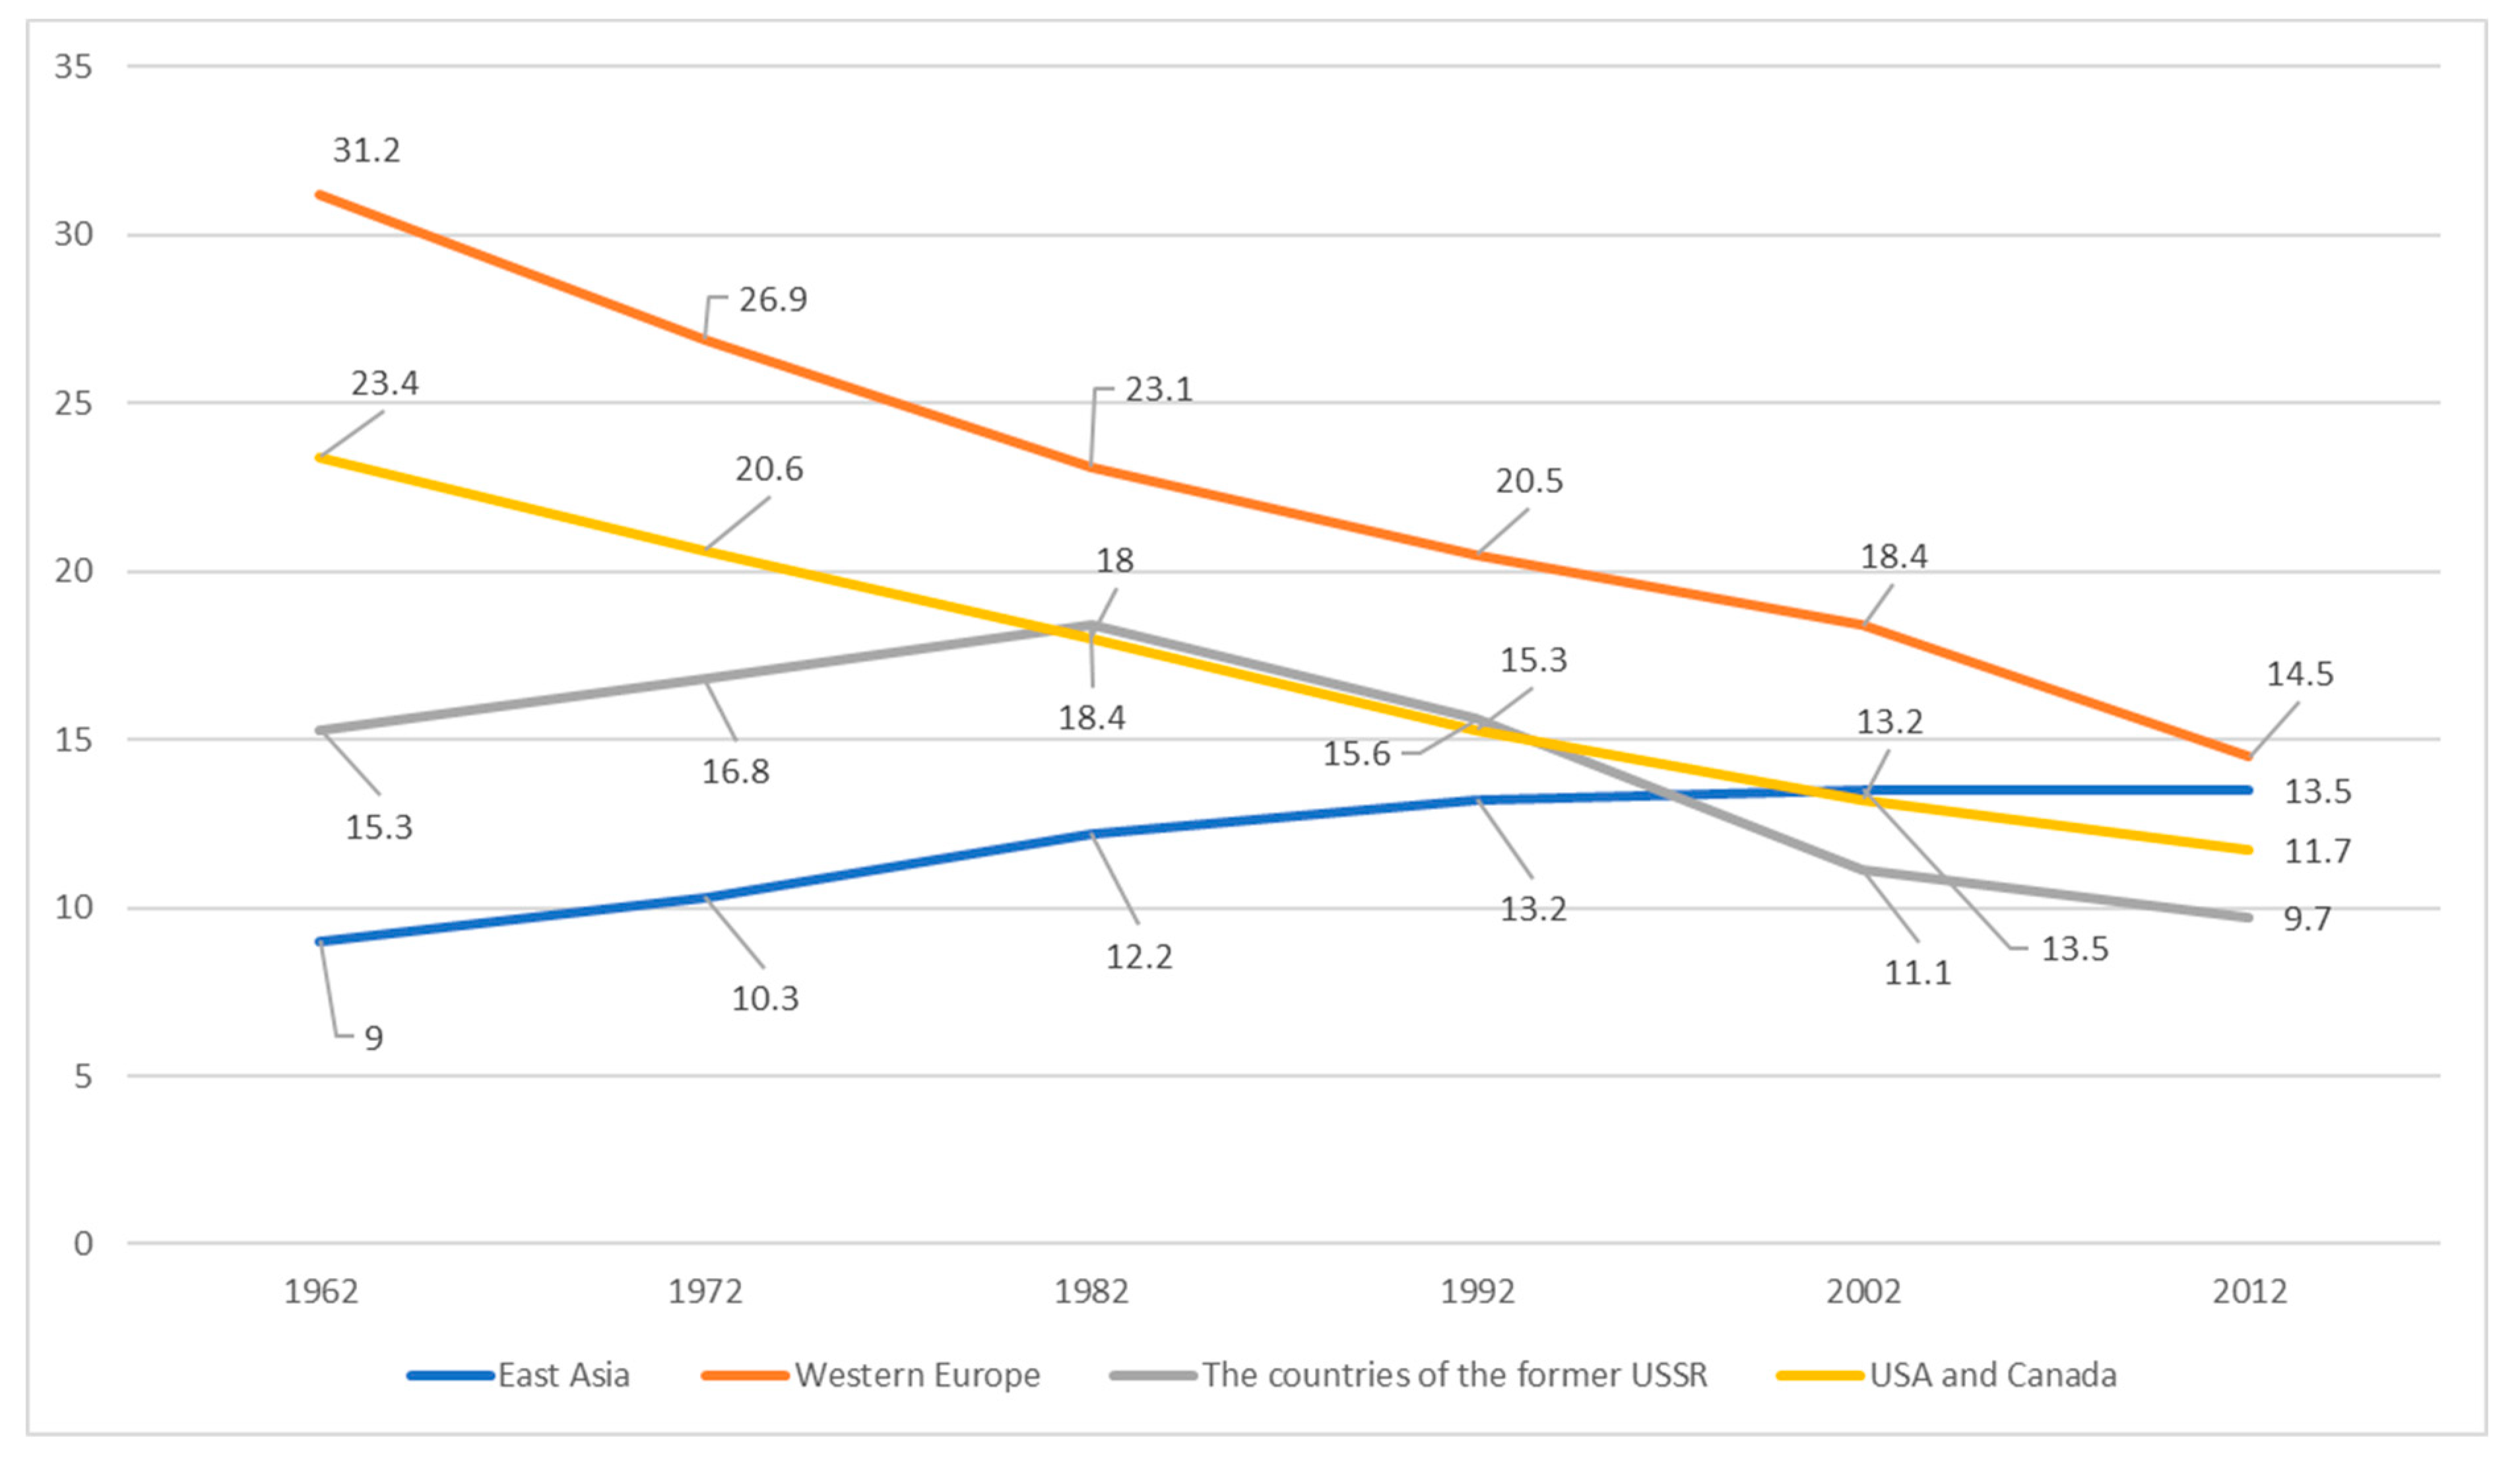
The cost of world industrial output is 9/10 in the manufacturing sector. The developed countries have an even higher specific gravity [7,8,9]. Since the 1960s (in developing countries—since the 1980s), the world industry has taken a course of de-industrialization. On a global scale, the share of manufacturing value added in GDP (gross domestic product) in the period from 1962 to 2012 fell from 20.9% to 12.3% [10]. Figure 1 shows a graph of the change in this indicator for selected regions (USA and Canada, Eastern Asia, Western Europe, the countries of the former Union of Soviet Socialist Republics (USSR)). In Western Europe, the US and Canada, the share of manufacturing value added in GDP is steadily declining according to the global trend (this trend is also characteristic for Japan, Singapore, Taiwan, Australia, New Zealand, and other economically developed countries). For the countries of the former USSR and Eastern Asia, the situation is reversed: the share of value added of manufacturing in GDP either grows, or the periods of recession and growth change. One of these two trends is also characteristic for the countries of Eastern Europe, South America, the Middle East and other developing countries [11,12]. The difference in the role of manufacturing in the national economy for developed and developing countries is quite obvious. Basically, this is due to the fact that the industry’s opportunities to enhance the economic growth of developing countries are still clearly not exhausted [13,14,15].
The statistics of geographical distribution of the value added of manufacturing industry in the world over the past three decades show that the share of North American countries fell from 23% to 20.9%, that of Western Europe fell from 40.7% to 27.5%, and the countries of the Asia-Pacific region increased from 27.8% to 44.5% [17]. The situation is rather different with the absolute values of the index. In addition to the obvious trend—China’s explosive 15-fold growth—one can see an increase in the value added by manufacturing industry not only in developing countries (BRICS countries, South Africa, Mexico and many others), but also in countries traditionally included in the group of economically developed countries (USA, Western Europe). This trend of reduction in the share of manufacturing in GDP, while maintaining absolute growth is linked with the leading role of economically developed countries in global value chains [1,18,19].
There is a tendency of increasing efficiency in the manufacturing industry due to the reduction in employment and energy consumption, mainly in industrialized countries. If comparing China and USA (as representatives of developing and developed countries) in terms of such indicators as value added ($bn.), manufacturing energy consumption (% of the world), manufacturing employment (% of total employment) in 1990 and 2015, it is obvious that growth in manufacturing occurs in parallel with a decrease in the number of employees due to automation and more rational use of human resources. In general, employment in world manufacturing increased by 13% during the period (in developed countries it fell by 31%, and in developing countries it increased by 30%). The energy consumption situation for the two countries is different: in China, manufacturing and industrial energy consumption are rising synchronously, while in the US the situation is inversely proportional [20,21,22,23].
The world manufacturing sector is characterized by a high level of competition, both at the country level and at the level of specific enterprises. At the same time, existing technological systems reach an optimizing peak, which generates the need for a qualitative change. The process of cardinal modernization involves changing one of the following elements of the production process [24,25,26]:
- circulating resources, in particular the integration of new materials for obtaining new properties of the final product, or obtaining a fundamentally new product, or reducing production costs;
- production technologies, which is expressed in the integration of new capital equipment.
The process of transition to a new technological order determines the need to create new production systems. These systems should be both of a new technological character and have a renewed territorial and organizational character. Due to the increasing scarcity of territories, but not the diminishing need for access to labor and the proximity of resources, it is the development of the Arctic zone that can be one of the vectors of modern industry development. In many respects, this is determined by the resource base of the Arctic zone, as well as by its general openness to mastering the main participants of the world industrial market. At the same time, logistic and infrastructure problems of this region should be considered. Despite the closeness to resources, the cost of organizing a single work unit is significantly higher than in many alternative regions of the world.
Arctic industry forms a significant part of world GDP. In particular, in the Russian Federation, about 20% of the extractive industries products and about 2% of the manufacturing products are produced in the Arctic zone. The main products are: non-ferrous metals, aluminum, apatite-nepheline ores, complex iron ores, phlogopite, vermiculite, ferrite strontium powders, building materials, aegirine, sphenic, titanium-magnetite, iron ore, apatite and baddeleyite concentrates. Most of the production facilities are located in the western part of the Arctic zone. This part is an “old-developed” region, as it was industrialized in the early 20th century. Despite of the high significance of the Arctic industry, its main development fell on the third technological order. Consequently, the technological development of the industrial complex of the Arctic zone is critical for the development of industry as a whole.
Thus, effective production facilities in the Arctic zone should primarily meet the following characteristics [27,28,29,30]:
- Adaptability. Production complexes operating in the Arctic zone should be able to quickly and, in a non-resource-consuming way, adjust to new conditions of external and internal environment;
- Scalability. Production complexes of the Arctic zone should be commensurately effective in the production of goods at both small and large scales;
- Learning. Since the Arctic zone is unique, errors in the creation of such complexes are unavoidable. Therefore, without the existence of a system of accumulation and subsequent use of bad experiences, such complexes cannot exist;
- Virtual openness. Such complexes should be able to communicate quickly and effectively with the managing, financial and other subsystems located outside the given territory.
The approach to the creation of production complexes operating in the Arctic zone is exceptionally individual. These complexes can be successful only in the case of the integration of both advanced and classic production technologies. 3D-printing technologies could become one of the most promising cases, since on their basis, the most adaptive and scalable production complexes can be built. 3D, or additive, printing is a generic name for technologies that involve production from a digital model (or CAD (computer-aided design) model) by layer-by-layer addition of material [31,32]. The integration of advanced production technologies, in particular, 3D-printing or additive technologies for industrial enterprises operating in the Arctic zone, may become one of the keys of their development.
2. Literature Overview
The consequences of integrating additive technologies into real sectors of the economy is a widely discussed problem in the scientific community [33,34,35,36]. This question is quite broad, and it determines the different directions of the researchers. For example, Gress and Kalafsky (2015) state that additive technologies can change the geography of production as a whole by influencing the structure of demand and consumption, as well as innovation and global supply chains [37,38]. Cozmei and Caloian (2012) consider economic advantages of additive technologies, such as reduction in fixed costs, absence of expenses and depreciation costs for additional equipment, reduced risk, and reduced management costs. They thoroughly consider the issues related to the fiscal burden on enterprises using additive technologies and conclude that the development of additive technologies will invariably lead to a global modernization of the taxation system, since at the moment it is not able to levy taxes from these enterprises in connection with the innovative nature of their activities [39,40].
Weller, Kleer and Piller (2015) argue that additive production is currently being positioned as the source of a new industrial revolution by producing unique products without the use of specialized tools and the production of complex structures in one operation, thereby potentially reducing the need for installation work. The authors believe that in monopoly conditions, the use of additive technologies will allow the profit of the enterprise to increase through the use of consumer surpluses, thanks to the construction of a flexible production system that implies individual orders. At the same time, competition will be stimulated, as additive technologies will reduce barriers and enable enterprises to function in several markets simultaneously, resulting in price reduction for end-users [41,42].
The most profound study in the field of the economy of additive production was carried out by Gebler, Schoot Uiterkamp and Visser (2014), stating that the greatest development of additive technologies will be in the sphere of small-scale production, production of unique products and expensive equipment. The most promising industries are aerospace and medical production. The authors were the first to consider a change in the cost structure when using 3D printing. Prices for raw materials for 3D printing are much higher than for raw materials in classic production methods; however, their efficiency is much higher. The cost of production can be reduced, since additive technologies allow the creation of lighter structures with complex geometry, which can result in fuel economy [43,44].
Mellor, Hao and Zhang (2014) note that additive technologies have been used exclusively in the prototyping area. However, it has become possible to create full-scale productions based on additive technologies. As the advantages of this technology, the authors distinguish the almost unlimited possibilities in the design of the final product, the lack of need for specialized equipment, and the low costs [45,46,47,48,49,50].
Thus, we can conclude that existing scientific research in this area focuses either on the global aspect of the development of additive production, not considering the specifics of the changes in production processes, or on particular cases of integrating additive technologies into specific technological processes. To determine the possibilities for integrating these technologies into production complexes created in the Arctic zone, it is firstly necessary to understand the specifics of changing the structure of production costs. The object of research is engineering for at the moment the vast majority of commercial developments in the field of additive technologies are primarily focused in this sector where additive technologies can replace classical methods of product forming, such as mechanical processing by means of CNC (computer numerical control) equipment.
3. Methodology
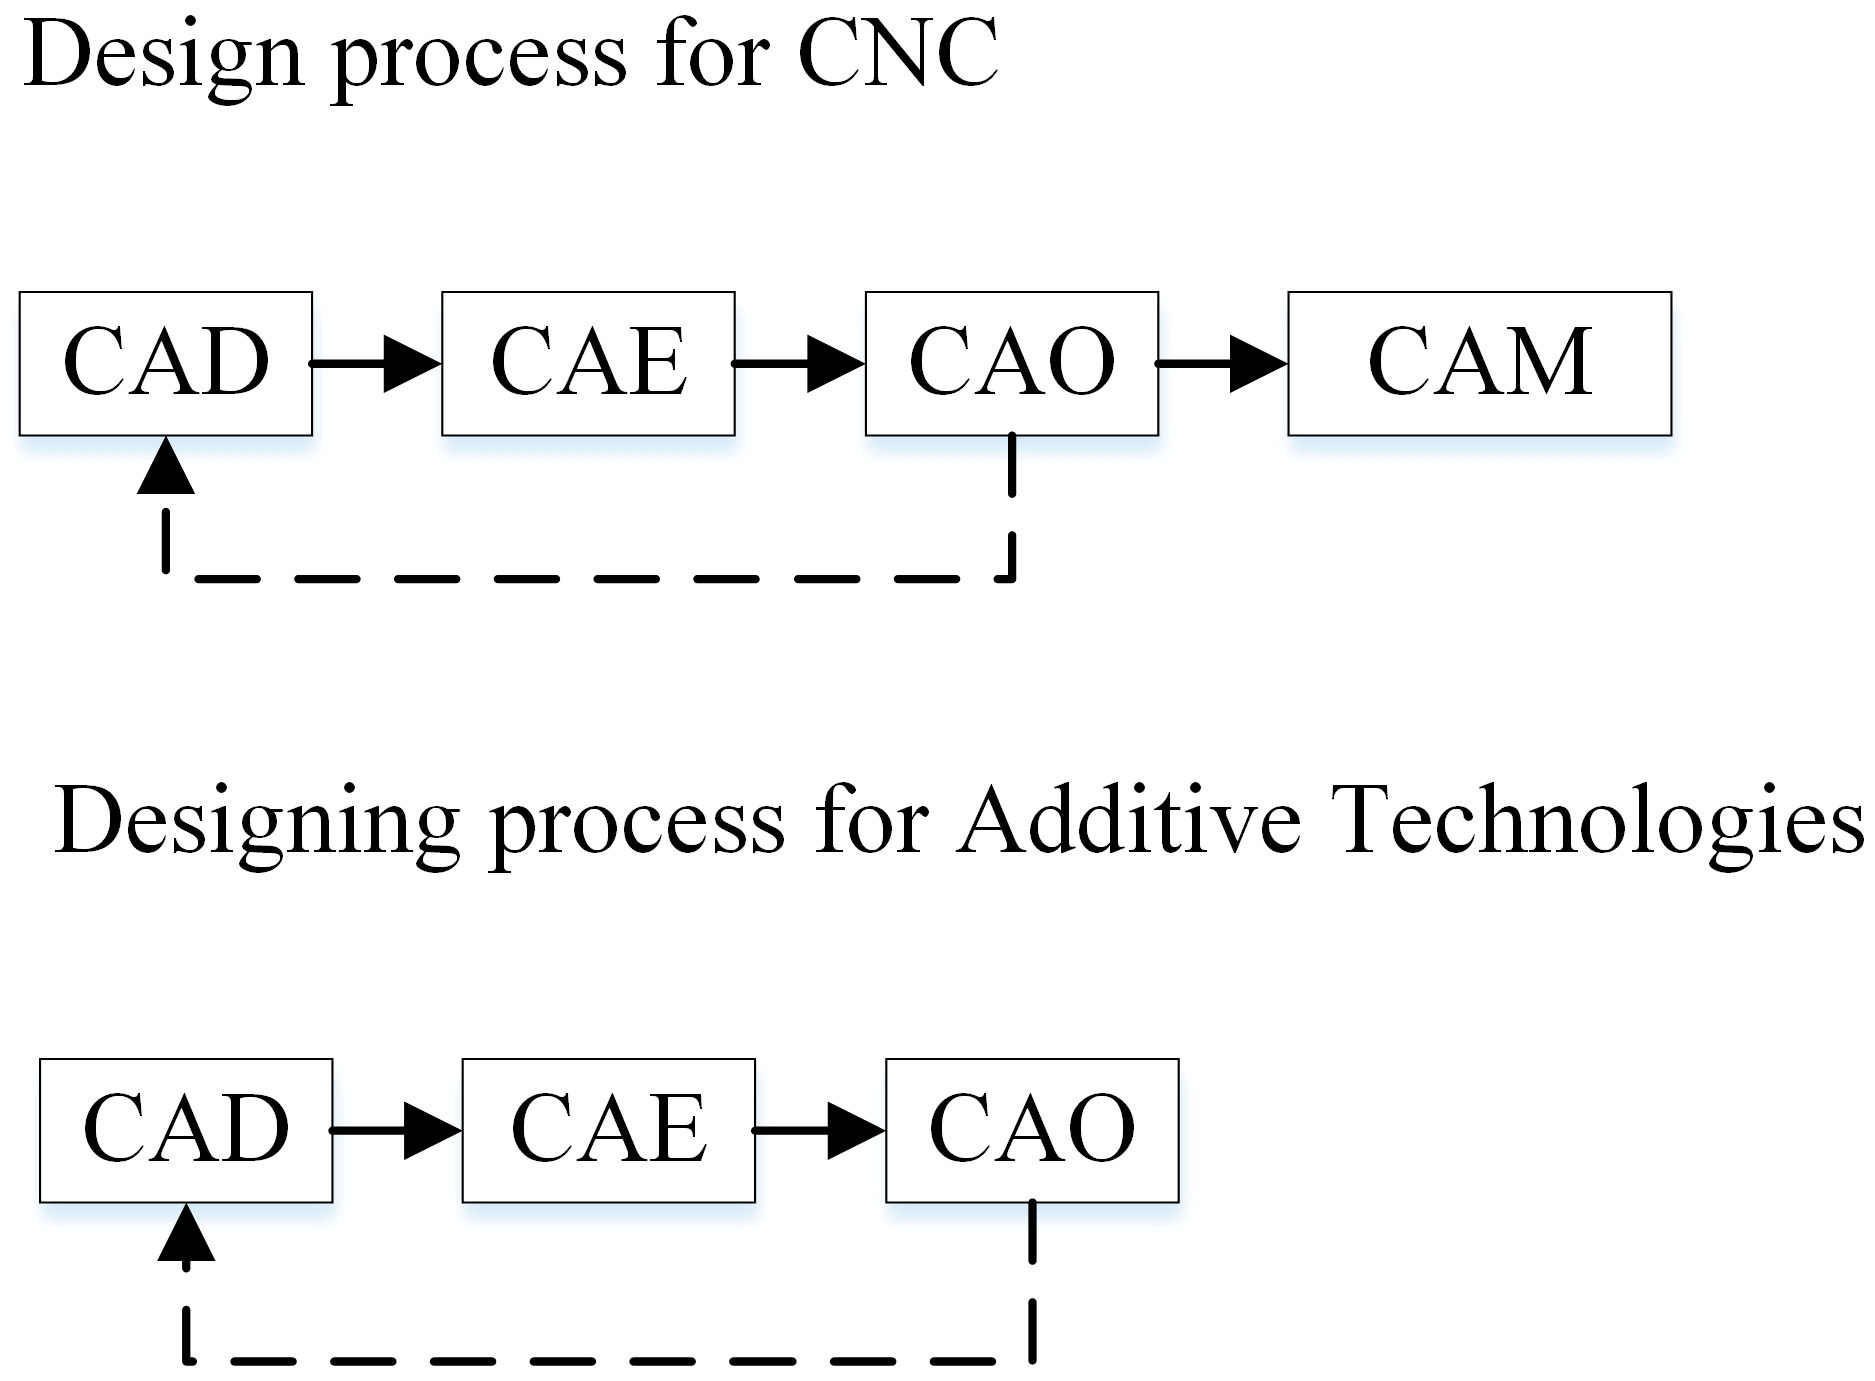
This study is conducted on data obtained from 10 enterprises working in the Arctic zone. It was based on a complex of quantitative information (accounting data, primary accounting data, production information, etc.) and qualitative information (in-depth expert interviews with management representatives of each company). The obtained results were processed using MS Excel. Let’s consider the changes in the design process during the transition from CNC to additive technologies (Figure 2) [51,52,53].
Abbreviations in this figure stand for: CNC—machine tool with computer numerical control; CAD—computer-aided design; CAE—computer-aided engineering; CAO—computer-aided optimization; CAM—computer-aided manufacturing. According to Figure 2, testing the processability is completely excluded from the design process, because the principle of formation of additive technologies implies the possibility of obtaining almost any form layer-by-layer [54,55]. Software and hardware can obtain a form without human intervention, which makes it possible to completely abandon staff units such as production engineer and to reduce the cost of the final product.
Following the design phase, the production stage will also undergo significant changes [56,57]. Since the production process is almost impossible to universalize from a structural point of view, it will be easier to visualize changes through a model of production cost formation. In the enlarged form, the formation process of the production cost can be represented by the following additive model:
where:
- Cm—total cost of materials;
- Cw—cost of wages;
- Ceq—cost of operation of equipment.
According to Model (1), each of the elements will undergo a change, since additive technologies assume fundamentally different materials. Moreover, this material has a much greater return on production waste, which is also due to the principle of formation. In this case, waste recycling is almost identical to that when using casting technologies [58,59]. The additive devices themselves also have their own characteristics, which certainly affects the cost of their operation. The structure of labor costs will also change, since the additive installation management process is much less labor-intensive than the CNC control process [60]. Similar issues are also raised in [61,62,63]. A more detailed visualization of the structural changes can be seen in the extended additive model of the formation of the production cost:
where:
- Cm—aggregate price of all purchased materials (including transportation costs, etc.);
- N—number of products produced from one batch of material;
- T—piece-calculating time (time spent for production of one item);
- Ch—cost of one working hour of the machine operator or the machine tool setter (supposing that is the one person);
- Tp—processing time (time spent by the machine tool for processing the item);
- Ta—auxiliary time, including time for installation and removal of items, time for detaching and securing the item, time for management, time for measurement;
- Tpr—time for preventive maintenance (part of basic and auxiliary time);
- Tr—time for rest and personal needs (part of basic and auxiliary time);
- Tpf—time for preparation and finish works;
- Pte—the power of the machine tool;
- LF—load factor of the electric engine;
- Pkh—price of kilowatt hour;
- E—efficiency of the electric engine;
- Pt—purchase price of each tool used in the process of manufacturing;
- Tt—operating time of each tool;
- Ttu—permissible operation time of the tool until its complete unworthiness;
- Cdm—cost of annual depreciation of the machine tool;
- Tm—estimated working minutes of the machine tool per year;
- Cda—cost of annual depreciation of auxiliary equipment;
- Ta—estimated working minutes of auxiliary equipment per year;
- Pc—price of the necessary coolant;
- Tc—estimated working minutes of coolant before replacement;
- Am—area occupied by the machine tool;
- V—value of the production unit rent per month;
- Au—the area of the rented production unit;
- Tmsup—supposed working time of the machine tool per month (in minutes).
The presented model formed the basis of the study methodology. Conducted quantitative studies and in-depth expert interviews made it possible to identify changes in the structure of this model during the transition to additive technologies, as well as the causes of these changes and key problems associated with them. The results of this comparison are presented in the next part of the paper.
4. Results
Considering the model, the cost of the material (Cm) consists of the cost of its acquisition (Cm1), logistics costs (Cm2), the cost of additional processing (Cm3) and the irreversibility of waste and rejects (Cm4). Industrial additive installations assume the use of specialized materials of powder type; their cost considerably exceeds the cost of classical materials, due to the insufficient volume of their production. The situation with industrial costs is ambiguous, since on the one hand, the process of storage and transportation is greatly simplified due to the greater variability of the transported volume, but on the other hand the number of their producers is quite few [64,65,66]. At the same time, the cost of additional processing is much lower, since there is no need for preliminary preparation of the material and the formation of blanks. The irreversibility of waste and rejects is much lower than in classical methods of metal-forming. In fact, the recyclability of waste and rejects can reach 100%. So,
With the general changes in the ratio between the elements of material costs, the composition of these costs does not change. Labor costs change insignificantly in terms of composition and structure. Processing time is an extremely variable indicator, unsuitable for comparison. Auxiliary time in the case of additive technologies will be significantly lower, since the production process is more automated [67,68]. Time for preventive maintenance, time for rest time and personal needs, as well as time for preparation and finish works remain virtually unchanged. So,
The method for calculating electricity costs (Cel) retains the main mechanism, but load factor and efficiency of the electric engine are replaced by alternative indicators for the additive installation [69,70]. The energy consumption of modern additive installations is comparable to the energy consumption of CNC equipment:
Cel-additive ≈ Cel-CNC
Cost items related to material consumption and planned replacement of the coolant are completely eliminated and are replaced by alternative indicators for runout of structural elements of the additive installation (Pad) (for example, an extruder). Since these elements are much more unified and durable, lower costs should be assumed:
Pt + Pc ≥ Pad
The cost of annual depreciation of the additive installation (Cd-ad) will be much higher, since its cost significantly exceeds the cost of alternative CNC equipment, even though it is necessary to purchase ancillary equipment:
Cdm + Cda ≤ Cd-ad
Other elements of the model remain unchanged. We see that the change in the composition and structure of the production costs is rather ambiguous. The enterprise can achieve a reduction in material costs only under conditions of a significant percentage of rejects and industrial waste. The company can achieve a reduction in labor costs only if the processing time is shortened, which is possible only in the case of geometrically complex products that are impossible to manufacture on CNC equipment [71]. The company can achieve lower equipment costs only if the additive installation has a longer useful lifetime. It can be concluded that the decision to integrate additive technologies into industrial enterprises operating in the Arctic zone is complex and ambiguous. This decision depends on many factors, and the result is subject to a high level of uncertainty. Therefore, the issue of forming an instrument for assessing the investment attractiveness of such a transition is extremely urgent. The authors’ aim is to form a tool to determine the level of investment attractiveness of integration of additive technologies in the manufacturing process of an industrial enterprise operating in the Arctic zone.
5. Discussion
The specificity of the object makes the use of any common evaluation method ineffective. An accurate and adaptive model for assessing the prospects of investment attractiveness of integration of additive technologies cannot be based on purely statistical or exclusively expert information. The impossibility of using statistical methods of assessment is determined by the impossibility of obtaining a sufficient amount of empirical material for the formation of a reliable research base. On the other hand, expert methods carry subjective features, which greatly increase the risk of expert error. Increasing the accuracy of the results of estimating such phenomena lies in the field of applying the theory of fuzzy sets. Its methods are based on a system of expert assessments; however, unlike statistical and expert estimation methods, they make it possible to consider the level of uncertainty by using the membership functions (μ (x) ∈ (0, 1)) of a subset to a given set. Methodologically, the use of this modeling approach is limited by the need to involve a wide range of experts. In this case, the experts were representatives of the management system of 10 Arctic zone enterprises who were previously involved in this study.
The investment attractiveness of the integration of additive technologies is assessed on the basis of a system of indicators built on a hierarchical basis and defined in different measures. The first level of the system is presented by aggregated criteria, the aggregate interaction of which synergistically affects the level of investment attractiveness. It is proposed to use a cost approach, and to measure investment attractiveness through the potential for cost reduction. The second level of the system is represented by specific indicators that affect one or another criterion. These indicators describe the state of both the external and internal environment of an industrial enterprise operating in the Arctic zone. At the same time, they include both statistical and expert values. The system of these indicators is presented in Table 1.
The model has two linguistic variables:
Variable No. 1—level of investment attractiveness of integration of additive technologies in the manufacturing process of an industrial enterprise operating in the Arctic zone;
Variable No. 2—the level of each private indicator (20 indicators). The term-set of each linguistic variable consists of 5 subsets:
Linguistic variable No. 1:
- Absolutely unattractive;
- Practically unattractive;
- The attractiveness is uncertain;
- Attractive enough;
- Extremely attractive.
Linguistic variable No. 2:
- Extremely low value of the indicator;
- Low value of the indicator;
- The average value of the indicator;
- Admissible value of the indicator;
- High value of the indicator.
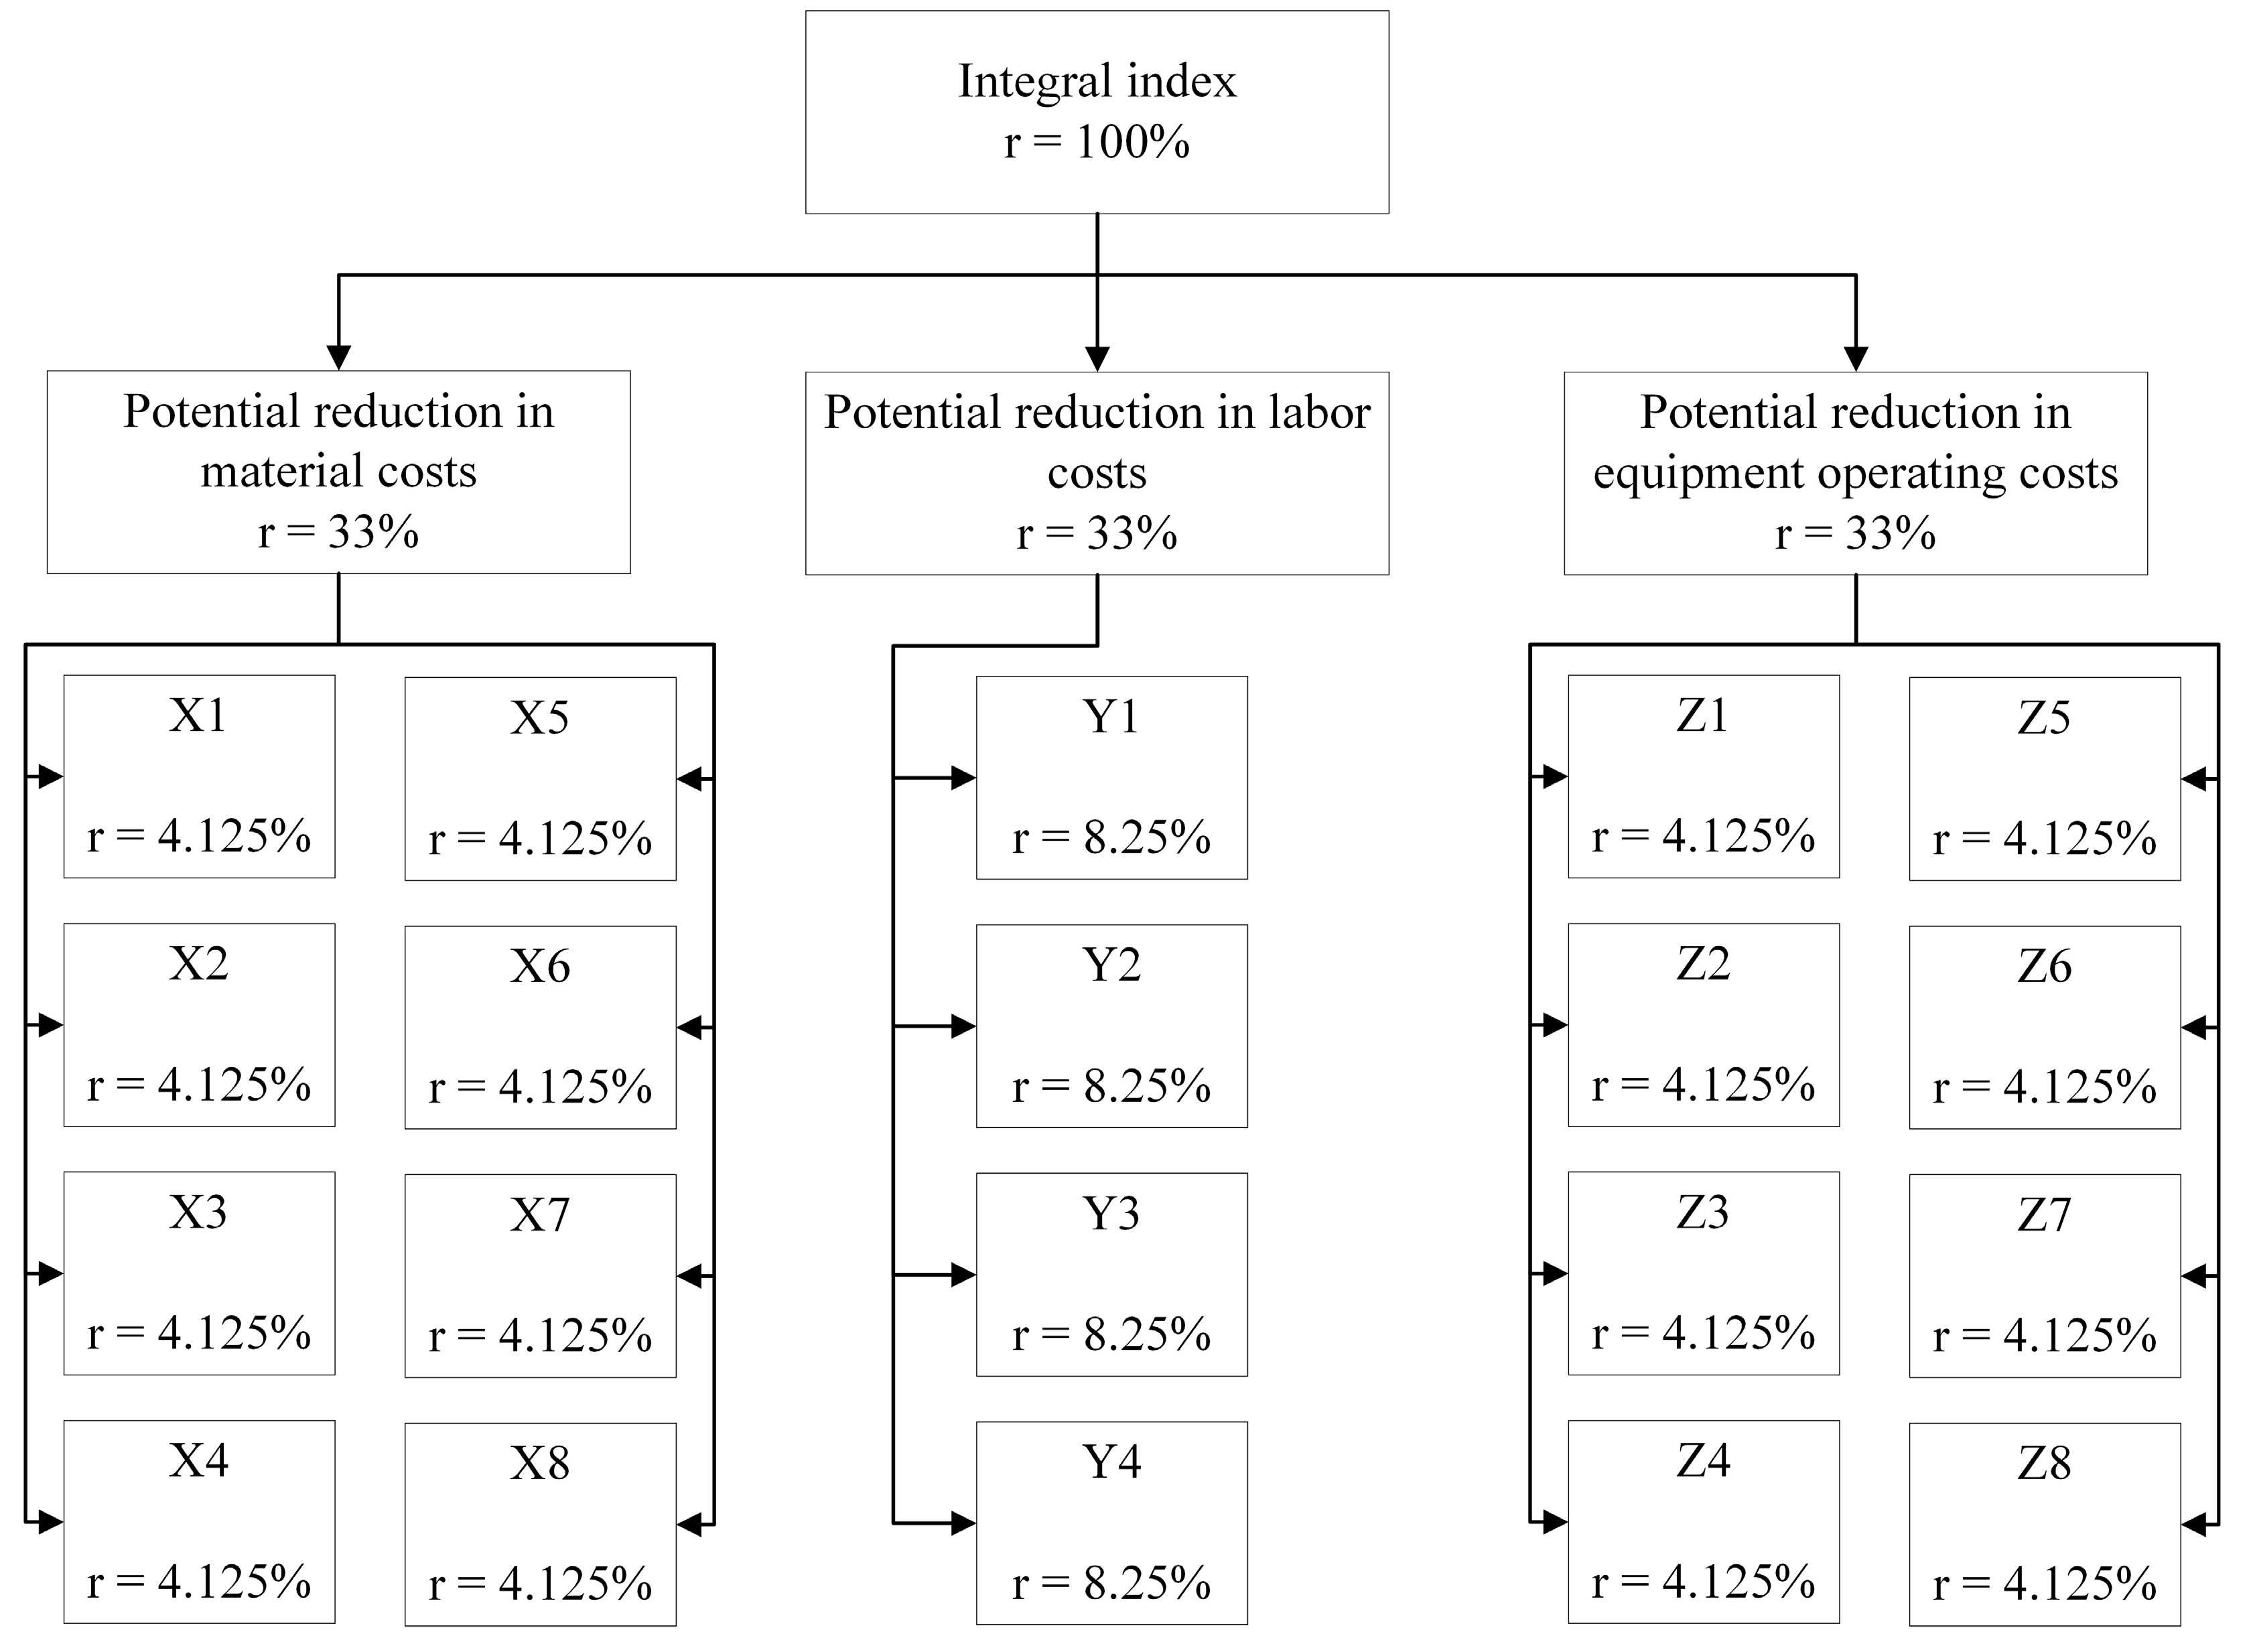
Each indicator is assigned its own level of significance (ri). In accordance with the hierarchy of the system, it was established that indicators of the first level are of equal importance, since each of them characterizes a separate component that affects the integral indicator and cannot be considered in isolation from the others. The indicators of the second level are equally significant to the indicators of the first level; therefore, the significance shares are evenly distributed within each group. Figure 3 shows the hierarchical system of influence of indicators, together with the established significance of each of them.
As a classifier for the level of attractiveness of additive technologies integration, we take the most commonly used standard, the five-level 01-classifier by Nedosekin A.O., where the membership functions are trapezoidal triangular numbers [72]. This classifier has 5 node points, in which the value of the membership function is equal to one (0.1, 0.3, 0.5, 0.7, 0.9).
For each of the private indicators, a classifier of current values is generated. These classifiers are built on the basis of statistical information by industry, and the distribution criterion is the frequency of the hit of the indicator value in the interval. If the indicator is expert, the classifier is built on the basis of expert review.
Based on the results of the calculation of each of the private indicators, the recognition of their values by the criterion λij ∈ (0, 1) is carried out. Based on the results of recognition of the values of private indicators, an integral indicator of the level of investment attractiveness of integration of additive technologies in the manufacturing process of an industrial enterprise operating in the Arctic zone is calculated. The obtained integral indicator is linguistically interpreted, similarly to private indicators. In the end, we get an interpretation of the level of perspectiveness of integration of additive technologies and the degree of confidence of the researcher in this interpretation.
6. Conclusions
In the article, the issue of changing the composition and structure of production costs at an industrial enterprise operating in the Arctic zone while integrating additive technologies is considered in detail. It was found that the transition to additive installations will make it possible to abandon at least one staff unit—the production engineer—which will significantly affect the cost of product design. At the same time, production cost can change ambiguously. In this regard, a fuzzy model was developed to assess the level of investment attractiveness of the integration of additive technologies in the manufacturing process of an industrial enterprise operating in the Arctic zone. This model consists of a set of indicators that fully reflect the prospect of reducing the production costs. The linguistic interpretation of the final result makes it possible to answer the question of whether an enterprise should invest in a technological transition, and the linguistic interpretation of the intermediate results will help to understand why to do it. Further development of this model is its approbation. Based on the results of the approbation, it is supposed to clarify the fuzzy-logical classifiers of private indicators, as well as the specification of their composition and weights. This model will be useful for developed industrial enterprises operating in the Arctic zone, considering the integration of additive technologies, and for researchers in the field of advanced manufacturing technologies.
Author Contributions
Conceptualization, E.A.K. and D.G.R.; Methodology, O.A.K.; Validation, E.A.K., O.A.K. and D.G.R.; Formal Analysis, O.A.K.; Investigation, E.A.K.; Resources, D.G.R.; Data Curation, O.A.K.; Writing-Original Draft Preparation, O.A.K.; Writing-Review & Editing, O.A.K.; Visualization, O.A.K. and E.A.K.; Supervision, D.G.R.; Project Administration, D.G.R.; Funding Acquisition, D.G.R.
Acknowledgments
Section 1 (Introduction and statistics overview), Section 2 (Literature overview), Section 3 (Methodology) and Section 4 (Results) of this research was funded by the Ministry of Education and Science of the Russian Federation grant number No. 26.6446.2017/БЧ. Section 5 (Discussion) of this research was funded by the Russian Science Foundation grant number No. 14-38-00009. The APC was funded by Peter the Great St. Petersburg Polytechnic University.
Conflicts of Interest
The funders had no role in the design of the study; in the collection, analyses, or interpretation of data; in the writing of the manuscript, and in the decision to publish the results.
References
- United Nations Industrial Development Organization. Industrial Development Report 2016; The Role of Technology and Innovation in Inclusive and Sustainable Industrial Development: Vienna, Austria, 2015; Available online: https://www.unido.org/sites/default/files/2015-12/EBOOK_IDR2016_FULLREPORT_0.pdf (accessed on 13 August 2018).
- United Nations Commodity Trade Statistics Database (Statistics Division). Available online: http://comtrade.un.org/db (accessed on 13 August 2018).
- Goncharova, N.; Goncharov, S.; Zaborovskaya, O. Assessment of business competitiveness for high-priority regional funding. In Proceedings of the 29th International Business Information Management Association Conference—Education Excellence and Innovation Management through Vision 2020: From Regional Development Sustainability to Global Economic Growth, Vienna, Austria, 3–4 May 2017; pp. 2718–2724. [Google Scholar]
- Melnikov, A.V.; Nadezhina, O.S.; Rudskaya, I.A. Improvement of the mechanism ensuring innovative development of the oil sector in times of crisis. In Proceedings of the 28th International Business Information Management Association Conference—Vision 2020: Innovation Management, Development Sustainability, and Competitive Economic Growth, Seville, Spain, 9–10 November 2016; pp. 2201–2209. [Google Scholar]
- Rodionov, D.G.; Rudskaya, I.A. Regional Innovative Environment in National Economic Development (The Case of Russia). Int. J. Ecol. Dev. 2017, 32, 20–28. [Google Scholar]
- Rudskaia, I. A regional innovation system: Formation features and growth areas (case study: St. Petersburg). In Proceedings of the 30th International Business Information Management Association Conference, IBIMA 2017—Vision 2020: Sustainable Economic development, Innovation Management, and Global Growth, Madrid, Spain, 8–9 November 2017; pp. 541–547. [Google Scholar]
- Bringezu, S. Possible target corridor for sustainable use of global material resources. Resources 2015, 4, 25–54. [Google Scholar] [CrossRef]
- Klochkov, Y.; Gazizulina, A.; Golovin, N. Assessment of organization development speed based on the analysis of standards efficiency. In Proceedings of the 2nd International Symposium on Stochastic Models in Reliability Engineering, Life Science, and Operations Management, SMRLO 2016, Beer Sheva, Israel, 15–18 February 2016; pp. 530–532. [Google Scholar]
- Koskela, S.; Mattila, T.; Antikainen, R.; Mäenpää, I. Identifying key sectors and measures for a transition towards a low resource Economy. Resources 2013, 2, 151–166. [Google Scholar] [CrossRef]
- World Bank: World Development Indicators. Available online: http://data.worldbank.org/indicator (accessed on 13 August 2018).
- Kusch, C.; Hills, S.D. The link between e-waste and GDP-New insights from data from the pan-European region. Resources 2017, 6, 15. [Google Scholar] [CrossRef]
- Rodionov, D.G.; Rudskaia, I.A.; Degtereva, V.A. Assessment of the effectiveness of regional innovation systems in Russia. In Proceedings of the 29th International Business Information Management Association Conference—Education Excellence and Innovation Management through Vision 2020: From Regional Development Sustainability to Global Economic Growth, Vienna, Austria, 3–4 May 2017; pp. 3437–3450. [Google Scholar]
- Azevedo, S.G.; Godina, R.; Matias, J.C.O. Proposal of a sustainable circular index for manufacturing companies. Resources 2017, 6, 63. [Google Scholar] [CrossRef]
- Demidenko, D.S.; Malinin, A.M.; Litvinenko, A.N. Optimization of the enterprise value on the basis of value added. In Proceedings of the 30th International Business Information Management Association Conference, IBIMA 2017—Vision 2020: Sustainable Economic development, Innovation Management, and Global Growth, Madrid, Spain, 8–9 November 2017; pp. 3017–3021. [Google Scholar]
- Sokolitsyn, A.S.; Ivanov, M.V.; Sokolitsyna, N.A. Investment policy: Determining short-term credit under circulating capital. In Proceedings of the 28th International Business Information Management Association Conference—Vision 2020: Innovation Management, Development Sustainability, and Competitive Economic Growth, Seville, Spain, 9–10 November 2016; pp. 2130–2144. [Google Scholar]
- Lavopa, A.; Szirmai, A. Industrialization in Time and Space. UNIDO/UNU-MERIT Background Papers for the UNIDO, Industrial Development Report 2016: IDR 2016 WP 6. 2015. Available online: https://www.merit.unu.edu/publications/working-papers/abstract/?id=5836 (accessed on 13 August 2018).
- United Nations Conference on Trade and Development: UnctadStat Reports. Available online: http://unctadstat.unctad.org/wds/ReportFolders/reportFolders.aspx (accessed on 13 August 2018).
- Alqahtani, A.Y.; Gupta, S.M. One-dimensional renewable warranty management within sustainable supply chain. Resources 2017, 6, 16. [Google Scholar] [CrossRef]
- Roos, G. Business model innovation to create and capture resource value in future circular material chains. Resources 2014, 3, 248–274. [Google Scholar] [CrossRef]
- Buckley, P.H.; Belec, J.; Anderson, A.D. Modeling cross-border regions, place-making, and resource management: A Delphi Analysis. Resources 2017, 6, 32. [Google Scholar] [CrossRef]
- Leismann, K.; Schmitt, M.; Rohn, H.; Baedeker, C. Collaborative consumption: Towards a resource-saving consumption culture. Resources 2013, 2, 184–203. [Google Scholar] [CrossRef]
- Niyazova, S.R.; Kuporov, J.J.; Nadezhina, O.S. Development of an adaptive management model for innovative activities of an enterprise. In Proceedings of the 28th International Business Information Management Association Conference—Vision 2020: Innovation Management, Development Sustainability, and Competitive Economic Growth, Seville, Spain, 9–10 November 2016; pp. 2210–2222. [Google Scholar]
- Rodionov, D.G.; Rudskaia, I.A.; Degtereva, V.A. Regional Foresight as a Technology for Development of the Regional Innovation System. In Proceedings of the 29th International Business Information Management Association Conference—Education Excellence and Innovation Management through Vision 2020: From Regional Development Sustainability to Global Economic Growth, Vienna, Austria, 3–4 May 2017; pp. 2699–2706. [Google Scholar]
- Boutwell, J.L.; Westra, J.V. Benefit transfer: A review of methodologies and challenges. Resources 2013, 2, 517–527. [Google Scholar] [CrossRef]
- Demidenko, D.S.; Malevskaya-Malevich, E.D. Features of optimal control of dynamic processes in enterprise economics. In Proceedings of the 27th International Business Information Management Association Conference—Innovation Management and Education Excellence Vision 2020: From Regional Development Sustainability to Global Economic Growth, IBIMA 2016, Milan, Italy, 4–5 May 2016; pp. 1606–1612. [Google Scholar]
- Klochkov, Y.; Klochkova, E.; Antipova, O.; Kiyatkina, E.; Vasilieva, I.; Knyazkina, E. Model of database design in the conditions of limited resources. Proceedings of 2016 5th International Conference on Reliability, Infocom Technologies and Optimization, ICRITO 2016: Trends and Future Directions, Noida, India, 7–9 September 2016; pp. 64–66. [Google Scholar]
- Barr, B.W. “An ounce of prevention is worth a pound of cure”: Adopting landscape-level precautionary approaches to preserve arctic coastal heritage resources. Resources 2017, 6, 18. [Google Scholar] [CrossRef]
- Bystrowska, M.; Wigger, K.; Liggett, D. The use of information and communication technology (ICT) in managing high arctic tourism sites: A collective action perspective. Resources 2017, 6, 33. [Google Scholar] [CrossRef]
- Manley, B.; Elliot, S.; Jacobs, S. Expedition cruising in the Canadian arctic: Visitor motives and the influence of education programming on knowledge, attitudes, and behaviours. Resources 2017, 6, 23. [Google Scholar] [CrossRef]
- Jacobs, B.; Boronyak-Vasco, L.; Moyle, K.; Leith, P. Ensuring resilience of natural resources under exposure to extreme climate events. Resources 2016, 5, 20. [Google Scholar] [CrossRef]
- Giurco, D.; Littleboy, A.; Boyle, T.; Fyfe, J.; White, S. Circular economy: Questions for responsible minerals, additive manufacturing and recycling of metals. Resources 2014, 3, 432–453. [Google Scholar] [CrossRef]
- Thomas-Seale, L.E.J.; Kirkman-Brown, J.C.; Attallah, M.M.; Espino, D.M.; Shepherd, D.E.T. The barriers to the progression of additive manufacture: Perspectives from UK industry. Int. J. Prod. Econ. 2018, 198, 104–118. [Google Scholar] [CrossRef]
- Demidenko, D.S.; Gorovoy, A.A.; Malevskaya-Malevich, E.D. The new elements of risk classification. In Proceedings of the 29th International Business Information Management Association Conference—Education Excellence and Innovation Management through Vision 2020: From Regional Development Sustainability to Global Economic Growth, Vienna, Austria, 3–4 May 2017; pp. 2217–2221. [Google Scholar]
- Hartl, R.F.; Kort, P.M. Possible market entry of a firm with an additive manufacturing technology. Int. J. Prod. Econ. 2017, 194, 190–199. [Google Scholar] [CrossRef]
- Liliyana, F.N.; Svirina, A.A.; Polina, O.R.; Garanin, D.A.; Lukashevich, N.S.; Leventsov, V.A. TechnoMOOC development of the basis of remote lab access. In Proceedings of the 2017 International Conference “Quality Management, Transport and Information Security, Information Technologies”, IT and QM and IS 2017, St. Petersburg, Russian Federation, 23–30 September 2017; pp. 680–684. [Google Scholar]
- Radharamanan, R. Group technology concepts as applied to flexible manufacturing systems. Int. J. Prod. Econ. 1994, 33, 133–142. [Google Scholar] [CrossRef]
- Gress, D.R.; Kalafsky, R.V. Geographies of production in 3D: Theoretical and research implications stemming from additive manufacturing. Geoforum 2015, 60, 43–52. [Google Scholar] [CrossRef]
- Koide, R.; Akenji, L. Assessment of policy integration of Sustainable Consumption and Production into national policies. Resources 2017, 6, 48. [Google Scholar] [CrossRef]
- Cozmei, C.; Caloian, F. Additive manufacturing flickering at the beginning of existence. Procedia Econ. Financ. 2012, 3, 457–462. [Google Scholar] [CrossRef]
- Finnveden, G.; Arushunyan, Y.; Brandao, M. Exergy as a measure of resource use in life cycle assessment and other sustainability assessment tools. Resources 2016, 5, 23. [Google Scholar] [CrossRef]
- Weller, C.; Kleer, R.; Piller, F.T. Economic implications of 3D printing: Market structure models in light of additive manufacturing revisited. Int. J. Prod. Econ. 2015, 164, 43–56. [Google Scholar] [CrossRef]
- Sokolitsyn, A.S.; Ivanov, M.V.; Sokolitsyna, N.A. Forming optimal enterprise development strategies. In Proceedings of the 30th International Business Information Management Association Conference, IBIMA 2017—Vision 2020: Sustainable Economic development, Innovation Management, and Global Growth, Madrid, Spain, 8–9 November 2017; pp. 1053–1063. [Google Scholar]
- Gebler, M.; Schoot Uiterkamp, A.J.M.; Visser, C. A global sustainability perspective on 3D printing technologies. Energy Policy 2014, 74, 158–167. [Google Scholar] [CrossRef]
- Schniederjans, D.G. Adoption of 3D-printing technologies in manufacturing: A survey analysis. Int. J. Prod. Econ. 2017, 183, 287–298. [Google Scholar] [CrossRef]
- Mellor, S.; Hao, L.; Zhang, D. Additive manufacturing: A framework for implementation. Int. J. Prod. Econ. 2014, 149, 194–201. [Google Scholar] [CrossRef] [Green Version]
- Nekrasova, T.; Leventsov, V.; Axionova, E. Evaluating the efficiency of investments in mobile telecommunication systems development. In Proceedings of the Lecture Notes in Computer Science (including subseries Lecture Notes in Artificial Intelligence and Lecture Notes in Bioinformatics) of 16th International Conference on Next Generation Teletraffic and Wired/Wireless Advanced Networks and Systems, NEW2AN 2016 and 9th conference on Internet of Things and Smart Spaces, ruSMART 2016, St. Petersburg, Russian Federation, 26–28 September 2016; pp. 741–751. [Google Scholar]
- Bokrantz, J.; Skoogh, A.; Berlin, C.; Stahre, J. Maintenance in digitalized manufacturing: Delphi-based scenarios for 2030. Int. J. Prod. Econ. 2017, 191, 154–169. [Google Scholar] [CrossRef]
- Klochkov, Y.; Gazizulina, A. Improvement of methodology of evaluation of efficiency of the etallurgical complex procebes development. In Proceedings of the Key Engineering Materials of 4th International Science and Technical Conference Metal Physics, Mechanics of Material and deformation processes, METALDEFORM 2015, Samara, Russia, 14–17 September 2015; pp. 453–460. [Google Scholar]
- Kitzes, J. An introduction to environmentally-extended input-output analysis. Resources 2013, 2, 489–503. [Google Scholar] [CrossRef]
- Tupenaite, L.; Lill, I.; Geipele, I.; Naimaviciene, J. Ranking of sustainability indicators for assessment of the new housing development projects: Case of the Baltic States. Resources 2017, 6, 55. [Google Scholar] [CrossRef]
- Erjavec, J.; Gradisar, M.; Trkman, P. Assessment of stock size to minimize cutting stock production costs. Int. J. Prod. Econ. 2012, 135, 170–176. [Google Scholar] [CrossRef]
- Kudryavtseva, T.J.; Ivanova, E.A.; Kozlova, E.A.; Skhvediani, A.E. Pricing and assessment of competitiveness of innovative medical devices in the context of commercialization strategy. Acad. Strateg. Manag. J. 2017, 16, 110–122. [Google Scholar]
- Sokolitsyn, A.S.; Ivanov, M.V.; Sokolitsyna, N.A. Statistic modeling industrial enterprises production process parameters. In Proceedings of the 30th International Business Information Management Association Conference, IBIMA 2017—Vision 2020: Sustainable Economic development, Innovation Management, and Global Growth, Madrid, Spain, 8–9 November 2017; pp. 1041–1052. [Google Scholar]
- Sokolitsyn, A.S.; Ivanov, M.V.; Sokolitsyna, N.A.; Semenov, V.P. Corporative structures participants economic interests coordination models. In Proceedings of the 19th International Conference on Soft Computing and Measurements, SCM 2016, Saint Petersburg, Russia, 25–27 May 2016; pp. 459–461. [Google Scholar]
- Tsatsulin, A.N.; Babkin, A.V.; Babkina, N.I. Analysis of the structural components and measurement of the effects of cost inflation in the industry with the help of the index method. In Proceedings of the 28th International Business Information Management Association Conference—Vision 2020: Innovation Management, Development Sustainability, and Competitive Economic Growth, Seville, Spain, 9–10 November 2016; pp. 1559–1573. [Google Scholar]
- Sfez, S.; Dewulf, J.; De Soete, W.; Schaubroeck, T.; Mathieux, F.; Kralisch, D.; De Meester, S. Toward a framework for resource efficiency evaluation in industry: Recommendations for research and innovation projects. Resources 2017, 6, 5. [Google Scholar] [CrossRef]
- Verlinden, B.; Duflou, J.R.; Collin, P.; Cattrysse, D. Cost estimation for sheet metal parts using multiple regression and artificial neural networks: A case study. Int. J. Prod. Econ. 2008, 111, 484–492. [Google Scholar] [CrossRef]
- Meijers, F.; Lengelle, R.; Kopnina, H. Environmental identity and natural resources: A dialogical learning process. Resources 2016, 5, 11. [Google Scholar] [CrossRef]
- Rudneva, L.; Pchelintseva, I.; Gureva, M. Scenario modelling of the “green” economy in an economic space. Resources 2018, 7, 29. [Google Scholar] [CrossRef]
- Wittbrodt, B.T.; Glover, A.G.; Laureto, J.; Anzalone, G.C.; Oppliger, D.; Irwin, J.L.; Pearce, J.M. Life-cycle economic analysis of distributed manufacturing with open-source 3-D printers. Mechatronics 2013, 23, 713–726. [Google Scholar] [CrossRef]
- Kian, R.; Gurler, U.; Berk, E. The dynamic lot-sizing problem with convex economic production costs and setups. Int. J. Prod. Econ. 2014, 155, 361–379. [Google Scholar] [CrossRef] [Green Version]
- Ni, D.; Li, K.W.; Tang, X. Production costs, scope economies, and multi-client outsourcing under quantity competition. Int. J. Prod. Econ. 2009, 121, 130–140. [Google Scholar] [CrossRef] [Green Version]
- Schmidt, M.; Nakajima, M. Material flow cost accounting as an approach to improve resource efficiency in manufacturing companies. Resources 2013, 2, 358–369. [Google Scholar] [CrossRef]
- Keskitalo, E.C.H.; Andersson, E. Why organization may be the primary limitation to implementing sustainability at the local level: Examples from Swedish case studies. Resources 2017, 6, 13. [Google Scholar] [CrossRef]
- Sokolitsyn, A.S.; Ivanov, M.V.; Sokolitsyna, N.A. Corporate Governance: Estimating Resource Providing Corporative Industrial Organization. In Proceedings of the 29th International Business Information Management Association Conference—Education Excellence and Innovation Management through Vision 2020: From Regional Development Sustainability to Global Economic Growth, Vienna, Austria, 3–4 May 2017; pp. 191–200. [Google Scholar]
- Yla-Mella, J.; Pongracz, E. Drivers and constraints of critical materials recycling: The case of indium. Resources 2016, 5, 34. [Google Scholar] [CrossRef]
- Rodionov, D.; Nikolova, L.; Velikova, M.; Kalubi, R.D.M. Competitive strength of a concession integration model of labour market to education market interaction. In Proceedings of the 28th International Business Information Management Association Conference—Vision 2020: Innovation Management, Development Sustainability, and Competitive Economic Growth, Seville, Spain, 9–10 November 2016; pp. 689–699. [Google Scholar]
- Scolobig, A.; Lilliestam, J. Comparing approaches for the integration of stakeholder perspectives in environmental decision making. Resources 2016, 5, 37. [Google Scholar] [CrossRef]
- Cucchiella, F.; D’Adamo, I.; Gastaldi, M. Future trajectories of renewable energy consumption in the European Union. Resources 2018, 7, 10. [Google Scholar] [CrossRef]
- Mancini, M.S.; Evans, M.; Iha, K.; Danelutti, C.; Galli, A. Assessing the ecological footprint of ecotourism packages: A methodological proposition. Resources 2018, 7, 38. [Google Scholar] [CrossRef]
- Zimmermann, T.; Gossling-Reisemann, S. Recycling potentials of critical metals-analyzing secondary flows from selected applications. Resources 2014, 3, 291–318. [Google Scholar] [CrossRef]
- Nedosekin, A.O.; Shmatko, A.D.; Abdoulaeva, Z.I. Fuzzy preliminary evaluation of industrial risks. In Proceedings of the XX IEEE International Conference on Soft Computing and Measurements, Saint-Petersburg, Russia, 24–26 May 2017; pp. 750–751. [Google Scholar]
Figure 1.
The share of value added of manufacturing in GDP, % [16].
Figure 1.
The share of value added of manufacturing in GDP, % [16].

Figure 2.
Design process for CNC and additive technologies.

Figure 3.
Scorecard and significance levels.


Table 1.
Indicators characterizing the investment attractiveness level of integration of additive technologies in the manufacturing process of an industrial enterprise operating in the Arctic zone.
Table 1.
Indicators characterizing the investment attractiveness level of integration of additive technologies in the manufacturing process of an industrial enterprise operating in the Arctic zone.
| No. | 1st Level | 2nd Level | Notation | Units | Direction of Influence |
|---|---|---|---|---|---|
| 1 | Potential reduction in material costs | The rate of material cost reduction | X1 | % | ↑=>↑ |
| 2 | The growth rate of the market capacity | X2 | % | ↑=>↑ | |
| 3 | Comparative remoteness from the main producers of the material | X3 | Score | ↑=>↓ | |
| 4 | Comparative remoteness from the main consumers of the material | X4 | Score | ↑=>↓ | |
| 5 | Number of non-returnable defected products | X5 | % | ↑=>↑ | |
| 6 | Number of non-recyclable wastes | X6 | % | ↑=>↑ | |
| 7 | The ratio of the price of the material to the analogues | X7 | 1/$ | ↑=>↓ | |
| 8 | The cost of pretreatment of the material | X8 | $ | ↑=>↑ | |
| 9 | Potential reduction in labor costs | Comparative level of personnel qualification | Y1 | Score | ↑=>↓ |
| 10 | Comparative number of staff | Y2 | People | ↑=>↓ | |
| 11 | Potential increase in personnel wages | Y3 | $ | ↑=>↓ | |
| 12 | Potential increase in labor intensity of maintenance staff | Y4 | $ | ↑=>↓ | |
| 13 | Potential reduction in equipment operating costs | Comparative cost of additive installation | Z1 | $ | ↑=>↓ |
| 14 | Useful lifetime of the additive installation | Z2 | Year | ↑=>↑ | |
| 15 | Comparative cost of additive installation service | Z3 | $ | ↑=>↓ | |
| 16 | Power consumption level of additive installation | Z4 | KWh/hour | ↑=>↓ | |
| 17 | Cost of auxiliary equipment and consumables | Z5 | $ | ↑=>↓ | |
| 18 | Probability of equipment failure | Z6 | % | ↑=>↓ | |
| 19 | Prevalence of additive installation | Z7 | Score | ↑=>↑ | |
| 20 | Footprint | Z8 | М2 | ↑=>↓ |
© 2019 by the authors. Licensee MDPI, Basel, Switzerland. This article is an open access article distributed under the terms and conditions of the Creative Commons Attribution (CC BY) license (http://creativecommons.org/licenses/by/4.0/).
Share and Cite
MDPI and ACS Style
Konnikov, E.A.; Konnikova, O.A.; Rodionov, D.G. Impact of 3D-Printing Technologies on the Transformation of Industrial Production in the Arctic Zone. Resources 2019, 8, 20. https://doi.org/10.3390/resources8010020
AMA Style
Konnikov EA, Konnikova OA, Rodionov DG. Impact of 3D-Printing Technologies on the Transformation of Industrial Production in the Arctic Zone. Resources. 2019; 8(1):20. https://doi.org/10.3390/resources8010020
Chicago/Turabian StyleKonnikov, Evgenii A., Olga A. Konnikova, and Dmitriy G. Rodionov. 2019. "Impact of 3D-Printing Technologies on the Transformation of Industrial Production in the Arctic Zone" Resources 8, no. 1: 20. https://doi.org/10.3390/resources8010020
Note that from the first issue of 2016, this journal uses article numbers instead of page numbers. See further details here.