The Ecological Footprint Accounting of Products: When Larger Is Not Worse
by
 , , , and
Nicoletta Patrizi
 ,
,
Valentina Niccolucci
*,
Riccardo M. Pulselli
,
Elena Neri
and
Simone Bastianoni
Ecodynamics Group, Dept. of Physical Sciences, Earth and Environment, University of Siena, 53100 Siena, Italy
*
Author to whom correspondence should be addressed.
Resources 2018, 7(4), 65; https://doi.org/10.3390/resources7040065
Submission received: 29 July 2018
/
Revised: 28 September 2018
/
Accepted: 9 October 2018
/
Published: 16 October 2018
(This article belongs to the Special Issue Ecological Footprint Assessment for Resources Management)
Abstract
:One of the main goals of any (sustainability) indicator should be the communication of a clear, unambiguous, and simplified message about the status of the analyzed system. The selected indicator is expected to declare explicitly how its numerical value depicts a situation, for example, positive or negative, sustainable or unsustainable, especially when a comparison among similar or competitive systems is performed. This aspect should be a primary and discriminating issue when the selection of a set of opportune indicators is operated. The Ecological Footprint (EF) has become one of the most popular and widely used sustainability indicators. It is a resource accounting method with an area based metric in which the units of measure are global hectares or hectares with world average bio-productivity. Its main goal is to underline the link between the (un)sustainability level of a product, a system, an activity or a population life style, with the land demand for providing goods, energy, and ecological services needed to sustain that product, system, activity, or population. Therefore, the traditional rationale behind the message of EF is: the larger EF value, the larger environmental impact in terms of resources use, the lower position in the sustainability rank. The aim of this paper was to investigate if this rationale is everywhere opportune and unambiguous, or if sometimes its use requires paying a special attention. Then, a three-dimensional modification of the classical EF framework for the sustainability evaluation of a product has been proposed following a previous work by Niccolucci and co-authors (2009). Finally, the potentialities of the model have been tested by using a case study from the agricultural context.
1. Introduction
Since the introduction of the Sustainable Development concept in 1992 [1], a growing number of sustainability indicators has been introduced with the aim to provide aggregated information regarding the state of the system assessed under different perspectives [2,3,4,5,6]. As acknowledged by Hezri and Hasan [7], an “indicator industry” has emerged following the requirement to implement and appraise sustainable development in a systemic way at different scale. The pursuit of sustainability has been recognized as the challenge of current time [8] as far as in the last three decades the need to sustainably manage Earth’s resources has grown among decision makers around the World [9]. In parallel, the social and scientific research of concepts, tools, and methodologies that are able to track impact of mankind on the Planet have also arisen [10].
The phenomenon of growing number and application of sustainability indicators has been recognized as “spreading indicator culture” [10,11]. However, the decision making process should be guided by a set of sustainability indicators that are able to represent the complexity of the Earth system without necessarily increasing the number of tools considered [10]. As underlined by Muller and Burkhard [12], an indicator is a communication tool used as proxy to simplify the high complexity in human-environmental systems: “[…] indicators generally are variables that provide aggregated information on certain phenomena […] used to depict or evaluate environmental conditions or changes or to set environmental goals”. The simplicity and immediateness of the message provided allow for communicating sustainability issue to the general public beyond the primary goal of informing and supporting policy making [13].
Thus, despite differences in approach, rationale and unit, a sustainability indicator must provide to the researcher as well as to the policy maker, a single, clear, and unambiguous message: how far is the evaluated system from sustainability, and, when compared with other similar systems or products, what are the respective positions in the sustainability rank [14,15]? These questions should drive the research when the selection of a set of indicators is operated.
According to Bastianoni and co-authors [16]: “in ecology and environmental planning, indicator is used as a synonym for indicans, i.e., a measure or component from which conclusions on the phenomenon of interest (the indicandum) can be inferred. Indication is the reflection (expression) of an indicandum by an indicator [17]. A good correlation between indicator and indicandum is a necessary condition for a faithful representation of the complexity of the phenomenon [18]”. In such perspective the Ecological Footprint accounting is consistent with these definitions and up until today is one of the most used methodologies in carrying on sustainability assessments [19,20,21,22,23,24,25,26,27,28].
The Ecological Footprint (hereafter EF) is a systemic environmental accounting tool introduced in the sustainability indicators panorama two decades ago, by the work of Rees and Wackernagel [29]. The EF has the aim to track the amount of biologically productive land and sea area—also called ecological assets—that is directly and indirectly demanded, on a continuous basis by humanity, to provide a specific subset of provisioning and regulating services that are required, given prevailing technologies and resource management practices [29,30].
EF is an area-based indicator and it accounts for those ecosystem assets where the photosynthetic activity occurs and solar energy is caught by autotrophic organism to assembly matter into every kind of biomass appropriate for humans [30,31,32,33]. This area is expressed in terms of global hectares or hectares with world average bioproductivity [32,34]. The hectares belong to six different ecological assets or land types: cropland, forest, grazing land, fishing ground, built up land and carbon uptake land [34]. All of these land types are scaled according to their ecological productivity by means of opportune scaling factors, namely Equivalence and Yield factors. A more detailed and comprehensive description of the EF accounting methodology can be found in Borucke et al. [35].
EF has a wide range of applications and it is useful for comparing systems of any scale (from small cities to nations) and monitoring a system over time [29,31,33,36]. This is also possible due to the introduction of a “counterpart” metric, called biocapacity (BC hereafter). BC tracks the ecological assets available in a specific region and their relative capacity to produce goods, energy and ecosystem services. BC, especially related to world level, represents the maximum value, beyond which, the human consumption is not sustained by natural resources and the human lifestyle is considered as unsustainable [35]. This latter case is globally referred to as overshoot situation and it occurs when resources are overused and waste accumulated. Humanity can still survive by relying in resources coming from stocks and/or emitting more waste than those ecosystems can accommodate [35].
Irrespective from the application performed or case study analyzed, EF explicitly uses the area of ecological assets as a proxy of environmental pressure. Similarly to other footprint based indicators (e.g., Water Footprint, Land Footprint, etc.), the rationale adopted by EF metric is quite simple and intuitive: the larger the EF value (i.e., the number of global hectares), the larger the environmental impact (in terms of resources use), the lowest position in the sustainability rank [14]. The aim of this paper is to carry out a thoughtful discussion on this rationale: is the outcomes of EF assessment and implications of the message everywhere opportune and unambiguous? Or rather, its use requires paying special attention in some case? To discuss and answer these research questions, case studies from the agriculture sector are used as examples.
2. Materials and Methods
2.1. Ecological Footprint of Product: The Classical Framework
The Ecological Footprint of a product (hereafter EFP) provides the measure of the resources demand on environment due to a product, service, or activity. The suggested unit of EFP is global hectare year (gha year) [36].
In this paper, all ofthe calculations have been performed according to the latest guidelines provided by the Ecological Footprint Standards committee of the Global Footprint Network (GFN) [36].
The EFP is calculated as the sum of the footprints of all n-activities required to create, use, and dispose the product P following the Life Cycle Assessment (LCA) approach [36,37]. The general equation is:
where i is the number of inventoried items that are involved in the P production chain and j the six different land types considered i.e., cropland, forest, fishing ground, grazing land, carbon uptake land, and built-up land.
EF calculation of each single input i is shown in Equation (2):
The sum of j-different land types is possible upon the conversion of hectare (A) in global hectares (i.e., hectares with world average productivity) by means of equivalence (EQF) and yield factors (YF) [29,36]. These factors are land productivity-based scaling factors: in particular, EQF converts a specific land type j (i.e., cropland) into a universal unit of biologically productive area (namely global hectare), while YF captures the differences between national and world-average productivity of a given land type [34]. The weighting is based on agricultural suitability indexes from the Global Agro-Ecological Zone (GAEZ) model [38]. After the conversions, world average hectares become hectares with world average productivity of all land types considered i.e., global hectares. Both YFs and EQFs for all land types, countries, and for a specific year, are calculated and provided by GFN, on a yearly basis [39].
Furthermore, specific conversion factors are needed for those data not directly expressed in area:
- -
- when input i is expressed in mass unit (M; t year−1), it can be translated into area (A) by the relative land efficiency conversion factor (Y), specific for product, region and season, called yield and expressed in t ha−1year−1 (see Equation (3)) [34].
- -
- when inputs are expressed in terms of carbon dioxide equivalents they can be converted in global hectares through Equation (4).where:
- -
- CDEi is the value of the Carbon Dioxide equivalent Emissions specific for each input i (tCO2eq);
- -
- AFCS (Average Forest Carbon Sequestration) is the long-term capacity of one hectare of world-average forest ecosystem to sequester atmospheric carbon dioxide through the photosynthesis mechanism. It has been recently updated in 0.73 tC ha−1year−1 or 2.67 tCO2 ha−1year−1 [40].
In general, the overall EF of a product can be divided in two components, indicated as direct (DIR) and indirect (IND), according to Equation (5):
where the EFDIR represents the product-specific EF that is linked to direct land use of forest, cropland, grazing land, and built-up, land types demanded by the production system to run. While the EFIND is referred to as the indirect or virtual land (i.e., carbon uptake) that would be required to sequester, via photosynthesis, the CO2 emissions produced along the production process.
2.2. Crop Products Selected as Case Study
Up to now, several EF assessments of products have been produced, being mainly dedicated to agriculture, especially focused on the comparison between organic vs conventional agricultural production systems [37,41,42,43,44,45,46,47,48].
A case study from the agricultural sector has been used to test the EFP framework applied in this study and support our thesis. Five agricultural productions have been selected: maize, soy beans, rye, barley, and wheat grains. All products were assumed as cultivated according to the current Italian practices. For each of them, both conventional and organic production systems have been considered. The inventory data, (i.e., the list of all energy and material inputs involved in the production process), usually used in LCA [49], derived from Ecoinvent 3.4 database [50]. The Ecoinvent database provided input flows regarding agricultural operations (e.g., machineries used during the different stages of cultivation, gasoline consumption, and chemicals), and transports, as well as direct emissions in air, soil, and water. Finally, the amount of physical land required to grow the crop was reported. The selected processes from the Ecoinvent database are reported in Table 1.
For a better comparison, inventories are referred to the same Functional Unit (FU), or the function of analysis, defined as the qualitative and quantitative aspects of the function(s) and/or service(s) that are provided by the product being evaluated [51] that is 1 kg of considered crop product. In this paper, the EF evaluations of the agricultural products was limited to just two land types (cropland and carbon uptake land), while the other land types were considered as not significant for agricultural productions or with negligible contribution [37]. Built-up land, even representing the shed of agricultural machineries, have been considered with a contribution that is close to zero and has not accounted in the final EFP.
The weighting factors (YFs and EQFs), as provided by GFN, are referred to the 2013 year (the latest available) and to Italy. For cropland YF = 0.94 and EQF = 1.29, while for carbon uptake land YF = 1.68 and EQF = 2.53 [39].
3. Ecological Footprint of Product: A Proposal for Three Dimensional Framework
The EF assessment of a product answers the research question: “how much of the planet’s regenerative capacity is required by that product in a year?”. So, in the classical EFP framework, the regenerative capacity of each specific land type is not taken into account, because all land types are scaled and adjusted according to their productivity, and then added all together. Through the double equivalence with EQFs and YFs all the different types of areas expressed in physical hectares (ha) are converted in one single type of area expressed in global hectares or hectares with world average productivity (i.e., gha) (see Equation (2)). In particular, the EQF factors capture, for the productivity (useful for humans), the difference among land-use categories at the global level. By definition, EQFs are calculated as the ratio between the maximum potential ecological productivity of world-average land of a specific land type (such as crop land) and the average productivity of all biologically-productive lands on Earth [34]. YFs capture the difference between local and global (world-average) productivity within a given land-use category. By definition, YFs are evaluated as the ratio between the yield for the production of each product i, in the considered nation, and the yield for the production of that same product in the world as a whole, with the world yield factor equal to 1 (by definition) [34].
According to the EF accounting, up to now, the “bio-productivity” property of a land is the only discriminating factor used for the sustainability assessment of a product. As such, when related to a specific product the EF rationale can be expressed as: a larger EF value (in gha) represents a larger environmental pressure due to the larger requirements in terms of appropriation of photosynthetic capacity for generating the product evaluated. In the sustainability evaluation through EF classical framework, neither YF nor EQF take into account the potential damage due to resources overexploitation or the different constraints that, for example, could limit the production system. This is one of the concerns and criticisms raised in the scientific community regarding the traditional EF approach [52].
The land type breakdown of the EF can represent a first important benchmark when two products are compared (e.g., from organic or conventional management) and provide a first necessary (but not sufficient) insight on the sustainability evaluation debate. For example, the use of one land type instead of another can have very different environmental implications. Let us consider two different ideal products A and B with same functional unit (FU) and a hypothetical EF value of 5 gha year FU−1. This data affirms that they place the same resources demand and pose the same environmental pressure, thus occupying the same position in the sustainability rank. The land type composition needs to be taken into consideration to provide a more meaningful insight on the rank position. For simplicity, in this paper, just cropland (CROP) and carbon uptake (CUL) land are considered as the main land types involved.
Now, at least two different sustainability rank scenarios can be formulated based on these initial assumptions: scenario 1 excludes the land type composition, while scenario 2 includes it. Theoretically, the two rank could show different results. Furthermore, when the land type composition is specified, it should be considered if the production of A and/or B is limited by some constraints. For example, in this specific case, the availability of cropland and/or the carbon sequestration capacity could be seen as a potential limiting factor for sustainability. So, in the case of Scenario 2, two new sub-scenarios can be defined according to the main relevant constraints: scenario 2.1 named “a full cropland world” representing a situation where surfaces for crop production are no more available and scenario 2.2 named “a full CO2 world”, depicting a situation where the world absorption capacity has been saturate.
Table 2 summarizes the two scenarios of sustainability for the hypothesized products A and B: Scenario 1 (results without disaggregation) and Scenario 2 (with disaggregation by land type), as well as its two sub-scenarios (2.1. and 2.2.).
According to data reported in Table 2, when availability of cropland represents a limiting factor the #B is the more sustainable production, and vice versa, when carbon sequestration is a limiting factor, production #A should be preferred. Since the accumulation of CO2 in the atmosphere is currently the major concern of humankind at the global level, the scenario “full CO2 world” should be considered as the more realistic case. As such, the metric suggested, is that, at equal EF, the more sustainable product is that with the lowest EFCUL component. But, at the local level, this point of view could be inverted if the constraints are different from those global.
Generalizing, according to the actual condition of Earth planet, those practices with larger EFDIR (i.e., EF referring to direct land use of forest, cropland, grazing land and built-up, land types) should be preferred because it implied a higher ability to deploy local resources in obtaining products without compromising common goods (namely forest required to sequester CO2 emissions). Vice versa, the EFIND component should be as small as possible.
In general, to get the same amount of product, an organic production requires more extensive land because of the lower yield, with respect to a conventional production with higher yield. It should be also considered that substantial changes may arise by modifying the FU: to cite an example, LCA studies on conventional vs organic productions showed that organic practices have lower impacts in terms of area but not necessarily per product unit [53].
In order to overcome this limitation of the current EF methodology (i.e., classical framework), a Three Dimensional Ecological Footprint model for products (3DEFP) is here proposed. Similarly, to the model presented by Niccolucci and co-authors [54,55], the idea behind this approach was to divide the total EF into two components, called size and depth, to capture differences in land type use. Size component deal with use of natural capital flows and include all EFDIR components, while depth accounts for depletion of natural capital stocks and refers to EFIND. EFP and 3DEFP must outcome the same numerical result (see Equation (6)):
Let us consider the EFP as given by the sum of just two land type components: cropland (EFDIR) and carbon uptake land (EFIND) (Equation (7)):
To derive size and depth component, Equation (8) is used.
In a scenario in which the CO2 emissions are the limiting factor, the size component (EFSIZE) is given by the land type components annually renewed (and in general for those component that do not present a deficit). Its unit is gha year FU−1.
The depth component is given by 1 (natural depth) plus the ratio of EFIND to EFDIR (or, in this case, EFCUL to EFCROP) (additional depth). This component is dimensionless.
The splitting in two components allows for a better comparison of the different systems (i.e., agricultural product) on two bases, thus overcoming the shortcoming of the classical EFP framework above mentioned.
As general rule, the EFDEPTH component should be as much closer as possible to 1, while for the EFSIZE, there are not particular conditions, and anyway, a lower value is always preferred.
As a remark for the final choice between two competitive products, it should be always preferred the one that minimize the use of ecological goods and services and enables the avoidance waste of resources.
4. Results
In order to test the potentiality of the innovative three dimensional framework proposed (3DEFP) with respect to the classical framework (EFP), five agricultural products, grown according to conventional and organic Italian protocols, have been used as proxy. Table 3 reports main results from classical approach showing also the land type composition.
The EF results per FU show ranges quite similar for the two agricultural production practices assessed: it ranges from 0.35 gha year t−1(maize) to 0.94 (soy beans) in organic production, while from a minimum value of 0.38 (maize) to a maximum of 0.95 (soy beans) for conventional ones. These results are in line with those that were produced by other studies [56,57].
The ranking of the products is the same for both the production practices: maize, rye, barley, wheat grain, and soy beans, according to a growing trend. Rye and barley occupies inverted position in the two ranks.
It is observed that maize and soy beans grown according to conventional agricultural practices require slightly more bioproductive land than the equivalent organic production. On the contrary, grains (rye, barley, and wheat) grown according to organic agricultural practices showed a higher EF (in some case broadly) with respect to the equivalent conventional.
In addition, the EF average value of the products for both types of cultivation (as simple average of the five products) is: 0.53 gha year t−1.
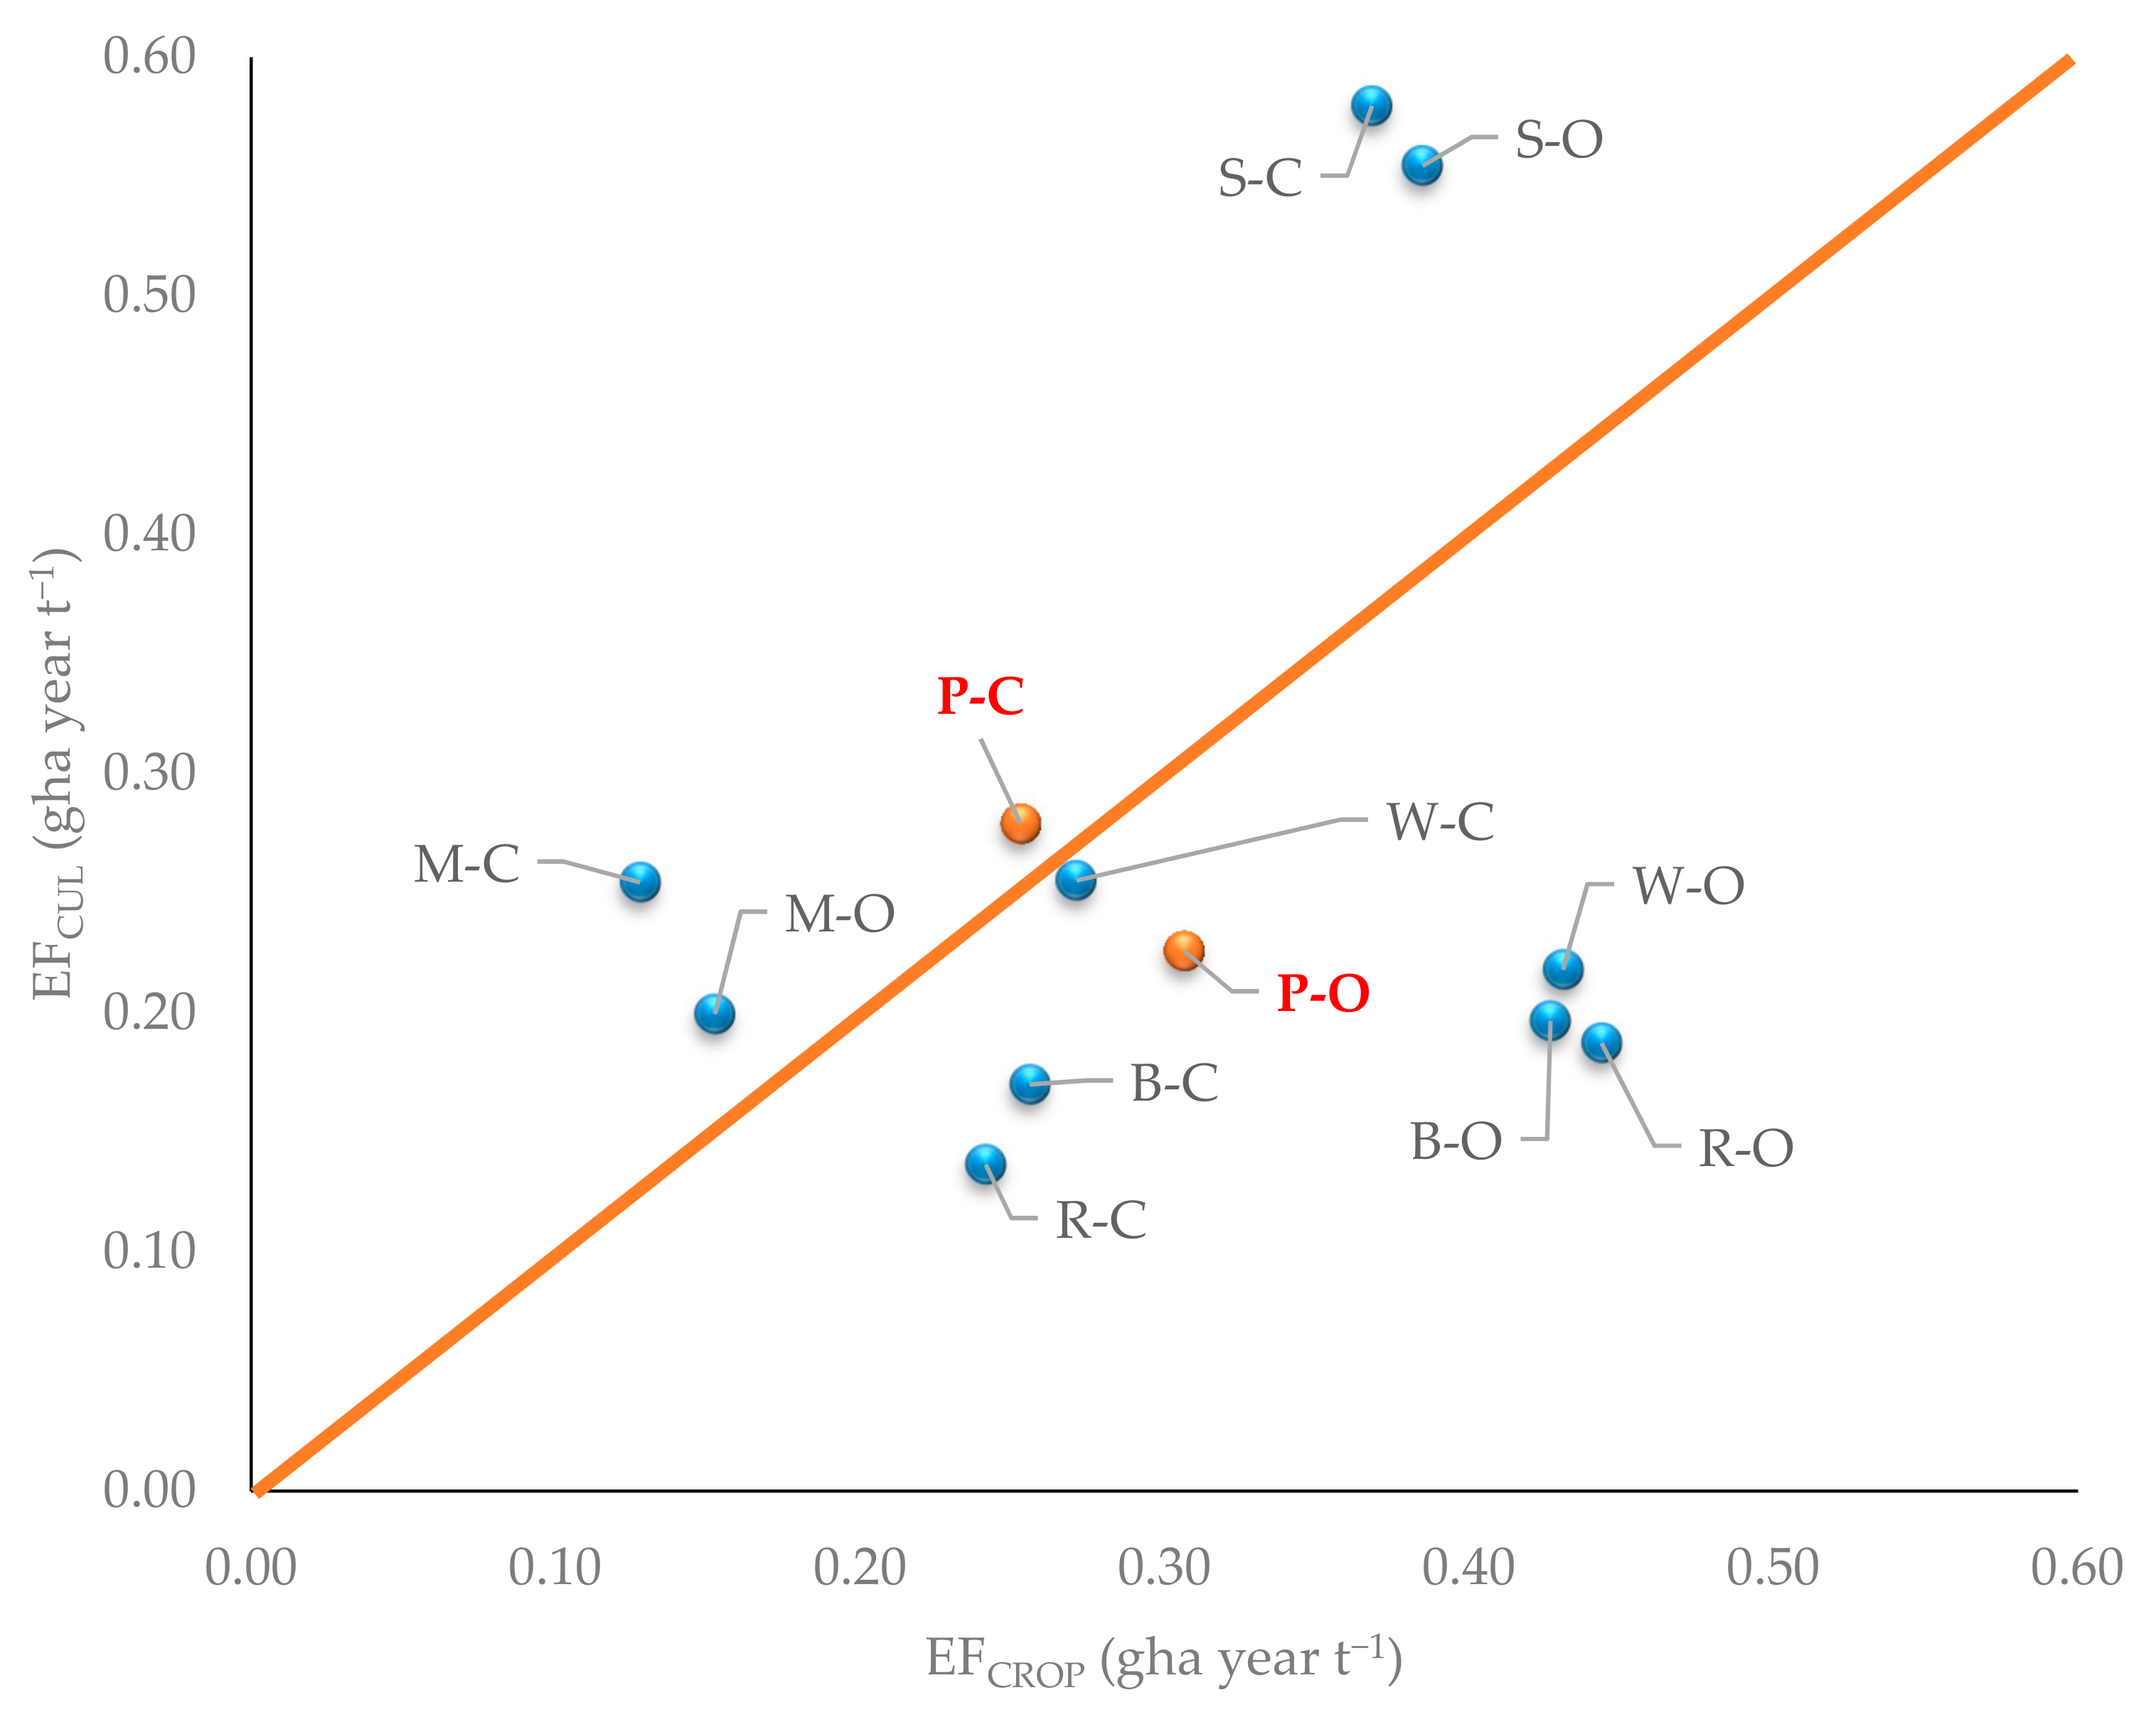
Figure 1 reports the EF scattered plot according to the EFCUL and EFCROP of all products (blue points) and of the average products (red points). The EF reported by land type composition for the average products (P) shows, on average, 50% cropland and 50% carbon uptake land (the point is on the diagonal) for conventional practices, while 60% vs. 40% (the point is farther from the diagonal) respectively, for organic production. This evidence supports the idea that, conventional productions, on average, required a higher EFCUL and a lower EFCROP with respect to the organic production which show an opposite trend: a higher EFCROP and a lower EFCUL.
For grains (rye, barley, and wheat), the principal contribution to EF derives from cropland, ranging from 51% to 64% for conventional production and from 66% to 70% for organic ones. While for maize and soy beans the highest EF contribution is due to the carbon uptake land (ranging from 57% to 59% for conventional and from 61% to 67% for organic).
The percentage difference, between EF of organic and conventional products is low in the case of soy beans and maize (−1% and −8%, respectively), while it becomes relevant in the case of grains ranging from +23% (wheat) to +67% (rye).
Table 4 reports results derived from the application of the 3DEFP framework for the same five agriculture products.
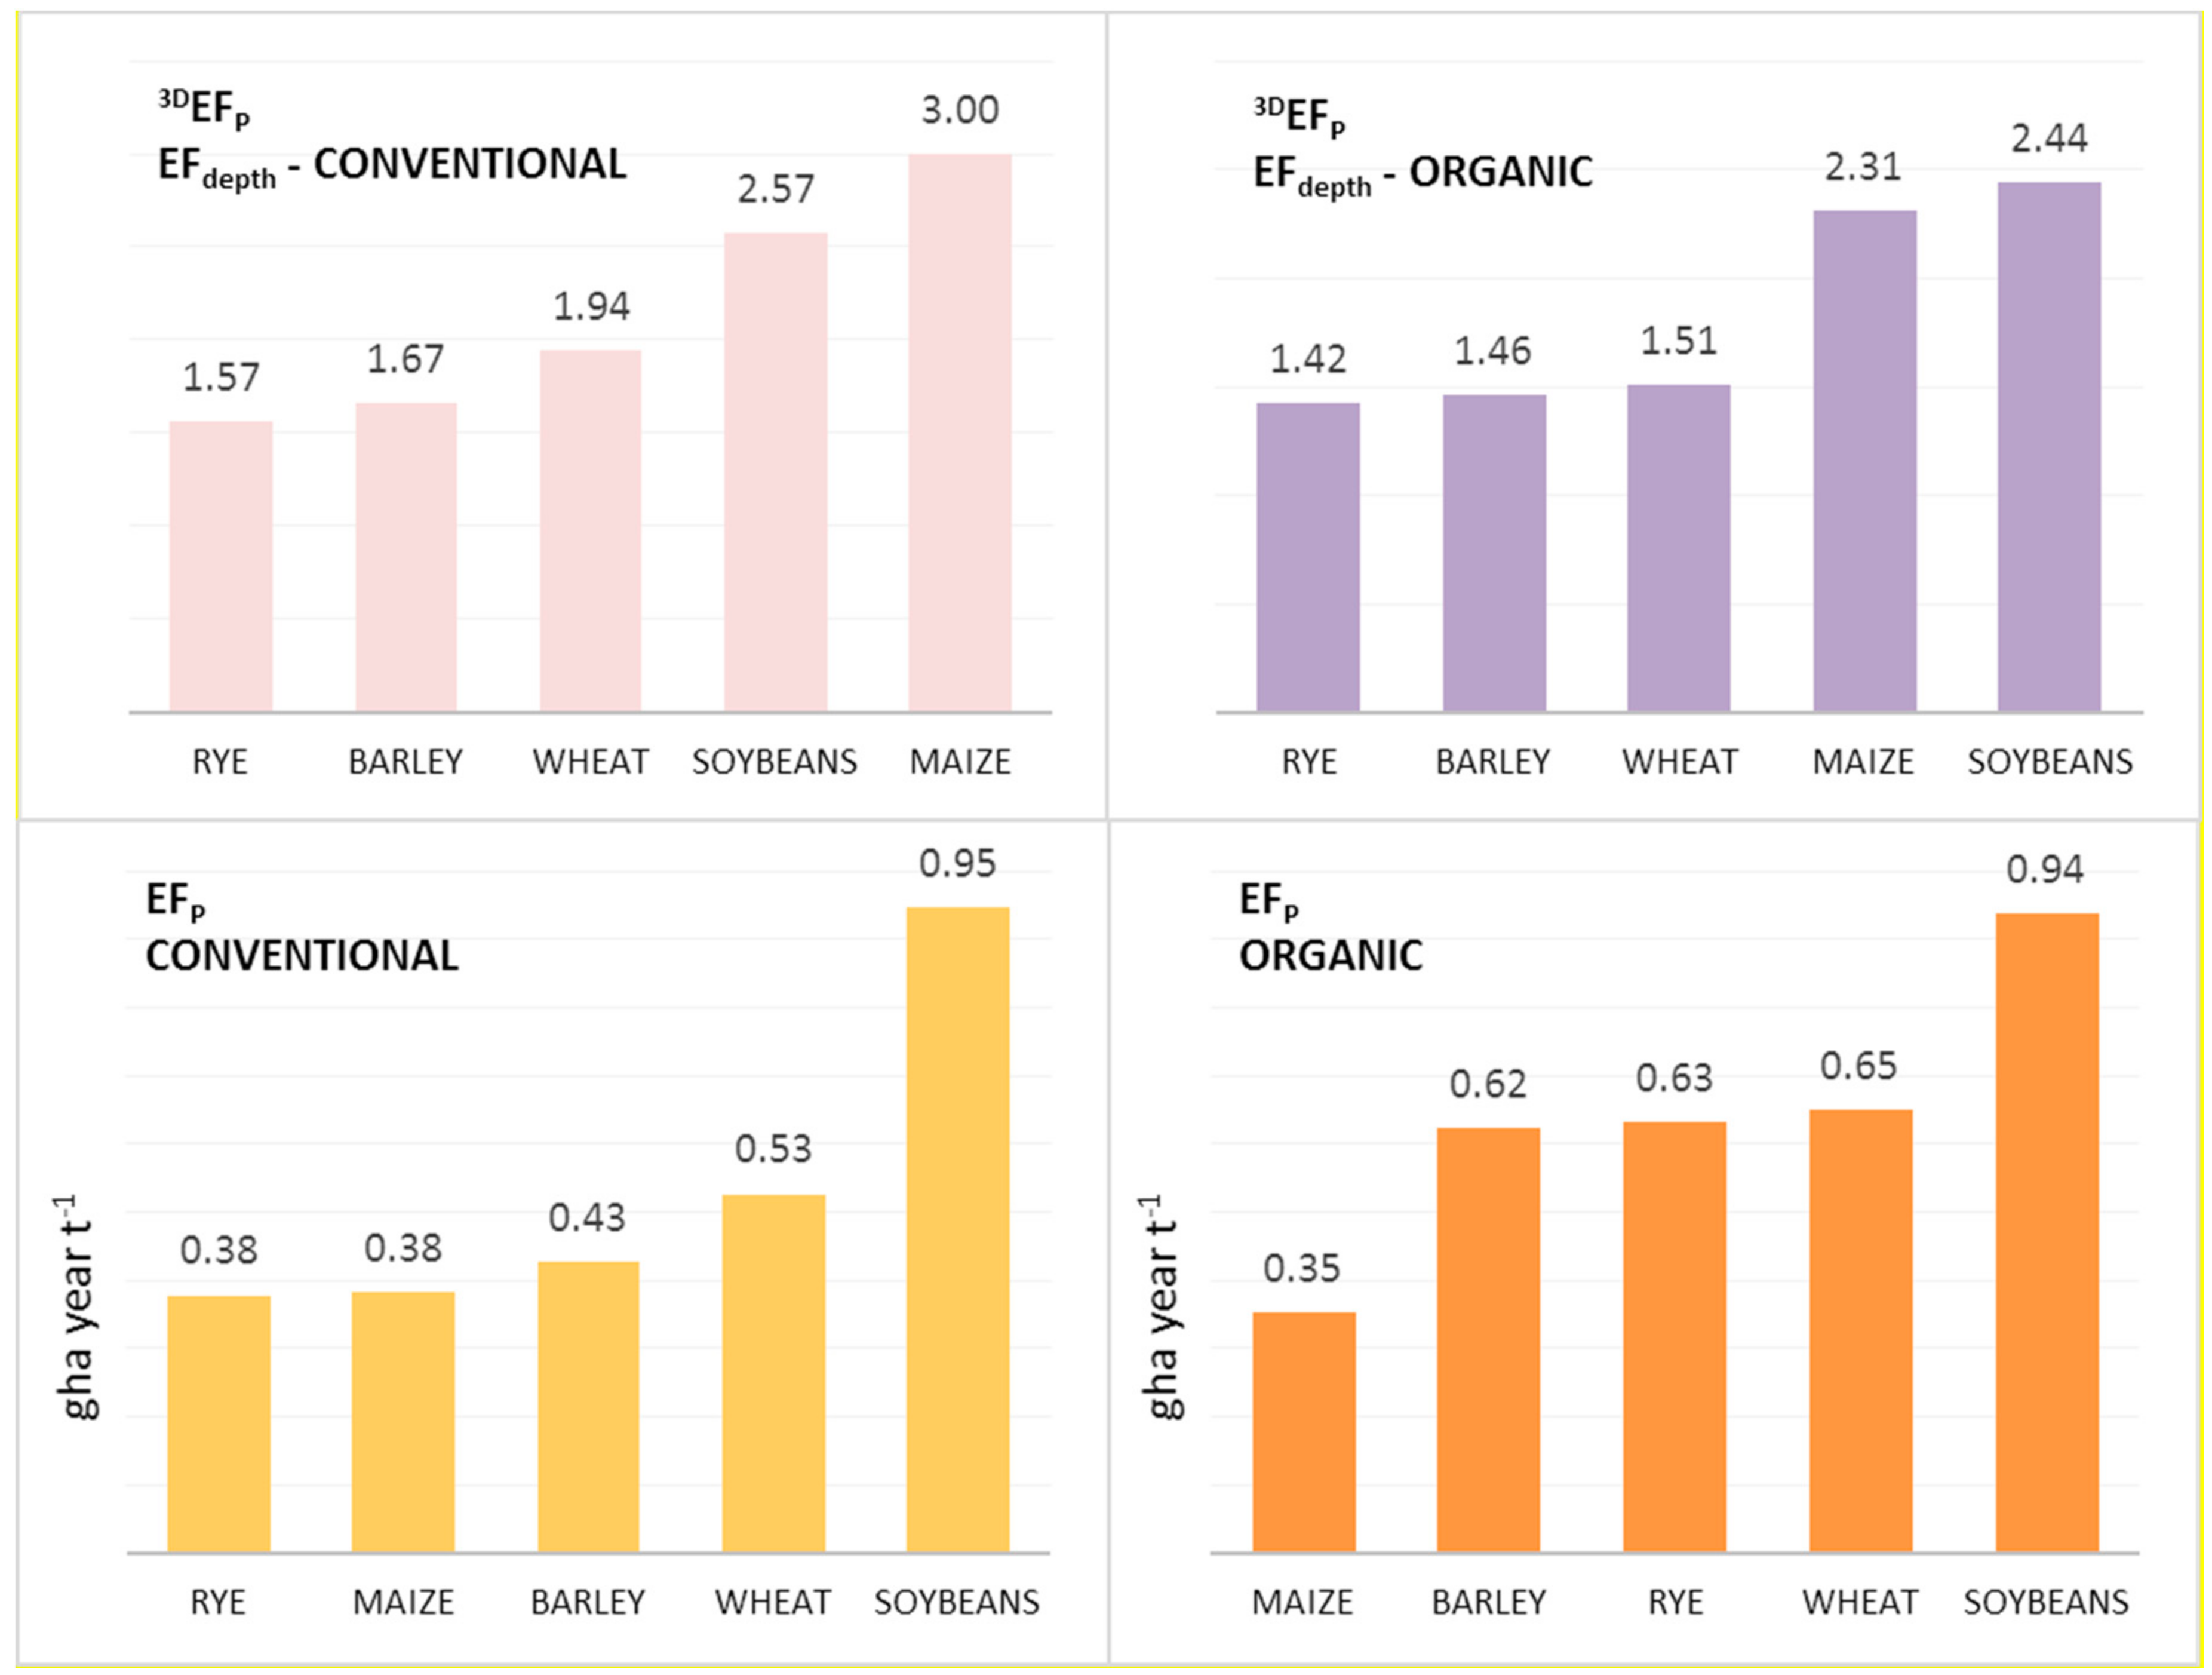
EFSIZE ranges from 0.15 to 0.44 gha year t−1 for organic products and from 0.13 to 0.37 gha year t−1 for conventional products. Since the range among the minimum and maximum value is shorter for the organic crops than the conventional ones, EFSIZE of organic products is always univocally larger than the EFSIZE of conventional ones, which is mainly due to a lower yield obtained in organic practice. The difference is lower for grain maize (19%) and soy bean (5%) while for the other agricultural products (rye 84%, barley 67%, wheat grain 59%) is more relevant.
EFDEPTH ranges from 1.42 to 2.44 for organic products and from 1.57 to 3.00 for conventional products. In this case, the range among minimum and maximum value is shorter for organic examples. EFDEPTH of conventional products is always larger than the value of organic, due to higher CO2 emissions.
Since the Earth system is now in the situation that is depicted in scenario 2.2, “a full world” scenario, the same condition is considered for the case study and EFDEPTH is chosen as a parameter for the implementation of the sustainability rank. Accordingly, the most sustainable production results is rye for both production practices, while the less is grain maize for conventional and soy beans for organic.
In Figure 2, sustainability ranks based on EFP and 3DEFP frameworks are depicted and the two different tendencies can be appraised.
While the EFP classical framework accounts for the overall resources demand, the 3DEFP framework is able to focus on those resources that represent a limiting factor for sustainable development. Accordingly, in the conventional agriculture rye is the most sustainable for both frameworks as it has at the same time the lowest EFP value and the lowest EFCUL and EFDEPTH with respect to the other conventional products. On the other hand, maize that is produced conventionally has the lower EFP (as rye) but the larger EFCUL as well EFDEPTH component, then it falls from 1 to 5 position in the sustainability rank.
Changes in the rank position are also highlighted in the basket of organic products: maize, for example, shifts its position from 1 to 4 in the rank, in spite of a lower EFP, which is mainly due to a high contribution of EFCUL (57%) and EFDEPTH component.
5. Discussion and Conclusions
The debate on the usefulness of Ecological Footprint method applied to products is still open [52]. Some interesting methodological changes in the EF framework have been recently proposed to overcome EF limits in evaluating agricultural products [see 16,42,43,44,46,47 among others]. However, all of the proposed changes require specific data to be added or implemented within the calculation procedures.
In our perspective, the EFP is a powerful accounting tool for sustainability assessment but it must be applied and then interpreted in the proper way. The EF belongs to area based indicator family, and thus it expresses the environmental impact in terms of (bio productive) land appropriation: in these terms, products requiring a larger extension of bio productive land (i.e., organic) have a larger footprint than intensive productions (i.e., conventional). This may produce misleading information in some case. This paper provides insights in this issue and proposes a solution to make steps forwards.
The 3DEFP framework has been developed on the basis of two major considerations: (i) the importance of taking into consideration the land types composition and the different environmental consequences of land use and (ii) the presence of constrains or limiting factors for sustainable development. The conversion of several land types into a common denominator (i.e., global hectares) is a fundamental property for systemic indicators that are aimed to capture very different aspects at the same time. Given that the record of land type composition is the first necessary information to be considered in order to appraise the impact of a production system, it is not sufficient because the actual impact could be larger. The bioproductivity just expresses the ability of a land type to produce goods and ecological assets that are useful for humankind, but it does not express if the land type is or could be, for example, a limiting factor for the development of a farm or a country. Agricultural products are an interesting proxy to highlight this difference. One global hectare of cropland and one global hectare of carbon uptake land represent both 1 gha but the environmental consequence of using the first instead of the second could be different. Furthermore, the lack of carbon uptake land, i.e., the forest area that is needed to sequester the atmospheric CO2, is widely considered as the major limiting factor for world sustainability nowadays. This type of area that is currently demanded by humankind is considerably larger than the available one.
It should be also highlighted that the classical and three-dimensional frameworks are not opponent. They produce the same numerical results but the 3DEFP framework could provide an understanding of overexploitation of resources placed by production processes investigated, allowing for mindful results. Moreover, the 3DEFP framework applied to product is in line with the research agenda that was drawn by Mancini and co-authors [31] regarding the distinction between stock and flows in the EF.
The three-dimensional framework might not solve all EFP drawbacks but it can help to enhance the comprehension of contradictory EF results. At the same time, it helps to recognize the responsibility of our actions. In fact, while the request of EFSIZE has intra generational implications, the EFDEPTH show our responsibility towards future generations (inter-generational).
As last point, the strength and weakness of an indicator or methodology is strictly connected to the quality of raw data used for its calculation. Often the scarce availability and quality of data influence the method reliability and messages derived. The selection of opportune and affordable data should be the first step towards a better comprehension of the system analyzed through any indicator lens.
Author Contributions
Conceptualization, V.N., S.B.; Data curation, V.N., N.P., E.N.; Formal analysis, N.P., E.N.; Funding acquisition, S.B., R.M.P.; Investigation, V.N., R.M.P.
Funding
This research received no external funding
Conflicts of Interest
The authors declare no conflict of interest.
Abbreviations
| AFCS | Average Forest Carbon Sequestration |
| BC | Biocapacity |
| CDE | Carbon Dioxide equivalent Emissions |
| EF | Ecological Footprint |
| EFCROP | Cropland Land component of Ecological Footprint |
| EFCUL | Carbon Up-take Land component of Ecological Footprint |
| EFP | Ecological Footprint of |
| EFSIZE | Size component of Ecological Footprint |
| EFDEPTH | Depth component of Ecological Footprint |
| EQF | EQuivalence Factor |
| FU | Functional Unit |
| GAEZ | Global Agro-Ecological Zone |
| YF | Yield Factor |
References
- World Commission on Environment and Development (WCED). Our Common Future; Oxford University Press: Oxford, UK, 1987. [Google Scholar]
- Moreno Pires, S. Indicators of sustainability. In Encyclopedia of Quality of Life and Well-Being Research; Michalos, A.C., Ed.; Springer: Dordrecht, The Netherlands, 2014; pp. 3209–3214. ISBN 978-94-007-0752-8. [Google Scholar]
- Tiezzi, E.; Bastianoni, S. Sustainability of the Siena Province through ecodynamic indicators. J. Environ. Manag. 2008, 86, 329–331. [Google Scholar] [CrossRef] [PubMed]
- Bastianoni, S.; Pulselli, F.M.; Focardi, S.; Tiezzi, E.B.P.; Gramatica, P. Correlations and complementarities in data and methods through Principal Components Analysis (PCA) applied to the results of the SPIn-Eco Project. J. Environ. Manag. 2008, 86, 419–426. [Google Scholar] [CrossRef] [PubMed]
- Pulselli, R.M.; Pulselli, F.M.; Rustici, M. Emergy accounting of the Province of Siena: Towards a thermodynamic geography for regional studies. J. Environ. Manag. 2008, 86, 342–353. [Google Scholar] [CrossRef] [PubMed]
- Bagliani, M.; Galli, A.; Niccolucci, V.; Marchettini, N. Ecological footprint analysis applied to a sub-national area: The case of the Province of Siena (Italy). J. Environ. Manag. 2008, 86, 354–364. [Google Scholar] [CrossRef] [PubMed]
- Hezri, A.; Hasan, N. Management Framework for Sustainable Development Indicators in the State of Selangor, Malaysia. Ecol. Indic. 2004, 4, 287–304. [Google Scholar] [CrossRef]
- Sachs, J.D. The Age of Sustainable Development; Columbia University Press: New York, NY, USA, 2015. [Google Scholar]
- United Nations Commission on Sustainable Development (UNCSD). The Future We Want: Outcome Document Adopted at Rio+20. 2012. Available online: http://www.uncsd2012.org/content/documents/727The%20Future%20We%20Want%2019%20June%201230pm.pdf (accessed on 9 June 2018).
- Pulselli, F.M.; Moreno Pires, S.; Galli, A. The need for an integrated assessment framework to account for Humanity’s pressure on the earth system. In The Safe Operating Space Treaty: A New Approach to Managing Our Use of the Earth System; Magalhaes, P., Steffen, W., Bosselmann, K., Aragao, A., Soromenho-Marques, V., Eds.; Cambridge Scholars Publishing: Cambridge, UK, 2016; pp. 213–245. ISBN 978-1-4438-8903-2. [Google Scholar]
- Riley, J. The indicator explosion: Local needs and international challenges. Agric. Ecosyst. Environ. 2001, 87, 119–120. [Google Scholar] [CrossRef]
- Müller, F.; Burkhard, B. The Indicator Side of Ecosystem Services. Ecosyst. Serv. 2012, 1, 26–30. [Google Scholar] [CrossRef]
- Collins, A.; Galli, A.; Patrizi, N.; Pulselli, F.M. Learning and teaching sustainability: The contribution of Ecological Footprint calculators. J. Clean. Prod. 2018, 174, 1000–1010. [Google Scholar] [CrossRef]
- Pulselli, F.M.; Bastianoni, S.; Marchettini, N.; Tiezzi, E. The Road to Sustainability. GDP and the Future Generations; WIT Press: Southampton, UK, 2008; p. 240. ISBN 978-1-84564-140-5. [Google Scholar]
- Veleva, V.; Hart, M.; Greiner, T.; Crumbley, C. Indicators of sustainable production. J. Clean. Prod. 2001, 9, 447–452. [Google Scholar] [CrossRef]
- Bastianoni, S.; Niccolucci, V.; Pulselli, R.M.; Marchettini, N. Indicator and Indicandum: ‘sustainable way’ vs ‘prevailing technology’ in Ecological Footprint definition. Ecol. Indic. 2012, 16, 47–50. [Google Scholar] [CrossRef]
- Heink, U.; Kowarik, I. What are indicators? On the definition of indicators in ecology and environmental planning. Ecol. Indic. 2010, 10, 584–593. [Google Scholar] [CrossRef]
- Müller, F. Indicating ecosystem and landscape organisation. Ecol. Indic. 2005, 5, 280–294. [Google Scholar] [CrossRef]
- Galli, A.; Halle, M.; Grunewald, N. Physical limits to resource access and utilization and their economic implications in Mediterranean economies. Environ. Sci. Policy 2015, 51, 125–136. [Google Scholar] [CrossRef]
- Baabou, W.; Grunewald, N.; Ouellet-Plamondon, C.; Gressot, M.; Galli, A. The Ecological Footprint of Mediterranean cities: Awareness creation and policy implications. Environ. Sci. Policy 2017, 69, 94–104. [Google Scholar] [CrossRef]
- Collins, A.; Flynn, A.; Wiedmann, T.; Barrett, J. The environmental impacts of consumption at a subnational level. J. Ind. Ecol. 2006, 10, 9–24. [Google Scholar] [CrossRef]
- Galli, A.; Iha, K.; Halle, M.; El Bilali, H.; Grunewald, N.; Eaton, D.; Capone, R.; Debs, P.; Bottalico, F. Mediterranean countries’ food consumption and sourcing patterns: An Ecological Footprint viewpoint. Sci. Total Environ. 2017, 578, 383–391. [Google Scholar] [CrossRef] [PubMed]
- Coscieme, L.; Pulselli, F.M.; Niccolucci, V.; Patrizi, N.; Sutton, P.C. Accounting for “land-grabbing” from a biocapacity viewpoint. Sci. Total Environ. 2016, 539, 551–559. [Google Scholar] [CrossRef] [PubMed]
- Ulucak, R.; Lin, D. Persistence of policy shocks to Ecological Footprint of the USA. Ecol. Indic. 2017, 80, 337–343. [Google Scholar] [CrossRef]
- Galli, A.; Kitzes, J.; Niccolucci, V.; Wackernagel, M.; Marchettini, N. Assessing the global environmental consequences of economic growth through the Ecological Footprint: A focus on China and India. Ecol. Indic. 2012, 17, 99–107. [Google Scholar] [CrossRef]
- Galli, A. On the rationale and policy usefulness of ecological footprint accounting: The case of Morocco. Environ. Sci. Policy 2015, 48, 210–224. [Google Scholar] [CrossRef]
- Niccolucci, V.; Tiezzi, E.; Pulselli, F.M.; Capineri, C. Biocapacity vs Ecological Footprint of world regions: A geopolitical interpretation. Ecol. Indic. 2012, 16, 23–30. [Google Scholar] [CrossRef]
- Coscieme, L.; Niccolucci, V.; Giannetti, B.F.; Pulselli, F.M.; Marchettini, N.; Sutton, P.C. Implications of land-grabbing on the ecological balance of Brazil. Resources 2018, 7, 44. [Google Scholar] [CrossRef]
- Wackernagel, M.; Rees, W.E. Our Ecological Footprint: Reducing Human Impact on the Earth; New Society: Gabriola Island, BC, Canada, 1996; 160p, ISBN 0-8657-312-X. [Google Scholar]
- Mancini, M.S.; Galli, A.; Coscieme, L.; Niccolucci, V.; Lin, D.; Pulselli, F.M.; Bastianoni, S.; Marchettini, N. Exploring ecosystem services assessment through Ecological Footprint accounting. Ecosyst. Serv. 2018, 30, 228–235. [Google Scholar] [CrossRef]
- Mancini, M.S.; Galli, A.; Niccolucci, V.; Lin, D.; Hanscom, L.; Wackernagel, M.; Bastianoni, S.; Marchettini, N. Stocks and flows of natural capital: Implications for ecological footprint. Ecol. Indic. 2017, 77, 123–128. [Google Scholar] [CrossRef]
- Rees, W.E. Revisiting Carrying Capacity: Area-Based Indicators of Sustainability. Popul. Environ. 1996, 17, 195–215. [Google Scholar] [CrossRef]
- Rees, W.E. Ecological Footprint, Concept of. Encyclopedia of Biodiversity. Academic Press: Waltham, MA, USA, 2013; Volume 2, pp. 701–713. [Google Scholar]
- Galli, A.; Kitzes, J.; Wermer, P.; Wackernagel, M.; Niccolucci, V.; Tiezzi, E. An exploration of the mathematics behind the Ecological Footprint. Int. J. Ecodynamics 2007, 2, 250–257. [Google Scholar] [CrossRef]
- Borucke, M.; Moore, D.; Cranston, G.; Gracey, K.; Katsunori, I.; Larson, J.; Lazarus, E.; Morales, J.C.M.; Wackernagel, M.; Galli, A. Accounting for demand and supply of the biosphere’s regenerative capacity: The National Footprint Accounts’ underlying methodology and framework. Ecol. Indic. 2013, 24, 518–533. [Google Scholar] [CrossRef]
- Global Footprint Network (GFN). Ecological Footprint Standards. 2009. Available online: https://www.footprintnetwork.org/content/images/uploads/Ecological_Footprint_Standards_2009.pdf (accessed on 20 April 2018).
- Niccolucci, V.; Galli, A.; Kitzes, J.; Pulselli, R.M.; Borsa, S.; Marchettini, N. Ecological Footprint analysis applied to the production of two Italian wines. Agric. Ecosyst. Environ. 2008, 128, 162–166. [Google Scholar] [CrossRef]
- FAO; International Institute for Applied Systems Analysis (IIASA). Global Agro-Ecological Zones. 2000. Available online: http://www.fao.org/ag/agl/agll/gaez/index.htm (accessed on 20 may 2018).
- GFN, NFA. Free Public Data Set. 2018. Available online: https://www.footprintnetwork.org/licenses/public-data-package-free-2018/ (accessed on 3 April 2018).
- Mancini, M.S.; Galli, A.; Niccolucci, V.; Lin, D.; Bastianoni, S.; Wackernagel, M.; Marchettini, N. Ecological Footprint: Refining the carbon Footprint calculation. Ecol. Indic. 2016, 61, 390–403. [Google Scholar] [CrossRef]
- Mayer, A.L. Strengths and weaknesses of common sustainability indices for multidimensional systems. Environ. Int. 2008, 34, 277–291. [Google Scholar] [CrossRef] [PubMed]
- Cerutti, A.K.; Beccaro, G.L.; Bagliani, M.; Donno, D.; Bounous, G. Multifunctional Ecological Footprint Analysis for assessing eco-efficiency: A case study of fruit production systems in Northern Italy. J. Clean. Prod. 2013, 40, 108–117. [Google Scholar] [CrossRef]
- Passeri, N.; Borucke, M.; Blasi, E.; Franco, S.; Lazarus, E. The influence of farming technique on cropland: A new approach for the Ecological Footprint. Ecol. Indic. 2013, 29, 1–5. [Google Scholar] [CrossRef]
- Mamouni Limnios, E.A.; Ghadouani, A.; Schilizzi, S.G.M.; Mazzarol, T. Giving the consumer the choice: A methodology for Product Ecological Footprint calculation. Ecol. Econ. 2009, 68, 2525–2534. [Google Scholar] [CrossRef]
- Borsato, E.; Tarolli, P.; Marinello, F. Sustainable patterns of main agricultural products combining different footprint parameters. J. Clean. Prod. 2018, 179, 357–367. [Google Scholar] [CrossRef]
- Blasi, E.; Passeri, N.; Franco, S.; Galli, A. An ecological footprint approach to environmental-economic evaluation of farm results. Agric. Syst. 2016, 145, 76–82. [Google Scholar] [CrossRef]
- Cerutti, A.K.; Bagliani, M.; Beccaro, G.L.; Bounous, G. Application of Ecological Footprint Analysis on nectarine production: Methodological issues and results from a case study in Italy. J. Clean Prod. 2010, 18, 771–776. [Google Scholar] [CrossRef]
- Mamouni Limnios, E.A.; Schilizzi, S.G.M.; Burton, M.; Ong, A.; Hynes, N. Willingness to pay for product ecological footprint: Organic vs non-organic consumers. Technol. Forecast. Soc. 2016, 111, 338–348. [Google Scholar] [CrossRef]
- European Commission; Joint Research Centre; Institute for Environment and Sustainability. International Reference Life Cycle Data System (ILCD) Handbook—Specific Guide for Life Cycle Inventory Data Sets; EUR 24709 EN; Publications Office of the European Union: Luxembourg, 2010. [Google Scholar]
- EcoInvent. The Ecoinvent® v3 Database; The Swiss Centre for Life Cycle Inventories: Dübendorf, Switzerland, 2013. [Google Scholar]
- European Commission; Joint Research Centre; Institute for Environment and Sustainability. Product Environmental Footprint Guide, Consolidated Version; Ref. Ares873782; Ispra, Italy, 2012. [Google Scholar]
- Galli, A.; Giampietro, M.; Goldfinger, S.; Lazarus, E.; Lind, D.; Saltelli, A.; Wackernagel, M.; Müller, F. Questioning the Ecological Footprint. Ecol. Indic. 2016, 69, 224–232. [Google Scholar] [CrossRef]
- Tuomisto, H.L.; Hodge, I.D.; Riordan, P.; Macdonald, D.W. Does organic farming reduce environmental impacts? A meta-analysis of European research. J. Environ. Manag. 2012, 112, 309–320. [Google Scholar] [CrossRef] [PubMed]
- Niccolucci, V.; Bastianoni, S.; Tiezzi, E.B.P.; Wackernagel, M.; Marchettini, N. How deep is the footprint? A 3D representation. Ecol. Model. 2009, 220, 2819–2823. [Google Scholar] [CrossRef]
- Niccolucci, V.; Galli, A.; Reed, A.; Neri, E.; Wackernagel, M.; Bastianoni, S. Towards a 3D National Ecological Footprint Geography. Ecol. Model. 2011, 222, 2939–2944. [Google Scholar] [CrossRef]
- Huijbregts, M.A.J.; Hellweg, S.; Frischknecht, R.; Hungerbühler, K.; Hendriks, A.J. Ecological footprint accounting in the life cycle assessment of products. Ecol. Econ. 2008, 64, 798–807. [Google Scholar] [CrossRef]
- Hanafiah, M.M.; Hendriks, A.J.; Huijbregts, M.A.J. Comparing the ecological footprint with the biodiversity footprint of products. J. Clean. Prod. 2012, 37, 107–114. [Google Scholar] [CrossRef]
Figure 1.
EF Scattered plot by land type composition: cropland (EFCROP) and carbon uptake land (EFCUL). Legend: O (organic), C (conventional), R (rye), M (maize), W (wheat), B (barley), S (soy beans), and P (the generic product as average of all five products).
Figure 1.
EF Scattered plot by land type composition: cropland (EFCROP) and carbon uptake land (EFCUL). Legend: O (organic), C (conventional), R (rye), M (maize), W (wheat), B (barley), S (soy beans), and P (the generic product as average of all five products).

Figure 2.
Sustainability ranks based on 3DEFp (top) and EFP (down) framework for the agricultural crops analyzed for both cultivation practices: conventional (left) and organic (right). The 3DEFP framework is based on the EFDEPTH parameter and the scenario 2.2 presented in Table 2.
Figure 2.
Sustainability ranks based on 3DEFp (top) and EFP (down) framework for the agricultural crops analyzed for both cultivation practices: conventional (left) and organic (right). The 3DEFP framework is based on the EFDEPTH parameter and the scenario 2.2 presented in Table 2.


Table 1.
Production processes of the five agricultural products extracted from Ecoinvent database.
| PRODUCT | ECOINVENT PROCESSES | |
|---|---|---|
| ORGANIC | CONVENTIONAL | |
| Maize | Grain maize organic, at farm/CH U | Grain maize IP, at farm/CH U |
| Soy Beans | Soy beans organic, at farm/CH U | Soy beans IP, at farm/CH U |
| Rye | Rye grains organic, at farm/CH U | Rye grains IP, at farm/CH U |
| Barley | Barley grains organic, at farm/CH U | Barley grains IP, at farm/CH U |
| Wheat Grain | Wheat grains organic, at farm/CH U | Wheat grains IP, at farm/CH U |
Table 2.
Sustainability rank scenarios based on information derived from a hypothesized Ecological Footprint (EF) assessment of products. For each product, assumed EFP value, and land type composition are specified, using just cropland (CROP) and carbon uptake land (CUL) contribution. Position 1 represents the more sustainable option.
| EFP | land type composition | sustainability rank | ||||
|---|---|---|---|---|---|---|
| gha year FU−1 | ||||||
| EFCROP | EFCUL | scenario 1. | scenario 2. | |||
| % | % | excluding land type composition | including land type composition | |||
| = | scenario 2.1 | scenario 2.2 | ||||
| a full cropland world | a full co2 world | |||||
| #A | 5 | 80% | 20% | 1 | 2 | 1 |
| #B | 5 | 20% | 80% | 1 | 1 | 2 |
Table 3.
EFP results of five crop products obtained through organic and conventional practices according to the classical EFP framework and reported by land type composition. The EF final value was considered as the sum of two components: cropland (EFCROP) and carbon uptake land (EFCUL). Products are assumed to be cultivated in Italy in the year 2013. FU: 1 t.
| ORGANIC | PRODUCT | CONVENTIONAL | ||||||
|---|---|---|---|---|---|---|---|---|
| EFCUL % | EFCROP % | EFP | Rank Position | Rank Position | EFP | EFCROP % | EFCUL % | |
| gha year t−1 | gha year t−1 | |||||||
| 57% | 43% | 0.35 | 1 | MAIZE | 1 | 0.38 | 33% | 67% |
| 59% | 41% | 0.94 | 5 | SOY BEANS | 5 | 0.95 | 39% | 61% |
| 30% | 70% | 0.63 | 3 | RYE | 1 | 0.38 | 64% | 36% |
| 32% | 68% | 0.62 | 2 | BARLEY | 3 | 0.43 | 60% | 40% |
| 34% | 66% | 0.65 | 4 | WHEAT GRAIN | 4 | 0.53 | 51% | 49% |
Table 4.
Results of five crop products that were obtained by according to organic and conventional production practices from the 3DEFP framework proposed.
Table 4.
Results of five crop products that were obtained by according to organic and conventional production practices from the 3DEFP framework proposed.
| ORGANIC | PRODUCT | CONVENTIONAL | ||||
|---|---|---|---|---|---|---|
| EFDEPTH | EFSIZE | EFP | EFP | EFSIZE | EFDEPTH | |
| gha year t−1 | gha year t−1 | gha year t−1 | gha year t−1 | |||
| 2.31 | 0.15 | 0.35 | MAIZE | 0.38 | 0.13 | 3.00 |
| 2.44 | 0.38 | 0.94 | SOY BEANS | 0.95 | 0.37 | 2.57 |
| 1.42 | 0.44 | 0.63 | RYE | 0.38 | 0.24 | 1.57 |
| 1.46 | 0.43 | 0.62 | BARLEY | 0.43 | 0.26 | 1.67 |
| 1.51 | 0.43 | 0.65 | WHEAT GRAIN | 0.53 | 0.27 | 1.94 |
© 2018 by the authors. Licensee MDPI, Basel, Switzerland. This article is an open access article distributed under the terms and conditions of the Creative Commons Attribution (CC BY) license (http://creativecommons.org/licenses/by/4.0/).
Share and Cite
MDPI and ACS Style
Patrizi, N.; Niccolucci, V.; Pulselli, R.M.; Neri, E.; Bastianoni, S. The Ecological Footprint Accounting of Products: When Larger Is Not Worse. Resources 2018, 7, 65. https://doi.org/10.3390/resources7040065
AMA Style
Patrizi N, Niccolucci V, Pulselli RM, Neri E, Bastianoni S. The Ecological Footprint Accounting of Products: When Larger Is Not Worse. Resources. 2018; 7(4):65. https://doi.org/10.3390/resources7040065
Chicago/Turabian StylePatrizi, Nicoletta, Valentina Niccolucci, Riccardo M. Pulselli, Elena Neri, and Simone Bastianoni. 2018. "The Ecological Footprint Accounting of Products: When Larger Is Not Worse" Resources 7, no. 4: 65. https://doi.org/10.3390/resources7040065
Note that from the first issue of 2016, this journal uses article numbers instead of page numbers. See further details here.