2.1. Construction of a Framework for Agricultural Sustainability Assessment
Because of the complexity of parameters that describe farm sustainability, their evaluation as a whole could be expensive and complex [
25,
26]. The use of proxy variables could therefore be useful in estimating the multiple aspects of sustainability. The scientific literature refers to these proxies as indicators, defined as ‘synthetic variables of substitution of other variables that are otherwise difficult to determine’ [
27].
According to this concept, this framework proposes an analytical procedure that starts from the farms’ data collection. Depending on their nature, these data are converted by indicators into dimensionless numbers attributed through graduated ranges. Different criteria are applied for different indicators, according to their nature and the sustainability objective they need to evaluate (please refer to
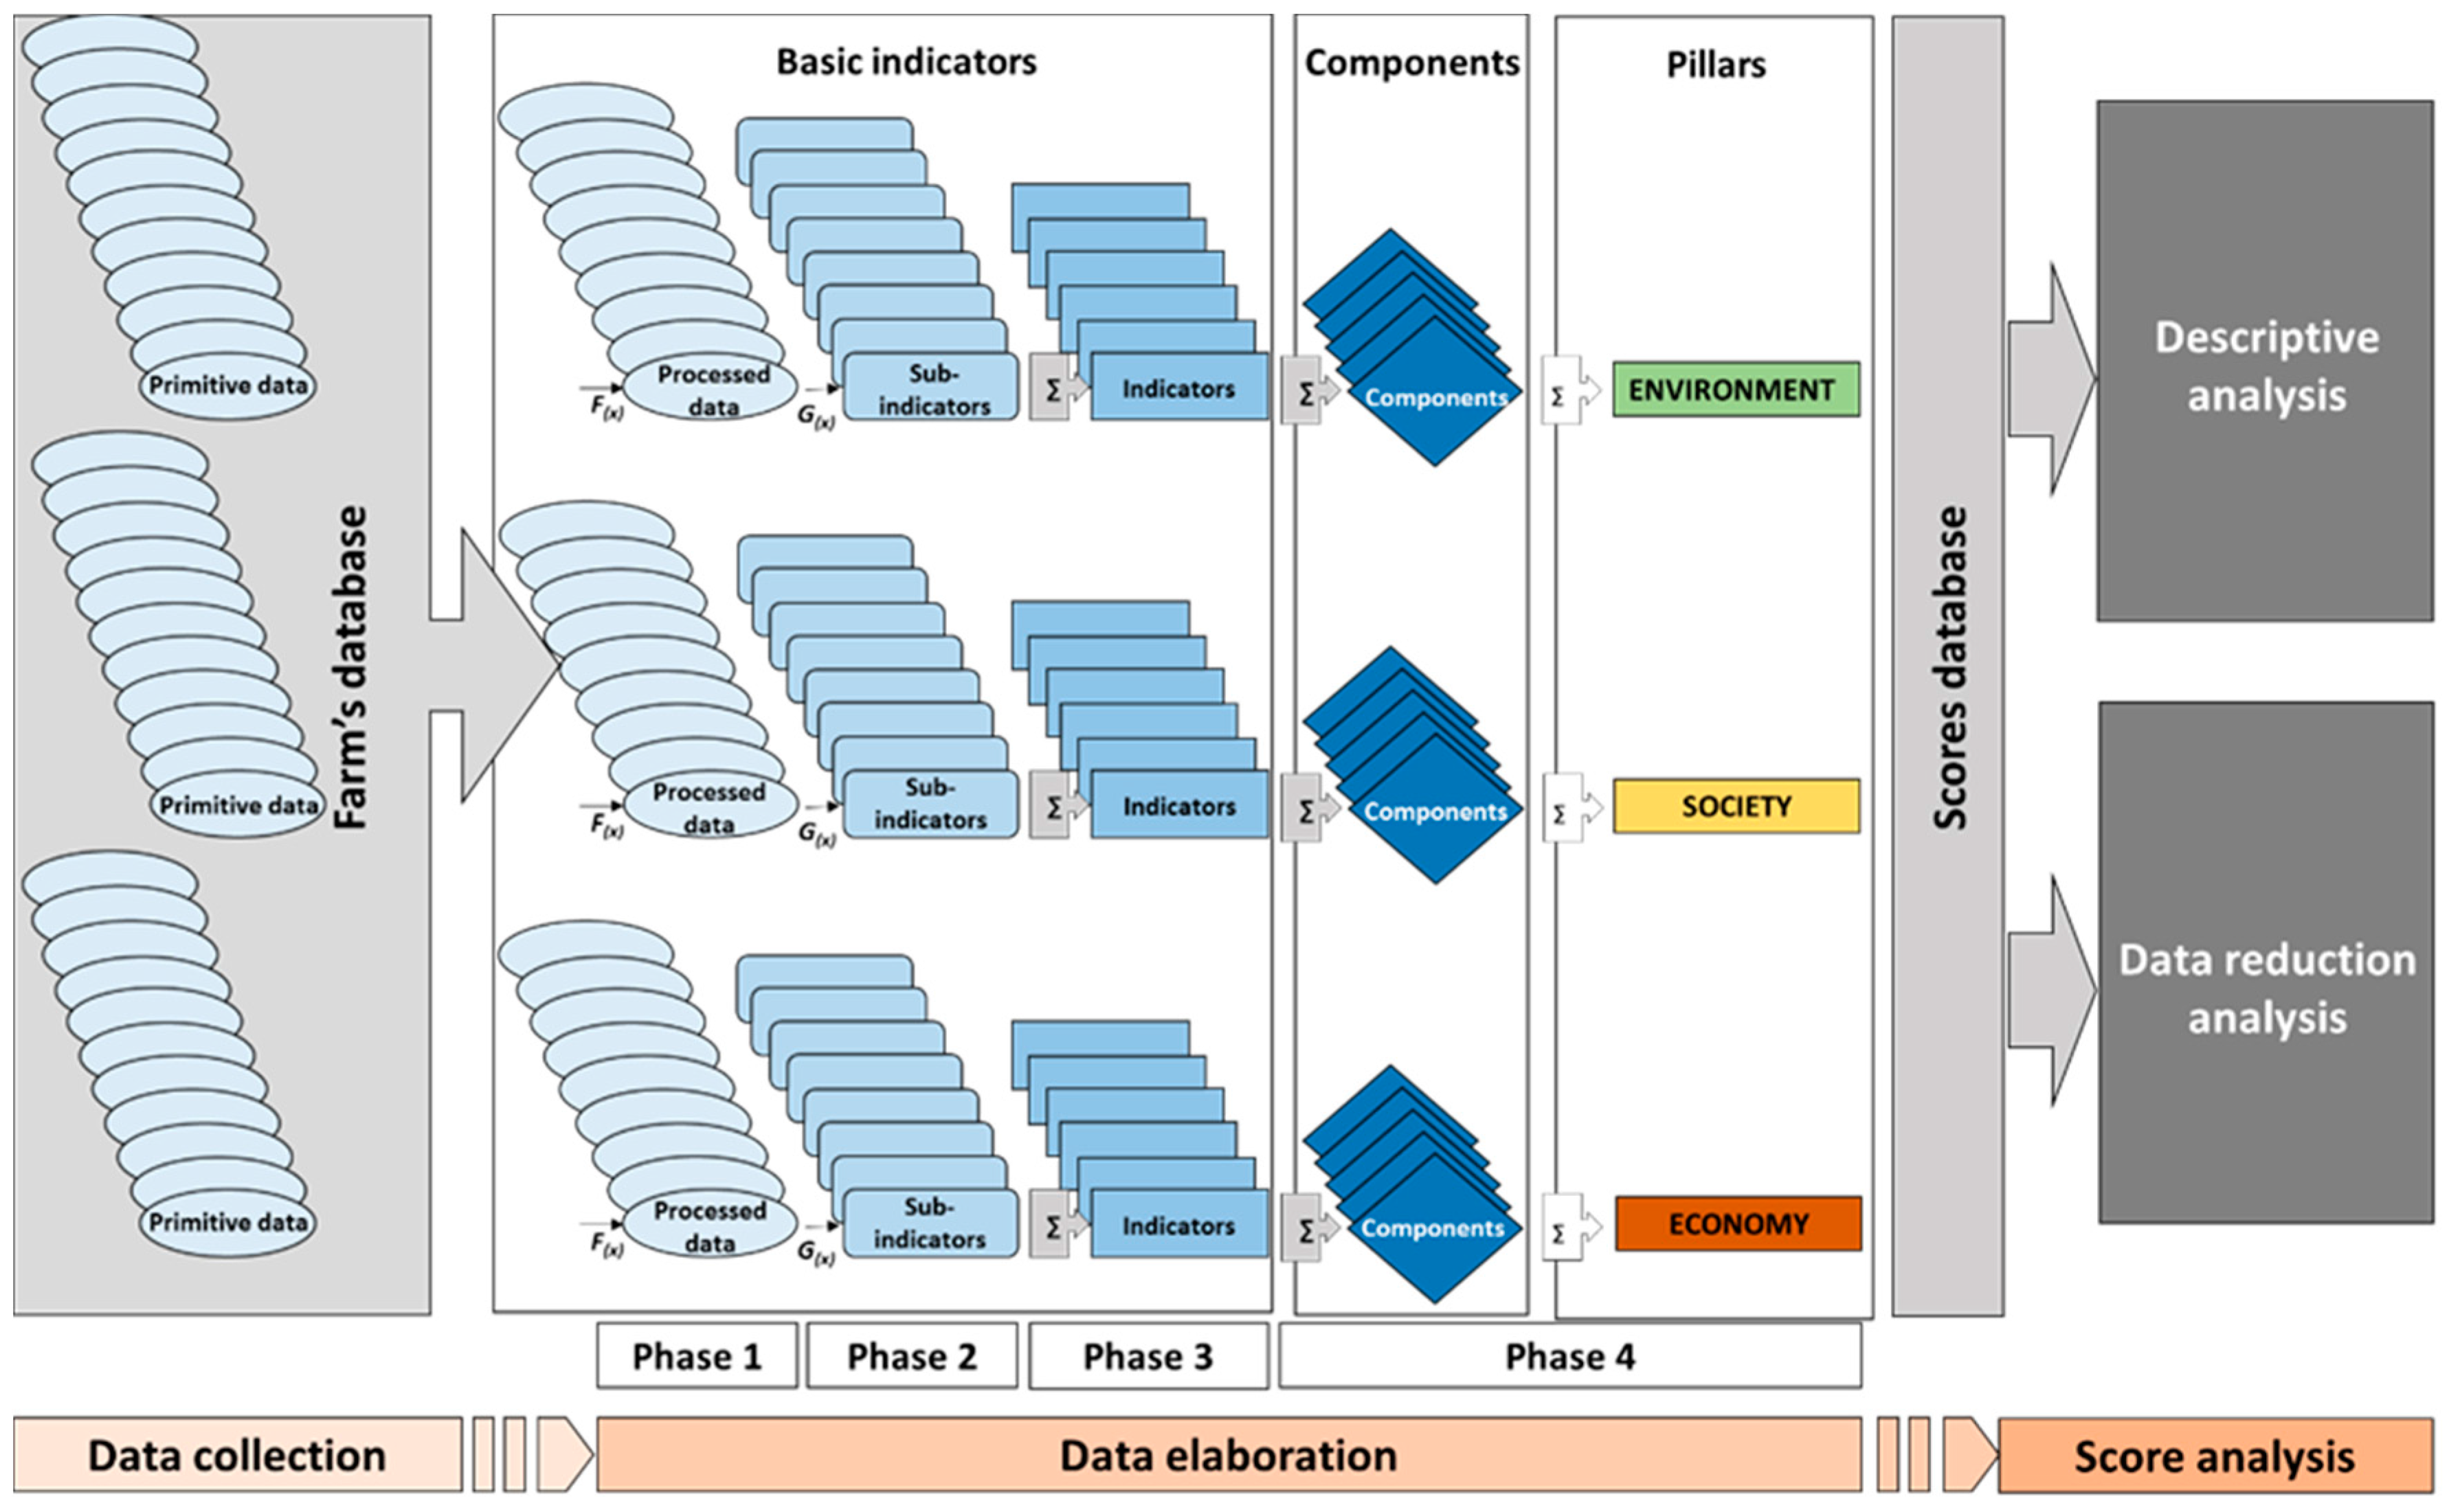
Supplement 1 for technical details). As explained in the following sections, the authors chose to use an adapted aggregative structure (
Figure 1), which has been already proposed by various studies, such as the IDEA method [
28], the SAFA tool [
29] and others [
10,
25,
30]. This type of assessment of agricultural sustainability of farms allows analyses at different levels, such as analysis between indicators of the same farms, comparison between farms or groups of farms or score evaluation analysis through temporal comparison.
The method is based on three main steps: Data collection, data elaboration and score analysis.
STEP 1—Data collection. This step involves the collection of the basic information regarding farms. Such information is called “primitive data”, because it is not aggregated and possesses different units of measurements, depending on the characteristic being evaluated.
STEP 2—Data elaboration. The second step involves the elaboration of data through sub-indicators (tools for the conversion of dimensional values into dimensionless indices), indicators (aggregation of sub-indicators for the evaluation of individual sustainability themes, numbered from 1 to 42), components (aggregation of indicators for the evaluation of wider sustainability themes, numbered from ENV_1, SOC_1, ECO_1 to ENV_5, SOC_5, ECO_5) and pillars (aggregation of components into environmental, social and economic pillars). This process involves a four-phase procedure:
Phase 1: this is a first elaboration of primitive data that allows to obtain processed data containing the basic information for the successive elaborations;
Phase 2: the calculation of sub-indicators provides integer and dimensionless values of that data for each farm. Values can range from negative to positive, according to their maximum scores;
Phase 3: the calculation of indicators consists of the sum of two or more sub-indicators. A minimum of 0 and a maximum (variable) score is applied, depending on the case. This way, maximum scores define the best performance in terms of sustainability [
31];
Phase 4: the sum of two or more indicators provides the value of components [0 to 50] and, in turn, each pillar [0 to 250] of sustainability.
At the end of this process, scores of each sub-indicator, indicator, component and pillar are contained into a score database.
STEP 3—Score analysis. The third step involves statistical elaboration of the scores per farms according to the following two different approaches:
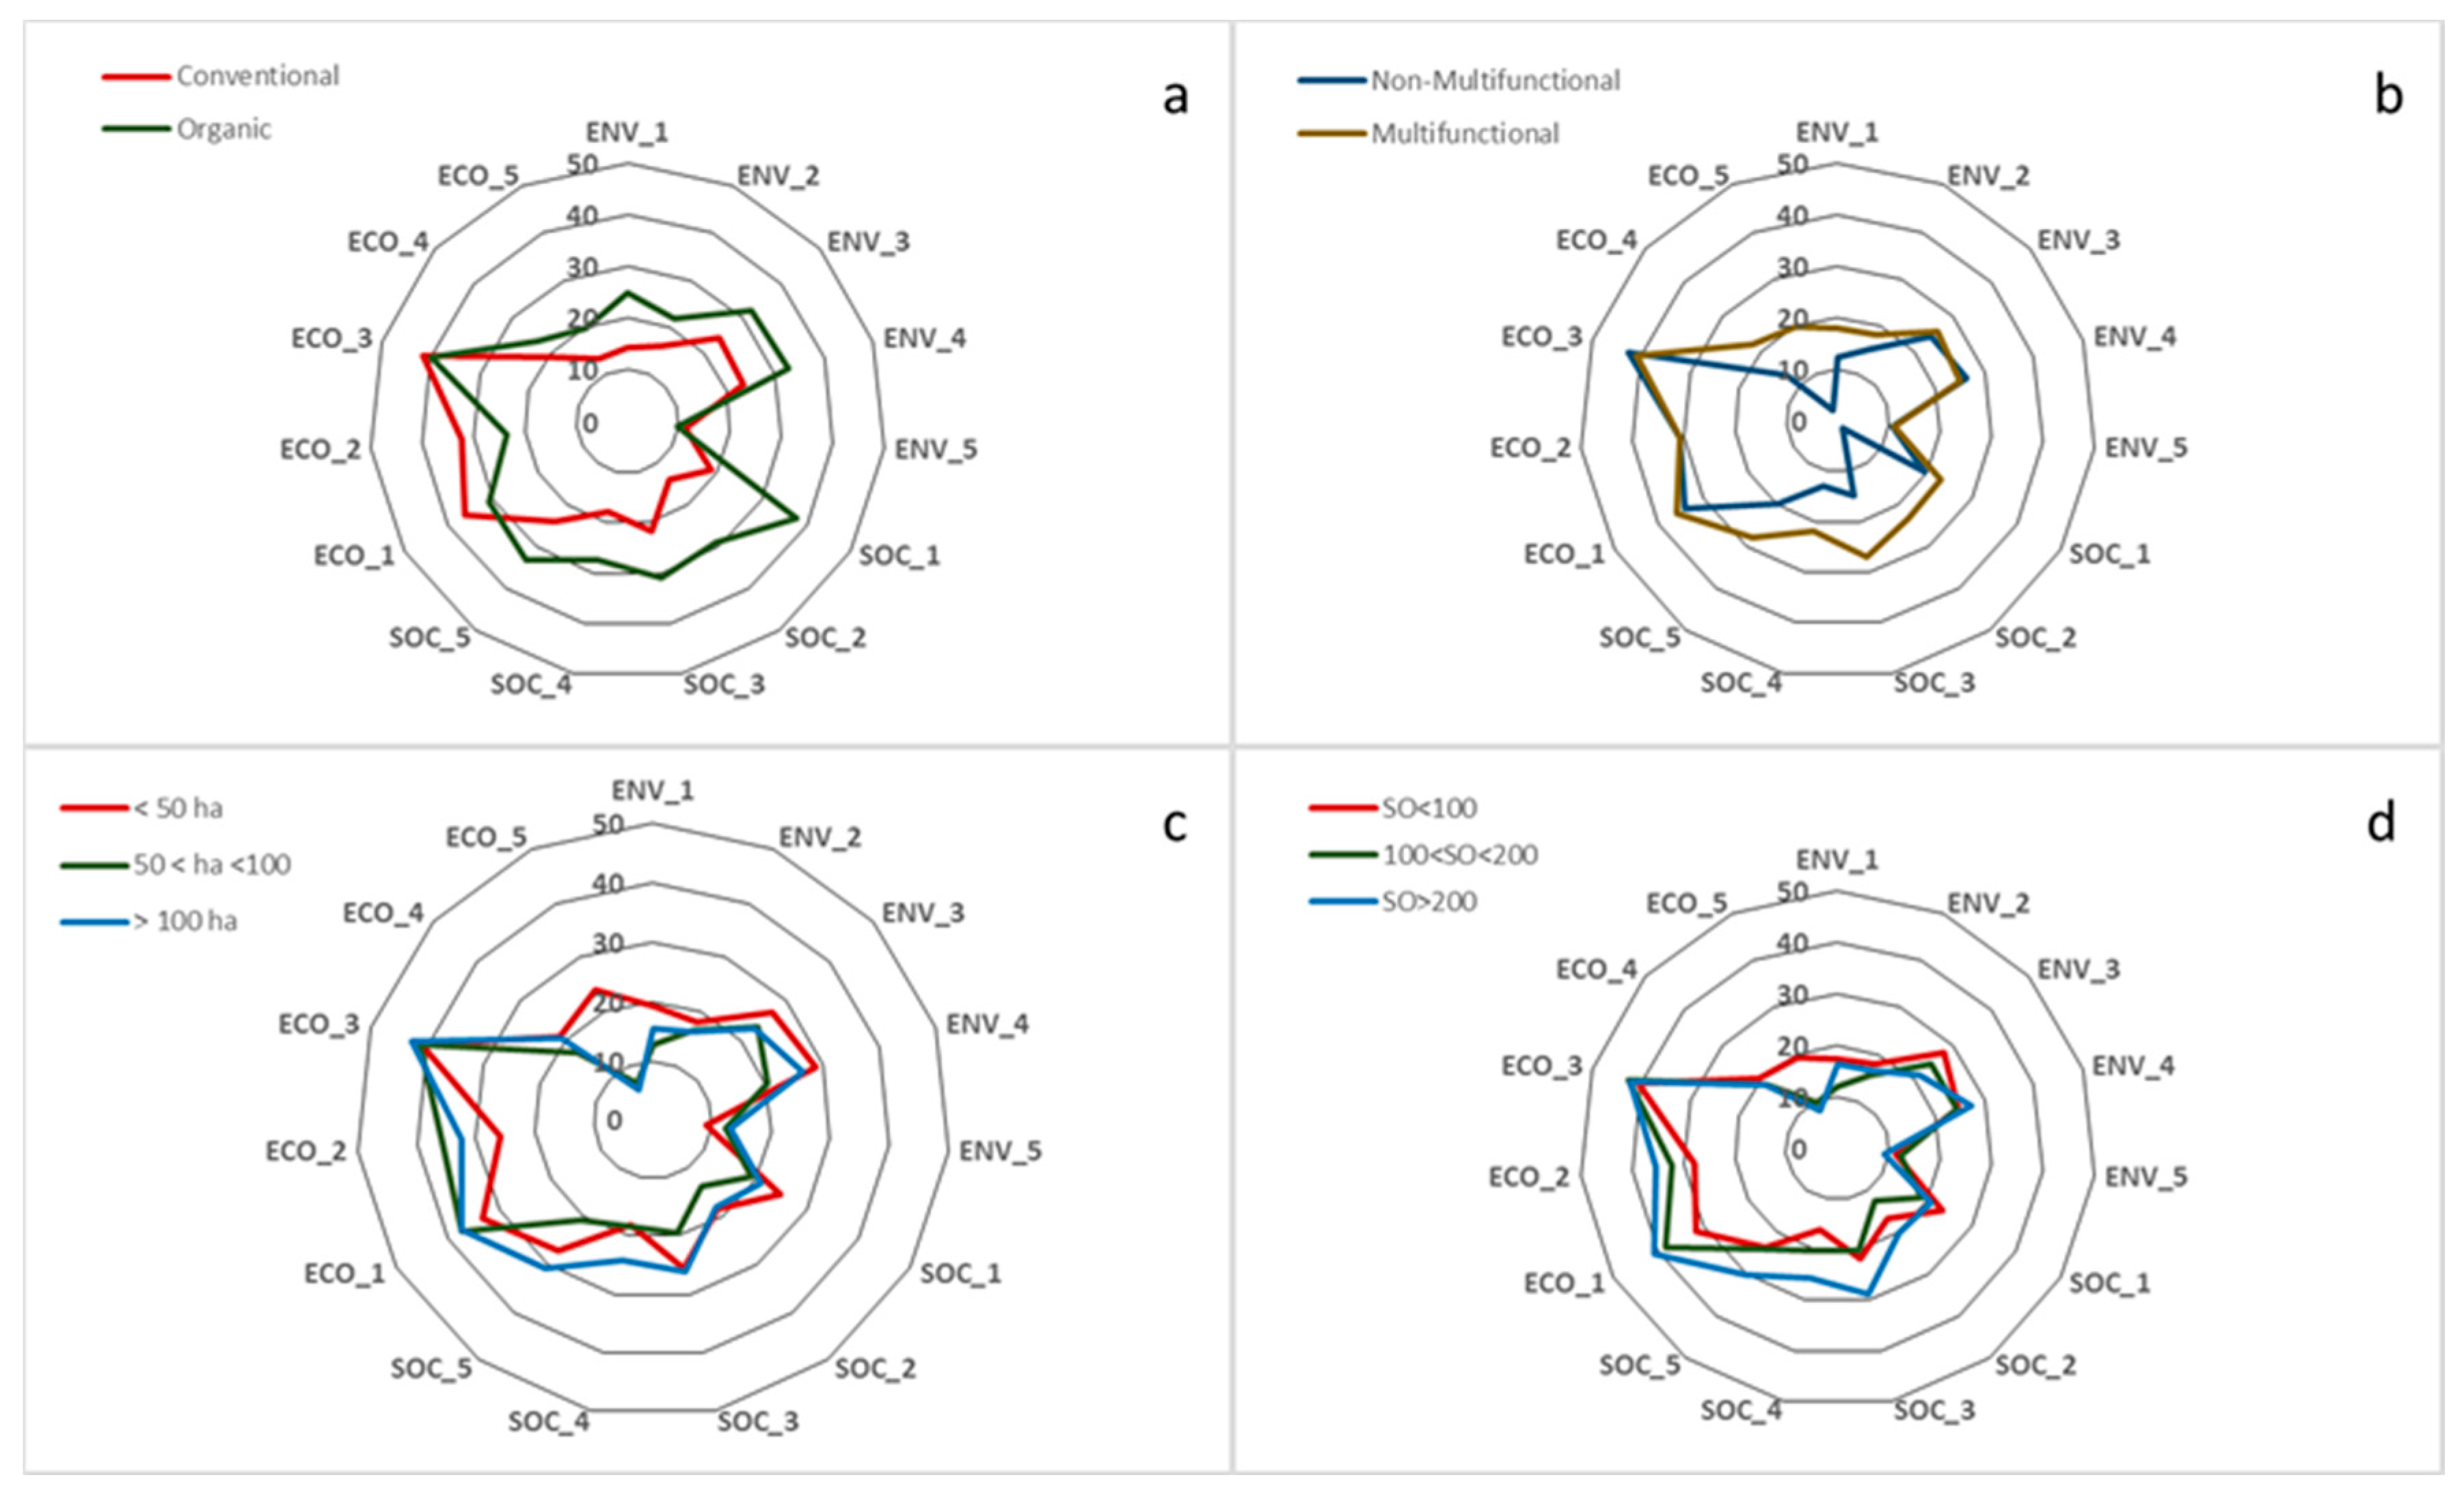
Descriptive analysis: this elaboration aims at the exploration of the main characteristics of the sample by applying descriptive statistics. This approach involves the use of means and standard deviation of scores between subjects and groups of them. Due to their immediacy, this analysis also employs histograms and radar charts in order to represent the dimensions of different attributes controlled;
Data reduction analysis: indicators used for sustainability assessment may be redundant [
13] and/or correlated [
30]. In this view, a data reduction approach may help researchers by summarising the information contained in the original database. Furthermore, as the aggregative definition of sustainability components proposed in this framework is subjective, data reduction through Principal Components Analysis (PCA—[
32]) can be used to confirm the dimensions obtained by the indicators. In the present paper, this data reduction was applied to each pillar by using the software package IBM SPSS 21.0. The evaluation of the PCA was performed using the Kaiser–Meyer–Olkin (KMO) measure of sampling adequacy, the Bartlett’s test of sphericity and the Kaiser criterion [
33].
2.2. Selection of Sustainability Indicators
The selection of sub-indicators, indicators and components derived from a literature review is mainly based on five methodologies: IDEA [
28], RISE [
34], SAFE [
12], SOSTARE [
30] and MOTIFS [
10]. See [
35] for an in-depth analysis of the literature on the sustainability assessment approach at the farm level.
Table 1 summarises information on indicators (see Paragraph 3.1 for more details about the source of data). The indicators proposed by these methods were placed into sets of sustainability themes, according to their objectives. Each set was checked for redundancy and, in the case of multiple choices, indicators were selected through parameters of data availability [
12], usefulness for users, ease of implementation and understanding, high sensitivity to system variations, connection to the issue they are representing and potentialities of adaptation to different case studies [
26]. To establish whether indicators satisfy these features and indeed if data were available and accurate (issue 1 in the Introduction), a pilot test was performed on a reduced group of five farms. The method has educational purposes and its results have not direct effects on both farm and stakeholders choices. Therefore, issues related to the accuracy of data are mainly related to the knowledge of farmers, instead their frankness. Following this process, indicators were tested and, when needed, modified with the objective of reducing the subjectivity of interpretation [
36] by finding a match between the needs of researchers and the stakeholders’ interests [
37,
38]. The final objective was to reduce the indicators to a minimum set of variables able to assess as many themes of sustainability as possible [
25] (issue 1 in the Introduction).
Following the same procedure, the weighting of indicators is derived from researchers’ choices based on the knowledge and the requirements of the case study [
39]. As highlighted in
Section 3.1, the case study used for the construction of the present framework belongs to a delimited area in which the local institution has carried out specific instruments in order to reach specific environmental, social and economic performances of the agricultural activities. Although this assumption is not supported by all authors (e.g., [
5]), our decision was based on the fact that indicators cannot be considered equally relevant with reference to agricultural sustainability [
28], and some researchers believe that weighting all the indicators in the same way could lead to even worse results [
40].
The framework aims at the evaluation of farm sustainability, combining the larger set of farm characteristics (issue 3 in the Introduction) available for the present case study (see
Section 3.1). In this view, it seems useful to underline the decision to whether to calculate some indicators not bound to some farm features. Thus, in the present case study, indicators related to the breeding systems (9, 12, 13, 27 and 32) were removed in the case of no-livestock farms. To achieve the same max score of each component (50), the residual indicators were re-balanced.
The following sections describe how the literature review could be used to create a new method focusing on a specific case study. The sections summarise the environmental indicators (from 1 to 18) and components (from ENV_1, to ENV_5), the social indicators (from 19 to 33) and components (from SOC_1 to SOC_5) and the economic indicators (from 34 to 42) and components (from ECO_1 to ECO_5).
2.2.1. Environmental Indicators
Scientific literature on environmental sustainability mainly focuses on the principle of similarity to nature and the preservation of agroecosystems in the long term [
41,
42]. According to this concept, a farming system is environmentally sustainable if it protects the natural resources provided by the ecosystem, such as biodiversity and water, soil and air quality [
43]. Obviously, the safeguarding of agricultural ecosystem services involves limiting the possible adverse impacts of agricultural practices on the preservation of natural resources [
44,
45].
ENV_1—Diversity. This component aims at the assessment of the degree of plant and animal diversity of a farm. Among the reviewed methods, RISE and MOTIFS only include the rate of animal and vegetal diversity of farm production. On the contrary, SOSTARE and IDEA also evaluate the natural biodiversity of farms, using the evaluation of non-crop vegetation, while SAFE uses criteria pertaining to habitat conservation.
Since an indirect measurement of biodiversity is provided by the following component ENV_2, this component follows the theory proposed by IDEA and MOTIFS, evaluating livestock and plant diversity. Therefore, the component accounts for diversity within farms and within animal and plant species used in each farm (Indicators 1, 2 and 3), with a specific measurement considering the presence of endangered plant varieties and livestock breeds (Indicator 4).
ENV_2—Organisation of spaces. Following the framework proposed by RISE, IDEA and SOSTARE, this component is a proxy for farmers’ choices regarding the use of land, which is linked to the reduction of soil erosion and the proliferation of parasites, improving landscape quality and natural habitat maintenance [
46,
47,
48].
For farms, this regards issues related to crop rotation (Indicator 5), plot size (Indicator 6) and the presence of environmental elements such as hedges, rows, resurgences and water meadows (Indicator 7).
The percentage of farm surface belonging to protected areas (e.g., Natura 2000, national or regional parks) provides an indirect assessment of the environmental and landscape safeguarding (Indicator 8).
Finally, the stoking rate of a farm (Indicator 9) aims at the measurement of its space valorisation and the autonomy in forage production.
ENV_3—Agricultural practices. Obviously, agricultural practices directly affect environmental performances of farms. Concerning the use of fertilisers and agrochemicals, IDEA, MOTIFS and SOSTARE propose an indirect measurement of their effects on the soil, while SAFE and RISE use a direct evaluation of soil quality, proposing an overall evaluation of some chemical and physical soil parameters.
In this research, because of the choice of gaining data primarily from questionnaires, the framework proposes the evaluation of the use of fertilisers (Indicator 10) through the calculation of the nitrogen balance at the farm level (units of N per-Ha of used agricultural area).
Similarly, the use of agrochemical treatments (Indicator 11) and veterinary substances (Indicator 12) is derived from information provided by direct interviews. This component includes an additional evaluation of the presence of effluent treatments, if any (Indicator 13).
ENV_4—Natural resources. This component aims at evaluating the impacts of agronomic operations on soil quality (Indicators 14 and 16) and water use (Indicator 15).
The management of soils and, indirectly, their quality is strictly dependent on farm practices. In this field, due to the primary role of the use of fertilisers and agrochemicals, SAFE and MOTIFS do not provide any additional evaluation. In contrast, in this framework, the procedure follows RISE, IDEA and SOSTARE, which also consider factors that include soil cover, tilled area and farming operations in general.
The management of water resources involves both quality and quantity characteristics: consumption, irrigation systems, chemical and physical parameters. This framework is in line with IDEA, MOTIFS, RISE and SOSTARE, which consider irrigation systems and their use of water, including efficiency, without considering any measurement of the quality of water, which would require direct measurements.
Finally, because the measurement of air quality is relevant at larger spatial levels (regional or higher), the present framework follows the approach adopted by SOSTARE and RISE, avoiding its evaluation.
ENV_5—Energy. Concerning energy management, although the calculation of the amount of energy inputs is a shared evaluation, only MOTIFS and SAFE also provide an evaluation of the use of renewable resources.
In this framework, the total amount of energy input (Indicator 17) is derived from the conversion of fuel, nitrogen, animal feeding, gas and electricity into energy fluxes (Mj/ha), applying similar indicators proposed by IDEA, MOTIFS and SOSTARE.
Furthermore, a second indicator has been added to evaluate the use of renewable resources and systems for energy saving (Indicator 18) [
49].
2.2.2. Social Indicators
Despite the growing recognition of the role of agriculture in safeguarding the social heritage of territories, their culture and traditions, the assessment of social sustainability has received less attention than that of environmental and economic sustainability [
50,
51,
52]. This may relate to the fact that the perception of social issues is heterogeneous and causes a lack of conceptual clarity [
13]. In addition, the assessment of social sustainability is particularly dependent on the local context and its socio-political goals [
17]. Nonetheless, researchers have identified a wide range of social issues in agriculture, mainly represented by the connection between rural area and citizenship [
53] and the multifunctional role played by agriculture [
54].
SOC_1—Quality. The evaluation of the quality of farm’s food products (Indicator 19) takes into account the Protected Denomination of Origin (PDO) and the organic products as important means that contribute to a higher social acceptance of agriculture and its production systems [
55]. Due to the data requirement, this framework does not consider the measurement of the intrinsic quality of products, as proposed by SAFE, which, on the contrary, includes issues related to their safety, security and diversification.
The evaluation of the quality of the landscape involves both ecological and social topics. The methodologies IDEA, SAFE and MOTIFS put these evaluations in the social pillar because of the positive or negative externalities in the social acceptance of farming in rural areas, while SOSTARE, which does not include any social evaluation, provides similar indicators that are otherwise categorised within the environmental pillar.
In this framework, the functional and aesthetic roles of rural buildings (Indicator 20) and the farm landscape (Indicator 21) have been included into the social pillar because of positive or negative social externalities for the rural areas [
51].
SOC_2—Short supply chain and related activities. Among the most important roles recognised by consumers of farmers is the participation in short food supply chains [
56], which allows tradition to be maintained [
57] and to support the local economies and trust producers [
58,
59]. Because of that, these activities are depicted by RISE and IDEA as relevant factors pertaining to the social inclusion of farms.
Thus, this component aims at the assessment of farms’ short chain systems such as direct sales, online sales, ethical purchasing groups, farmers’ markets, restaurants, shops and canteens (Indicator 22) and the presence of activities related to agro-tourism and educational activities organised by farmers (Indicator 23), following the approach proposed by IDEA.
SOC_3—Work. All the reviewed methods, except SOSTARE, provide an assessment of work conditions. This topic involves both external and internal factors that include the quality of life of family and non-family labours (SAFE and IDEA), the equality of retribution (RISE), the professional pride of farmers (MOTIFS) and innovation through training and research (IDEA).
The indicator 24 proposes a framework for the evaluation of the employment in agricultural activities as a relevant indicator for the social development of rural areas, where the level of employment has fallen considerably in the last decades [
47,
60,
61].
Demographic characteristics of workers such as their nationality provenience, age and gender (Indicator 25) and their training level (Indicator 26) should also be considered as a key aspect for the growth of the agricultural sector [
62].
SOC_4—Ethical and social developments. Among the most important ethical issues related to agricultural activities, animal welfare is today a primary concern of society [
63]. Thus, IDEA and MOTIFS fit the assessment of animal welfare in the social pillar because of its ethical value [
64]. Nevertheless, these issues also involve ecological themes; because of that, subsequent updates of RISE will include it in the environmental pillar [
34], following SAFA guidelines.
In the present framework, we decided to include this assessment into the social pillar because of its social relevance for the objectives of the institution of the case study. Due to the complexity of these issues, the use of a single approach to evaluate different types of livestock is difficult. Therefore, this framework proposes the new Indicator 27, which is based on a diversified evaluation in relation to the most important livestock of the farm (cattle, pigs, poultry, sheep/goats) through the calculation of livestock units (LSU).
Finally, human development is measured by farmers’ attitudes towards participation to association of producers (Indicator 28) and supply chain cooperation (Indicator 29) as relevant attributes for the innovation of agricultural systems and human development in rural areas [
28].
SOC_5—Culture and education. Some ecological (Indicator 30) and cultural aspects (Indicator 31) also indicate the social responsibility of farmers [
12]. In this sense, the autonomy in feed, fertilisers, water, seed provision (Indicator 32) characterises the resilience degree of a farm in different economic, environmental and social changes [
28]. In addition, the workers’ education levels provide an important parameter (Indicator 33) for the social growth of agricultural areas [
12].
2.2.3. Economic Indicators
The economic sustainability of agricultural activities is considered a basic constraint for the survival of farm systems over time [
65]. In recent decades, this aspect has become more relevant because of the reduction of public support to agriculture and the intensification of global trade for agricultural commodities. Consequently, farmers are facing increasingly difficult decisions for improving the levels of competitiveness and profitability of the traditional agricultural production [
66].
ECO_1—Economic viability. The measurement of the economic state of a farm through the evaluation of its most relevant economic parameters has a primary role.
This component takes into account the Value of Production (VP) (Indicator 34), i.e., the amount of the value of goods and services produced by a farm during a year, and the Added Value (Indicator 35), i.e., the increase in value generated from the production process to the value of intermediate consumption. According to SOSTARE and MOTIFS, the value of production is measured in relation to the used agricultural area, while the value added is measured in relation to the agricultural working unit.
ECO_2—Persistence. Especially if the farm is small or medium-sized, the amount of income derived from the family’s workforce acquires more importance. This may have an impact on its ability to endure over time thanks to the continuity of family work.
The selected Indicator 36 is derived from the framework proposed by SOSTARE through the calculation of the amount of the household income through the ratio between Earnings before Interest, Taxes, Depreciation and Amortization (EBTDA) and VP.
Similarly, Indicator 37 is based on the ratio between the sum of EBITDA and the income derived from public subsidies of the Common Agricultural Policy (CAP) and Family Working Unit (FWU) [
28].
ECO_3—Independence. The economic autonomy of a farm has important reflection on its capacity to introduce innovation and create new workplaces [
67]. Firstly, with the reduction of public founding for agriculture in Europe, dependency on public support is a crucial issue [
30]. The methodologies IDEA, SAFE and SOSTARE consider this attitude through the evaluation of the relevance of CAP aid on the economic performances of farms.
In this sense, this component evaluates the economic incidence of the public subsides over farm income (Indicator 38) and proposes a further indicator for the evaluation of financial autonomy of the farm, accounting for the total amount of contracted loans (Indicator 39).
ECO_4—Diversification. The dynamic character of a farm can be measured by its capacity to be resilient following quick changes in the market. In this case, diversification of farm activities, products and services (IDEA and SOSTARE) could play an important role in the competitiveness of a farm [
58], because the more specialised the farm, the more exposed it is to financial risks [
28].
In the present framework, this component provides the evaluation of the number and relative importance of products and services sold by the farm (Indicator 40) and its business portfolio (Indicator 41).
ECO_5—Multifunctionality. Following the concept of diversification, a farm’s resilience to economic volatility also depends on its multifunctional features.
According to this concept, the economic weight of non-agricultural products and services such as agro-tourism, restaurants, bed & breakfasts and educational farms are relevant parameters for the evaluation of its multifunctionality (Indicator 42) [
68,
69].


