1. Introduction
People are becoming more concerned about their food intake and place greater emphasis on the safety of the food they consume. Thus, food safety has become an important issue among consumers and environmentalists. Chemical hazards, whether chronic or acute, in the food supply have been a major public concern among consumers [
1]. Although chemical inputs are an essential part of modern high-input agriculture, it is the toxicity of pesticide residues on and in food which gives rise to these concerns because they could contain certain carcinogenic potentials [
2]. The immediate problem faced by consumers is the lack of transparency in the chemical inputs such as fertilizers, pesticides, and herbicides applied in the production process and how many residues are making their way into agricultural products. Since the process of food production has little transparency at field level, it is difficult to keep track of chemical inputs used in terms of timing, frequency, and limits of usage. In the 80s, the issue of sustainability caught consumers’ attention in developed countries like the UK, where the need for farmers to exercise control over foodborne hazards has been emphasized to minimize the food safety crises arising at farm level [
3].
The use of pesticides is higher for certain crops such as cotton, rice, vegetables, and fruits in general. Farmers’ use of pesticides is often too frequent and in higher doses than that which is recommended, leading to the presence of high amounts of residue in food commodities [
4]. In the 80s, pesticide residues such as aldrin/dieldrin, chlordane, Hexachlorocyclohexane, and Dichlorodiphenyltrichloroethane were found in fish samples in paddy-farming areas. This could be due to lack of accurate knowledge about pests and their control and hence often a cause for the overuse of chemical inputs and the usage of unauthorized inputs. Study in Malaysia [
5] indicated that heavy metals were found in paddy fields derived from the heavy use of fertilizers and pesticides as agrochemicals which are known to contain zinc, copper, lead and cadmium. In the tropical paddy field ecosystem, the heavy use of chemicals such as pesticides has affected the ecosystem of other nontarget organisms such as microalgae and cyanobacteria [
6]. In order to examine the degree of sustainability in production practices, various studies which have assessed the production practices at farm level were reviewed. For example, there is a study [
7] regarding the adaptation of sustainable production practices in paddy fields in Kuttaland, India which is one of the traditional paddy bowls of low-lying reclaimed land. The increase in the use of fertilizers and pesticides has caused epidemics and environmental degradation, thus leading to an attempt to introduce sustainable practices.
The concept of sustainable agriculture should neither be consumer oriented nor producer oriented. Consumers are very particular about food safety and farmers also need to be concerned. This is because how farmers produce agricultural products will influence not only food safety but also the farmers’ health. Study in North Carolina and Iowa [
8] alerted that agricultural workers and their families are exposed to pesticides, animal viruses, mycotoxins, dust, fuels, oils, engine exhaust, and fertilizers, which may contribute to cancer through immunologic perturbations and occupational exposure to a variety of potentially hazardous chemicals and biological agents. There is a study [
9] which indicated that the usage of pesticide and inorganic fertilizers on paddy farms has caused health issues among farmers, destroyed paddy-fish culture, killed animals, and caused air and water pollution. In the Philippines, unsafe pesticide storage, handling, short re-entry and disposal practices subject farmers to high levels of health hazards and contaminate the paddy ecosystem [
10]. In the case of Malaysia, a study has found that paddy and vegetable cultivation are the main sources of environmental contamination by most organochlorine insecticides in the country [
11]. The farmers’ houses in Malaysia are usually located adjacent to the paddy fields and when the wind blows over the recently pesticide-sprayed paddy fields, it carries heavy pesticide mists. There are high rates of acute poisoning due to chlorpyrifos exposure among Malaysian paddy farmers [
12].
In Malaysia, the good agricultural practices standards began in 2002 with the introduction of the Farm Accreditation Scheme by the Ministry of Agriculture and Agro-Based Industry. The Farm Accreditation Scheme is a program designed to accredit farms that adopt Malaysian Good Agriculture Practice (MyGAP). In order to become certified, the farm is required to operate in a sustainable and environmentally friendly way, and yield quality products that are safe according to the three main aspects of the MyGAP Farm Accreditation Scheme which is based on the European Good Agricultural Practices (EuroGAP). The evaluated aspects include the environmental setting of the farm, verification of farm practices and safety of farm products, incorporating traceability and ensuring adequate workers’ welfare within the farm (Department of Economics Malaysia, 2009). The consolidation of programs under MyGAP not only ensures Malaysian produce is benchmarked against international GAP certification schemes such as the Association of Southeast Asian Nations—Good Agricultural Practices (ASEAN GAP) and EuroGAP, but also the GLOBAL GAP (The GLOBAL GAP is the world standard for GAP). Thus, the application of MyGAP allows Malaysia’s agricultural produce to gain better recognition and acceptance both domestically and internationally. In June 2006, a total of 182 fruit and vegetable farms were accredited (from about 1,000 applicants) under the Farm Accreditation Scheme in Malaysia [
13]. In 2014, the number of farmers awarded with MyGAP certification increased to 746 out of 278,628 farmers. Since this number is still small and is about 0.3% of the total farmer population, effort needs to be made to encourage farmers to change their mindset and adopt sustainable agricultural practices. That is, compliance with the international food safety standards and adoption of good agricultural practices requires farmers to invest in precise application of fertilizers such as with the use of the new forms of mechanization [
14]. As at 2012, it was observed that paddy farmers in the granary areas are faced with little incentive to invest in new mechanization methods which are necessary in adopting good agricultural practices such as the various precision rice farming methods of input application [
15].
Thus, the general objective of this study is to identify the distribution of paddy farmers at different sustainability levels based on their farming practices at the field level in the sub-granary areas of Sungai Petani district, Kedah. The specific objective for this study is to estimate the Farmer Sustainable Index as the level of sustainability in paddy farming practice. A personal interview was conducted among the selected paddy farmers. There were 80 paddy farmers in the sub-granary areas of Sungai Petani district, Kedah who participated in the interviews. This study takes in the potential and possible strategies to promote sustainable agricultural practices among paddy farmers in the area.
2. Sustainability Assessments for Paddy Farming: Literature Review
In order to monitor and observe actual sustainability in rice fields, Rice Check appeared in Australia during the 1980s as the first Rice Check. The purpose is to improve the yields and production quality and also provide recommendations and learning tools to rice growers [
16]. With improved management, farmers know more precisely when to add necessary fertilizers or other agricultural inputs and how much to use, thereby reducing the amount of pollutants released into the air, soil and water in Australia [
17].
The Australian Rice Check emphasized that pesticides must only be used for the purpose for which they are registered and must not be used in any other situation or in any manner contrary to the directions on the label with the correct choice of chemical, selection of rate, and methods of application under the responsibility of the user. It not only cautions farmers over misusing pesticides but also educatse farmers on how to use the recommended level of pesticide and the consequences of excessive use of pesticides. Additionally, the Australian Rice Check is an integrated crop management package for rice production that can increase rice yield from 6 ton per hectare to 8 ton per hectare [
17]. Australian Rice Check has changed the management of rice growing, where farmers learn by critically observing and checking their crops. Among the 124 farmers selected randomly for the research in Australia, 83% of them said Rice Check is very useful in producing yield [
17].
In Malaysia, Rice Check was established in 2002 under the Department of Agriculture. Each farming practice and process requires farmers to pay close attention to their fields. There is specifically an important checklist for the use of pesticides as it concerns chemical input in the field. However, pesticides are often over-applied to paddy fields as there is a premium attached to unblemished-looking produce. The most widely used pesticides among paddy growers in Malaysia are Category II and III which are known to have high toxicities [
18].
Agricultural researchers in India have developed the Farmer Sustainability Index with 40 items, covering insect control, disease control, weed control, soil fertility management, soil erosion control, and related practices relevant under the local conditions of farmers [
7]. The Farmer Sustainability Index was developed to measure the adoption of sustainable practices by traditional Indian paddy farmers. The result illustrated a wide range in the mean Farmer Sustainability Index scores between two groups of paddy farmers: conventional farmers and more sustainable farmers. The former type of farmer index score was 23.95 and the latter one was 70.06, indicating that those farmers practicing the sustainable farming system were more sustainable than the conventional farmers. Similarly, a new “agriculture sustainability indicators system [
19]” was proposed in the dynamic weight calculation in China. Three main indicators were used to measure the index value. These are: ecosystem undegradable, economically viable, and socially acceptable. hese three indicators were subsequently integrated into the overall system index value using the geometric average.
3. Material and Methods
It is crucial to understand the attitude of farmers who can drive this sector from conventional to sustainable at farm level by their individual actions to transform farming practices. Previously, a series of surveys were conducted on the sustainability of English cabbage farming in the Cameron Highlands, Malaysia [
20,
21]. The purpose of the study was to develop the Farmer Sustainability Index for English cabbage in Malaysia in order to identify the factors associated with the adoption of sustainable farming practices. This would make it possible to visualize the degree of sustainability in farming practices. As an index of farmer sustainability, there are controversial farmer practices, such as excessive use of unauthorized pesticide, that will be included in creating the Farmer Sustainability Index. The main practices are pest and weed control, maintaining and enhancing soil fertility, controlling soil erosion and other practices to compute the scores. The total Index value for each farmer represented the sum of the sustainability scores in terms of the farming process including seeding, fertilizer application, weed control, and pest control. The production practices that are included in the calculation of the Farmer Sustainability Index value are shown in
Table 1. To facilitate the interpretation of the Index scores, the score were adjusted to fall within a range of 0–100. In order to create a structured questionnaire for data collection, each of the farming practices were included and phrased as a question about types of input used, amount of input applied, and frequency of application per hectare of farm per season,
etc.
In this study, the Malaysia Rice Check guideline was adopted for identifying farming practices in paddy production which was used to categorize the score value and evaluate the level of sustainability in farming practices [
20]. This index was developed prior to this study [
22] based on farming practices in the rice granary, Kelantan. The validity and reliability of the method of score value calculation were indicated with an accurate representation of farming practice based on Rice Check guidelines and discrete sustainability categories [
20].
3.1. Study Area
In the west coast of the Peninsular Malaysia, the most extensive coastal alluvial plain put into rice cultivation is in the Kedah-Perlis plain, where the largest of the eight granaries and the Muda Agriculture Development Authority irrigation scheme is located. Out of the total paddy planted area of 265,046 ha (main season) in the peninsular, Kedah state holds approximately 104,205 ha [
23]. The planted land area of the Muda Agriculture Development Authority is 92,047 ha with jurisdiction over the two biggest rice granaries in the north western and north eastern plains of Peninsular Malaysia [
24]. The Muda Agriculture Development Authority area has been a key area in the paddy sector as it covers the largest granary in the Peninsular and also produces 940,561 tons, accounting for about 41.5% of the total rice production among the eight granary areas in Peninsular Malaysia. This study was implemented through personal interviews of small-scale paddy farmers in the main paddy granaries under double-cropping in the sub-granary areas of Sungai Petani, Kedah State.
3.2. Data Collection
A simple random sampling technique was used to select paddy farm households which were under the same farming and irrigation systems and practicing double cropping. In total, 80 household heads were interviewed using a structured questionnaire containing questions regarding sustainability practices as shown in
Table 1 and the paddy farmers’ socio-demographic profile. The survey was conducted in the main season from 2013 to 2014. Referring to the Farmer Sustainability Index [
20] measured, this study attempted to create a new Farmer Sustainability Index to reveal the index of farmer’s sustainability for paddy farming in the sub-granary areas in Sungai Petani. There are several criteria that the farmers have to follow such as: selection of seed, fertilizer application, and weed and pest control, to compute the index scores. The total index value for each farmer represented the sum of the sustainability scores in terms of the farming process including selection of seed, fertilizer application, weed control and pest control as suggested by the Malaysian Rice Check guideline.
3.3. Framework Used to Measure Sustainability
For the selected production practices, the score is weighted separately based on how strongly each practice is believed to influence sustainability. For all practices which involved the index or were believed to contribute to sustainability, positive values were assigned, such as the use of organic pesticide, herbicide, and fertilizer, and proper timing and frequency of chemical inputs and their dosage. There are different weights assigned to each farming practice. Consistent with the decision to score practices according to their sustainability, we assigned different weights to practices according to how strongly each practice is believed to influence sustainability. A value of 0 was assigned to neutral practices, such as an intermediate number of pesticide applications. Negative values were given to the practices that had a negative impact on the sustainability, such as an overuse of chemical inputs used too extensively to control weeds and pests as compared to the dosage recommended on the container label and frequency as stipulated by the manufacturer in the instruction manual. For instance, with weed control, the weightage assigned to practices is shown in
Table 1. In terms of application schedule, there are several detailed schedules such as first applications need to be within three to five days after seeding as stated in the Malaysia Rice Check. Likewise, after the first application, the second application was scored as to whether the herbicide was applied in not less than 15 days after seeding and assigned weight as a maximum score of 2 within 15 days of application and between 15 and 30 days and exceeding 30 days after seeding at a score of 1 and 0, respectively.
The detailed guidelines for the farming practices were referred to in the Malaysia Rice check guideline distributed by the Muda Agriculture Development Authority to all paddy farmers in the granary areas. This is the guide for paddy farmers to manage their field. The Ministry of Agriculture also displays the guideline on their website as a guide for managing the paddy planting process. While each main check must be fulfilled to ensure higher production by the paddy farmers, monitoring and observation of plant and farm conditions from the aspect of growth, water management, fertilization, weed and pest control, and harvest are important practices that need to be recorded. The record keeping is important to identify the problems and take necessary actions to solve the problems. Keeping record is an important exercise as the data can serve as a guide for the farmers in the following season. The record is also important for MyGAP certification as well. By following the guidelines given in the Rice Check, especially in the use of inputs for paddy production, farmers are supposedly able to produce an optimal paddy and at the same time practice sustainable agriculture. In order to monitor and observe the ideal paddy-farming processes, such as water management, fertilizer, weed and pest control, and harvest, it is imperative to identify problems and take action to solve them. The Rice Check guideline consist of 10 items which are shown in
Table 2.
3.4. Analysis
The selected production practices in paddy farming practices are basically from the Rice Check guideline numbers 6 to 9 including the selection of seed, fertilizer application, weed control and pest control. To ensure practical convenience, the information was gathered from face-to-face interviews with 80 paddy farmers. However, the main reason for the selection of these practices was their negative effect on the environment and human health due to inappropriate management of chemical inputs, if there is any. Seeding was added as one of the production practices: the amount of seed per hectare. Farmers can apply the recommended amount of seed to avoid dense planting or sparse planting that can result in blight disease, shortage of nitrogen, or other possible problems. Fertilizer application, the timing of fertilizer application, and the amount of fertilizer applied, were added to the sustainable farming practices. For weed and pest control, the frequency of application, timing, variety of pesticide, and the amount of applied herbicide and pesticide were considered. The minimum and maximum unadjusted scores and score range for each group practice are shown in
Table 3.
4. Results and Discussion
Average input and output of rice production per hectare were shown in
Table 4 in the Sungai Petani area. This does not include hormones and vitamins in liquid form applied by some of the farmers. Among the 80 farmers, the average yield was 5364.4 kg per hectare using the following inputs: 146.6 kg of the average amount of seeds, 269.1 and 139.0 kg of compound and urea as fertilizer, respectively, 3.4 and 4.0 liters of pesticide and herbicide applied per hectare, respectively. According to each farming practices,
Table 5 shows the number of farmers who apply each practice in seeding, fertilizer application, and herbicide and pesticide application.
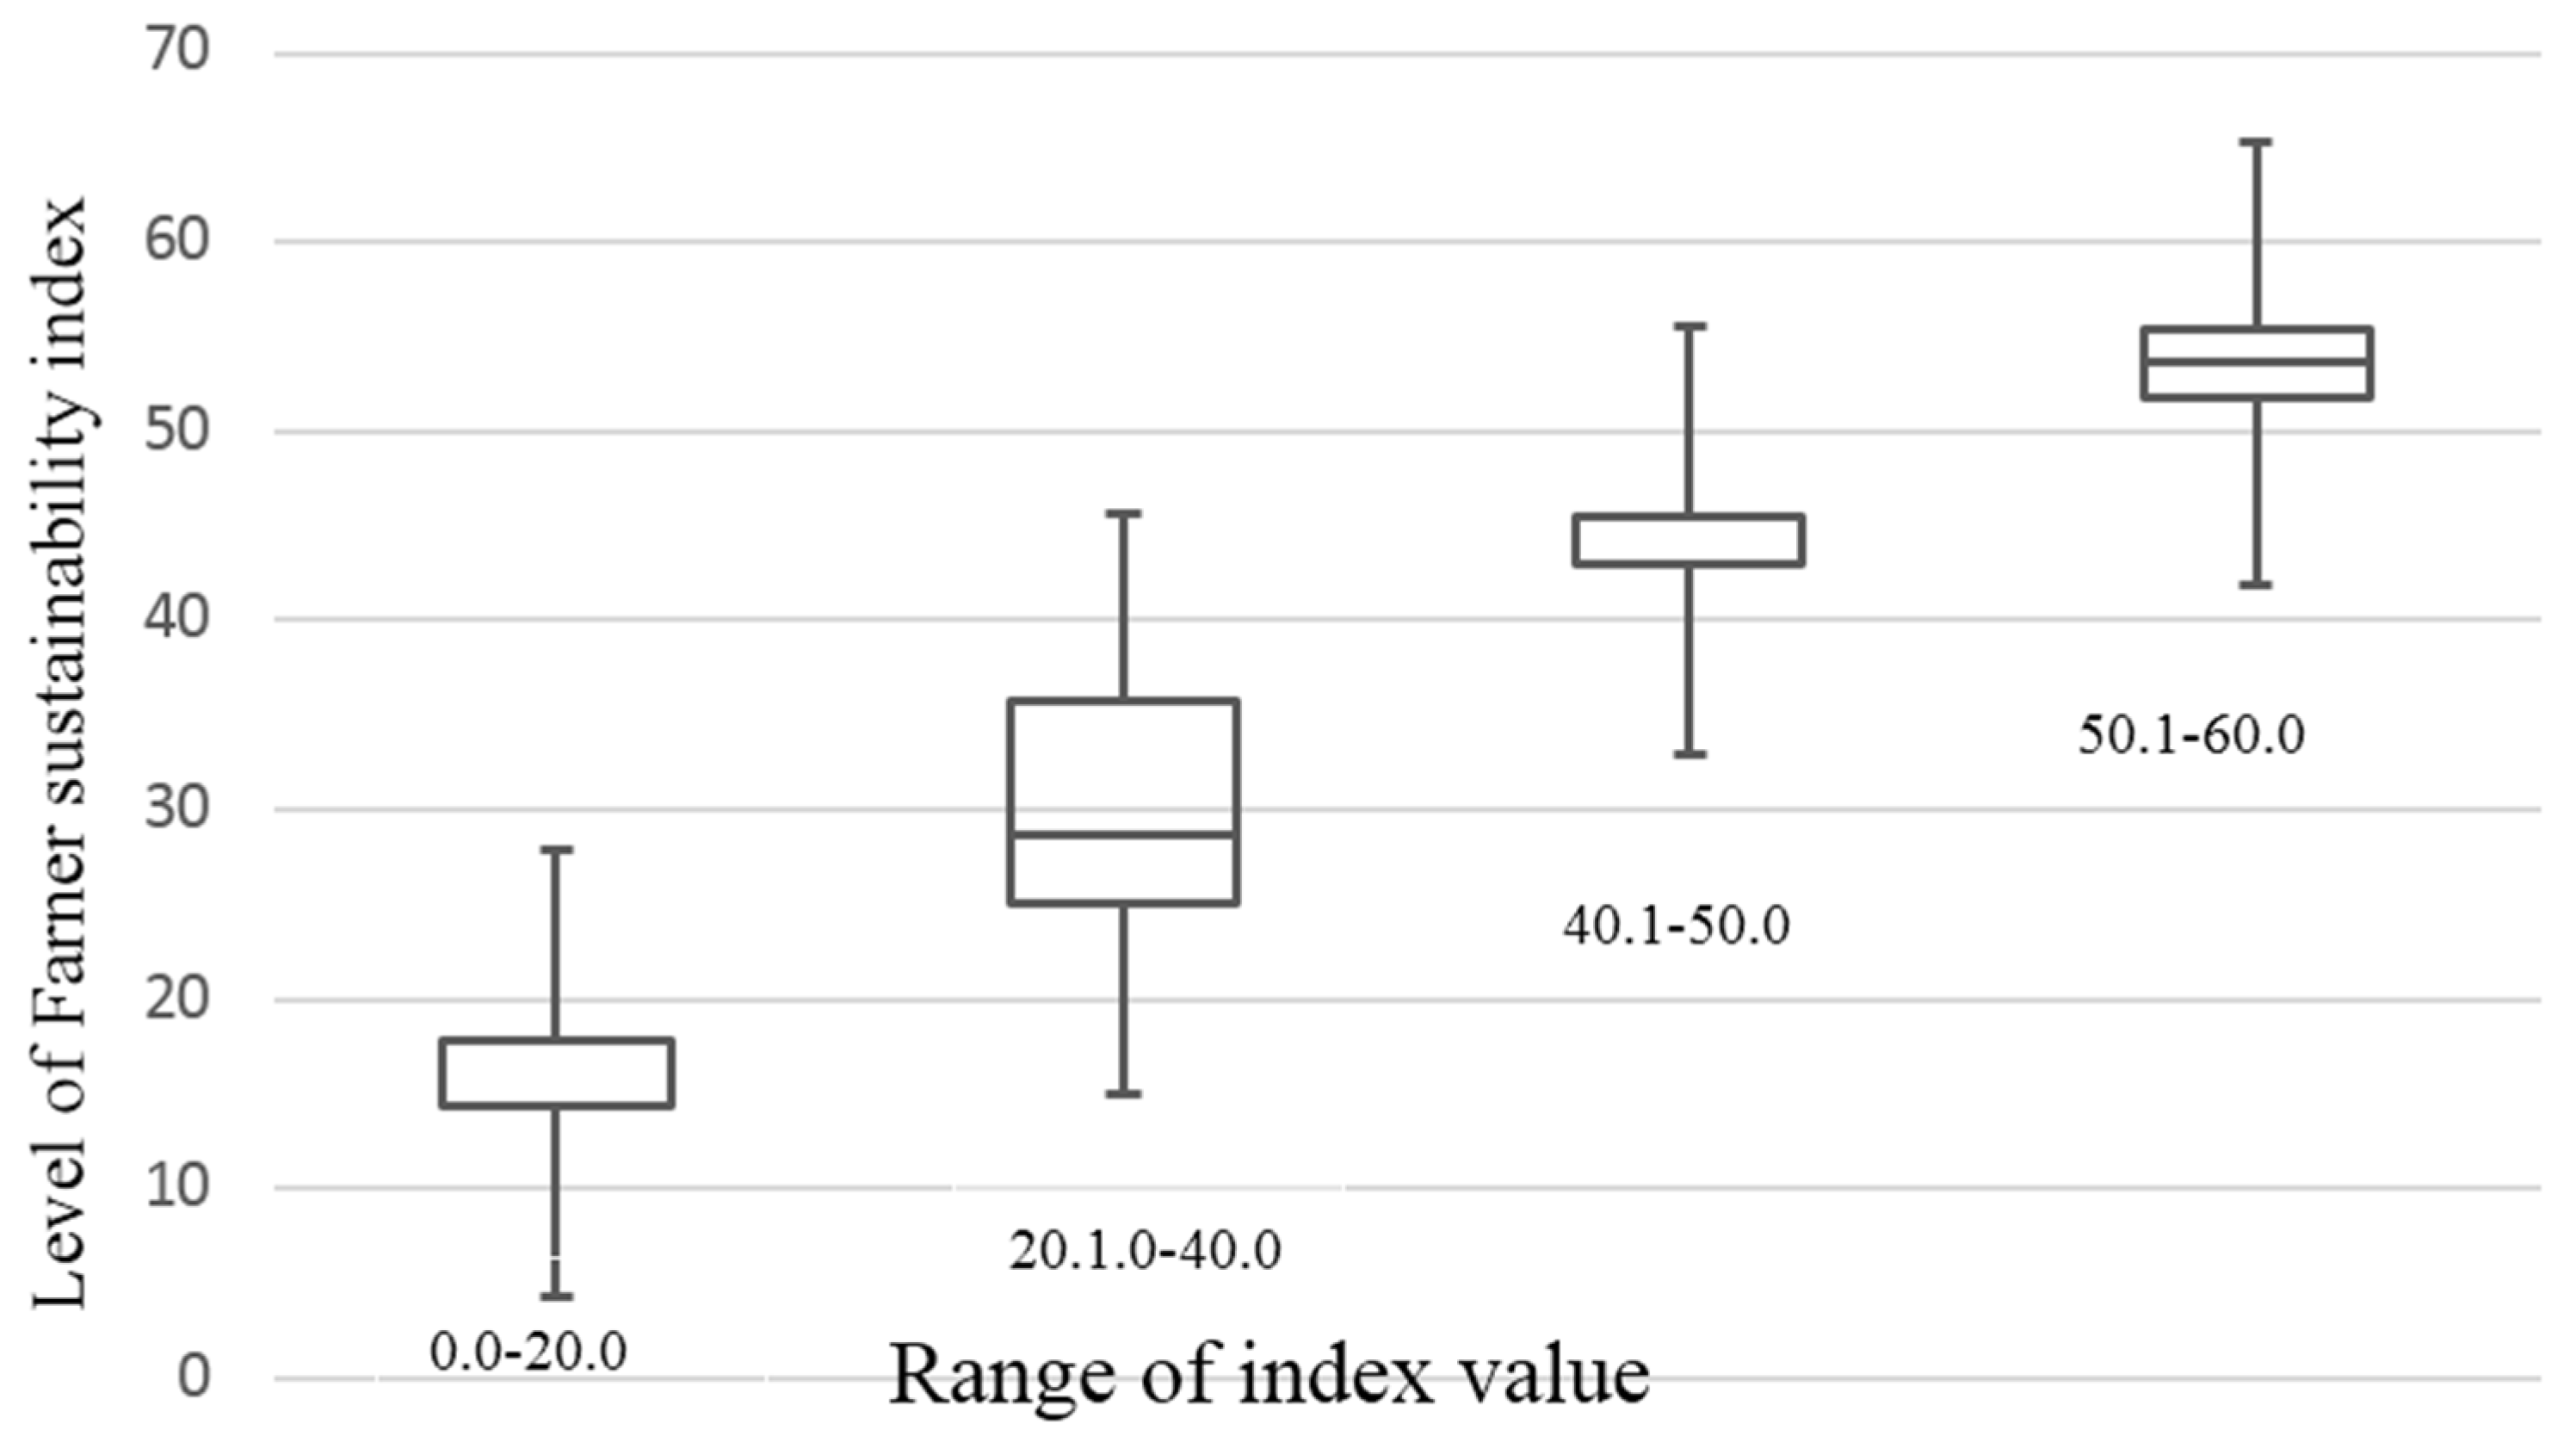
In the index values, 70% of the maximum range of 20 points (−8 to 12) is related to weed and pest controls, 10% to seeding and 20% to fertilizer application. The calculated scores of the 80 farmers varied from 3.6 to 57.1 (on a scale of 0–100), with an average of 28.6 as shown in
Table 5. The range of the index is concentrated in the interval 20.1–40.0 of the index value. There were 18 (22.5%) and 49 (13.8%) farmers in the interval of 0.0–20.0 and 40.1%–50.0% with only 2.5% farmers in the interval of 50.1–60.0. Based on
Table 6 the distribution of index values was presented in
Figure 1. As shown in the box plot, index value range “20.1.0–40.0” tends to have more variations among 49 (61.2%) of the farmers.
According to the range of index values [
20], in
Table 6 none of the 80 paddy farmers applied quite sustainable and somewhat sustainable farming practices. There were only 2 farmers (2.5%) who applied the practices at the intermediate sustainability level and 11 farmers (13.8%) applied them at a possibly unsustainable level. Among the 80 farmers, 67 (83.7%) in the range of frequency distribution of 0.0%–20.0% (22.5%) and 20.1%–40.0% (61.2%) were categorized in the group of possibly quite unsustainable level of practice according to the five discrete sustainability categories.
5. Conclusions
Health conscious consumers are raising concerns for agricultural sustainability which tracks food safety, environmental protection, and producers’ health issues. The farmers’ production practices consist of all activities from land preparation to harvesting within one season. Often production practices are left to the discretion of the individual in the farming process. In order to develop the Farmer Sustainability Index for paddy farming, the influential processes of production practices were selected, especially weed and pest controls, which were obtainable through face-to-face interviews with 80 farmers.
This paper explained how a Farmer Sustainability Index was developed using 16 different practices such seeding, fertilizer application, and weed and pest controls used by 80 paddy farmers in sub-granary areas of Sungai Petani district, Kedah, Malaysia. In developing the index, a lower weight was given to farming practices that are crucial in creating unsustainability in the practices. The result showed that the majority of the farmers (80%) practiced quite unsustainable paddy farming with a score of less than 40.0 on a scale of 0–100. It showed that most farmers were not aware of MyGAP or the Rice Check guideline. Only 2.5% of the paddy farmers are in the range of intermediate sustainability with none of the farmers (0.0%) in the range of quite or possibly sustainable. The actual sustainability level in the paddy farming practices is still quite low, implying that farmers are not following the Paddy Check guideline and are using excessive fertilizer, pesticide, and herbicide. That is, the rice that is being produced is most likely to contain chemical residue that leads to issues of food safety. The results of this study suggest that paddy farmers sampled in the Sungai Petani district are practicing unsustainable farming practices and that continuing these practices will degrade resources for future generations. Paddy farmers need to be aware of the value in sustainable practice which is essential to ensuring sustainability in paddy farming practices. Furthermore, they need to receive concise training, practical demonstrations of methods, intensive extension services, and monitoring in the field.


