Article

Possible Target Corridor for Sustainable Use of Global Material Resources

1
Wuppertal Institute, P.B. 100480, Wuppertal 42004, Germany
2
Center for Environmental Systems Research, University of Kassel, Wilhelmshöher Allee 47, Kassel 34109, Germany
Resources 2015, 4(1), 25-54; https://doi.org/10.3390/resources4010025
Submission received: 9 October 2014 / Accepted: 4 February 2015 / Published: 11 February 2015

Abstract

:
Many countries have started to develop policy programs for the sustainable use of natural resources. Indicators and targets can cover both a territorial and a life-cycle-wide global perspective. This article focuses on how a safe operating space for global material resource use can be outlined based on existing economy-wide material flow indicators. It reflects on issues such as scale and systems perspective, as the choice of indicators determines the target “valves” of the socio-industrial metabolism. It considers environmental pressures and social aspects of safe and fair resource use. Existing proposals for resource consumption targets are reviewed, partially revisited, and taken as a basis to outline potential target values for a safe operating space for the extraction and use of minerals and biomass by final consumption. A potential sustainability corridor is derived with the Total Material Consumption of abiotic resources ranging from 6 to 12 t/person, the Total Material Consumption of biotic resources not exceeding 2 t/person, and the Raw Material Consumption of used biotic and abiotic materials ranging from 3 to 6 t/person until 2050. For policy, a “10-2-5 target triplet” can provide orientation, when the three indicators are assigned values of 10, 2, and 5 t/person, respectively.

1. Introduction

In the first decade of the 2000s, several countries started to develop policy programs for enhanced resource efficiency. Japan and Germany, both reliant on growing imports of raw materials and experiencing high volatility in the price of commodities, pioneered this development in order to reduce their dependence on foreign supply, spur innovation, enhance international competitiveness and contribute to a more sustainable development both within and outside their countries. In 1998, Germany defined a target to double abiotic material productivity from 1994 to 2020 in their draft for an environmental policy focus program which was taken up in the sustainability strategy in 2002, since then the progress towards the target is regularly reported [1] and ten years later a program for resource efficiency (ProgRess) was set up [2]. In 2003, Japan introduced a target to enhance material productivity of the economy in the first fundamental plan for establishing a sound material-cycle society, good progress was made and the program was up-dated in their second fundamental plan in 2008 [3]. In 2005, the European Commission stepped forward as another pace making actor with the “Thematic Strategy on the Sustainable Use of Natural Resources” [4] which was followed by the “Roadmap to a Resource Efficient Europe” [5,6]. In 2014, the Seventh Environment Action Programme (2014–2020) was enacted with the aim of shifting the EU towards a low-carbon, resource-efficient economy and safeguarding human health. The nine priority objectives strive toward reaching the 2050 vision of living “well, within the planet's ecological limits” [7]. Meanwhile many countries have also declared to aim at an increase of resource productivity, with China, Austria and Italy also targeting quantitative proportions; while only few countries such as China and Hungary also aim to reduce their absolute resource consumption [8].
In all the processes of preparing and implementing such policies, the question of appropriate targets and indicators have played and still play a basic role. For that purpose, it was quite helpful that methodological standards were provided on how to measure in particular economy-wide material flows and productivity by Eurostat [9,10,11] and the OECD [12]. At the same time, many expert discussions on indicators became somehow hampered by the observation that the availability of data to produce some of the more comprehensive indicators regularly still needs to be improved. While this is certainly true, policies depend on plausible goals and directionally safe long-term targets. Research and statistics can then elucidate ways to deliver the required data. Otherwise, if policy design is confined to recently available data, this tends to short-cut their impact in space and time, and opens the door to problem shifts. Fortunately, a learning processes is ongoing whereby the knowledge base of problems and perspectives provided by research institutes, the monitoring by statistics, and the development of the policy framework in reflection of the actors’ interests in industry and NGOs through their interaction, is leading to a stepwise expansion of perspective.
With regard to headline indicators of environmental performance, there seems to be a convergence towards the “four footprints” (see e.g. [13]) materials, land, water and GHG emissions. The material use can be determined on the basis of different, though nested indicators with more or less comprehensive scope: direct material flows, raw material flows and total material flows indicators. The term “material footprint” has been used differently so far: for instance, Wiedmann et al. [14] used it for Raw Material Consumption of economies, whereas Lettenmeier et al. [15] used it for Total Material Requirement of household consumption. The measurement of the GHG emission footprint is well established [16], the methods of determining the water footprint are rather advanced [17], and the land footprint can be quantified for certain critical land use types such as cropland [18].
This article will focus on the question of how a sustainability corridor of future development of the input side of the socio-industrial metabolism can be delineated on the basis of the existing economy-wide material flow indicators. It starts to explain why targets for global resource use would be helpful in the context of the Sustainable Development Goals (SDG) as well as national resource policies. The article will reflect on the question how a safe operating space of resource use can be defined; that it depends on the scale of observation and the system perspective; biomass and mineral flows require the consideration of specific aspects, and social acceptance of environmental conditions play a central role, as well as international fairness when determining global targets. The global metabolic system is taken as a basis to discuss potential “valve” indicators for human-induced resource flows which can be linked to final consumption of countries. Existing proposals for global targets such as the Factor 10 concept will be reviewed and partially revisited regarding their basic assumptions in particular the relation of human induced and natural flows. Building on earlier work also from others, a potential corridor of a safer and fairer use of natural mineral and biomass resources will be outlined. The result will be discussed with regard to compatibility with other, substance specific target proposals, feasibility and further acceptance.

2. Why Targets for Global Resource Use?

Human induced material flows are rapidly growing. Between 1970 and 2008, the used extraction from the natural environment has doubled [19]. While the world’s economic development in terms of GDP has been increasingly decoupled from material resource use, it is highly probable that business-as-usual will lead to a further increase in the coming decades [20]. As a consequence, the related environmental burden and associated social conflicts must be expected to grow as well. At the same time, material wealth and associated resource consumption is unequally distributed between and within countries. Countries also differ with regard to their need to build up and maintain their infrastructures. While developing countries have a surging need for constructing houses and transport lines—and therefore need material resources—more developed countries use materials to supply high tech production. Nevertheless, patterns of final consumption are converging all over the world, alongside of average rise of income. While expertise is growing and examples are mushrooming on how more wealth and a good life can be created with less resource consumption [21], there is no evidence yet whether and when this will lead to an overall stabilization and subsequent absolute reduction of resource consumption.
Against this background, the International Resource Panel [22] suggested as a Sustainable Development Goal, the “efficient use of natural resources in an equitable and environmentally benign manner for human well-being and future generations”. Two possible targets were proposed. Target A: “to double the yearly rate of resource productivity increase”. As possible indicators, GDP in relation to material flow indicators (RMC, TMR), global land use and GHG emissions were suggested. Target B: “Decoupling economic growth rates from escalating use of natural resources to achieve the average material intensity of consumption per capita of 6–8 tonnes/capita/year in 2050”. As indicator the material footprint as measured by Raw Material Consumption was explicitly mentioned. Target B was formulated to “highlight the equitable use of natural resources (by promoting equal access to and/or attribution of resource consumption on a per capita basis) as well as ensure that socio-economic development will take into account the available safe operating space. The expectation was formulated that setting such a target “would set a direction where developing countries would achieve a rising share of global resources while industrial countries would have to lower the intensity of their material consumption through significant increases in resource productivity and changes in consumer behavior”.
Therefore, it seems worthwhile to have a closer look at how a safe operating space of material resource use can be reasonably defined in terms of material flow indicators, what criteria and rationale can underpin such or similar suggestions from a systems perspective, while considering policy development.

3. How to Define What a Safe Resource Use Could be?

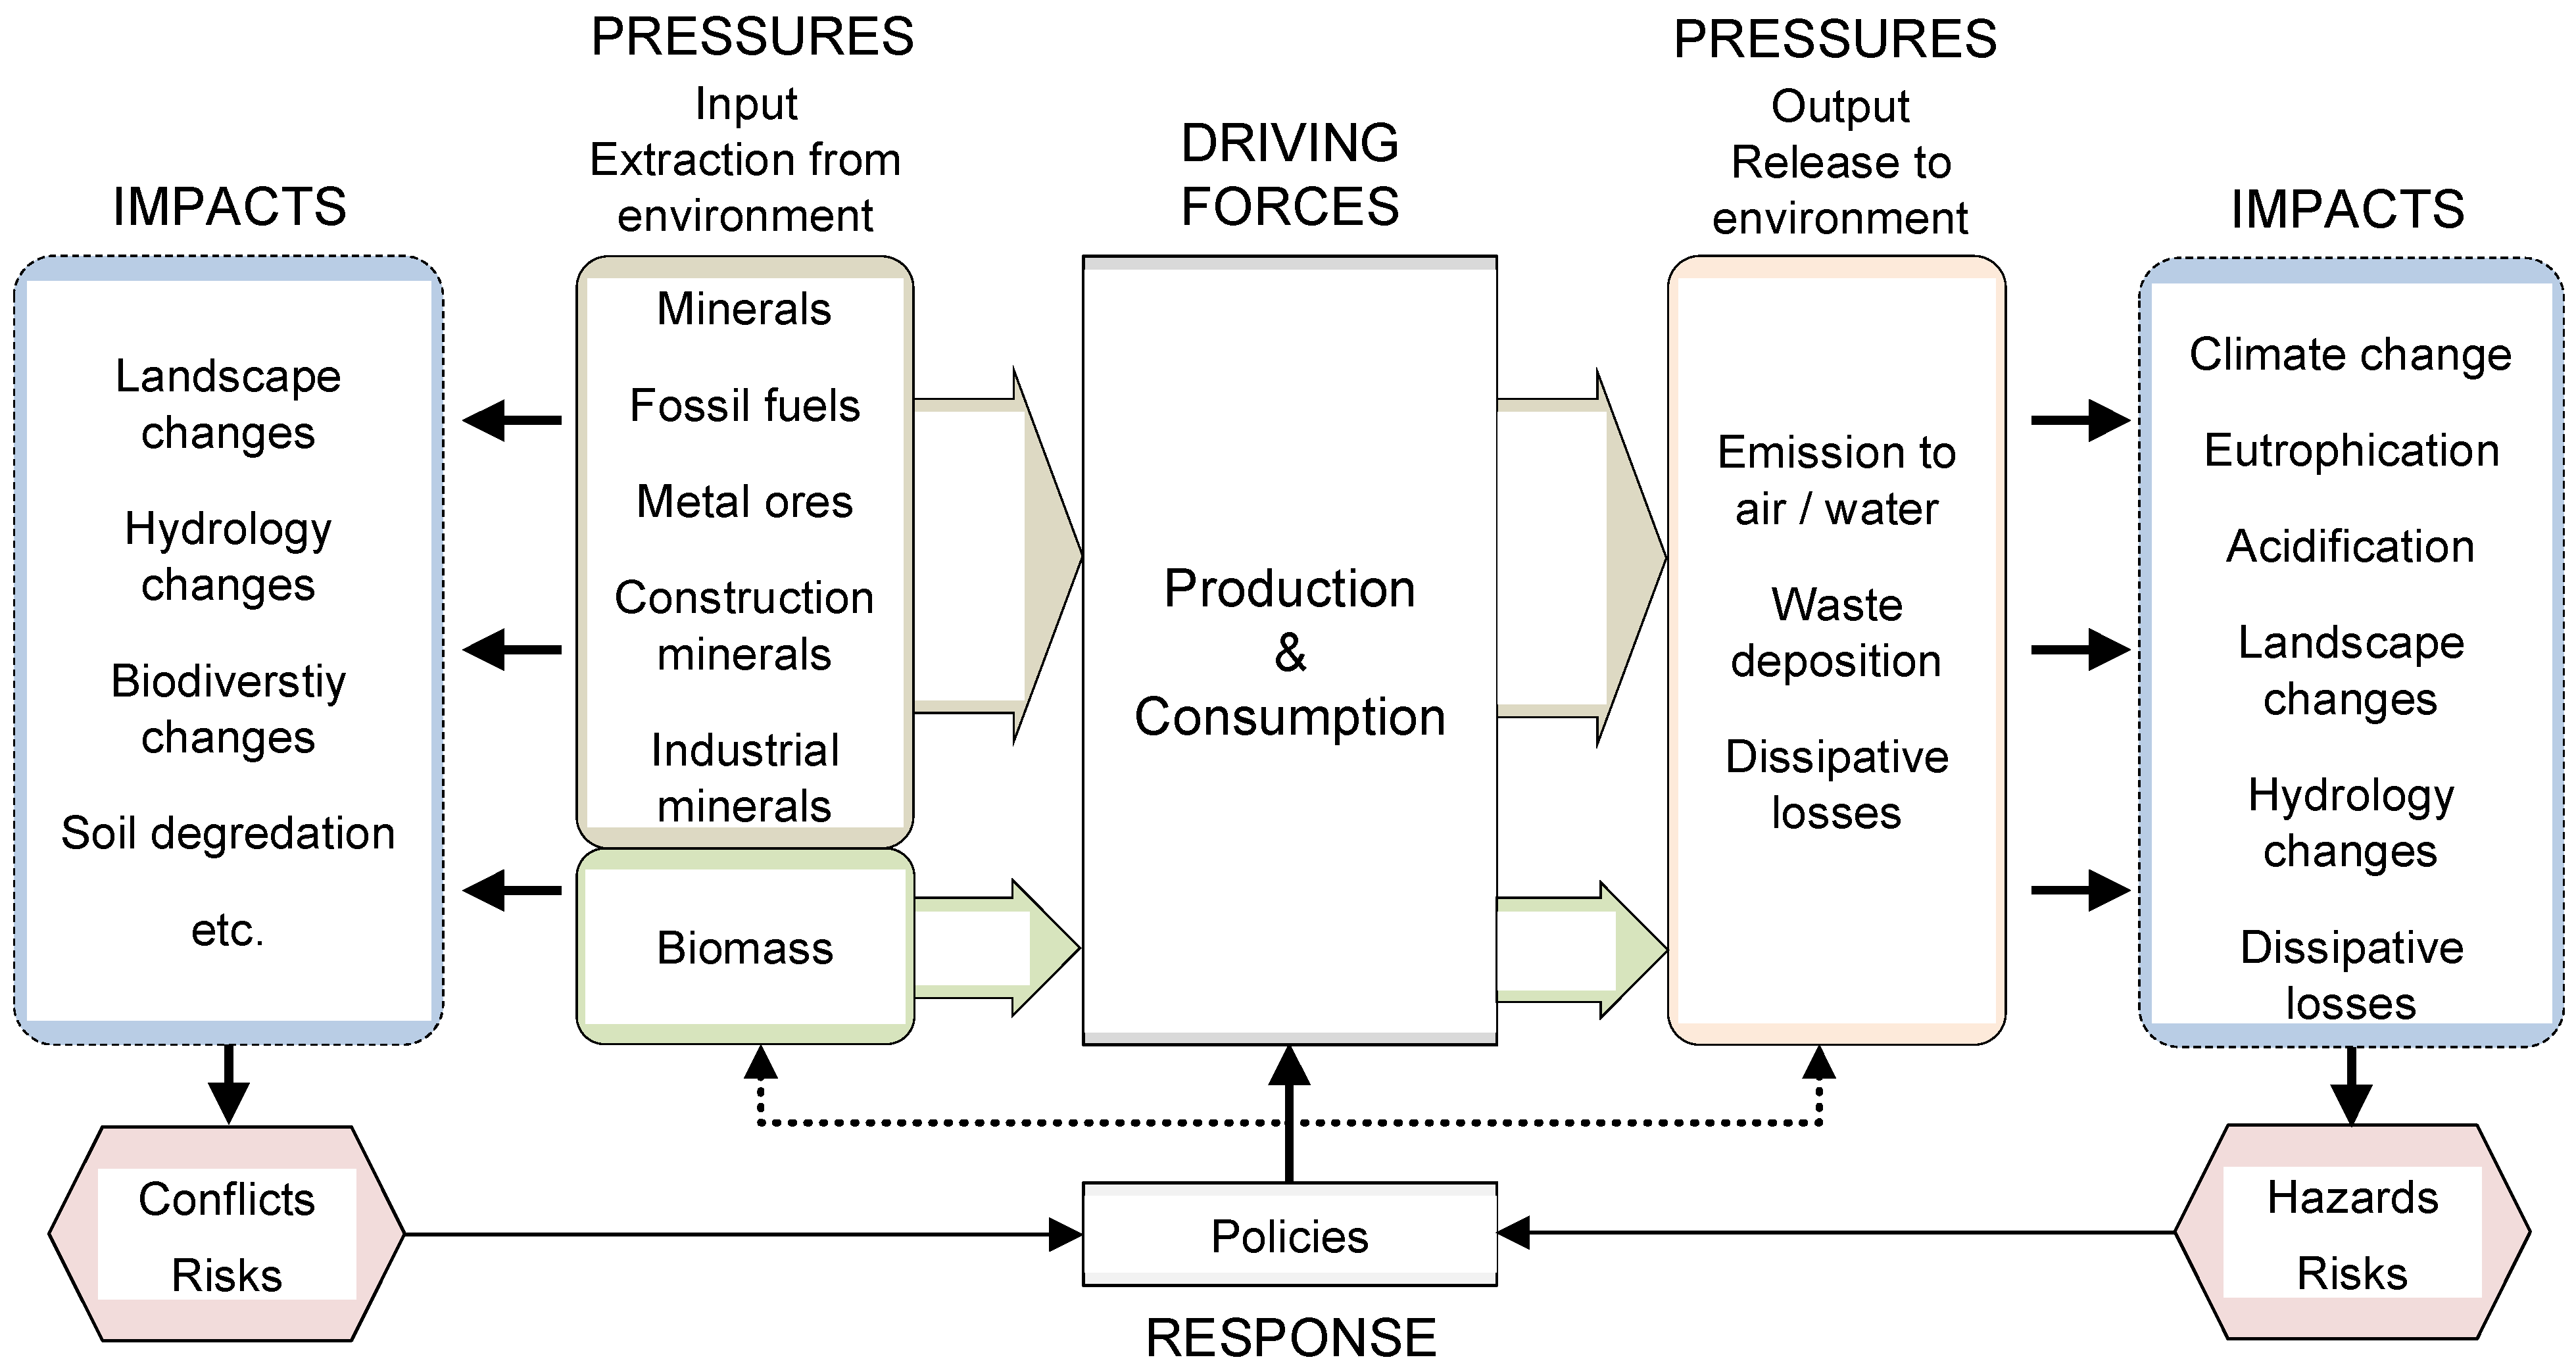
3.1. The Issue of Scale and a System Perspective

Whether an interference with the environment such as resource extraction and its consequences are “benign” depends on the scale of observation and on value judgments.
Regarding scale, for example, Viglizzio et al and other colleagues-documented in [23]—showed for agro-ecosystems in Argentina that at the local level nitrate contamination by intensive dairy and beef production was assessed as critical, while at the regional level plant cover loss and shrub encroachment were regarded most critical, and at the national level habitat and biodiversity loss, as well as carbon, nitrogen and phosphorous losses together with cropland expansion were evaluated as most critical. In general, analytical perspectives and the assessment of critical thresholds depend on the scale. Parameters which are critical on the local or regional level need not be critical at higher scales. The dynamics of scaling up or scaling down effects are often uncertain.
The assessment of the environmental effects of mining, quarrying, infrastructure building, and final waste disposal is usually performed at the local level. There, the activities often transform natural settings completely, and conflicts may arise from competing land use interests. On a regional scale, those activities are often accepted, not only due to economic gains, but also because they occupy only a small proportion of all land uses. In view of the growing magnitude of man-made mineral flows, nevertheless, the question that arises is: to which order of magnitude can these flows grow without “the risk of deleterious or even catastrophic environmental change at continental to global scales” as defined by Rockström et al. [24]? One may not assume fixed thresholds or tipping points beyond which whole regions would become devastated, rather than a continuous, steadily creeping change of the living environment through a growing number and extent of mining, quarrying, construction and disposal activities, so that the safe operating space might be determined rather by factors of societal acceptance of such a change rather than earth science modeling.
Before tackling the question of how to assess specific risks associated with certain material flows, it seems important to adopt a comprehensive systems perspective. Targets for sustainable resource use need to consider the physical economy in its complexity and as a metabolic system, a system which needs to be further developed while maintaining and improving its functionality. For the derivation of material flow related targets, it seems worthwhile to recall some key observations. Figure 1 depicts the major material resource flows as input to the production and consumption system and the subsequent output of wastes and emissions. Environmental impacts are linked to both the extraction/harvest, and to final waste disposal. The volume of input determines the volume of subsequent output; if the supply of the economy is provided by higher internal recycling, the primary input will decline as will the outputs. The resource flows such as fossil fuels, metal ores, industrial and construction minerals are each linked to bundles of environmental impacts (landscape changes, hydrology and biodiversity changes induced by resource extraction are often coupled, and as resource extraction becomes wastes and emissions sooner or later, also bundles of output related pressures are linked to resource flows). Those bundles seem to be relative similar, at least on the input side, for mineral resource flows on the one hand, and biomass flows on the other hand [25]. With a given spatial pattern of resource supply and final disposal and a certain technology used in manufacturing and final consumption, the bundles of environmental impacts of material flows can be mitigated effectively only when input flows are reduced (e.g., by increased material and energy efficiency and recycling). It was these insights, which led in the 1990s to the development of a dual policy strategy: to continue control of emissions of specific hazardous pollutants on the output side, and in addition develop instruments to enhance resource efficiency in order to save natural resources [26].
Figure 1. Overview scheme of the socio-industrial metabolism with environmental impacts and policy response triggered by resulting hazards, risks and societal conflicts.
Resources 04 00025 g001
In general, material flow related targets should be based on a perspective of a future metabolic system that can operate within the global bio-geo-sphere for centuries to come. In other words, the supply of materials and energy would have to be regenerative (not only-potentially-“renewable”) with minimal inputs and outputs from and to the environment. Such a vision of a circular material flow system mainly driven by solar energy has been outlined as an ideal of industrial ecology [27]. In a more systematic way, the pre-conditions of a sustainable socio-industrial metabolism comprise the following aspects: (1) The material supply is mainly fulfilled by internal recycling; (2) The energy supply comes from renewable sources (solar, wind, geothermal, etc.); (3) The input (extraction/harvest) and output (emissions/waste) remain under critical thresholds and within a safe operating space; and (4) the technosphere must not oust the natural systems. The latter criterion reflects the nexus of material flows and stocks and land use: the housing and infrastructure stock cannot grow indefinitely on the given terrestrial surface without jeopardizing the life-support systems, and agricultural fields and forestry plantations cannot expand indefinitely without replacing biodiversity rich biomes, and their expansion should also be kept within a safe operating space.
Globally, Rockström et al. [24] aimed at the implementation of the third criterion with the definition of the safe operating space for three key output flows, namely GHG emissions, nitrogen and phosphorous. Steffen et al. [28] supplemented regional targets for phosphorous.
What seems lacking, so far, is a sufficient understanding on the acceptable level of material resource flows, i.e., the input side of the anthroposphere. Primary material use needs to be reflected by long-term targets on a global scale, as a reference for countries to assess their consumption of biomass, metals, industrial and construction minerals. The potential criteria for such an assessment shall be shortly reflected for biomass and minerals flows. These considerations are by no means exhaustive but try to focus on some essentials.

3.2. Aspects of a Safe-Operating-Space for Biomass Use

Mankind appropriates already about a quarter of global primary biomass production [29] and biotic resources are often overexploited and thus degraded [30,31]. A determination of safe operating space in terms of biomass mass flows seems difficult. Whether the production, harvest or catch can be continued under sustainable conditions is usually determined by the performance of local management of farming, forestry and fisheries. There are existing certification schemes, and theoretically one could use the percentage of certified production used in countries’ consumption in order to indicate progress towards safe operation in the use of food and non-food biomass. However, in agriculture the application of certification for biofuel crops has been rather an example of misguided orientation, also due to the fact that only a small part of the market is certified, and primarily due to the fact that the overall demand for food crops grows with a speed which cannot be compensated by increased yields so that the expansion cropland becomes unavoidable under business-as-usual conditions [23].
In general, it seems appropriate to define the SOS for agricultural biomass use with regard to the highest environmental pressures. At the regional and continental level, nutrient overload of soils and water bodies by agriculture are outstanding. Rockström et al. have indicated that nitrogen flows have surpassed safe levels even at the global level and Steffen et al., point out the critical regional distribution. Indeed, human induced nitrogen fixation has been a major cause of an acceleration of global nitrogen flows and resulting eutrophication [32]. Based on the analysis of the “net anthropogenic nitrogen inputs (NANI)” across 154 watersheds, Howarth et al. [33] suggested a possible threshold of nitrogen fluxes to the oceans when NANI values are below 1070 kg N km−2 year−1. As synthetic fertilizer is the largest component of NANI in many watersheds, this would require agriculture production to become more nutrient efficient. The Global Partnership on Nutrient Management and the International Nitrogen Initiative request a 20% improvement of the full-chain nutrient use efficiency (base year 2008) for every country which would lead to annual savings of 20 Mt of nitrogen worldwide by 2020 [34]. The full-chain nutrient use efficiency is defined as the nutrients in food available for human consumption in a country as a percentage of the total nutrient inputs to that country (sum of fertilizer inputs, biological nitrogen fixation in crops and grass, import in fertilizer, and feed and food). Leach et al. [35] developed a method to measure the nitrogen footprints of individual consumers with reference to specific country conditions of production and transport. Those relative target values aim at absolute reductions of primary nutrient input, in particular of nitrogen, associated with final product consumption, for instance by fostering more healthy diet and less food waste—without formally relating to a global SOS reference. There are, however, also other problems beyond nutrient flows induced by biomass use.
At the global level, land use change induced by agriculture belong to the biggest pressures, leading in particular to high biodiversity losses [30]. For global cropland use by countries, monitoring methods have been developed [18] and as mentioned above a target of 0.20 ha/person for 2030 has been suggested by the International Resource Panel [23], arguing that the goal of the UN Convention on Biodiversity can only be reached if the expansion of cropland into grasslands, savannahs, and forests will be halted, proposing to limit the ongoing expansion until 2020 and then distribute its use (by final consumption of products) equally amongst the world population of 2030.
At the same time, loss of topsoil by erosion represents also a huge threat, with approximately 2–5 Mha becoming severely degraded every year globally [23]. Soil erosion urgently needs to be reduced to tolerable levels and degradation of soils needs to come to a halt. The attribution of soil erosion in agriculture to the consumption of final products was conceptually developed by Schmidt-Bleek et al. [36] within the MIPS concept, adopted in the economy-wide material flow accounting framework [9], but sparsely practiced (e.g., [37,38,39]) due to the limited data availability.
For forestry, it is also quite a challenge to define a global safe operating space. Both deforestation and forest degradation would need to be halted at an acceptable level. As an operational parameter, one could use the net annual increment (NAI) of a given structure of forest composition as a reference which should not be exceeded globally. The use of NAI by countries’ consumption can be determined and used for the assessment of sustainable resource consumption [18,40].
For fisheries, the situation is even more complex, with marine and freshwater captures and aquaculture. Globally, the overfishing of marine species and the continuous decrease of the trophic level harvested seem to be the most pressing problems. Unused extraction in the form of by-catch aggravates the pressure, as it is estimated to amount to between 20% and 40% of the marine extraction [41]. How fisheries can be sustained is treated by other experts [42].
For the further deliberations on biomass in this article, which focuses on major resource flow aggregates, the relations of used harvest are interesting. Agriculture, forestry and fisheries produced 8.7 Gt, 2.4 Gt, and 0.14 Gt, resp. in 2000, and 11 Gt, 2.4 Gt, and 0.17 Gt in 2010. Thus, agriculture and its food production clearly dominate the use of biomass for final consumption.

3.3. Aspects of a Safe-Operating-Space of Minerals Use

A sustainable use of minerals has been primarily discussed under economic considerations of “scarcity”. Barbier [43] and Daly [44] proposed management rules which meant—amongst others—that non-renewable resources should only be used to the extent that a man-made substitute can be found, in order to save natural capital. In case, natural resources would be regarded as non-substitutable by man-made capital this would logically require to minimize the use of natural resources [45]. Such goal formulations, however, were too abstract for supporting practice. Triggered by price spikes of metals in the 2000s, the “criticality” of mineral resources caught attention in the sense of short- to midterm shortages of supply and possible economic constraints resulting from the shortage [46,47]. Monitoring critical minerals should inform industry for which elements substitutes would be particularly rewarding.
The “depletion of resources” in the sense that certain scarce resources will be used up and be no longer available in the future was also introduced to the LCA method framework. Still, there is no generally accepted approach to measure, for instance, abiotic resource depletion potential (ADP). The recent review of the existing methods by Rørbech et al. [48] showed that results vary considerably between the method chosen, that ore grade quality methods are often hampered by limited resource coverage, and that a comprehensive coverage of different resources would be essential to avoid problem shifts. Moreover, the existing classifications would not systematically reflect environmental impacts. This is understandable as neither the relative abundance of a mineral in relation to the concentration of antimony in the earth crust [49], nor the change rate of metal ore concentration [50] carries much information on environmental implications, while it seems clear that the extraction of valuable materials will require more energy with declining quality of geological deposits [51], which can be measured by other existing indicators. The accounting of exergy [52], indicates the potential of mechanical work, useful heat and material production [53], but does not account for environmental impacts. Neither of those methods accounts for the disruption potential of biotic structures or for the consequences of resource nexus at the landscape level, when the magnitude of mineral extraction affects the hydrological conditions and subsequently flora and fauna.
As LCA approaches to indicate resource depletion have limited information value, their inclusion into an expanded definition of criticality [54] also might not lead much closer to a safer and fairer use of mineral resources worldwide. The major reasons are the negligence of impacts bundled by mass extraction at the landscape level, and their potential cumulative effects with growing flow volumes within given environmental systems. Human transformation of the earth’s crust may extend from local to global impacts on ecosystems [55].
The implications of mass extraction from the natural environment are neither limited to the impacts which are quantifiable within the LCA framework, nor to environmental consequences. In order to illustrate that point, one may look at the map of geological deposits in Germany (http://www.georohstoff.org/; the map can be narrowed down to regions; to overlay restrictions click on buttons from biosphere reservations to water protection areas). The country is rich of various mineral resources so that there is no scarcity in the sense of physical occurrence. If the map, however, is overlaid with others showing the various restrictions of land use for nature conservation and water protection it becomes obvious that the main problem is the scarcity of conflict free access to those deposits. In other words, the conflicting uses of natural resources are an important argument to reduce the extraction of minerals to the necessary minimum.
It is the magnitude of the overall extraction which determines the magnitude of the resulting landscape change and the associated impacts such as on the quantity and quality of ground and surface waters which are often important for agriculture (for instance, half of Germany is used for agriculture) and which goes beyond the directly disturbed surface area. Worldwide, the geological deposits are distributed amongst various biogeographical zones with different rainfall and biodiversity. As a consequence, the local impacts of a certain amount of mineral extraction may differ. At the same time, a certain amount of a mineral use within a country is often coupled with a global supply pattern, which is determined by the spatial occurrence of the mines depending on the deposits. Given the spatial pattern of supply, a rising consumption of natural mineral resources (fossil fuels, metals, industrial minerals, construction minerals) will lead to an increase of the associated bundles of impacts, distributed over the various locations of origin. Vice versa, a reduction may be expected to lead to a reduction of the bundle of impacts carried by resource mass flows, if no spatially explicit regulation is foreseen. Future research might help to refine spatially explicit attribution of life-cycle-wide impacts of resource use to production and final consumption, and certification of selected product chains may help to stir the supply pattern to areas of potentially lower damage. However, the basic dependence on natural deposits will remain, the interests of conflicting land use might expand, and certification of only parts of the mineral markets might not be sufficient to control the overall magnitude of human induced mineral flows and the associated environmental-social conflict potential. Against this background, the question arises at which level it would be sensible to limit the use of mineral resources.
In order to reduce the expected burden and to mitigate uncertainties and risks, Schmidt-Bleek [56,57], already in the 1990s, proposed to follow the precautionary principle and reduce the global resource extraction (minerals and biomass) by half until 2050 and grant every person the same right to share it (by adequate final consumption of products). For industrial countries, he estimated this would imply a long-term reduction of their resource consumption by 90% (or a factor 10). The appeal was taken up by renowned scientists in the “Factor 10 Club” (F10C) [58], who state that “very large flows of resources occur naturally, either from volcanoes or land erosion or other biosphere processes. Together these flows amount to some 50 billion tons per year, although more research is required to establish a precise number”. They argued that “human induced flows of resources into the economy” should not exceed natural flows by a factor of 2 and therefore should be reduced by a factor of 2. “Assuming seven billion people on planet Earth (...) that would result in an allowance of about 6 to 8 tons per capita per year”. When devising reduction strategies fossil fuels inducing climate change should be given priority, as well as water flows in regions of critical scarcity. Since then, the number of 6 to 8 tonnes per person has appeared in various publications and appeals, still without any specification of a measurable indicator, although their definition would have drastic implications on the required reductions. Schmidt-Bleek [57] himself has been convinced that all materials moved by technology from their natural setting should be accounted for—as is the basis for the TMR indicator in the MIPS concept [59]—to represent the associated pressure of primary resource use to the environment, thus including both used and unused extraction, excavation, etc. The formulation of the F10C, “resource flows into the economy”, however, could be interpreted as if only the used extraction should be considered as a basis for the 6 to 8 tonnes per person limit, because unused extraction per definition remains outside the economy, while being somehow linked to it. In addition, the reference to 50 Gt yearly resource extraction could be interpreted in that sense, as globally used mineral and biomass extraction amounted 51 Gt in 2000. This confusion is perpetuated by publications not specifying the indicator while addressing a target value (e.g., [60]). Depending on whether only used extraction or all primary extraction is taken as a basis, the same target value would imply that the required change could more than double.
In order to assess the validity of Schmidt-Bleek’s and the F10C’s proposals, one may shortly revisit some of their basic assumptions. The transformation of the bio-geo-sphere by mankind has reached a new dimension in earth history, indeed, and therefore, the ongoing era has been addressed as the “anthropocene” [61,62]. Today, man-made resource extraction exceeds natural translocations on the earth’s crust. The sediment load of large rivers transporting eroded material to the oceans was about 15 Gt/a before human activity [63]. The greatest known eruption of a single volcano, the Tamborra in 1815, excavated 140 Gt magma (equivalent to 50 km3 solid rock); 71,000 people were killed and the summer in South-East Asia failed due to the lasting dust in the atmosphere [64]. The global average of magma production through volcanism in terrestrial systems is 27–31 Gt/a [65,66,67]. It would not seem plausible to add up magma production and erosion, as the former represents an input to formation and uprise of the continents, whereas the latter represents rather their decline and output to the oceans. Therefore, the estimate of the F10C for the natural flows seems too high, although admittedly the data basis for those estimated should be improved. As a consequence, the difference between anthropogenic and natural flows might be even higher than assumed by Schmidt-Bleek and the F10C. In 2010, only the used mineral extraction by the global economy was 52 Gt (incl. biomass 67 Gt) [68]. Including the unused extraction of mining and quarrying as well as excavation for infrastructure the total mineral extraction may be estimated to range between 135 and 150 Gt in 2010 (see below).
The comparison of natural and anthropogenic material flows is not straightforward, when assessing the impacts associated with landscape changes through the translocation of earth crust material. When looking at material movements which occur relative rapidly (within periods of months to year) and lead to massive changes of local landscapes, then magma formation and its terrestrial eruption is probably more comparable to mining, quarrying, construction and disposal activities rather than the continuously occurring erosion. There is a lack of reference concerning the resilience of earth operating systems associated with the translocation of earth crust material. Using data on volcanism as “natural reference” is linked to the consideration that despite large translocations throughout human history with sometimes catastrophic local consequences, earth operating systems have not been pushed beyond tipping points, or in other words, have stayed within the Holocene. Today, the man-made mineral flows exceed the level of those natural mass flows 4–5 times; if only the extrusive magma formation is accounted for, the anthropogenic mineral translocations would be 68–75 times larger. A further growth of the anthropogenic flows will increase the associated pressures and related uncertainty. In a thought experiment, the reader may think of potential consequences if global magma streams were to increase by a factor of 70 or 100.
In any case, given a certain geographic pattern of geological deposits and the bundle of impacts associated with extraction and subsequent processes, the overall flow of primary minerals into the anthroposphere is a basic carrier of–bundles of–environmental pressures. Their magnitude can only be reduced when mitigating the yearly turnover of those resource flows.

3.4. Social Aspects of a Safe Resource Use

Whatever volume of resource use is regarded as acceptable or safe at the global level, the fair share of each country will have to be determined. According to the equity principle, a fair distribution of resource consumption amongst to current generation is usually operationalized by an attribution on a per person basis, in order to enhance legitimacy of governance [69]. In addition, the intra- and intergenerational equity calls for the consideration of two aspects. Firstly, “not to compromise the ability of future generations to meet their own needs” [70]; the uncertainty to assess that ability and the risks associated with current and expected resource use then requires to act in a precautionary way [71]. Secondly, the different development status of countries needs to be considered: while industrial countries have grown rich in the past due to high resource consumption also for the built-up of their infrastructures, developing countries still strive for decent living conditions which are hampered by lacking infrastructures. Minimum standards on food security, clean water availability, access to energy, etc. need to be fulfilled and may be regarded as part of a safe and just operating space [72]. On the one hand, catching up with wealth and improving well-being will not require developing countries to fully adopt the current technologies and consumption patterns of today’s rich countries, nor to rerun through the whole history of their history, rather than to speed up technological and institutional development in order to “leap-frog” faster into a more sustainable path, or to “tunnel through” the environmental Kuznets curve [21,25]. On the other hand, some developing countries might indeed need to increase their resource use at least over a certain period in order to build up their infrastructures. As a consequence, the development status of countries will need to be considered when defining global policy targets of resource use, a challenge which also relates to the assessment of the feasibility of any targets. In general, a “contraction and convergence” of resource use could describe a sensible global development pattern, as has been suggested for climate protection [73].
In his original proposal, Schmidt-Bleek [56,57] suggested to halve global resource consumption while at the same time change the distribution between industrial and developing countries from 80:20 to 20:80 in order to reflect the relations between populations. This would allow developing countries to double their resource use within 50 years (increase it even 2.5 times within the first 40 years), while industrial countries would need to reduce their resource consumption by a factor of roughly 10 (87.5%).
Against this background, the question arises which of the indicators developed to measure human resource flows are adequate for target setting of a safe operating space. Those indicators can attribute resource use to final consumption of products within countries. The subsequent considerations will focus on economy-wide material flow indicators and their potential use as “valves” of the global socio-industrial metabolism.

4. Material Flow Indicators and Target Valves

Economy-wide material flow accounting has developed a set of nested indicators [9,10,11,12], based on:
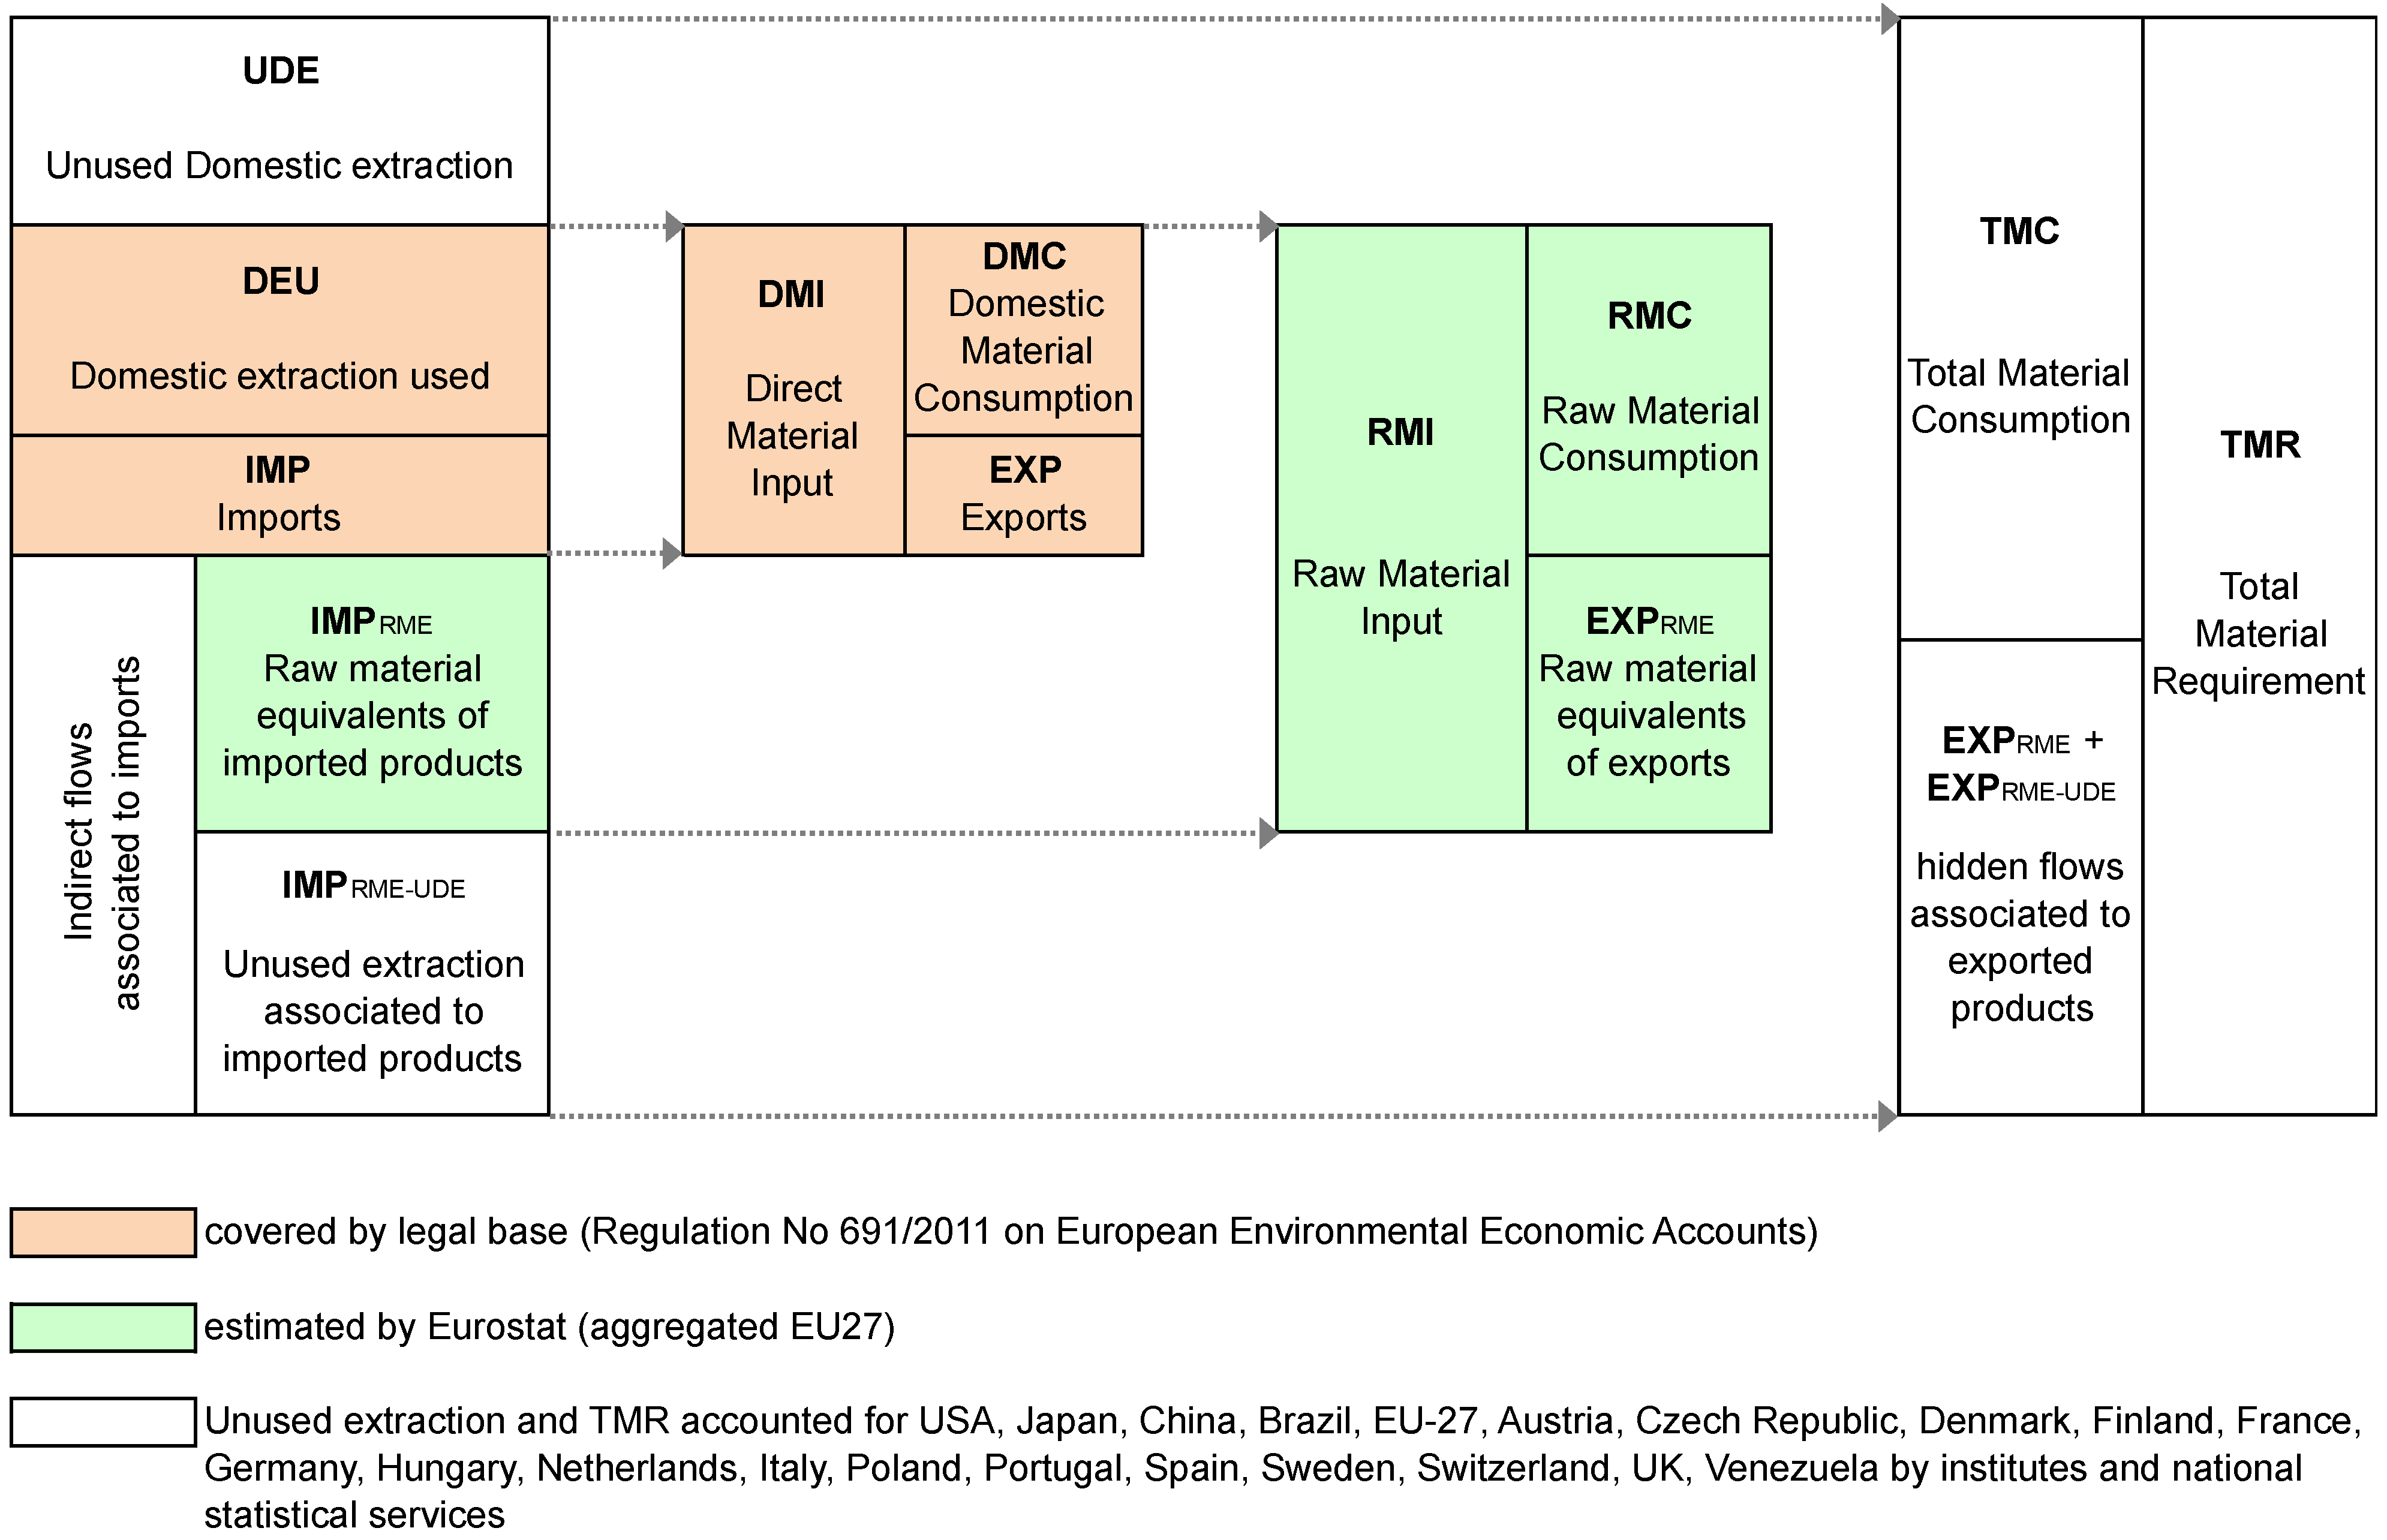
  • direct material flows (used extraction and flows crossing the country border);
  • raw material flows (used extraction within the country and upstream (indirect or upstream flows comprise the material flows from resource extraction to the border of the importing or exporting country along the whole production chain));
  • total material flows (used and unused extraction within the country and upstream).
Accordingly, there are three nested input-based flow indicators (Figure 2): (1) Direct Material Input (DMI) comprises domestic used extraction and the amount of imports; (2) Raw Material Input (RMI) comprises DMI plus indirect (upstream) flows of used extraction; and (3) Total Material Requirement comprises RMI plus unused domestic and foreign extraction. These input flows serve as material basis of the production of a country (including the manufacturing of exports), and related to GDP (as nominator) material, raw material and total material productivity can be calculated. For instance, the policy target in Japan is based on GDP/RMI [3].
For all three input indicators, the consumption oriented perspective can be determined by subtracting the exports (and their indirect flows, without or including unused extraction, resp.), resulting in Domestic Material Consumption (DMC), Raw Material Consumption (RMC), and Total Material Consumption (TMC).
Meanwhile, direct material flows are regularly reported for EU [74], OECD and BRICCS countries [75] countries. Statistical offices are working to cover also raw material flows (e.g., Eurostat [76]), while total material flows are still subject to singular reports (e.g., EEA [39]). The demand for those indicators is further triggered by high level policy makers, e.g., EREP [77] requesting the EU to increase their raw material productivity (GDP/RMC) from 2008 to 2030 by at least 30%. Any policy goal and its targets for material resource flows depends on how the indicators can be interpreted.
Figure 2. Overview scheme of economy-wide material flow indicators (after [76]).
Resources 04 00025 g002
For the interpretation of the indicators it is important to consider the system boundary, which differs between the indicators. DMI cuts at the political border, aggregating raw materials (used extraction) and semi- and final products imported, totally neglecting upstream flows. As a result, shifts from national to foreign resources may be overlooked when relying on this indicator.
RMI (and RMC) account for used extraction directly or indirectly linked to the domestic economy. Used extraction means the amount of ores, minerals or harvest sold by mining, quarrying, farms, foresters or fisheries for further processing in downstream industries. Those activities are characterized by processes which separate the desired used extraction from the “unused extraction”, i.e., the undesired material which becomes mining waste such as over and interburden, concentration waste, or cuttings which remain on the agricultural field or in the forest and the by-catch which is thrown back into the sea (while being killed).
The question of whether unused extraction should be accounted for, and if so, aggregated together with used extraction into one indicator, has been a matter of intensive discussion since the first conceptual design of indicators such as TMR, formerly called Total Material Input [78]. It seems important to note that there is no single solution which is either right or wrong, rather it depends on the target question and whether one or the other category shall be accounted for within the headline indicator.
If one is interested in the input into the primary sector, the primary materials moved out of their natural setting need to be accounted for, i.e., the total material requirement or the primary material input, measured by the TMR indicator. As RMI is economically defined, it may be interpreted as an indicator of economic use of (or dependence on) natural material resources. In contrast, TMR signals the overall magnitude of resource extraction from the environment which stands for a generic pressure associated with bundles of specific impacts and determined by the turnover of those flows within a given environment. The magnitude of landscape changes by mining, the interference with hydrology, the volume of production and after consumption wastes and emissions are all growing by and large with the magnitude of TMR. This magnitude is to a certain extent independent from the chemical composition of the extracted material. For instance, the extraction of a tonne of sand may have equal relevance to the extraction of a tonne of crushed stone or a tonne of copper ore, depending on the natural landscape where those masses are moved, thereby destroying vegetation and soils, expelling animals, changing water courses, etc.
For the further considerations of global resource flow management, country borders will be neglected, so that technically input and consumption indicators become identical. Nevertheless, it seems important to distinguish biotic and abiotic resource flows (Figure 3). Understanding this material flow system implies that monitoring devices indicate the throughput at certain points (the material flow indicators), and that policy instruments can regulate this throughput (mainly indirectly by influencing production and consumption patterns) while monitoring their effectiveness. Depending on which indicator is used as a “target valve”, side streams may be induced, if essential flow positions are not covered.
Direct material flow and raw material flow indicators monitor both biotic and abiotic used extraction. Measuring the combined flows at point (1), e.g., by RMI or RMC, could fail to see shifts between biotic and abiotic flows, and increasing amounts of unused extraction. While used and unused extraction are often technologically linked, this is not the case for abiotic extraction of mining and quarrying vs. the excavation for infrastructure building and maintenance, although the environmental impacts may be quite similar. For instance, based on given technology and geological conditions, the unused extraction of mining grows with the used extraction. In contrast, the excavation of earth for building road dams, for foundations of buildings, for laying water pipes, drilling tunnels, terrassing landscapes, and building artificial islands depends more on the status of infrastructure development. Nevertheless, the impacts due to landscape changes and mass translocations use to be similar in mining (and quarrying) and infrastructure excavation.
Figure 3. Simplified scheme of the socio-industrial metabolism, distinguishing biotic and abiotic resource flows. Indicators monitoring the flows at potential valve positions are numbered. See text. Note: “Abiotic resources used” comprises fossil fuels, metals, and industrial and construction minerals. “Unused abiotic resource extraction” contains the part of total extraction of primary material during mining and quarrying which is left aside. “Excavation” accounts for the earth and soil extraction and movement for road and building construction (dams, foundation pits, etc.). These resource flows altogether determine the pressure of landscape changes and associated impacts by mineral extraction. “Biotic resources used” represent the harvest and use of primary biomass in agriculture, forestry and fisheries. “Unused biotic resources” comprise cuttings left on the ground, or by-catch. With a given structure between bio-based sectors, production technologies, and land use pattern, these resource flows determine the bundle of specific environmental pressures by biomass harvest and use.
Resources 04 00025 g003
Therefore, it might be appropriate to measure also the total minerals extraction, both used and unused, including excavation at point (2) by TMCabiot. At the same time, it seems appropriate to monitor TMCbiot for the total biotic extraction or harvest (by agriculture, forestry and fisheries; indicated at 3a) , as long as there are relevant differences to the used biotic input which could otherwise measured at point 3b.
Thus, the flow system and its potential monitoring valves are known. The next question is about the target levels of those flows.

5. Potential Targets

5.1. Existing Target Setting Proposals for Minerals and Biomass Extraction

After the first proposal of Schmidt-Bleek targetting human induced resource flows, various targets have been suggested which by and large applied a similar rationale, although based on different indicators (Table 1). In its study “Sustainable Germany” the Wuppertal Institute [26,79] adopted the basic rationale of Schmidt-Bleek and suggested a reduction of the total material consumption by 80%–90% between 1995 and 2050 as a target which ought to be reached by a significant increase in the total material resource productivity. Considering basically different challenges of biomass vs. mineral resource use, [27] argued that the former may be targeted by land use based parameters while the latter might be targeted by material flow based indicators. If Schmidt-Bleek’s rationale were adopted, this would result in 5.6–6.1 tonnes per person TMCabiot as a long-term target (excluding biomass and erosion, including used and unused extraction of fossil fuels, metals, industrial and construction minerals as well as excavation). In view of the ongoing continuous increase of global resource extraction, the mineral extraction reached by developing countries and their need to further develop their infrastructure, Bringezu [80] concluded that it would already be a challenge to return to the level of global resource extraction of 2000, and for that purpose suggested a target of 10 tonnes per person TMCabiot for the EU. Bio Intelligence Services et al. [81] in a study for the EU Commission, proposed targets based on DMC, suggesting 5 t/person DMC as target for 2050. The components of the DMC are differentiated, and the consumption of biomass (based year 2005) is not targeted for reduction but a stabilization, while the mineral components of DMC (metals, construction and industrial minerals, and fossil fuels) are meant to be reduced by differentiated targets in the range of 50%–95%.
In a study for UNIDO and others, Dittrich et al. [20] formulated global targets for the sum of used extraction of biomass and minerals, which on a worldwide level equals both DMC and RMI. They suggest limiting global used extraction to 50 billion tonnes. Based on the variation of national DMC accounts the authors select “best practice” consumption levels for the main material components of DMC. Assuming that other countries could adopt those low levels of the target category without additional needs of other resources, they differentiate DMC targets per person for biomass, fossil fuels, metals and non-metallic minerals, which sum up to 8 t/person DMC.
Lettenmeier et al. [15] studied the TMR for consumption in Finnish households. They analyzed the total material requirements for the areas of final demand such as food, housing and mobility. Selecting “best practices” of those households in terms of low resource consumption they suggest a long-term target of 8 tonnes/person TMC (= TMR of domestic consumption).
Although both Dittrich et al. [20] and Lettenmeier et al. [15] arrive at the identical value of 8 tonnes per person, the requirements for reduction differ at least by a factor of 2 due to the different target indicators.
Table 1. Target proposals for material resource consumption of earlier studies following Schmidt-Bleek [56,57].
AuthorsSpatial ScopeResource Group or Field of Final DemandTargets (Short to mid-Term)Target Year (Short to mid-Term)Targets (Long-Term)Target Year (Long-Term)IndicatorsBase Year
Wuppertal Institute (2008) [26,79]GermanyPrimary Material Consumptionminus 25%2010minus 80%–90%2050TMC1995
Fossil fuelsminus 25%2010minus 80%–90%2050Energy consumption1995
Material resource productivity+4% to +6% p.a.2010 GDP/TMR1995
Bringezu (2009, 2011) [27,80]EuropeAbiotic materials (used and unused) 10 t/cap2050–2100TMCabiot2000
Net addition to stock02050–2100NAS2000
BIO Intelligence et al. (2012) [81]EUDMC11 t/cap (minus 30%)20205 t/cap (minus 70%)2050DMC2005
biomassplus/minus 0%2020plus/minus 0%2050DMC2005
fossil fuelsminus 30%2020minus 90%2050DMC2005
mineralsminus 50%2020minus 85%2050DMC2005
metalsminus 20%2020minus 50%2050DMC2005
EMC> minus 30%2020> minus 70%2050EMC2005
Dittrich, Giljum et al. (2012) [20]GlobalDMC, “freezing” a base year level50 billion tonnes203050 billion tonnes2050DMC2000 level
Suggested target: 8 t/cap2030 DMC
Based on current best practices of countries (10 t/cap):
biomassca. 2.2 t/cap DMC2008
fossil fuels2–2.5 t/cap DMC2008
minerals4–5 t/cap DMC2008
metals0.8 t/cap DMC2008
Lettenmeier et al. (2014) [15]FinlandMaterial footprint (TMR) * 8 t/cap2050TMR
Suggested cap for final demand:
food 3 t/cap2050TMR
housing 1.6 t/cap2050TMR
mobility 2 t/cap2050TMR
product consumption 0.5 t/cap2050TMR
leisure time 0.5 t/cap2050TMR
others 0.4 t/cap2050TMR
Note: * the authors address TMR which on a product and consumption level is identical with Total Material Consumption (TMC).

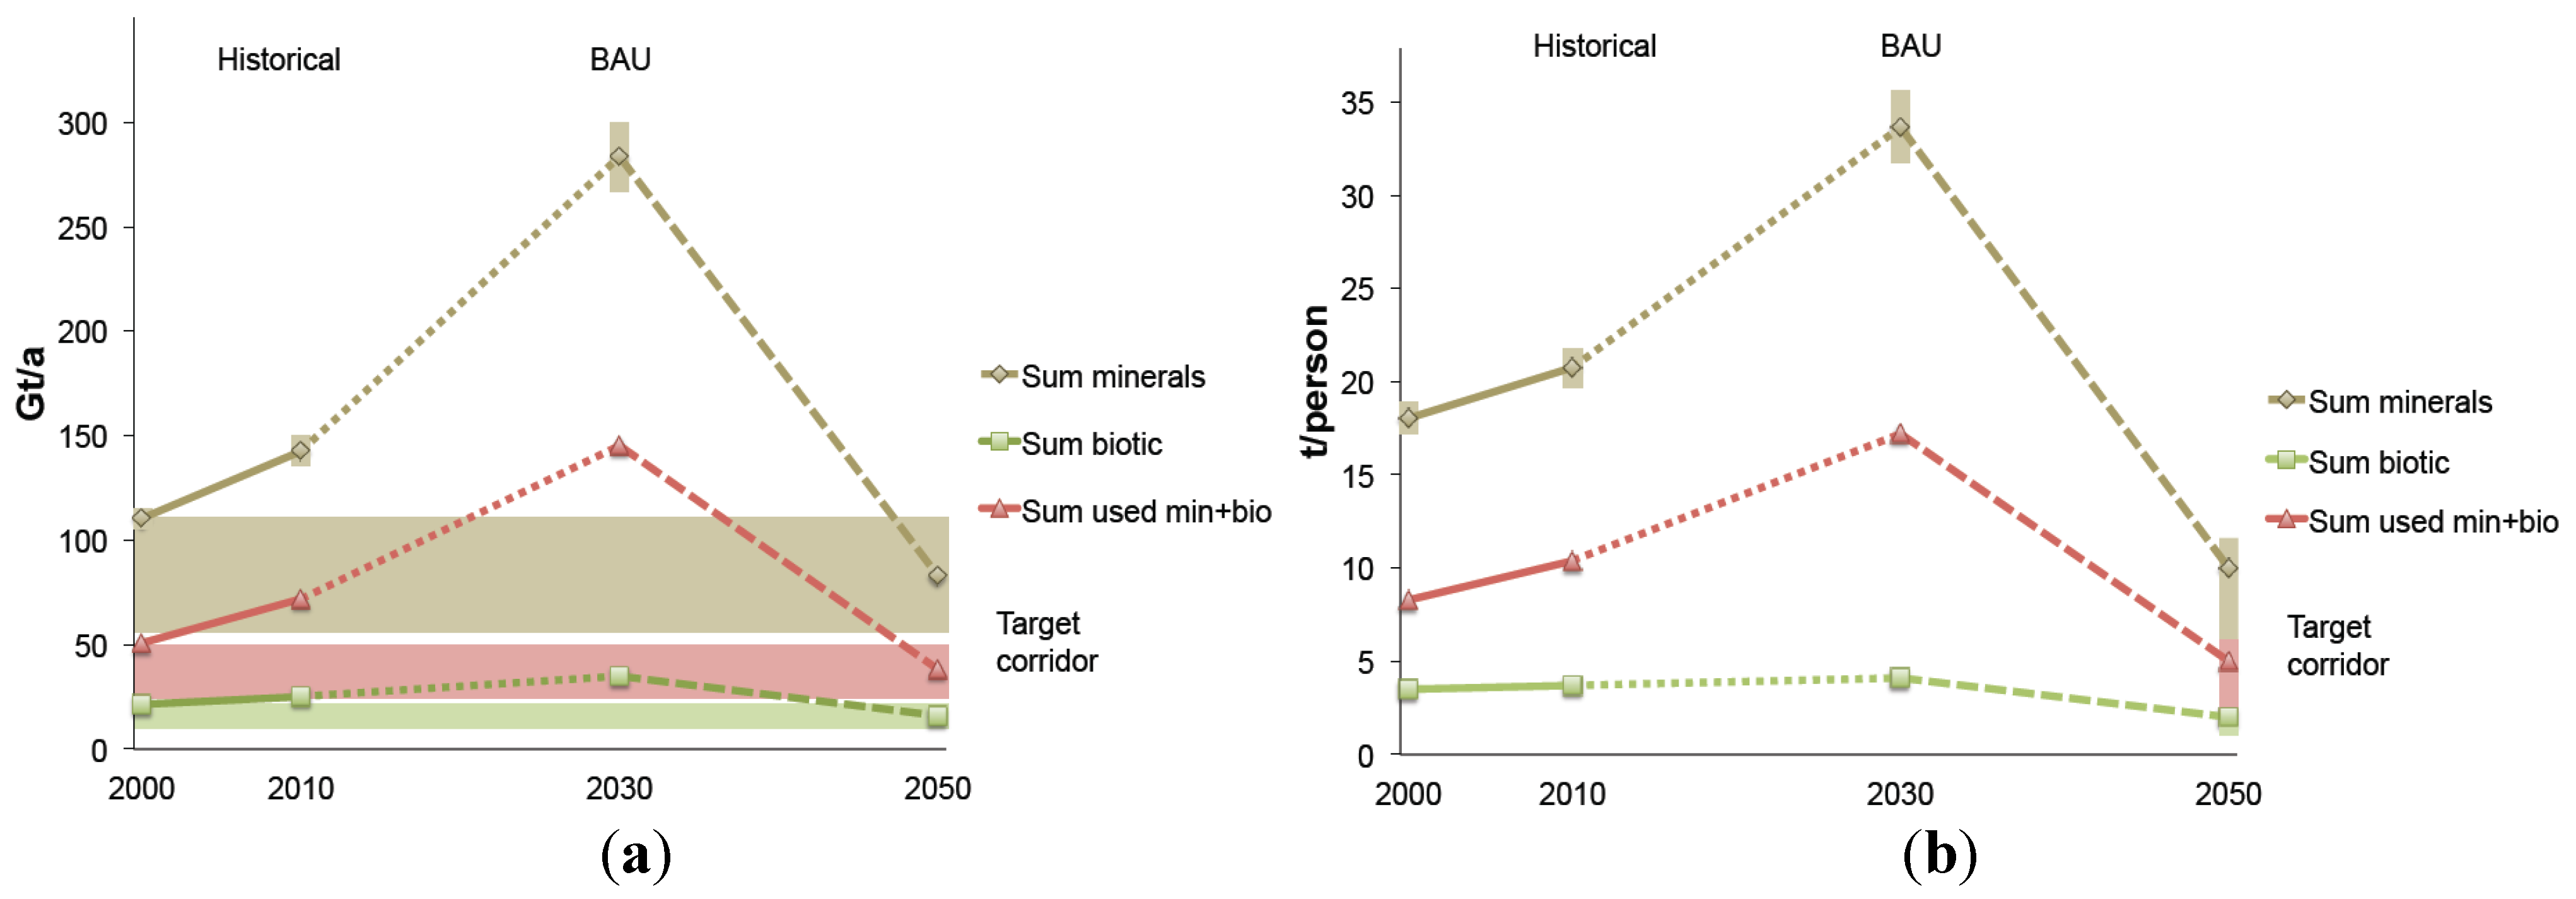
5.2. Outlining a Safe Corridor of Minerals and Biomass Extraction and Use

Against that background, and drawing from the earlier suggestions, a potential target corridor shall be addressed. The potential target range is basically determined by the proposal of Schmidt-Bleek [57,58] to half the global resource consumption (resulting in a low target value), and the suggestion to return to the level of 2000 (resulting in a high target value). There is still no hard scientific evidence of causal relationship between human-induced resource flows and the possible breakdown of life-supporting functions at continental or global scale from which those targets could directly be derived. The basic rationale still remains precautionary in the sense that bundles of environmental and subsequently social stress associated with those material flows from extraction to final disposal which exert their pressure at various locations should be limited. If—void of better alternatives—one accepts the approach of setting such targets rather arbitrarily, while considering past experience and available knowledge, the question is which targets for resource use could be defined in a sensible way. In search of a safe corridor, it will be elucidated whether a combined target for abiotic and biotic resources can be defined reasonably, or whether those resource flows should be treated separately, and which set of targets would be adequate to control the key valves of the metabolic system as discussed above in Figure 3.
As a reference for global resource extraction and use, 2000 is taken as the base year, the values for 2010 and for an estimated BAU trend until 2030 are provided for comparison (Table 2, Figure 4).
The data for recent years on abiotic and biotic extraction (used and unused) are taken from the materialflows.net database [68]. The order of magnitude of global excavation was estimated to range from 40 to 50 Gt in 2000. This was derived from 2.3 t/person in EU-27 [82], 9.4 t/person in Japan (the 1994 value provided by [37]), and 14.1 t/person in the USA [83]; these data were used to calculate a weighted mean for the OECD which resulted in 8.15 Gt. In China, excavation was determined with 26.08 Gt in 2000, corresponding to 20.7 t/person [84]. If one assumes that the rest of the world ranged between 2.0 and 4.6 t/person the calculation will result in a global total excavation between 41.6 Gt and 51.1 Gt [85]. Therefore, 40–50 Gt excavation were used as base level in 2000. Excavation after 2000 was estimated with values for OECD and China assumed constant (the available time series for Germany and China until 2010 and 2008, resp., indicated a constant trend), while for the rest of the world growth rates for both low and high base levels were adopted from abiotic used extraction. Erosion was not included in the further considerations due to the insufficient data base.
In 2000, total mineral extraction amounted to 105–115 Gt, exceeding three times the used abiotic extraction of 34 Gt. The relation of used abiotic to used biotic extraction was about 2:1, while the relation of total minerals to total biomass was 5:1. The sum of used abiotic and biotic extraction was 51 Gt. From 2000 to 2010, the global material flows have already increased significantly; used abiotic extraction grew by 54%, used biotic by 16%.
Business-as-usual data for 2030 were derived from [20]. Their projection started in 2010. Recent data for that year (as shown in the table) exhibit only 87% of the projected level, so that an even steeper increase would be assumed if their estimate for 2030 were adopted which was based on the assumption that the world until then would have reached the mean OECD level. Here it is assumed that by 2030 the world may have adopted 90% of the mean OECD level under business-as-usual conditions.
Table 2. Global development of raw and total material flows and potential target ranges.
200020102030 BAU trend2050Change required for 2030 BAU (%)
PopulationReturn to 2000 levelHalf 2000 level
high targetlow targethigh targetlow target
[Gt]
Abiotic extraction used33.851.9117.5 33.816.9−71−86
Abiotic extraction unused31.740.892.3 31.715.8−66−83
Excavation40 to 5043 to 5757 to 90 45.022.5−21 to −50−61 to −75
Sum minerals105 to 115135 to 150267 to 300 110.455.2−63−79
Biotic used17.119.927.7 17.18.5−38−69
Biotic unused4.35.27.2 4.32.1−41−70
Sum biotic21.325.234.9 21.310.7−39−69
Sum used min+bio50.871.8145.2 50.825.4−65−83
Sum total127 to 137160 to 175302 to 335 136.765.9−59−78
[109]6.126.888.429.55Medium projection
[t/Person]
Abiotic extraction used5.57.514.0 3.51.8−75−87
Abiotic extraction unused5.25.911.0 3.31.7−70−85
Excavation6.5 to 8.26.2 to 8.36.8 to 10.7 4.72.4−30−65
Sum minerals: Abiotic plus excavation17.2 to 18.919.7 to 21.831.7 to 35.6 11.65.8−68−82
Biotic used2.82.93.3 1.80.9−46−73
Biotic unused0.70.80.9 0.40.2−48−74
Sum biotic3.53.74.1 2.21.1−46−73
Sum used min+bio8.310.417.2 5.32.7−69−85
Sum total20.7 to 22.323.3 to 25.535.8 to 39.8 14.36.9−64−81
10.9High projection
[t/Person]
Abiotic extraction used 3.11.6
Sum minerals: Abiotic plus excavation 10.25.1
Biotic used 1.60.8
Sum biotic 2.01.0
Sum used min+bio 4.72.3
Sum total 12.66.1
8.34Low projection
[t/Person]
Abiotic extraction used 4.02.0
Sum minerals: Abiotic plus excavation 13.26.6
Biotic used 2.01.0
Sum biotic 2.61.3
Sum used min+bio 6.13.0
Sum total 16.47.9
Figure 4. Overview of global resource flows since 2000, business-as-usual trend until 2030 and potential target corridor until 2050: absolute amounts (a) and per person (b). Values from Table 2.
Resources 04 00025 g004
In order to delineate potential target ranges for 2050, a high target was defined as equal to the level of 2000, while the low target was half of it. The major challenge of change towards this potential target corridor is the rapid growth since 2000 and the expected increase in the coming decades.
Comparing the projected BAU 2030 level with the potential target range of 2050 indicates requirements of reductions between 71% and 86% for used abiotic extraction, and 63%–79% for total minerals extraction. In contrast, biomass used and total biomass extraction would need to be reduced only by about 39%–70%. The reason for the significant difference is the ongoing much higher growth for abiotic resource use compared to biomass.
The challenges of reduction towards more sustainable levels grow further when aiming at a fair distribution amongst the increasing world population. Based on per person global average values, abiotic used extraction in 2030 would need to be reduced 75%–87% to reach the potential target corridor. Similar reductions of factor 4 to 10 would be required for total minerals extraction, though a bit lower. For biotic resources, used and total, “only” 46%–73% would need to be reduced.
The question arises as to whether it would make sense to reduce the biotic resource extraction per person to one-third of the 2000 level, as implied by the potential low target level. The supply of food dominates the biotic resource flows. Around one-third of edible food is lost or wasted globally and could be “saved” by improving supply chains and changing food waste behaviors [86]. At the same time, final demand for food might grow 1.5 times with the world population from 2000 to 2050. Accordingly, halving the absolute level of 2000 seems questionable; instead, as BioIntelligence et al. [81] have suggested for direct material flows, a rather constant absolute amount of biotic resource flows may be targeted. Equally distributed this would be around 2 t/person TMCbiot (comprising both used and unused, food and non-food biomass, with used food dominating, timber representing about 10%–15% [87]). This would be valid for low to high population projections.
For mineral resource flows, the target corridor between low and high level would range between 6 and 12 t/person TMCabiot (comprising both used and unused abiotic extraction and excavation), when considering also the variation of population projections. On the one hand, the lower end level would correspond to the goal that human-induced (mineral) flows should not exceed (somehow comparable) natural flows more than twice (when considering continental input by volcanoes) and less than 30 times (when considering only extrusive magma formation). On the other hand, the higher end level would reflect that due to the high growth of mineral extraction after 2000 it would be already an enormous challenge to return to that level. Correspondingly, the reduction corridor would range between a factor 4 and 10 (meaning a reduction towards one forth to one tenth).
Total material flows depend both on the consumption of manufactured products and conditions in the primary sectors (e.g., technology and geologic conditions determining the ratio of used to unused extraction) and–for total minerals flows–also on the infrastructure and building activities (determining excavation). In contrast, raw material flows (used abiotic and biotic extraction) on the demand side are only determined by the factors influencing manufacturing and final consumption. While data on total material flows are literally farther away from the users, data on direct material flows and raw material flows (at the global level identical) are closer and more easily available. Therefore, there is also an interest to provide orientation targets for Raw Material Consumption (RMC) or Raw Material Input (RMI), which are identical at the global level.
As discussed above, for 2050, the used biomass may not be targeted below the high level per person in Table 2, which at a rounded one digit value would be 2 t/person (same order of magnitude as total biomass extracted). Considering the potential target range of used abiotic resources and possible variation of the world population, the sum of used raw materials would range 3–6 t/person RMC.
The aggregation of different resource flows, in particular mineral and biomass flows, into joint targets, should be treated with caution. On the one hand, the aggregation assumes substitutability between its components; and the option to substitute biomass for minerals had been one original idea to define indicators such as the TMR at the beginning of the 1990s. On the other hand, it has become clear in the recent twenty years, that, as described earlier, the extraction of biomass has already surpassed thresholds of a safe operating space globally; therefore, indicators and targets should be designed in a way that such a substitution is not further incentivized, and an increase in the level of global biomass use is avoided.
In terms of environmental impact one could argue that one ton of biomass saved is more worth than one ton of minerals saved, in particular when considering impacts on biodiversity through land use change. This is another reason why the material flow targets should be complemented by land use targets.
Nevertheless, a combination of mineral and biomass resource flows into one target value would have the advantage of more easy communication, and in terms of productivity indicators (such as GDP/RMI, GDP/TMR) would carry an important message: both the use of minerals and biomass must become much more efficient and productive, if the corridor of more sustainable resource use shall be reached.
Orientation towards more sustainable resource use requires reference levels of absolute resource consumption. Table 3 summarizes the potential material flow based target ranges per person for 2050.
For communication purposes, it is often much easier to convey concrete target values rather than target ranges, which are scientifically more correct, but imply uncertainty which may lower incentives for actors adopting it as a target. At the same time, it seems more important to induce appropriate change measures in practice by providing long-term orientation, than to determine conditions and values for the future with higher precision but no induced action, provided the direction of change is signaled in the right way.
Table 3. Summary of possible target corridor of sustainable global resource flows and suggested targets for communication (target year 2050).
IndicatorPotential Sustainability Range (t/Person)Possible Policy Target (t/Person)
TMCabiot6–1210
TMCbiot22
RMC3–65
Therefore, and also considering some priorities, the ranges in Table 3 are also supplemented by potential concrete policy targets. Resource use in 2050 could become safer and fairer, when following the “10-2-5 target triplet” as a rule of thumb: TMCabiot should not exceed 10 t/person, TMCbiot 2 t/person, and RMC should be kept within 5 t/person. Those concrete values would keep the relation of 10:2 between TMCabiot and TMCbiot as of 2000, and thus avoid a further shift to overuse biomass. The 10 t/person TMCabiot would still lead to a lower level of global mineral extraction than in 2000, but keep the challenge more manageable. Choosing the higher end of the corridor for RMC also intends to be more realistic, and to keep the implicit relation of the contained biomass and minerals at least somehow within balance.

6. Discussion

The combination of the three flow based indicators might provide better guidance than a single indicator. RMC is regularly monitored at the global level (materialflows.net), and is going to be recorded regularly also by statistical offices in a growing number of countries. When TMCabiot and TMCbiot are addressed as target indicators and requested by policy makers, then statistics will strengthen their efforts to monitor also unused extraction and excavation. If those parameters are not at least recorded in longer time intervals (say 5 years), the risk would grow that a reduction of used raw materials consumption may be compensated by a growth of those “ecological rucksacks”. Undesired side-streams may be the consequence (see Figure 2).
The outlined potential target corridor would be compatible with–but not substitutable for–other targets such as the long-term reduction of greenhouse gas emissions. Fossil fuels constitute an essential component of used mineral extraction which as an aggregate would be targeted to reduce by 75%–87%. This could go hand in hand with a 90% reduction of fossil based carbon dioxide emissions [27], when efficiency increases and savings of energy resources are combined with a shift, for instance, from coal to less resource and emission intensive energy carriers such as natural gas [88]. Moreover, the transition towards a climate friendly energy system could be combined with are more resource efficient production and consumption system. Regarding potential targets to reduce nutrient pollution, in particular by active nitrogen, the suggested target level of 2 t/person TMCbiot would also contribute to limit the need to use fertlizer. In contrast, an orientation only towards climate protection and nutrient pollution control would not suffice to keep the whole bundles of impacts of abiotic and biotic resource flows low level, and might be prone to various problem shifts.
Regarding feasibility of reaching those potential targets, Lettenmeier et al. [15] have shown that some Finnish households can cope with 8 t/person TMR (in this case equal to TMC) which comprises both abiotic and biotic primary extraction so that 10 t/person TMCabiot should be no problem for comparable conditions. However, one must be careful in the interpretation of the data of those resource light households with current technologies may represent relatively poor households and uncomfortable living conditions within their country. Nevertheless, when considering technological progress towards higher resource efficiency, the order of magnitude of 10 t/person TMCabiot seems within reach.
In a similar vein, as Dittrich et al. [20] have argued certain countries can already manage with 2 t/person direct biomass use. The sum of DMC for those countries still amounts to 10 t/person, indicating a challenge of a factor 2 in particular for the abiotic part of DMC also for those countries.
For EU member countries, Meyer et al. [89] modelled the impact of a policy mix which could significantly increase total material productivity, and reduce TMC by about a quarter within 20 years. Further research towards this end is ongoing in various projects.
The acceptance of such targets might grow in the future. Few countries will remain net exporters, while most countries will become net importers of natural resources [20]. While the former will learn how to become more independent from those exports and develop their own economy, the latter have a growing interest to become independent of foreign supply, develop the circular economy and increase resource efficiency. Some of these countries like Japan and Germany have started to develop policies to enhance resource productivity. With increasing use of natural resources, the number of socio-environmental conflicts will grow. Monitoring such conflicts, for instance by the Ejolt project (http://www.ejolt.org), reveals that many if not most of them are associated with human induced material flows, starting with mining and quarrying and refining of abiotic resources, or with biomass and land use conflicts, up to waste management issues. The domestic TMR per person declines with growing population density of countries [90] indicating that in particular mining and quarrying is evading social conflicts and preferring less populated areas for resource extraction. In Germany, in the past 60–80 years, 75,000 people were resettled to get access to brown coal fields [91]. In the future, this will be no longer acceptable to the domestic population. Coal and other resources are increasingly being imported.
It seems only a matter of time before the currently or potentially conflicting interests in the supplying regions become more obvious. As the world is getting “fuller”, this might enhance the acceptance of targets for natural resource use in order to mitigate the potential of socio-environmental conflicts.

7. Conclusions

This article started to observe that, in the context of the SDGs and for orientation of national and regional governments, the question arises how progress towards an efficient, environmentally safe and socially fair use of global resources can be measured. From a systems perspective on the socio-industrial metabolism, the various bundles of environmental pressure associated with human induced material flows—from resource extraction to final disposal—could be lowered to acceptable levels by a reduction of primary input. The arguments reflected how an acceptable or safe operating level of global resource flows could be delineated. Different criteria need to be considered for biomass and mineral resource flows.
A central question was to which extent existing, economy-wide material flow indicators can be used for target setting on global resource use. Earlier suggestions towards this end were reviewed, partially re-visited and employed to outline potentially sustainable levels of biomass and mineral resource use. Both the need to limit environmental burden and the basic feasibility of targets were considered.
Altogether, one may conclude that the potential safe operating space of global resource use may be better described by a range of target values (or a “corridor”), which may also serve as basis for further delineation and critique by research, although for communication purposes concrete target values would be preferable. In 2050, the potential sustainable corridor for total minerals resource flows could range between half and full of the absolute global level in 2000, distributed equally among the future population, i.e., 6–12 t/person TMCabiot. For biotic resource flows, which are dominated by food, a reduction below the level of 2000 seems hardly possible, which for a population in 2050 would mean 2 t/person TMCbiot (same value for used biomass). For used minerals and biomass extraction, the sustainability range could be around 3–6 t/person RMC in 2050. Policies could pursue the “10-2-5 target triplet”: 10 t/person TMCabiot, 2 t/person TMCbiot, and 5 t/person RMC could be used for long-term orientation towards 2050. These values and their relations have been derived also to reduce the risks by substituting biomass for minerals. The target corridor on material resource consumption would be compatible with as well as complementary to other, substance specific targets on climate protection and nutrient pollution control.

Acknowledgments

The author is grateful for constructive comments of the reviewers, for suggestions and proof reading by Meghan O’Brien who improved the manuscript significantly. He also thanks Stefan Giljum and his team for providing the data of the BAU scenario of [12] and the biomass subcategories of www.materialflows.net.

Conflicts of Interest

The author declares no conflict of interest.

References and Notes

  1. DESTATIS Federal Statistical Office. Sustainable Development in Germany. Indicator Report 2014; DESTATIS Federal Statistical Office: Wiesbaden, Germany, 2014. Available online: https://www.destatis.de/EN/Publications/Specialized/EnvironmentalEconomicAccounting/Indicators2014.pdf?__blob=publicationFile (accessed on 6 February 2015).
  2. BMU-German Ministry for Environment, Nature and Nuclear Safety. Deutsches Ressourceneffizienzprogramm (ProgRess). In Programm zur nachhaltigen Nutzung und zum Schutz der Natürlichen Ressourcen (German Resource Efficiency Programme (ProgRess). Programme for Sustainable Use and Protection of Natural Resources). Beschluss des Bundeskabinetts vom 29.2.2012; Bundesministerium für Umwelt, Naturschutz und Reaktorsicherheit: Berlin, Germany, 2012. [Google Scholar]
  3. Ministry of the Environment, Government of Japan. Fundamental Plan for Establishing a Sound Material-Cycle Society (Tentative Translation by Ministry of the Environment). Available online: http://www.env.go.jp/en/recycle/smcs/2nd-f_plan.pdf (accessed on 26 March 2013).
  4. European Commission. Thematic Strategy on the Sustainable Use of Natural Resources; (COM (2005) 670 final); European Commission: Brussels, Belgium, 2005. [Google Scholar]
  5. European Commission. Communication from the Commission to the European Parliament, the Council, the European Economic and Social Committee and the Committee of the Regions. Roadmap to a Resource Efficient Europe; (COM (2011) 571 final); European Commission: Brussels, Belgium, 2011. [Google Scholar]
  6. European Commission. Commission Staff Working Paper: Analysis Associated with the Roadmap to a Resource Efficient Europe-Part II; Accompanying the Document Communication from the Commission to the European Parliament, the Council, the European Economic and Social Committee and the Committee of the Regions: Roadmap to a Resource Efficient Europe; (COM(2011) 571 final)/(SEC(2011) 1068 final); European Commission: Brussels, Belgium, 2011. [Google Scholar]
  7. European Commission. General Union Environment Action Programme to 2020 Living Well, within the Limits of Our Planet; Publications Office: Luxembourg, Luxembourg, 2014. [Google Scholar]
  8. Bahn-Walkowiak, B.; Steger, S. Politische und rechtliche Ansätze für inputorientierte Ressourcenziele in Europa und weltweit. Available online: http://edocs.fu-berlin.de/docs/servlets/MCRFileNodeServlet/FUDOCS_derivate_000000003554/Polress_AP1-AS1.1_xbersichtxRessourcenzielexEuropaxundxweltweit_FINAL.pdf?hosts= (accessed on 6 February 2015).
  9. Eurostat. Economy-Wide Material Flow Accounts and Derived Indicators—A Methodological Guide; Office for Official Publications of the European Communities: Luxembourg, Luxembourg, 2001. [Google Scholar]
  10. Eurostat. Economy Wide Material Flow Accounts: Compilation Guidelines for Reporting to the 2009 Eurostat Questionnaire; Version 01; Office for Official Publications of the European Communities: Luxembourg, Luxembourg, 2009. [Google Scholar]
  11. Eurostat. Economy-wide Material Flow Accounts (EW-MFA). Compilation Guide 2012; Office for Official Publications of the European Communities: Luxembourg, Luxembourg, 2012. [Google Scholar]
  12. OECD. Measuring Material Flows and Resource Productivity; OECD Publishing: Paris, France, 2008. [Google Scholar]
  13. Friends of the Earth—Four Footprints Briefing. Available online: https://www.foe.co.uk/sites/default/files/downloads/four-footprints-45569.pdf (accessed on 6 February 2015).
  14. Wiedmann, T.O.; Schandl, H.; Lenzen, M.; Moran, D.; Suh, S.; West, J.; Kanemoto, K. The material footprint of nations. PNAS 2013. [Google Scholar] [CrossRef]
  15. Lettenmeier, M.; Liedtke, C.; Rohn, H. Eight Tons of Material Footprint—Suggestion for a Resource Cap for Household Consumption in Finland. Resources 2014, 3, 488–515. [Google Scholar] [CrossRef]
  16. Hertwich, E.G.; Peters, G.P. Carbon Footprint of Nations: A Global, Trade-linked Analysis. Environ. Sci. Technol. 2009, 43, 6414–6420. [Google Scholar] [CrossRef] [PubMed]
  17. McGlade, J.; Werner, B.; Young, M.; Matlock, M.; Jefferies, D.; Sonnemann, G.; Aldaya, M.; Pfister, S.; Berger, M.; Farell, C.; et al. Measuring Water Use in a Green Economy. A Report of the Working Group on Water Efficiency to the International Resource Panel. Available online: http://www.unep.org/resourcepanel/Portals/50244/publications/Measuring_Water.pdf (accessed on 6 February 2015).
  18. Bringezu, S.; O’Brien, M.; Schütz, H. Beyond biofuels: Assessing global land use for domestic consumption of biomass–A conceptual and empirical contribution to sustainable management of global resources. Land Use Policy 2012, 29, 224–232. [Google Scholar] [CrossRef]
  19. Fischer-Kowalski, M.; Swilling, M.; von Weizsäcker, E.U.; Ren, Y.; Moriguchi, Y.; Crane, W.; Krausmann, F.; Eisenmenger, N.; Giljum, S.; Hennicke, P.; et al. Decoupling Natural Resource Use and Environmental Impacts from Economic Growth. A Report of the Working Group on Decoupling to the International Resource Panel. Available online: http://www.unep.org/resourcepanel/Portals/50244/publications/Decoupling_Report_English.pdf (accessed on 6 February 2015).
  20. Dittrich, M.; Giljum, S.; Lutter, S.; Polzin, C. Green Economies around the World? Implications of Resource Use for Development and the Environment; SERI: Vienna, Austria, 2012. [Google Scholar]
  21. Von Weizsäcker, E.U.; Aloisi de Larderel, J.; Hargroves, K.; Smith, M.H.; Enriquez Rodrigues, M.A.; Hudson, C.; Siriban Manalang, A.B.; Urama, K.; Suh, S.; Swilling, M.; et al. Decoupling 2. Technologies, Opportunities and Policy Options. A Report of the Working Group on Decoupling to the International Resource Panel. Available online: http://www.unep.org/resourcepanel/AreasofResearchPublications/AssessmentAreasReports/Decoupling/tabid/133329/Default.aspx (accessed on 6 February 2015).
  22. IRP-International Resource Panel. Managing and conserving the natural resource base for sustained economic and social development. A Reflection from the International Resource Panel on the Establishment of Sustainable Development Goals aimed at Decoupling Economic Growth from Escalating Resource Use and Environmental Degradation. Available online: http://www.unep.org/resourcepanel/Portals/50244/publications/IRP%20Think%20Piece%20Contributing%20to%20the%20SDGs%20Process.pdf (accessed on 6 February 2015).
  23. Bringezu, S.; Schütz, H.; Pengue, W.; O’Brien, M.; Garcia, F.; Sims, R.; Howarth, R.T.; Kauppi, L.; Swilling, M.; Herrick, J. Assessing Global Land Use: Balancing Consumption with Sustainable Supply. Report of the International Resource Panel. Available online: http://www.unep.org/resourcepanel/Portals/24102/PDFs//Full_Report-Assessing_Global_Land_UseEnglish_(PDF).pdf (accessed on 6 February 2015).
  24. Rockström, J.; Steffen, W.; Noone, K.; Persson, Å.; Chapin, F.S., III; Lambin, E.F.; Lenton, T.M.; Scheffer, M.; Folke, C.; Schellnhuber, H.J.; et al. A safe operating space for humanity. Nature 2009, 461, 472–475. [Google Scholar] [CrossRef]
  25. Hertwich, E.; van der Voet, E.; Suh, S.; Tukker, A.; Huijbregts, M.; Kazmierczyk, P.; Lenzen, M.; McNeely, J.; Moriguchi, Y. Assessing the Environmental Impacts of Consumption and Production: Priority Products and Materials. A Report of the Working Group on the Environmental Impacts of Products and Materials to the International Panel for Sustainable Resource Management. Available online: http://www.unep.org/resourcepanel/AreasofResearchPublications/AssessmentAreasReports/EnvironmentalImpacts/tabid/133331/Default.aspx (accessed on 6 February 2015).
  26. Wuppertal Institute. Zukunftsfähiges Deutschland (Sustainable Germany); Birkhäuser Verlag: Basel, Swiss; Boston, MA, USA; Berlin, Germany, 1996. [Google Scholar]
  27. Bringezu, S. Visions of a sustainable resource use. In Sustainable Resource Management: Global Trends, Visions and Policies; Bringezu, S., Bleischwitz, R., Eds.; Greenleaf Publishing: Sheffield, UK, 2009; pp. 155–215. [Google Scholar]
  28. Steffen, W.; Richardson, K.; Rockström, J.; Cornell, S.E.; Fetzer, I.; Bennett, E.M.; Biggs, R.; Carpenter, S.R.; de Vries, W.; de Wit, C.; et al. Planetary boundaries: Guiding human development on a changing planet. Science 2015. [Google Scholar] [CrossRef]
  29. Haberl, H.; Erb, K.H.; Krausmann, F.; Gaube, V.; Bondeau, A.; Plutzar, C.; Gingrich, S.; Lucht, W.; Fischer-Kowalski, M. Quantifying and mapping the human appropriation of net primary production in earth’s terrestrial ecosystems. PNAS 2007, 104, 12942–12947. [Google Scholar] [CrossRef] [PubMed]
  30. MEA-Millennium Ecosystem Assessment. Ecosystems and Human Well-being: Synthesis; Island Press: Washington, DC, USA, 2005. [Google Scholar]
  31. UNEP. Geo 5. Global environmental outlook. Environment for the Future We Want. 2012. Available online: http://www.unep.org/geo/geo5.asp (accessed on 6 February 2015).
  32. Townsend, A.; Howarth, R.W. Human acceleration of the global nitrogen cycle. Sci. Am. 2010, 302, 32–39. [Google Scholar] [CrossRef] [PubMed]
  33. Howarth, R.; Swaney, D.; Billen, G.; Garnier, J.; Hong, B.; Humborg, C.; Johnes, P.; Mörth, C.; Marino, R. Nitrogen fluxes from the landscape are controlled by net anthropogenic nitrogen inputs and by climate. Front. Ecol. Environ. 2012, 10, 37–43. [Google Scholar] [CrossRef]
  34. Sutton, M.A.; Bleeker, A.; Howard, C.M.; Bekunda, M.; Grizzetti, B.; de Vries, W.; van Grinsven, H.J.M.; Abrol, Y.P.; Adhya, T.K.; Billen, G.; et al. Our Nutrient World: The Challenge to Produce More Food and Energy with Less Pollution. Global Overview of Nutrient Management; Centre for Ecology and Hydrology on behalf of the Global Partnership on Nutrient Management and the International Nitrogen Initiative: Edinburgh, UK, 2013. [Google Scholar]
  35. Leach, A.M.; Galloway, J.N.; Bleeker, A.; Erisman, J.W.; Kohn, R.; Kitzes, J. A nitrogen footprint model to help consumers understand their role in nitrogen losses to the environment. Environ. Dev. 2012, 1, 40–66. [Google Scholar] [CrossRef]
  36. Schmidt-Bleek, F.; Bringezu, S.; Hinterberger, F.; Liedtke, Ch.; Spangenberg, J.; Stiller, H.; Welfens, M.J. MAIA. Einführung in die Material-Intensitätsanalyse nach dem MIPS-Konzept; Birkhäuser Verlag: Basel, Swiss; Berlin, Germany; Boston, MA, USA, 1998. [Google Scholar]
  37. Adriaanse, A.; Bringezu, S.; Hammond, A.; Moriguchi, Y.; Rodenburg, E.; Rogich, D.; Schütz, H. Resource Flows: The Material Basis of Industrial Economies; WRI: Washington, DC, USA, 1997. [Google Scholar]
  38. European Environment Agency (EEA). Environmental Signals 2000; EEA: Copenhagen, Denmark, 2000. [Google Scholar]
  39. EEA. Environmental pressures from European consumption and production. EEA Tech. Rep. 2013, 2. [Google Scholar] [CrossRef]
  40. Zah, R.; Binder, C.; Bringezu, S.; Reinhard, J.; Schmid, A.; Schütz, H. Future Perspectives of 2nd Generation Biofuels; Vdf Hochschulverlag: Zürich, Switzerland, 2010. [Google Scholar]
  41. Keledjian, A.; Brogan, G.; Lowell, B.; Warrenchuk, J.; Enticknap, B.; Shester, G.; Hirshfield, M.; Cano-Stocco, D. Wasted catch: Unsolved problems in the U.S. Fisheries. Oceana. Available online: http://oceana.org/sites/default/files/reports/Bycatch_Report_FINAL.pdf (accessed on 5 October 2014).
  42. Hilborn, R. Are Sustainable Fisheries Achievable? In Marine Conservation Biology; Norse, E.A., Crowder, L.B., Eds.; Island Press: Washington, DC, USA, 2005; pp. 247–259. [Google Scholar]
  43. Barbier, E.B. Economics, Natural Resource Scarcity and Development. In Conventional and Alternative Views; Earthscan Publications: London, UK, 1989. [Google Scholar]
  44. Daly, H.E. Towards some operational principles of sustainable development. Ecol. Econ. 1990, 2, 1–6. [Google Scholar] [CrossRef]
  45. Bringezu, S. Ressourcennnutzung in Wirtschaftsräumen (Resource Use of Economies); Springer: Berlin, Germany, 2000. [Google Scholar]
  46. NRC-National Research Council. Minerals, Critical Minerals, and the U.S. Economy; National Academies Press: Washington, DC, USA, 2008. [Google Scholar]
  47. European Commission. Report on critical raw materials for the EU: Report of the Ad hoc Working Group on defining critical raw materials European Commission. 2014. Available online: http://ec.europa.eu/enterprise/policies/raw-materials/critical/index_en.htm (accessed on 7 October 2014).
  48. Rørbech, J.T.; Vadenbo, C.; Hellweg, S.; Astrup, T.F. Impact Assessment of Abiotic Resources in LCA: Quantitative Comparison of Selected Characterization Models. Environ. Sci. Technol. 2014, 48, 11072–11081. [Google Scholar] [CrossRef] [PubMed]
  49. European Commission. ILCD Handbook: Recommendations for Life Cycle Impact Assessment in the European Context; European Commission: Luxembourg, Luxembourg, 2011. [Google Scholar]
  50. Swart, P.; Dewulf, J. Quantifying the impacts of primary metal resource use in life cycle assessment based on recent mining data. Resour. Conserv. Recycl. 2013, 73, 180–187. [Google Scholar] [CrossRef]
  51. Van der Voet, E.; Salminen, R.; Eckelman, M.; Mudd, G.; Norgate, T.; Hischier, R. Environmental Risks and Challenges of Anthropogenic Metals Flows and Cycles. A Report of the Working Group on the Global Metal Flows to the International Resource Panel. Available online: http://www.unep.org/resourcepanel/Portals/50244/publications/Environmental_Challenges_Metals-Full%20Report_150dpi_130923.pdf (accessed on 6 February 2015).
  52. Bösch, M.E.; Hellweg, S.; Huijbregts, M.A.J.; Frischknecht, R. Cumulative Exergy Demand LCA Methodology Applying Cumulative Exergy Demand (CExD) Indicators to the Ecoinvent Database. Int. J. Life Cycle Assess. 2007, 12, 181–190. [Google Scholar] [CrossRef]
  53. Ayres, R.U. Exergy flows in the economy: Efficiency and dematerialization. In A Handbook of Industrial Ecology; Ayres, R.U., Ayres, L.W., Eds.; Edward Elgar Publishing Ltd.: Cheltenham, UK, 2002; pp. 185–201. [Google Scholar]
  54. Graedel, T.E.; Barr, R.; Chandler, C.; Chase, T.; Choi, J.; Christofferson, L.; Friedlander, E.; Henly, C.; Jun, C.; Nassar, N.T.; et al. Methodology of metal criticality determination. Environ. Sci. Technol. 2012, 46, 1063–1070. [Google Scholar] [CrossRef] [PubMed]
  55. Barnosky, A.D.; Hadly, E.A.; Bascompte, J.; Berlow, E.L.; Brown, J.H.; Fortelius, M.; Getz, W.M.; Harte, J.; Hastings, A.; Marquet, P.A.; et al. Approaching a state shift in Earth’s biosphere. Nature 2012, 486, 52–58. [Google Scholar] [CrossRef] [PubMed]
  56. Schmidt-Bleek, F. Will Gemany remain a good place for Industry? The Ecological Side of the Coin’. Fres. Env. Bull. 1992, 1, 417–422. [Google Scholar]
  57. Schmidt-Bleek, F. Wieviel Umwelt braucht der Mensch? Faktor 10-das Maß für ökologisches Wirtschaften; Birkhäuser Verlag: Berlin, Germany, 1994. [Google Scholar]
  58. The International Factor 10 Club’s 2010 Declaration: A coalition of willing states needed to catalyze a ten-fold leap in energy and resource efficiency. In Proceedings of the Meeting of the Factor 10 Club, Carnoules, France, 9–12 September 2010.
  59. Bringezu, S.; Schütz, H.; Moll, S. Rationale for and Interpretation of Economy-Wide Materials Flow Analysis and Derived Indicators. J. Indust. Ecol. 2003, 7, 43–67. [Google Scholar] [CrossRef]
  60. Ekins, P.; Meyer, B.; Schmidt-Bleek, F. Reducing Resource Consumption-A Proposal for Global Resource and Environmental Policy. Available online: http://www.worldresourcesforum.org/files/file/gws-paper09-5-versionDavos.pdf (accessed on 6 February 2015).
  61. Crutzen, P.J.; Stoermer, E.F. The Anthropocene. Glob. Chang. News 2000, 41, 17–18. [Google Scholar]
  62. Steffen, W.; Grinevald, J.; Crutzen, P.; McNeill, J. The Anthropocene: Conceptual and historical perspectives. Philos. Trans. R. Soc. A 2011, 369, 842–867. [Google Scholar] [CrossRef]
  63. Syvitski, J.P.M.; Kettner, A. Sediment flux and the Anthropocene. Philos. Trans. R. S. A 2011, 369, 957–975. [Google Scholar] [CrossRef]
  64. Oppenheimer, C. Climatic, environmental and human consequences of the largest known historic eruption: Tambora volcano (Indonesia) 1815. Progress Phys. Geogr. 2003, 27, 230–259. [Google Scholar] [CrossRef]
  65. This comprises both intrusive and extrusive magma formation by subduction volcanos and continental intrashield volcanos; these flows contribute to more or less abrupt changes of landscapes in contrast to the slower tectonic movements; most of those magma flows do not reach the surface. The extrusive magma formation (with eruptions) in the terrestrial zones is only 2 Gt/a
  66. Schmincke, H.-U. Vulkanismus; Wissenschaftliche Buchgesellschaft: Darmstadt, Germany, 1986. [Google Scholar]
  67. Schmincke, H.-U. Transfer von festen, flüssigen und gasförmigen Stoffen aus Vulkanen in die Atmosphäre. Umweltwissenschaften und Schadstoff-Forschung 1993, 5, 27–44. [Google Scholar] [CrossRef]
  68. The online portal for material flow data. Available online: http://www.materialflows.net (accessed on 27 September 2014).
  69. Bührs, T. Environmental Space as a Basis for Legitimating Global Governance of Environmental Limits. Glob. Environ. Politics 2009, 9, 111–135. [Google Scholar] [CrossRef]
  70. WCED–World Commission on Environment and Development. Our Common Future; Oxford University Press: Oxford, UK, 1987. [Google Scholar]
  71. Freestone, D.; Hey, E. The Precautionary Principle and International Law: The Challenge of Implementation; Kluwer Law International: Alphen aan den Rijn, The Netherlands, 1996. [Google Scholar]
  72. Raworth, K. A safe and just space for humanity. Can we live within the doughnut? Oxfam Discuss. Pap. 2012, 8, 1–26. [Google Scholar]
  73. Contraction and Convergence. Available online: http://www.gci.org.uk/index.html (accessed on 6 February 2015).
  74. Eurostat. Material Flow Accounts. Available online: http://ec.europa.eu/eurostat/statistics-explained/index.php/Material_flow_accounts (accessed on 6 February 2015).
  75. The Organisation for Economic Co-operation and Development (OECD). Resource Productivity in the G8 and the OECD. 2008. Available online: http://www.oecd.org/env/waste/47944428.pdf (accessed on 6 February 2015).
  76. Eurostat. Estimates for Raw Material Consumption (RMC) and Raw Material Equivalents (RME) conversion factors. 2014. Available online: http://ec.europa.eu/eurostat/documents/1798247/6191533/RME-project-Introduction.pdf/96bbe739-bfda-47a2-99c7-cc3ec1048832 (accessed on 6 February 2015).
  77. European Resource Efficiency Platform (EREP). Manifesto and policy recommendations. 2014. Available online: http://ec.europa.eu/environment/resource_efficiency/documents/erep_manifesto_and_policy_recommendations_31-03-2014.pdf (accessed on 6 February 2015).
  78. Bringezu, S. Towards Increasing Resource Productivity: How to Measure the Total Material Consumption of Regional or National Economies? Fresenius Environ. Bull. 1993, 8, 437–442. [Google Scholar]
  79. Wuppertal Institute. Zukunftsfähiges Deutschland (Sustainable Germany); Fischer Taschenbuch Verlag: Frankfurt/Main, Germany, 2008. [Google Scholar]
  80. Bringezu, S. Key elements for Economy-wide Sustainable Resource Management. Annal. Mines Serie Responsab. Environ. 2011, 61, 78–87. [Google Scholar] [CrossRef]
  81. BIO Intelligence Service; Institute for Social Ecology; Sustainable Europe Research Institute. Assessment of Resource Efficiency Indicators and Targets; Final Report Prepared for the European Commission, DG Environment. 2012. Available online: http://ec.europa.eu/environment/enveco/resource_efficiency/pdf/report.pdf (accessed on 6 February 2015).
  82. Schütz, H.; Wuppertal Institute, Wuppertal, Germany. Unpublished work. 2013.
  83. Rogich, D.; Cassara, A.; Wernick, I.; Miranda, M. Material Flows in the United States. A Physical Accounting of the U.S. Industrial Economy. An WRI Report; Word Resources Institute: Washington, WA, USA, 2008. [Google Scholar]
  84. Wang, H.; Yue, Q.; Lu, Z.; Schütz, H.; Bringezu, S. Total material requirement of growing China: 1995–2008. Resources 2013, 2, 270–285. [Google Scholar] [CrossRef]
  85. Dredging amounts to about an additional 10% of the excavation, and would not significantly change that order of magnitude. For dredging, only data for Denmark, Germany, Netherlands and USA are available. For 2000, dredging in European countries was estimated with 0.59 t/person (Schütz based on country studies), and in the USA with 0.88 t/person when considering only deposition on land [46]
  86. Gustavsson, J.; Cederberg, C.; Sonesson, U.; van Otterdijk, R.; Meybeck, A. Global Food Losses and Food Waste. Extent, Causes and Prevention; FAO: Rome, Italy, 2011. [Google Scholar]
  87. O’Brien (in prep) based on the analysis of net annual increment of world forests determined 0.2 to 0.3 t/person as safe operating space
  88. Bringezu, S.; Schütz, H. Ziele und Indikatoren für die Umsetzung von ProgRess (Targets and indicators for implementing ProgRess). PolRess Arbeitspapier AS1.2/1.3. March 2013. Available online: http://www.ressourcenpolitik.de/ergebnisse/ (accessed on 6 February 2015).
  89. Meyer, B.; Barker, A.; Barton, J.; Long, K.; Pollitt, H.; Distelkamp, M.; Meyer, M.; Walter, H.; Giljum, S.; Kalcik, R.; et al. Macroeconomic modelling of sustainable development and the links between the economy and the environment. Final Report of the MacMod project (ENV.F.1/ETU/2010/0033) to the European Commission. 2011. Available online: http://ec.europa.eu/environment/enveco/studies_modelling/pdf/report_macroeconomic.pdf (accessed on 6 February 2015).
  90. Bringezu, S.; Bleischwitz, R. (Eds.) Sustainable Resource Management: Global Trends, Visions and Policies; Greenleaf Publishing: Sheffield, UK, 2009.
  91. Bringezu, S.; Schütz, H. Indikatoren und Ziele zur Steigerung der Ressourcenprodktivität (Indicators and targets for increasing resource productivity). PolRess Arbeitspapier AS 1.4. March 2014. Available online: http://www.ressourcenpolitik.de/ergebnisse/ (accessed on 6 February 2015).

