3.2. Sample Average Values of Socio-Ecological Attributes
The results (
Table 2/Column ‘original model’) show the estimated relative utility values of each level of each attribute averaged across all respondents. Prior to averaging, the utility values for each respondent were scaled for convenience. The worst levels of each attribute (e.g., poor biodiversity) are each scored zero. The utilities of the best level of each attribute are scaled so that their part-worth utilities sum to 100. The utilities of the medium levels of each attribute correspondingly fall between 0 and the value of the best level.
The utility values have no absolute interpretation. Instead, a change in the utility of a given attribute can only be understood relative to a change in the utility of another attribute (the relative utility values of a given level of an attribute can also be compared across people, as reported in the next section). For example, an improvement in biodiversity from Poor to Good condition increases average utility by somewhat more than twice as much as does reducing restrictions on recreational fishing from High to their current Low level (30.8/14.1 ≈ 2.18). Note that each attribute displays diminishing marginal utility (assuming that the differences in levels remain constant), on average, i.e., the utility increases somewhat less with each successive increase in level.
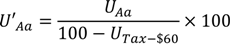
To focus on the preferences of the various socio-ecological attributes, the tax attribute can be excluded from the original model, and the values on the remaining attributes re-scaled so that the utilities on the best levels of socio-ecological attributes sum to 100. This is equivalent to running a choice experiment that involves only the socio-ecological attributes. The rescaling was based on Equation (1) and gave the results as summarized in
Table 2/Column ‘model without taxes’. Note that the ratios of any two utilities (relative values) remain unchanged from those in the ‘original model’.
where
U'Aa: Utility affected by level
a of socio-ecological attribute
A in the model without taxes;
UTax−$60: Utility affected by the best level of the tax attribute (decrease $60);
UAa: Utility affected by level
a of socio-ecological attribute
A in the model with taxes.
An alternative rescaling, shown in
Table 2/Column ‘∆ Utility from the status quo’, sets conditions in the status quo as the base equal to zero (Bio-Poor, MCul-No, Rec-Low, and Com-Low). In fact the current value of any level of a given attribute is not genuinely zero. Nevertheless, we designated a zero base to measure the relative importance of different outcomes if the status quo was to change. It is self-evident from their definitions (
Table 1) that Rec-Low and Com-Low are the status quo levels of the restrictions on recreational and commercial fishing. That the status quo level of biodiversity is poor is justified in
Section 2.1. ‘Not Practiced’ is in fact not the status quo level of Māori cultural management due to the fact that taiāpure and mātaitai have been operated in some areas [
48] and almost 26 percent of the survey respondents were aware of the operation. For the purpose of the following analysis, ‘Not Practiced’ is however assumed to be the status quo level. We will return to a discussion of this assumption in
Section 3.3.
What do we conclude from
Table 2? First we conclude that improving biodiversity from poor to good is the most valued change, on average, valued about twice as highly as moving from ‘worst to best’ in any other attribute. On average, respondents are willing to trade greater restrictions on fishing for better biodiversity. Secondly, maintaining Māori cultural practices are roughly as important as maintaining the current light restrictions on fishing.
Table 2.
Estimated ‘part-worth’ utilities.
Table 2.
Estimated ‘part-worth’ utilities.
| Attributes | Levels | Original model | Model without taxes | ∆ Utility from the status quo |
|---|
| Mean | Std. dev. | Mean | Std. dev. | Mean | Std. dev. |
|---|
| Note: A negative sign indicates adverse impact of the associated level of the attribute on utility. |
| Biodiversity (Bio) | Poor condition (Poor) | 0 | 0 | 0 | 0 | 0 | 0 |
| Medium condition (Medium) | 16.3 | 8.7 | 22.7 | 11.8 | 22.7 | 11.8 |
| Good condition (Good) | 30.8 | 14.1 | 42.9 | 18.3 | 42.9 | 18.3 |
| Māori cultural management (MCul) | No longer practiced (No) | 0 | 0 | 0 | 0 | 0 | 0 |
| Practiced in partnership with locals (Partner) | 9.3 | 8.6 | 12.8 | 11.4 | 12.8 | 11.4 |
| Practiced exclusively by Māori (Exclusive) | 13.4 | 10.4 | 18.5 | 13.6 | 18.5 | 13.6 |
| Recreational fishing (Rec) | Many more restrictions (High) | 0 | 0 | 0 | 0 | −20.1 | −11.7 |
| More restrictions (Medium) | 7.7 | 5.7 | 11.0 | 8.0 | −9.1 | −7.2 |
| Current restrictions (Low) | 14.1 | 8.3 | 20.1 | 11.7 | 0 | 0 |
| Commercial fishing (Com) | Not allowed (High) | 0 | 0 | 0 | 0 | −18.5 | −12.2 |
| More restrictions (Medium) | 8.2 | 6.9 | 11.5 | 9.2 | −7.0 | −7.0 |
| Current restrictions (Low) | 13.1 | 9.0 | 18.5 | 12.2 | 0 | 0 |
| Taxes | Increase $120 per annum (+$120) | 0 | 0 | - | - | - | - |
| Increase $60 per annum (+$60) | 11.6 | 6.8 | - | - | - | - |
| No change (+$0) | 21.0 | 10.1 | - | - | - | - |
| Decrease $60 per annum (-$60) | 28.5 | 11.5 | - | - | - | - |
3.3. Determinants of the Variation in the Values of Socio-Ecological Attributes
The large standard deviations around the means of the part-worth utilities associated with each of the socio-ecological attributes included in the choice survey indicate large variation in preferences/values across respondents. Multiple regression modeling using statistics software GenStat
® [
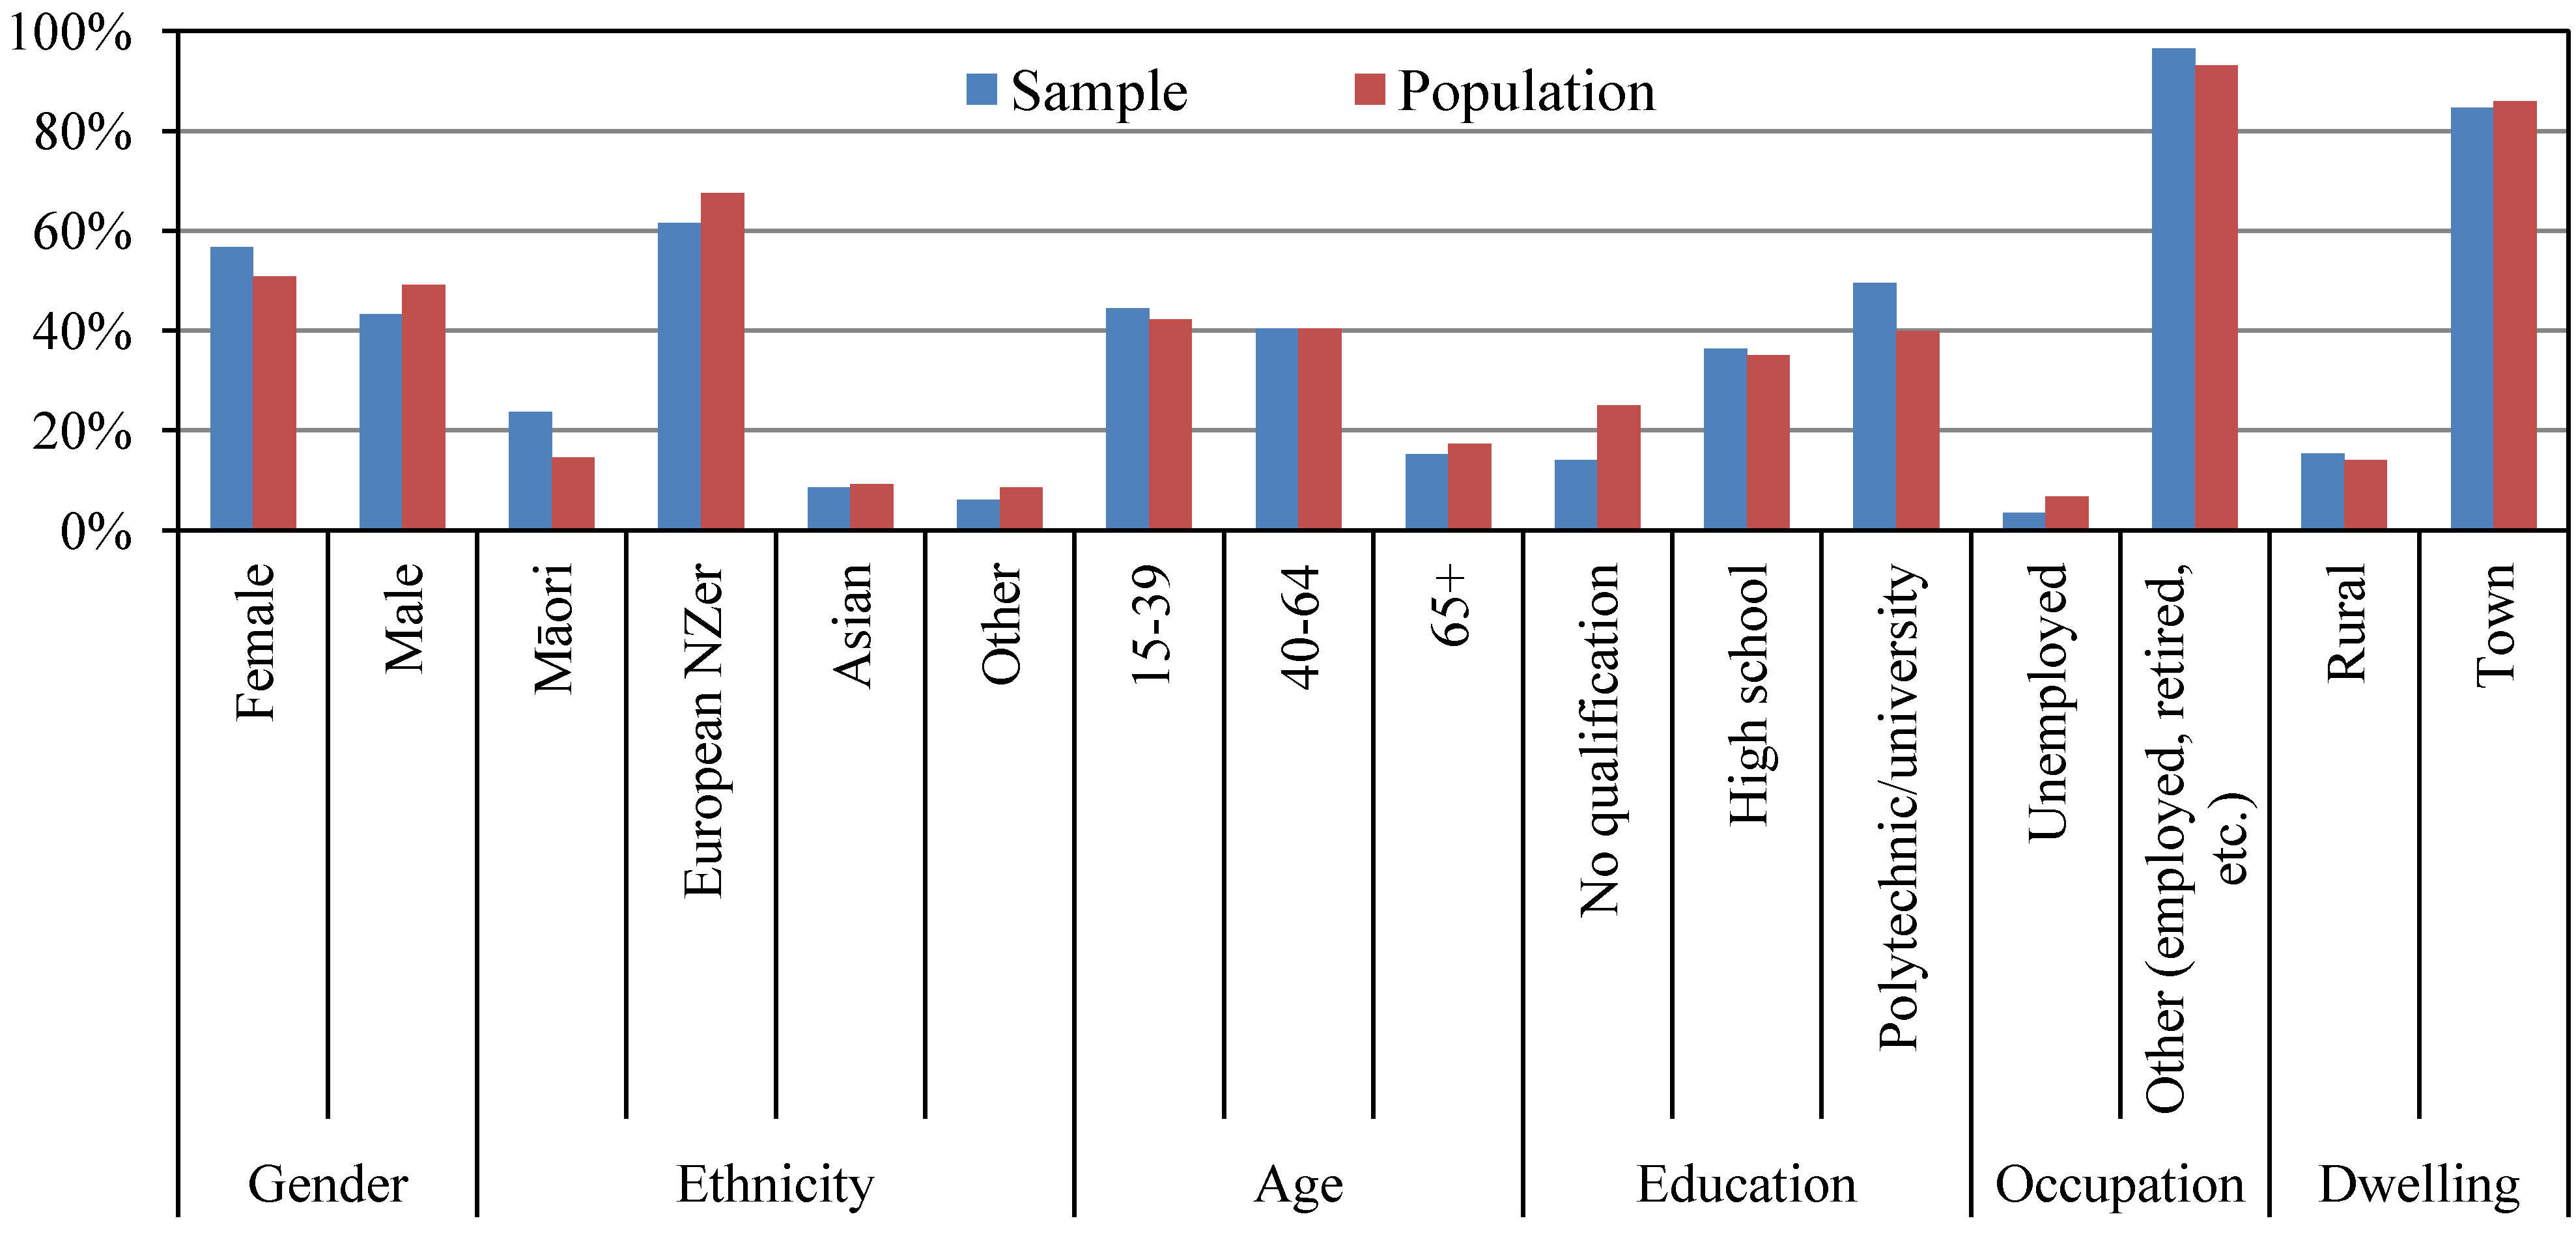
49] was undertaken to identify some of the influences (except those of the status quo due to zero utility). The results are of interest in their own right: they indicate how preferences vary with observed individual and household characteristics. They also allow prediction of the mean utility values for the population, rather than for the sample, as population characteristics differ somewhat from those of the sample.
A linear regression specification is inappropriate because the dependent variables,
i.e., the utility values, are essentially proportions. The relative utility of each attribute is scaled from 0 to 100, with most observations closer to zero than to 100. A sigmoid-shaped relationship would seem a sensible specification. Thus logistic regressions [Equation (2)] were estimated using a specific routine in GenStat [
49] (p.62). This is a generalized linear model (GLM) estimated using maximum likelihood assuming a binomial distribution. The regression residuals were more closely normally distributed than those from a linear specification.
where
![Resources 02 00406 i003]()
Probability of event;
U: Utility derived from a level of a socio-ecological attribute;
![Resources 02 00406 i004]()
: Odds ratio.
The utility values associated with each level of each attribute were fitted one at a time to the same model consisting of twenty three sets of explanatory variables (
Table 3), essentially all of the information obtained from each respondent. The first nine sets consist of demographic characteristics of the respondent and household. The next three sets contain information about the extent and type of use to which the respondent puts near-shore marine areas. The next three indicate membership in organizations relevant to the question at hand: Māori, environmental or recreational fishing organizations. The next three sets consist of the respondent’s knowledge of taiāpure and mātaitai and beliefs about their effectiveness in preserving Māori cultural practices. The next set consists of the respondent’s beliefs about the effectiveness of marine reserves. The last four sets consist of questions that may help control for the effects of various biases known to afflict choice surveys. These will be discussed in more detail shortly in
Section 3.4.
Table 3.
Explanatory variables used in the models.
Table 3.
Explanatory variables used in the models.
| Explanatory Variable | Type | Description |
|---|
| Gender | Factor | Two groupings: Male and Female |
| Ethnicity | Factor | Four groupings: Asian, European New Zealanders (EUNZ), Māori, and Other ethnicity |
| Age | Factor | Three groupings: Age 15–39, Age 40–64, and Age 65+ |
| Education | Factor | Three groupings: No qualification, High school, and Polytechnic/University |
| Occupation | Factor | Six groupings: Employed in agriculture, forestry and fisheries (Employed-AFF), employed in other sectors (Employed-Non-AFF), Home duty, Retired, Student, and Unemployed |
| Household income | Variate | Income of households in NZ$10,000 |
| Household size | Variate | Number of persons per household |
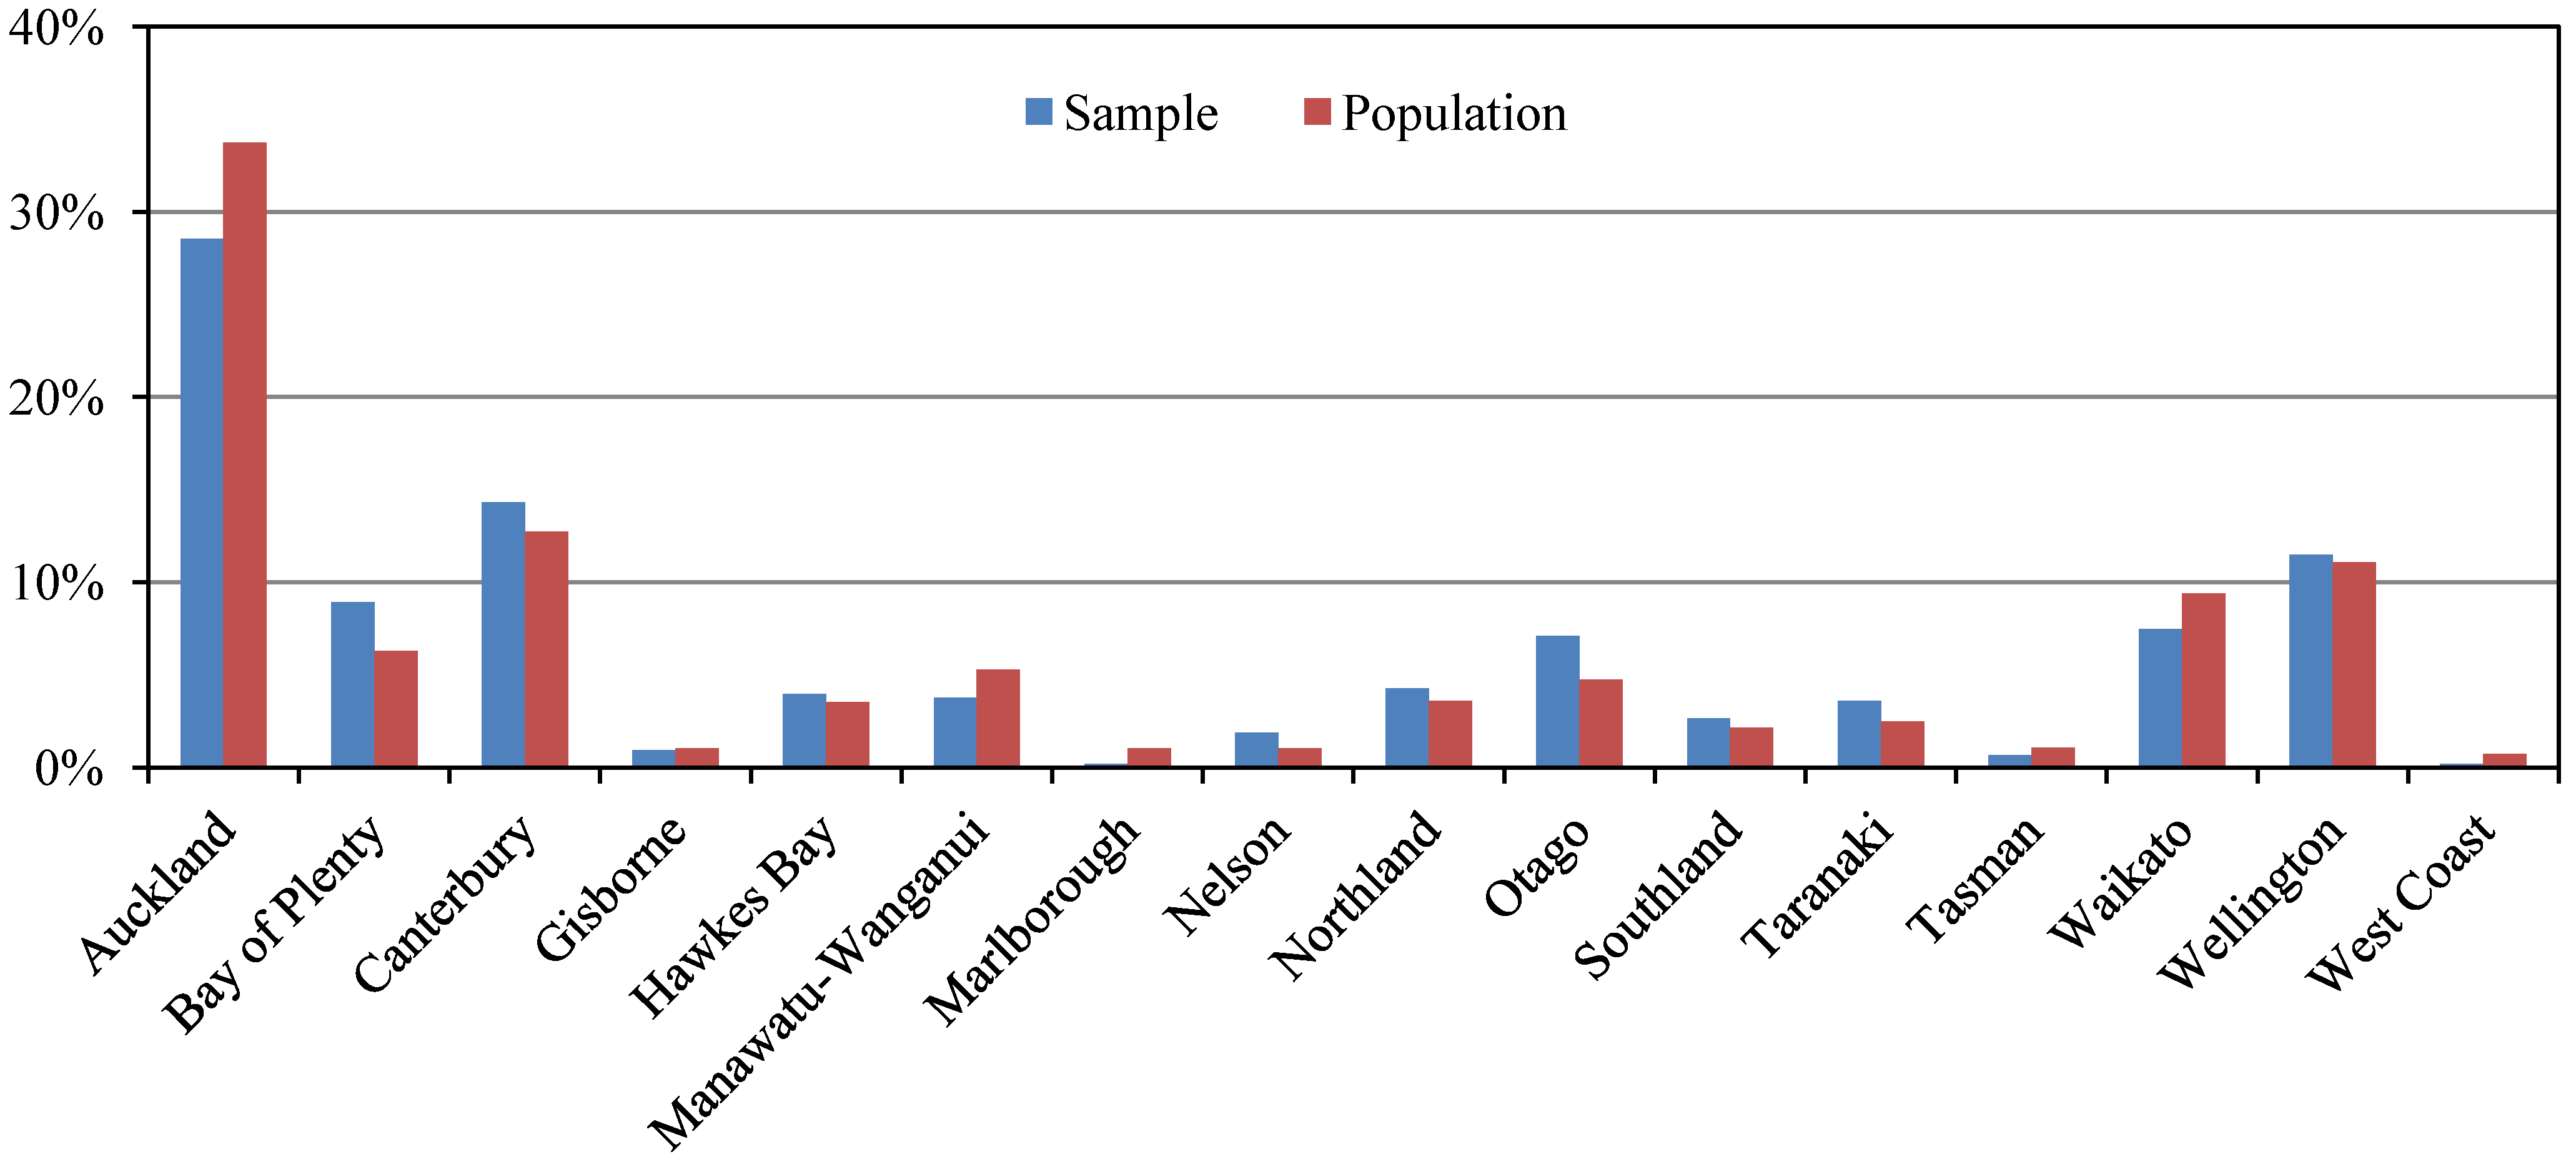
| Residential region | Factor | Sixteen groupings: Auckland, Bay of Plenty, Canterbury, Gisborne, Hawkes Bay, Manawatu-Wanganui, Marlborough, Nelson, Northland, Otago, Southland, Taranaki, Tasman, Waikato, Wellington, and West Coast |
| Rural/town dwelling | Factor | Two groupings: Rural and Town |
| Fisher | Factor | Four groupings: Commercial, Customary, Recreational, and Non-fisher |
| Fishing user | Factor | Three groupings: - -
Have fished in the last twelve months (Current user) - -
Have never fished in the last twelve months but likely to fish in the future (Future user) - -
Have never fished in the last twelve months and unlikely to fish in the future (Non-user)
|
| Non-fishing user/visitor | Factor | Three groupings: - -
Have visited in the last twelve months (Current visitor) - -
Have never visited in the last twelve months but likely to visit in the future (Future visitor) - -
Have never visited in the last twelve months and unlikely to visit in the future (Non-visitor)
|
| Māori organisation | Factor | Two groupings: member (Māori-Org) and non-member
(Non-Māori-Org) |
| Environmental organisation | Factor | Two groupings: member (Environment-Org) and non-member
(Non-Environment-Org) |
| Recreational fishing club | Facto | Two groupings: member (Rec-Fishing-Club) and non-member
(Non-Rec-Fishing-Club) |
| Operation of taiāpure and mātaitai | Factor | Two groupings: aware of the operation (Aware) and unaware of the operation (Unaware) |
| Management approaches taken in taiāpure and mātaitai | Factor | Three groupings: Know nothing, Know some, and Know a lot |
| Belief about Māori culture associated with a coastal marine area | Factor | Three groupings: - -
Māori culture is unlikely to persist even if Māori manage the area in their own way (MC-1) - -
Māori culture would be maintained if Māori manage the area in partnership with the locals (MC-2) - -
Māori culture would be maintained if Māori manage the area in their own way (MC-3)
|
| Belief about marine reserves | Factor | Four groupings: - -
Marine reserves do not restore most of the plants and fish to their former abundance and variety within the reserves and do not spill more fish and plants into the surrounding areas (MR-1) - -
Marine reserves do not restore most of the plants and fish to their former abundance and variety within the reserves but spill more fish and plants into the surrounding areas (MR-2) - -
Marine reserves restore most of the plants and fish to their former abundance and variety within the reserves but do not spill more fish and plants into the surrounding areas (MR-3) - -
Marine reserves restore most of the plants and fish to their former abundance and variety within the reserves and spill more fish and plants into the surrounding areas (MR-4)
|
| Confidence in choices made | Factor | Three groupings: Confident, Sort of confident, and Not confident |
| Protest against a tax payment vehicle | Factor | Two groupings: Protest taxes and Non-protest taxes |
| Social desirability bias | Factor | Two groupings: Social desirability and Non-social-desirability |
| Choice-making speed | Factor | Two groupings: Speedy and Non-speedy |
For this modeling purpose, the negative utility values of greater restrictions on recreational and commercial fishing (
Table 2/Column ‘∆ Utility from the status quo’) are converted to positive for convenience. Hence, it should be interpreted from the modeling results as utility values derived from avoiding such greater restrictions.
The modeling results (
Appendix 1) indicate that the utility values of the various levels of the socio-ecological attributes vary, as expected, with variation in socio-economic characteristics, respondents’ beliefs and perceptions and with the indicators of inaccurate responses to the choice experiment. Interpreting these coefficients from a logistic regression is, however, unintuitive: each one unit change in a given explanatory variable results in the estimated change in the logit(P).
Easier to understand are the implications of the regression results for differences in the mean predicted utility values of each attribute for each of the various groups, as reported in
Table 4. These values were obtained using fitted values from each regression model:
where
Ŷi: Fitted logit(P) for an
i respondent;
![Resources 02 00406 i006]()
Constant term;
![Resources 02 00406 i007]()
: Coefficients attached to explanatory variables of the regression model;
X1…
Xj: Explanatory variables of the regression model.
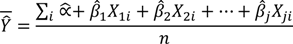
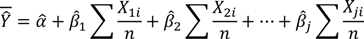
The mean fitted logit(P),
![Resources 02 00406 i008]()
, is given by Equation (4). Substituting Equation (3) in Equation (4) yields Equation (5), which can be rearrange to get Equation (6). Each of the terms
![Resources 02 00406 i009]()
is simply a proportion of a respective categorical variable (e.g., female, Māori) or the mean of a continuous variable (e.g., household income and size) in the sample. Each of the mean values reported in
Table 4 are obtained by substituting the relevant proportion into Equation (6) and converting the resulting logit(P) back to a utility value using Equation (2).
where
n: Total number of respondents.
Important to note is that information from 208 of the 1055 respondents is excluded from the regression analysis due to item non-response, i.e., some respondents chose not to provide all of the information requested in the follow-up questionnaire. Any observation with a missing item was omitted from the regression sample. Omitting these observations affects the mean fitted utility values, with those on the medium levels of the fishing attributes most affected. The mean values depend, of course, on the characteristics of the sample. Neither the original sample, nor the sample used in the regression is representative of the population. The next section reports estimates adjusted to represent the population.
The results (
Table 4) show that females on average value biodiversity and maintenance of Māori cultural practices more highly than do males and correspondingly place less value on avoiding more restrictions on fishing. These results suggest that women would somewhat more strongly than males support improvements in biodiversity and continuation of Māori culture with the cost of greater restrictions on recreational and commercial fishing. Greater support for biodiversity amongst women is consistent with that from previous studies (e.g., [
46,
47]).
Variation in values also correlate significantly with ethnicity (as suggested by [
50,
51]). New Zealanders of European origin (
i.e., EUNZ or ‘Pākehā’ for some people) value biodiversity more highly, on average, than do Māori (the reference category) and other ethnicities. Unsurprisingly, Māori value continuation of Māori cultural practices more highly than all other ethnicities and hence would more strongly support continuation of their cultural practices. Asians value avoiding greater restrictions on commercial fishing more highly than others and therefore would be less likely to support a complete ban on commercial fishing in near-shore fisheries.
Age, education, occupation, income and household size all exhibit significant correlation with the variation in the values of some attributes. For example, younger respondents tend to be relatively more concerned about biodiversity and less concerned about Māori cultural practices. Those with home duties value biodiversity relatively highly and correspondingly are less concerned about avoiding more restrictions on commercial fishing less than others.
The results indicate some regional variation in preferences. Respondents from Marlborough express a very high and of Nelson a high value of biodiversity. West Coast residents value continuation of Māori cultural practices much more highly, on average, than those in other regions. Gisborne residents, in contrast, value avoiding greater restrictions on commercial fishing.
Values also differ across groups of fishers. Recreational fishers, not surprisingly, reveal relatively low values for Māori cultural management and high values on avoiding more restrictions on recreational fishing. Customary fishers, correspondingly, are relatively less concerned about greater restrictions on recreational fishing. This seems sensible as restrictions on recreational fishers are often imposed in taiāpure. More restrictions on recreational fishing imply more fish for customary fishers.
Times and types of resource uses also correlate as expected with values. Current and future fishers value biodiversity less than do non-fishers. Current and future visitors to near-shore marine areas value biodiversity more than do non-visitors.
Members of various organizations/associations vary somewhat in values. For example, members of Māori organizations value biodiversity somewhat less than do non-members. Members of environmental organizations, perhaps surprisingly, tend to value Māori cultural practices more highly than non-members. In contrast, they place relatively little value on avoiding greater restrictions on commercial fishing. This suggests that, on average, these members consider Māori cultural management as perhaps better for the environment than commercial fishing. Surprisingly, the values expressed by the members of recreational fishing clubs do not differ from those of non-members, especially for greater restrictions on recreational fishing.
Those respondents who report awareness of the operation of taiāpure and mātaitai tend to place higher value on maintaining Māori cultural practices, especially in partnership with the locals. On the one hand, this seems inconsistent with the scoping effect [
19,
43,
52] that those who are aware that taiāpure and mātaitai are in operation should place less value on changes from ‘Not Practiced’ to ‘Practiced in Partnership’ or ‘Practiced Exclusively’ because they know that Māori culture is being practiced in at least a limited way. Perhaps those who are aware of taiāpure and mātaitai on balance perceive them positively and that the small number in operation is insufficient to maintain Māori culture.
Table 4.
Mean fitted utility values of each level of each attribute by groups of respondents.
Table 4.
Mean fitted utility values of each level of each attribute by groups of respondents.
| N = 847 (208 excluded due to item non-response) | Bio-Good (Mean = 43.3) | Bio-Medium (Mean = 22.7) | MCul-Exclusive (Mean = 17.3) | MCul-Partner (Mean = 11.6) | Rec-High (Mean = 19.3) | Rec-Medium (Mean = 8.6) | Com-High (Mean = 17.7) | Com-Medium (Mean = 6.2) |
|---|
| Notes: *** significant at 1%; ** significant at 5%; and * significant at 10%; vis-à-vis an ® reference level. |
| Gender | | | | | | | | |
| | Male (43.8%) | 42.4® | 21.7® | 16.4® | 10.7® | 20.8® | 9.2® | 18.1® | 6.7® |
| | Female (56.2%) | 44.0 | 23.5** | 18.0* | 12.3** | 18.2*** | 8.2** | 17.5 | 5.9** |
| Ethnicity | | | | | | | | |
| | Māori (23.8%) | 37.4® | 19.5® | 22.8® | 15.5® | 19.5® | 8.6® | 18.0® | 6.7® |
| | EUNZ (60.6%) | 46.6*** | 24.5*** | 15.0*** | 10.2*** | 19.3 | 8.8 | 17.1 | 6.0 |
| | Asian (9.0%) | 38.4 | 19.9 | 18.3** | 11.5** | 19.7 | 8.4 | 21.1* | 7.4 |
| | Other (6.6%) | 42.0* | 22.3* | 19.4 | 12.5* | 18.2 | 7.9 | 18.3 | 5.2 |
| Age | | | | | | | | |
| | 15–39 (46.5%) | 45.0® | 24.0® | 15.8® | 10.8® | 18.6® | 8.4® | 18.6® | 7.0® |
| | 40–64 (38.1%) | 42.5 | 21.5** | 18.6** | 12.3* | 19.3 | 9.0 | 17.2 | 5.8** |
| | 65+ (15.4%) | 40.3 | 21.8 | 18.8 | 12.4 | 21.8* | 8.5 | 16.4 | 5.1** |
| Education | | | | | | | | |
| | No qualification (12.6%) | 42.4® | 22.4® | 16.7® | 11.5® | 20.0® | 8.4® | 18.6® | 6.8® |
| | High school (36.9%) | 41.5 | 22.0 | 17.0 | 11.1 | 20.9 | 9.7* | 18.4 | 6.9 |
| | Polytechnic/university (50.5%) | 44.9 | 23.3 | 17.6 | 11.9 | 18.1 | 8.0 | 17.0 | 5.6* |
| Occupation | | | | | | | | |
| | Unemployed (3.7%) | 38.0® | 20.3® | 16.0® | 10.8® | 20.9® | 8.8® | 22.5® | 7.0® |
| | Home duties (6.0%) | 46.3** | 24.3 | 17.6 | 11.5 | 18.5 | 7.5 | 15.2*** | 4.9* |
| | Student (22.3%) | 43.3 | 22.1 | 17.1 | 11.3 | 18.2 | 7.7 | 18.9 | 6.0 |
| | Retired (12.6%) | 43.6 | 23.6 | 16.9 | 11.6 | 19.4 | 9.8 | 18.4 | 6.7 |
| | Employed-AFF (1.2%) | 35.9 | 21.5 | 13.5 | 11.0 | 27.4 | 12.1 | 19.3 | 9.0 |
| | Employed-Non-AFF (54.2%) | 43.4 | 22.8 | 17.6 | 11.7 | 19.6 | 8.8 | 17.1** | 6.2 |
| Household income (mean = $56,000 p.a.) | 43.3 | 22.7 | 17.3* | 11.6 | 19.3 | 8.6** | 17.7 | 6.2 |
| Household size (3 persons) | 43.3 | 22.7 | 17.3 | 11.6 | 19.3 | 8.6* | 17.7 | 6.2 |
| Residential region | | | | | | | | |
| | Auckland (27.6%) | 43.9® | 23.0® | 16.9® | 11.5® | 20.0® | 8.9® | 17.3® | 6.1® |
| | Bay of Plenty (8.2%) | 41.7 | 21.6 | 17.0 | 11.9 | 20.6 | 9.3 | 18.6 | 6.8 |
| | Canterbury 15.9%) | 43.1 | 21.7 | 18.4 | 12.2 | 18.4 | 8.7 | 17.8 | 5.9 |
| | Gisborne (1.1%) | 38.0 | 24.9 | 15.3 | 13.0 | 16.9 | 7.6 | 28.1** | 6.7 |
| | Hawkes Bay (3.8%) | 46.2 | 26.2 | 13.1 | 8.6 | 19.7 | 7.6 | 18.1 | 5.8 |
| | Manawatu-Wanganui (3.9%) | 44.8 | 22.6 | 15.6 | 9.8 | 19.7 | 9.1 | 18.1 | 6.9 |
| | Marlborough (0.2%) | 74.2** | 37.4* | 4.1 | 1.8 | 16.8 | 8.1 | 4.5 | 2.0 |
| | Nelson (1.9%) | 52.1* | 28.2* | 17.1 | 13.2 | 17.0 | 7.2 | 11.5* | 4.3 |
| | Northland (4.8%) | 44.3 | 22.6 | 17.3 | 12.1 | 20.3 | 8.8 | 15.7 | 6.6 |
| | Otago (7.3%) | 41.2 | 21.8 | 18.9 | 11.3 | 18.9 | 8.3 | 18.7 | 6.0 |
| | Southland (2.4%) | 38.9 | 19.8 | 22.0* | 16.4** | 19.4 | 7.7 | 17.7 | 6.7 |
| | Taranaki (3.3%) | 34.8*** | 19.5 | 20.7 | 12.9 | 21.7 | 8.6 | 20.0 | 7.4 |
| | Tasman (0.5%) | 44.6 | 19.6 | 17.5 | 10.5 | 17.4 | 8.4 | 19.0 | 5.4 |
| | Waikato (7.0%) | 42.5 | 23.2 | 16.6 | 10.7 | 20.7 | 8.6 | 17.6 | 7.4 |
| | Wellington (11.9%) | 45.1 | 23.9 | 16.8 | 11.3 | 17.4** | 8.3 | 18.6 | 5.7 |
| | West Coast (0.2%) | 37.7 | 16.3 | 35.3** | 31.8*** | 10.6 | 8.0 | 6.4 | 3.2 |
| Rural/town dwelling | | | | | | | | |
| | Town (84.3%) | 42.9® | 22.5® | 17.4® | 11.6® | 19.4® | 8.8® | 17.9® | 6.3® |
| | Rural (15.7) | 45.6 | 24.0 | 16.4 | 11.5 | 18.8 | 7.7* | 16.8 | 5.9 |
| Fisher | | | | | | | | |
| | Non-fishers (63.6%) | 43.8® | 22.8® | 17.9® | 12.2® | 18.6® | 8.5® | 17.2® | 6.1® |
| | Recreational fishers (34.3%) | 42.6 | 22.7 | 15.9 | 10.4* | 20.8* | 9.1 | 18.7 | 6.4 |
| | Commercial fishers (0.6%) | 33.0 | 18.7 | 21.7 | 17.4 | 16.5 | 6.3 | 23.9 | 10.0* |
| | Customary fishers (1.5%) | 41.0 | 18.9 | 19.4 | 11.8 | 18.2 | 5.4* | 18.0 | 5.9 |
| Fishing user | | | | | | | | |
| | Non-user (52.3%) | 45.4® | 23.8® | 15.4® | 10.2® | 18.6® | 8.2® | 18.6® | 6.3® |
| | Future user (25.3%) | 41.8** | 22.0 | 18.5*** | 12.9*** | 20.1 | 9.2 | 17.1 | 6.3 |
| | Current user (22.4%) | 40.2** | 21.1* | 20.6*** | 13.7*** | 20.2 | 9.0 | 16.4 | 5.9 |
| Non-fishing user/visitor | | | | | | | | |
| | Non-visitor (33.4%) | 40.0® | 21.0® | 19.1® | 12.6® | 20.4® | 8.9® | 18.2® | 6.4® |
| | Future visitor (29.8%) | 43.7** | 23.4** | 16.4** | 10.7** | 19.9 | 9.4 | 17.9 | 6.3 |
| | Current visitor (36.8%) | 46.1*** | 23.8*** | 16.4** | 11.3 | 18.0** | 7.8* | 17.2 | 6.0 |
| Māori Organization | | | | | | | | |
| | Non-Māori-Org (94.5%) | 43.5® | 22.9® | 17.2® | 11.5® | 19.3® | 8.6® | 17.7® | 6.2® |
| | Māori-Org (5.5%) | 39.8 | 18.9* | 19.0 | 11.8 | 19.1 | 9.2 | 17.9 | 6.0 |
| Environmental Organization | | | | | | | | |
| | Non-Environment-Org (94.7%) | 43.2® | 22.7® | 17.1® | 11.4® | 19.5® | 8.7® | 18.0® | 6.3® |
| | Environment-Org (5.3%) | 45.8 | 22.6 | 20.9** | 14.1* | 17.0 | 7.3 | 13.8** | 4.2** |
| Recreational fishing club | | | | | | | | |
| | Non-Rec-Fishing-Club (98%) | 43.3® | 22.7® | 17.3® | 11.6® | 19.3® | 8.7® | 17.7® | 6.2® |
| | Rec-Fishing-Club (2%) | 42.4 | 23.9 | 17.1 | 11.2 | 19.2 | 7.0 | 19.5 | 6.2 |
| Operation of taiapure and mataitai | | | | | | | |
| | Unaware (74.9%) | 43.7® | 22.9® | 16.9® | 11.0® | 19.3® | 8.5® | 17.8® | 6.0® |
| | Aware (25.1%) | 42.1 | 22.1 | 18.3 | 13.4** | 19.3 | 8.9 | 17.5 | 6.8 |
| Management approaches taken in taiāpure and mātaitai | | | | | |
| | Know nothing (84.4%) | 43.2® | 22.7® | 17.1® | 11.6® | 19.5® | 8.7® | 17.8® | 6.4® |
| | Know some (14.1%) | 44.6 | 22.9 | 17.7 | 11.0 | 18.2 | 7.9 | 17.2 | 5.1** |
| | Know a lot (1.5%) | 37.9 | 20.7 | 21.8 | 13.7 | 18.5 | 10.1 | 17.0 | 4.5 |
| Belief about Māori culture | | | | | | | | |
| | MC-1 (26.9%) | 45.3® | 23.9® | 12.7® | 7.0® | 20.7® | 9.7® | 19.0® | 7.2® |
| | MC-2 (62.9%) | 42.8* | 22.3* | 18.9*** | 13.9*** | 18.7** | 8.3*** | 17.6 | 5.8*** |
| | MC-3 (10.2%) | 41.0* | 22.0 | 21.5*** | 13.4*** | 19.5 | 7.9** | 15.6** | 6.5 |
| Belief about marine reserves | | | | | | | | |
| | MR-1 (7.8%) | 30.4® | 16.0® | 23.4® | 14.5® | 23.1® | 12.1® | 20.0® | 8.1® |
| | MR-2 (6.7%) | 38.7*** | 21.7*** | 16.5*** | 10.8* | 21.8 | 8.8*** | 20.4 | 6.7 |
| | MR-3 (22.1%) | 42.5*** | 22.2*** | 18.1*** | 12.6 | 19.9** | 9.3*** | 17.5 | 6.7* |
| | MR-4 (63.4%) | 45.8*** | 23.9*** | 16.4*** | 11.0** | 18.4*** | 8.0*** | 17.3* | 5.8*** |
| Confidence in choices made | | | | | | | | |
| | Confident (28.2%) | 45.9® | 23.8® | 15.9® | 10.7® | 19.4® | 8.7® | 16.5® | 6.2® |
| | Sort of confident (62.3%) | 42.9** | 22.5 | 17.5 | 11.7 | 19.2 | 8.5 | 18.2* | 6.1 |
| | Not confident (9.5%) | 38.8*** | 20.8* | 20.1*** | 13.3** | 20.2 | 9.0 | 18.1 | 7.1 |
| Protest against a tax payment vehicle | | | | | | | |
| | Non-protest taxes (88.9%) | 43.8® | 23.0® | 17.3® | 11.5® | 19.1® | 8.4® | 17.5® | 6.1® |
| | Protest taxes (11.1%) | 39.6** | 20.1** | 17.3 | 12.4 | 21.4* | 10.1** | 19.3 | 7.3* |
| | Social desirability bias | | | | | | | | |
| | Non-social-desirability (78.2%) | 42.7® | 22.3® | 16.7® | 11.1® | 19.9® | 8.7® | 18.4® | 6.4® |
| | Social-desirability (21.8%) | 45.4* | 24.1* | 19.3*** | 13.5*** | 17.3*** | 8.3 | 15.5*** | 5.5* |
| Choice-making speed | | | | | | | | |
| | Non-speedy (92.8%) | 44.4® | 23.4® | 17.1® | 11.6® | 19.0® | 8.4® | 17.4® | 5.9® |
| | Speedy (7.2%) | 30.0*** | 14.6*** | 19.4 | 11.0 | 24.1*** | 11.4*** | 22.8*** | 10.5*** |
Beliefs play a major role in explaining differences in the values of most outcomes. For example, those who believe that Māori culture will be maintained with exclusive management (MC-3) or management in partnership (MC-2) unsurprisingly express more value of Māori management than those who are skeptical of the persistence of Māori culture even with Māori management (MC-1). Not surprisingly, those who believe in the effectiveness of marine reserves to restore biodiversity and fish stocks express higher values for biodiversity.
3.4. Potential Bias in the Choice Survey Results
A key concern in this kind of survey is the accuracy with which respondents state their relative preferences for attributes through their choices. This is an example of error in data acquisition [
41]. Inaccurate responses in this study might arise from two sources.
The first one is associated with responder biases. Seven potential responder biases were addressed in this study as summarized in
Appendix 2. Measures taken to address these biases were mainly based on those suggested or employed in the literature (e.g., [
18,
19,
43,
53,
54]). Strategic, hypothetical, and information biases were addressed in the survey design. Biases associated with task understanding, protest payment vehicle and social desirability were addressed using inputs from follow-up questions. Those respondents who answered “Sort of, I found some of the choices difficult” and those answered “No, I found many of the choices difficult” to the question “Do you feel confident about choices you made?” are treated as potentially subject to task understanding bias. Those who answered “I would prefer to pay in other ways (e.g., user fees or donation) rather than taxation” to the question “Why are you not willing to pay more tax?” are treated as potentially subject to protest payment vehicle bias. As a practical matter the protest payment vehicle seems most likely to affect values associated with taxes, and not non-monetary values reported in this paper. However, it is worth examining whether the effect still exists as the non-monetary values come from a choice model involving a tax attribute. Those who answered “I consider it a moral obligation to protect marine life or cultures of indigenous people” to the question “Why are you willing to pay more tax?” are treated as potentially subject to social desirability bias.
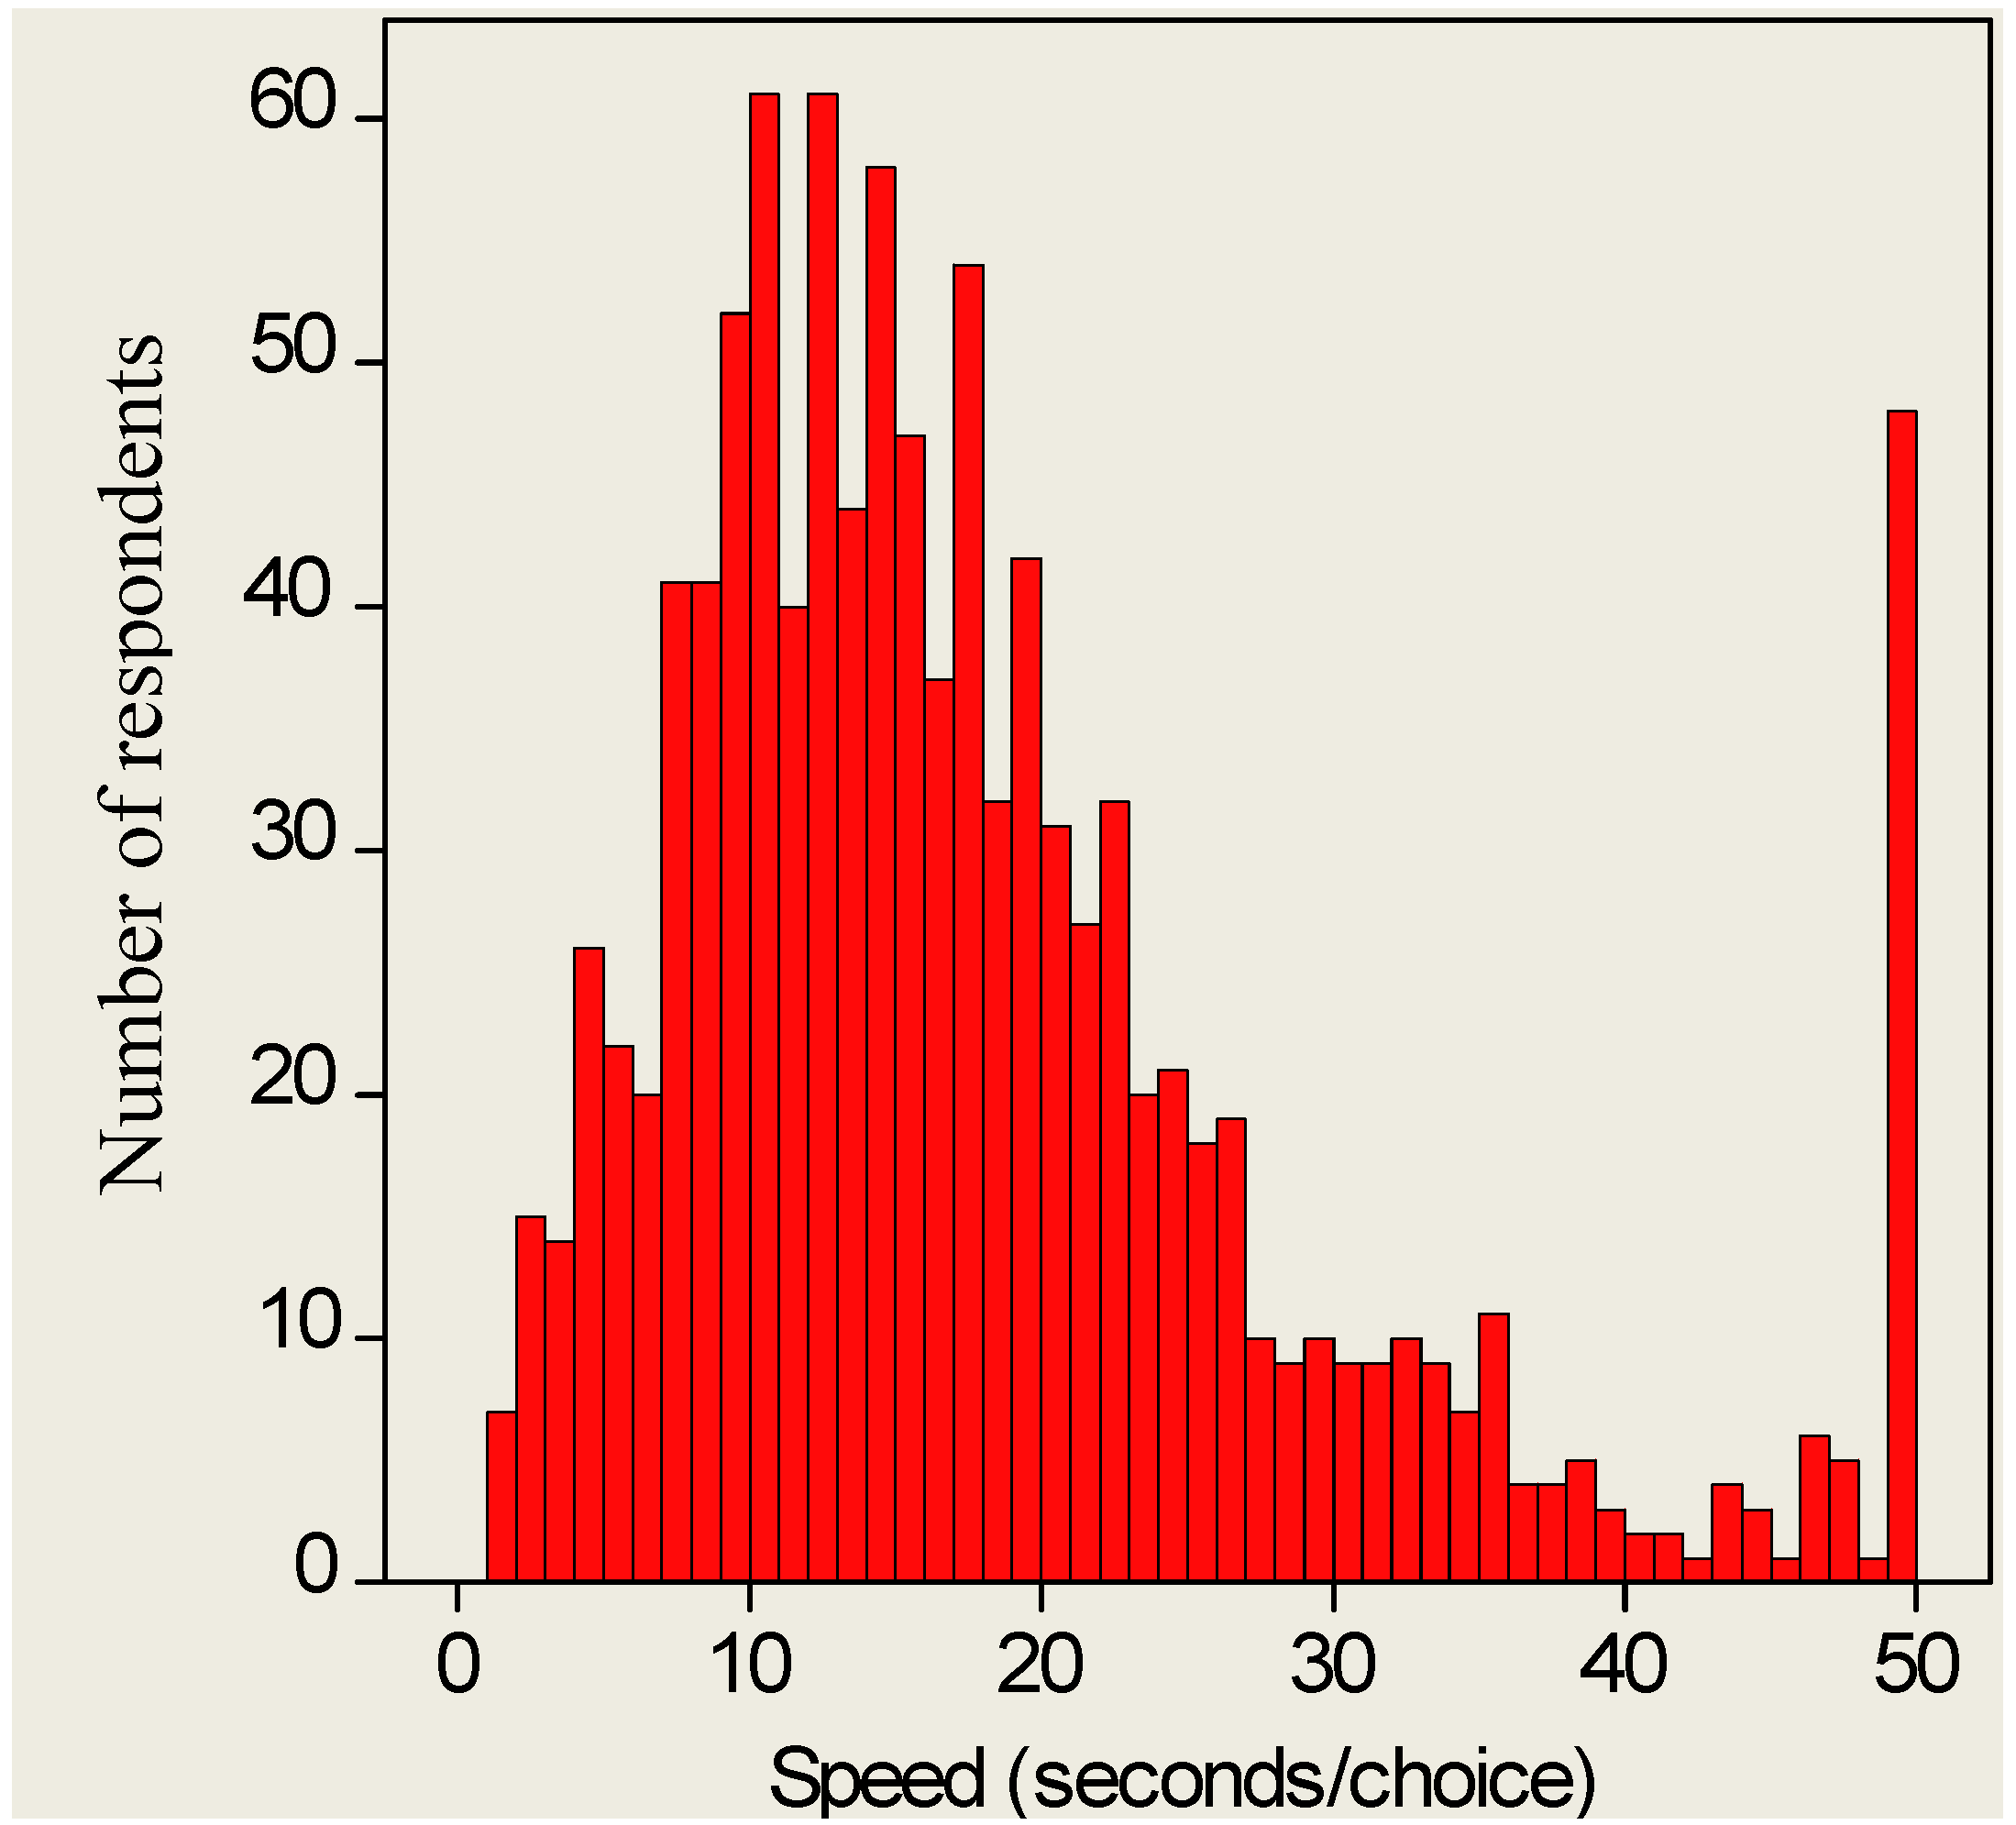
The second source of inaccurate responses is associated with Smile City’s reward system. The reward system benefits the project by encouraging participation in the survey. But some respondents might have completed the survey purely for the reward; they might not fully consider the survey questions (especially relative to choice-making). The distribution of speeds in making choices (
Figure 4) indicates that the number of respondents drops dramatically at speeds of less than six seconds/choice. Six seconds seems unbelievably fast to make a considered choice. The more time respondents took to make a choice, the more consideration they likely gave to each choice (the 47 respondents taking more than 50 seconds/choice presumably discontinued the survey for a while). So, the speedy choosers are treated as having provided lightly considered responses. This treatment can also be considered as a way to treat hypothetical bias because viewing the survey as a practically meaningless exercise might encourage lightly considered and speedier choices.
Returning to the results in
Table 4, controlling for the indicators of inaccurate responses to the choice experiment led to systematic differences in values of many socio-ecological attributes. Values of biodiversity drop with levels of confidence in choices made or if respondents protested taxes. These findings are consistent with the assumption that respondents who are uncertain about the choices asked or in protest against a payment vehicle tend to favor the status quo [
19]. Further, those potentially subject to social desirability bias held higher value for biodiversity and Māori cultural practices. This is again consistent with the assumption that respondents who perceive the amenity in questions (
i.e., biodiversity and Māori culture) as socially desirable tend to state a higher value for that amenity [
19]. Alternatively, speedy choice-makers tend to have lower values for biodiversity and higher values for avoiding greater restrictions on recreational and commercial fishing. This indicates that those who chose quickly tend to have more frequently chosen the status quo outcomes.
Figure 4.
Distribution of choice-making speeds.
Figure 4.
Distribution of choice-making speeds.
These results indicate that the estimates of utility values are distorted by various types of bias to the choice experiment. On an
ad hoc basis, biased responses can be excluded from analysis. However, “this procedure suffers from the obvious drawback that it opens the researcher to criticism that he has engaged in selective deletion to achieve desired results. A more defensible approach is to mitigate the effect of outliers [biased responses] through the use of robust statistic estimators” [
43] (p.226). The treatments of bias using this latter approach are reported in the next section.


 Probability of event; U: Utility derived from a level of a socio-ecological attribute;
  : Odds ratio.
 Constant term;
  : Coefficients attached to explanatory variables of the regression model; X1…Xj: Explanatory variables of the regression model.
 , is given by Equation (4). Substituting Equation (3) in Equation (4) yields Equation (5), which can be rearrange to get Equation (6). Each of the terms
  is simply a proportion of a respective categorical variable (e.g., female, Māori) or the mean of a continuous variable (e.g., household income and size) in the sample. Each of the mean values reported in Table 4 are obtained by substituting the relevant proportion into Equation (6) and converting the resulting logit(P) back to a utility value using Equation (2).