
Historical Analysis of the Effects of Drought on Rice and Maize Yields in Southeast Asia


1
School of Energy and Environment, University of Phayao, Phayao 56000, Thailand
2
Atmospheric Pollution and Climate Research Unit, School of Energy and Environment, University of Phayao, Phayao 56000, Thailand
3
School of Agriculture and Natural Resources, University of Phayao, Phayao 56000, Thailand
*
Author to whom correspondence should be addressed.
Resources 2024, 13(3), 44; https://doi.org/10.3390/resources13030044
Submission received: 2 February 2024
/
Revised: 1 March 2024
/
Accepted: 14 March 2024
/
Published: 18 March 2024
Abstract
:This study performs an empirical orthogonal function (EOF) analysis to study the relationship between rice and maize productivities and the different time scales of the Standardized Precipitation Evapotranspiration Index (SPEI), including 1-month, 6-month, and 12-month time scales in Southeast Asia during the years 1970–2019. For the 1-month time scale, the averaged SPEI values are in the range of −1.0 to 1.0, indicating a moderate degree of dryness and humidity. Both 6-month and 12-month time scales suggest that many countries in Southeast Asia are experiencing mostly wet conditions, with SPEI values reaching up to 1.5. The relationship analysis by using EOF was indicated by the first and second principal components (PC1 and PC2) suggesting that drought events exhibit a positive orientation to crop productivity, especially maize in Southeast Asia. The pattern of climate oscillations, such as the El Niño-Southern Oscillation (ENSO), is likely related to crop productivity in Southeast Asia. The findings emphasize the importance of considering temporal climatic patterns in agricultural decision-making, with implications for enhancing regional climate resilience and ensuring sustainable food security in the face of global climate change.
1. Introduction
Drought is one of the climate phenomena characterized by prolonged time duration, extensive spatial coverage, and an impact on the economy, human well-being, and ecology [1]. In the recent decade, there has been an increase in the attention paid to droughts, with expectations of their exacerbation in the future [2]. There have been many studies on drought and its effects in several countries across the globe. For example, Jung and Chang [3] used the relative Standardized Precipitation Index (rSPI) and the relative Standardized Runoff Index (rSRI) to assess the potential of drought risk at the Willamette River Basin in the United States. Their findings indicated that the vicinity near the Willamette River Basin showed susceptibility to drought related to climate change. The phenomenon of prolonged drought has significantly affected many regions across the globe, including Australia, Brazil, China, Ethiopia, India, Spain, the Czech Republic, and Portugal [4,5].
There have been several studies of drought related to climate change in Southeast Asia. For example, Lee et al. [6] studied the regional climate pattern in East Asia from 1980 to 2049 using the Seoul National University Regional Climate Model (SNURCM). Their results indicate that the annual average surface temperature tends to increase by 1.8 °C, along with a decline of 0.2 mm/day during precipitation. Loo et al. [7] suggest that there is a relationship between the weather patterns in Southeast Asia, especially the monsoonal rain patterns, and the Arctic oscillation, the Siberian high-pressure system, and the western Pacific subtropical high-pressure system. Manton et al. [8] used the data from ground-based measurements across 15 different countries to study the anomalous meteorological phenomena in Southeast Asia between 1961 and 1998. Their findings revealed that the extreme precipitation trends exhibited a lower degree of spatial coherence in comparison to the extreme temperature trends. Additionally, there has been a significant decrease in the frequency of cold days and nights, along with a noticeable increase in the frequency of hot days and warm nights. Masud et al. [9] suggest a significant positive correlation between climate variables and the projected increase in the number of both summer days and tropical nights. Amnuaylojaroen and Chanvichit [10] also highlighted a substantial change in the temperature pattern, which contributed to the substantial drought event in Southeast Asia.
The agricultural sector is directly influenced by climate change, especially temperature and precipitation. These factors dominate the growth of crops, as well as the annual and long-term yield of the cropping system [11]. The climate extremes have the potential to exert adverse effects on crop production [12]. There has been a relative lack of investigation of adaptive measures aimed at enhancing cropping practices to effectively mitigate the negative consequences of drought on crop yields [12]. A significant drought event has the potential to diminish crop yields due to the limited availability of water and soil moisture for optimal crop growth. It is of utmost significance to comprehend the repercussions of spatiotemporal fluctuations in drought for crop yield and cropping areas to strategize and alleviate their plausible adverse consequences in the agricultural sector [13]. Southeast Asia, a region of particular concern, is known to possess a substantial expanse of approximately 115 million hectares (ha) of agricultural land, primarily dedicated to the cultivation of staple crops such as rice and maize [14,15,16]. It is noteworthy that a significant proportion, specifically 45%, of the region’s population relies on these crops as vital components of their daily dietary intake [14]. The susceptibility of Southeast Asia (SEA) to climate change is a matter of concern due to its geographical characteristics, which render it highly vulnerable [17]. In the past, there has been an absence of study inquiry dedicated to the examination and evaluation of the ramifications stemming from alterations in climatic patterns in regard to the agricultural output within the Southeast Asian region. According to a recent empirical investigation conducted by Sekhar [18], it has been determined that alterations in precipitation patterns possess the potential to exert an adverse impact on approximately half of the rice production within the Southeast Asian (SEA) region. A report from the Food and Agriculture Organization (FAO) has presented findings that highlight the detrimental impacts of heightened occurrences and magnitudes of droughts and floods on global food security and livelihoods in various regions [19]. Within the realm of the agricultural domain, it is noteworthy to acknowledge that droughts and floods contribute to a significant proportion of crop damage, specifically accounting for 18% and 19%, respectively. The urgency of investigating this issue is heightened by the susceptibility of the Southeast Asian region to the extensive ramifications of climate change. In the context of the imminent threat posed by global climate variability, the potential consequences for agricultural productivity within the region assume significant proportions [20]. The dynamic fluctuations noticed in global weather patterns possess the capacity to exert a profound and far-reaching influence on the productivity of agricultural crops, thereby exerting a significant impact on the sustenance and economic well-being of numerous individuals.
To effectively address the challenges posed by climatic stressors, it is crucial to thoroughly comprehend the temporal and spatial aspects of their impacts. This understanding will enable the development of adaptive strategies aimed at enhancing resilience, as highlighted by Lesk et al. [21]. This study aims to analyze the impact of drought based on the Standardized Precipitation Evapotranspiration Index (SPEI) on agricultural productivity including rice and maize in Southeast Asia, covering the period from 1970 to 2019.
2. Materials and Methods
To understand the impact of drought on agricultural productivity, this study employed the Empirical Orthogonal Function (EOF) to analyze the relationship between the SPEI and the productivities of rice and maize in Southeast Asia from 1970 to 2019.
2.1. Study Area
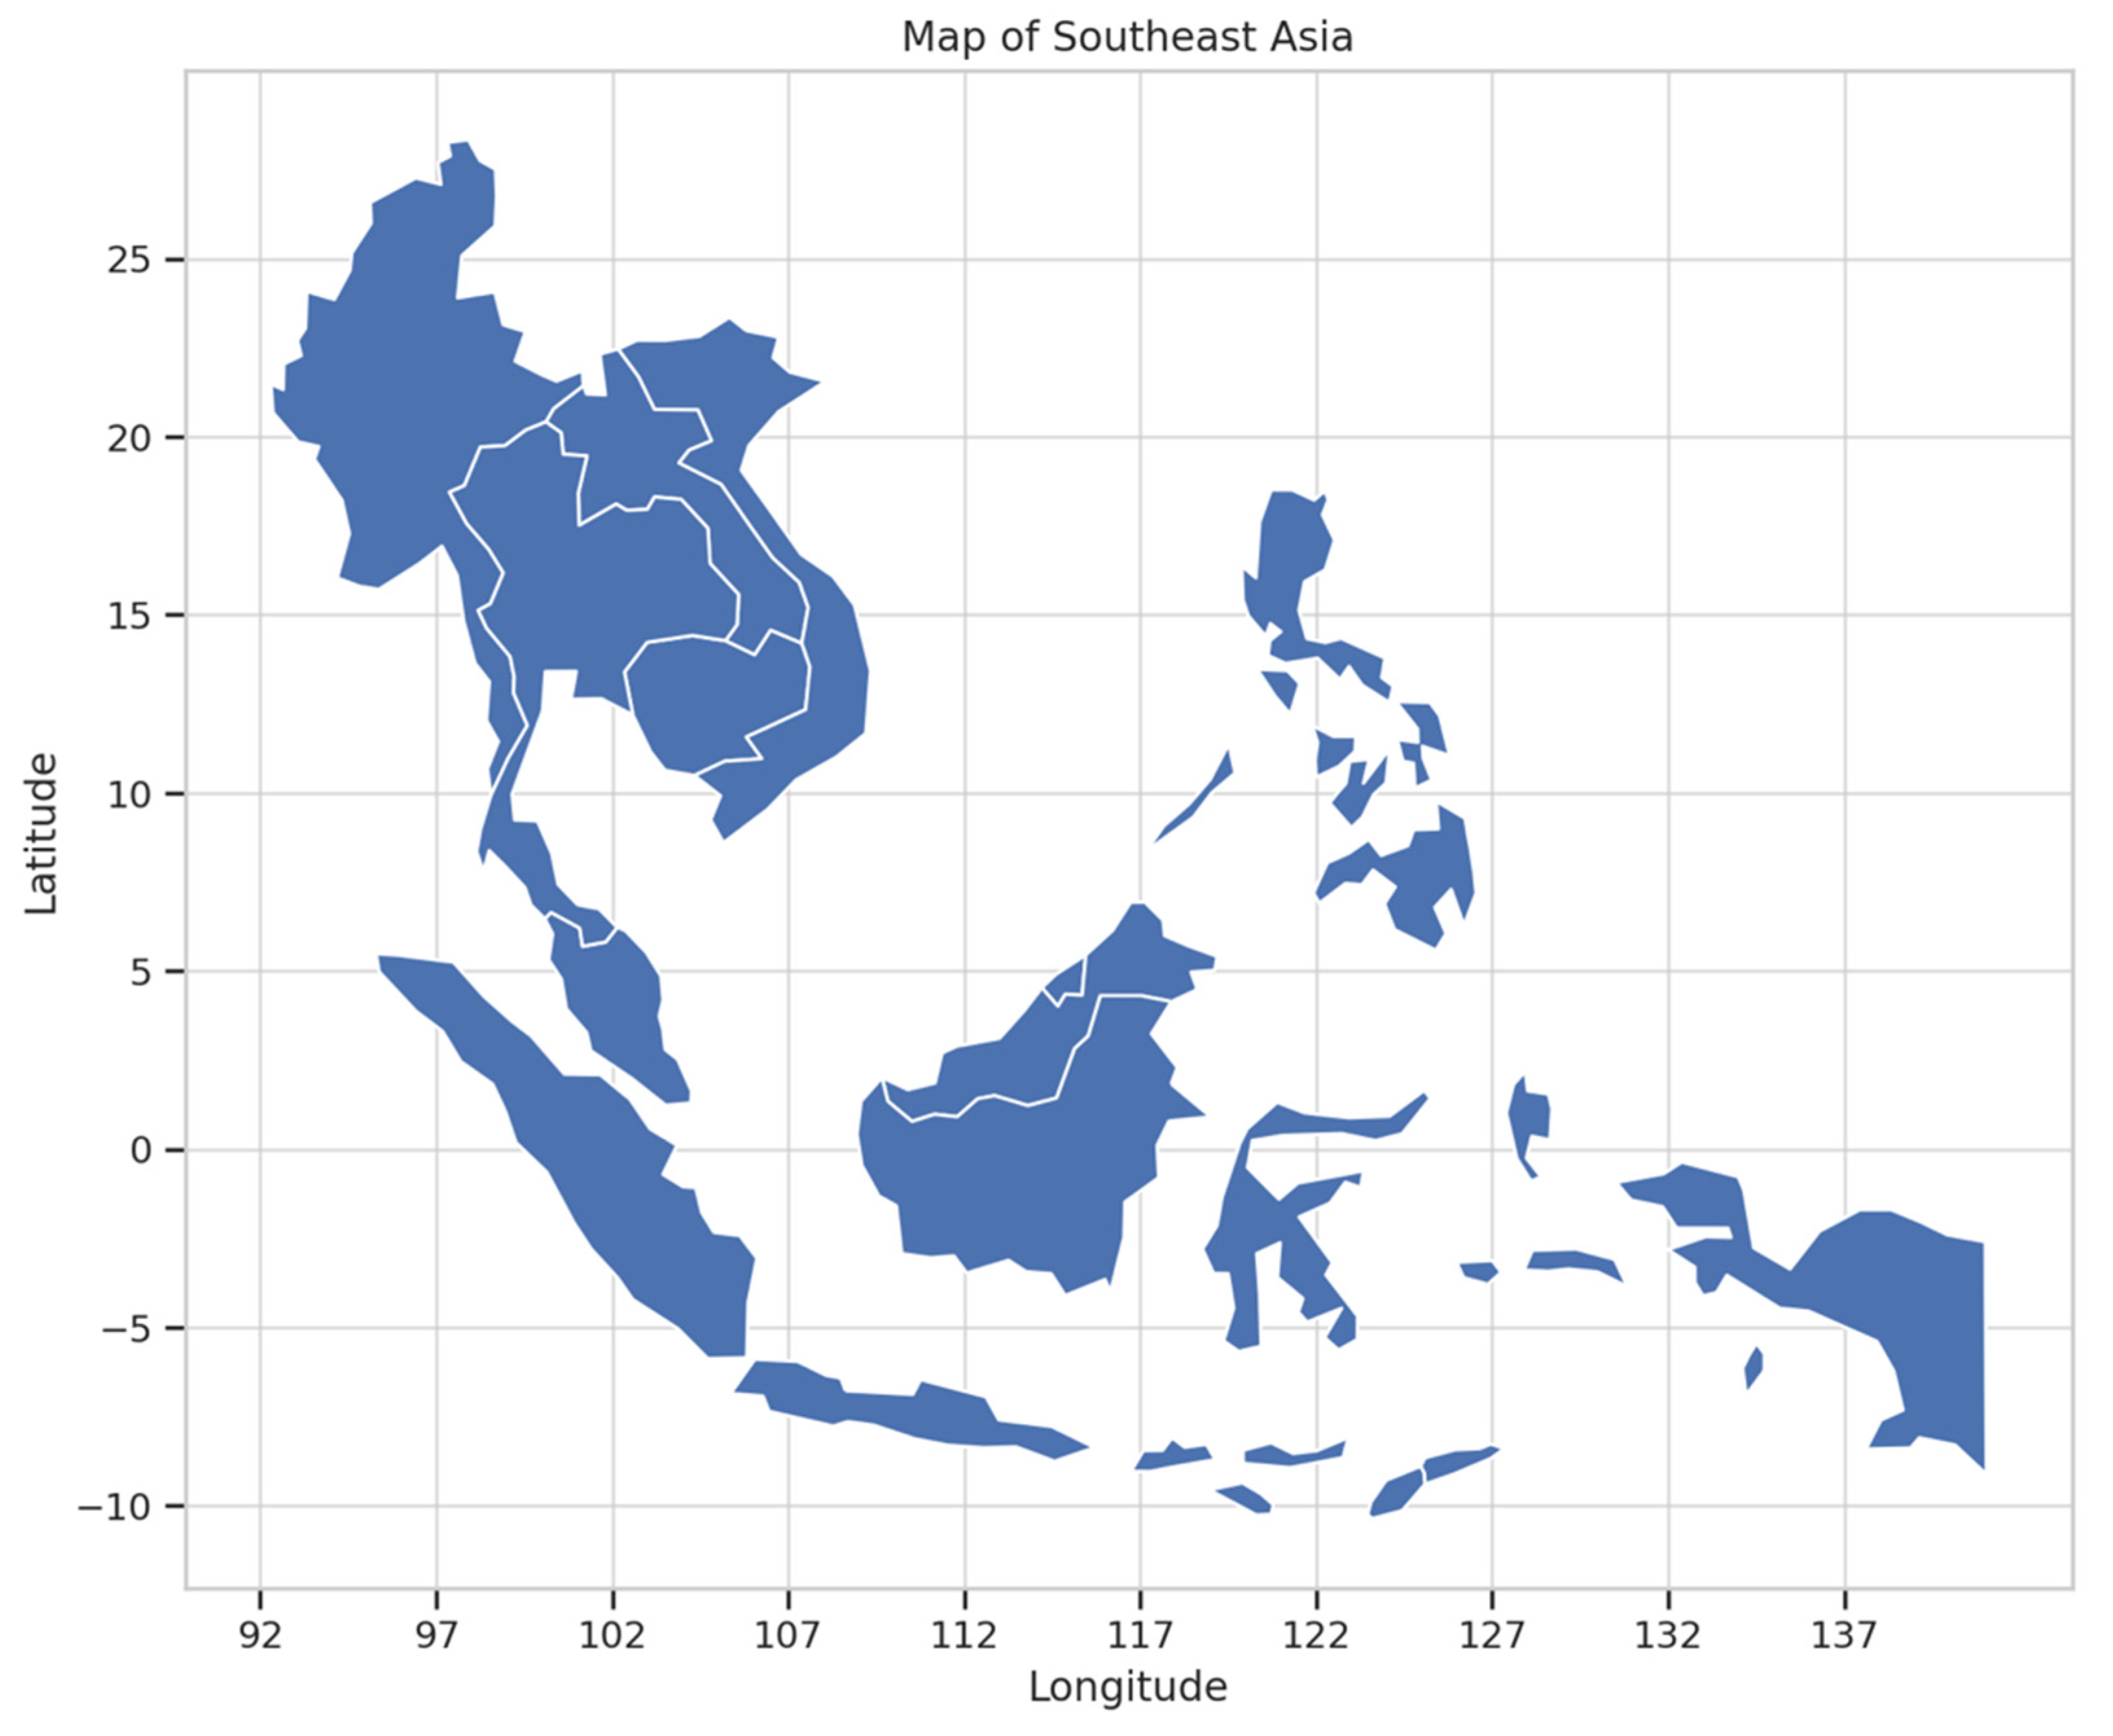
Southeast Asia is characterized by a wide range of geographical features and is situated between the Indian Ocean and the Pacific Ocean (Figure 1). The geographical area under scrutiny is characterized by its vast archipelagic topography, densely populated tropical forests, and extensive variety of rivers, all of which play a significant role in fostering various types of plants and animals, thereby giving rise to intricate ecological systems [22]. The climatic conditions prevailing in the region are primarily tropical in the environment, exhibiting elevated temperatures and humidity levels, alongside substantial seasonal precipitation patterns attributed to the monsoonal airflow. The prevailing environmental circumstances in this region are favorable for agriculture, albeit accompanied by challenges such as periodic flooding and sporadic drought. The relationship between agricultural productivity in Southeast Asia and the monsoonal cycles is intricately interconnected, as evidenced by the significant impact of fluctuations in the El Niño-Southern Oscillation on precipitation patterns and, consequently, crop yields [23]. Rice plays a pivotal role in the agricultural landscape of Southeast Asia, particularly in the Mekong and Red River deltas, which are globally renowned for their highly concentrated cultivation of this staple crop [24]. In contrast, the cultivation of maize, although not as widespread as that of rice, assumes a pivotal role in regions where the climatic and soil conditions are less conducive to rice production. Maize cultivation serves as a vital means to ensure food security and also functions as a lucrative cash crop [25]. The investigation of the relationship between climate and agricultural output in Southeast Asian countries is of great significance due to the pivotal role that agriculture plays in the region’s economies and cultures.
2.2. Data Description
- i.
- Weather data
The SPEI data utilized in this study are derived from the digital repository hosted by the esteemed Spanish National Research Council (Consejo Superior de Investigaciones Científicas, CSIC), which can be accessed through the following link: https://digital.csic.es/handle/10261/332007 (accessed on 1 February 2024). The details of the dataset were described in Vicent-Serrano et al. [26]. The dataset was compiled using meteorological variables, including precipitation, and temperature, from the Climatic Research Unit (CRU) TS 4.07 dataset [27,28], which is produced by the Climatic Research Unit at the University of East Anglia with a grid resolution of 0.5° latitude by 0.5° longitude. There have been several updates in this version. For example, the database for ground-based measurement was upgraded by enhancing data quality and coverage across several decades up to December 2022 [28]. At the same time, the primary meteorological variables, such as temperature, and precipitation, were also produced without significant change in methodology [28]. High-resolution gridding techniques were applied, converting anomalies to actual values [28]. The upgrade facilitated the estimation of the synthetic values for the secondary variables, increasing transparency and potentially reducing low-quality estimates from remote observation data [28]. The dataset also provided an improvement in methodology for estimating synthetic vapor pressure (VAP) data using temperature (TMP) and diurnal temperature range (DTR) station anomalies, which enhance the gridded distribution and accuracy of VAP data by generating artificial irregularities at the station level. Moreover, the interpolation method utilizes angular distance weighting (ADW) instead of the tri-angulation routines utilized in previous versions [28]. The SPEI utilizes the dry and wet classifications, which are consistent with the categories employed by the Standardized Precipitation Index (SPI) as presented in Table 1.
- ii.
- Crop production data
The crop production data, including for rice and maize, employed in this study were obtained from the Food and Agriculture Organization (FAO) [30], an internationally renowned organization committed to the compilation and distribution of agricultural and food-related statistical information. The primary data source comprises official statistics from FAO-participating countries, collected from annual production questionnaires (APQ), national publications, or official country websites. The source data could originate from surveys, administrative records, and expert observations. The type of source used by countries greatly impacts the reliability and comparability of data. Official production data provided by countries is typically recorded as reported by the country. When no data are available from official or unauthorized sources, the data are estimated. Data are marked in all instances. Countries typically utilize sample surveys, although administrative records are also employed in some instances. The aggregates are computed upon the completion of a statistical operation. The total sum for a collection of units is calculated by adding up the recorded values. The yield for the aggregated group is calculated by dividing the total output by the total input. The study used an average per capita production for both rice and maize, dividing the total harvested production of rice and maize by the entire population in the study area or period [30]. This dataset potentially provides agricultural productivity and food availability per person, indicating the efficiency of production and its potential effect on food security [30]. It also enables evaluating agricultural performance according to population needs, which is essential for comprehending food sustainability [30]. Moreover, the reliability of both rice and maize data used in this study is followed by the standard of FAO data-gathering procedures that sample surveys should encompass a minimum of 95% of the entire area and land dedicated to the specific crops being studied.
- iii.
- Data processing
The data processing steps were crucial for preparing the datasets for further analysis, allowing for additional investigations into the correlation between climate factors and crops in Southeast Asia. The data processing methodology included multiple essential processes to prepare the datasets for analysis. At first, netCDF was used to retrieve the Standardized Precipitation Evapotranspiration Index (SPEI) data, whereas CSV was used for crop productivity data. Xarray and netCDF4 Python packages were utilized to extract relevant details about SPEI values and spatial characteristics from the SPEI data saved in netCDF format. The crop production data in CSV format were processed using the Pandas package to read and preprocess the data, including managing missing values and maintaining data consistency.
A decision was reached to remove missing values from the datasets. This choice was made to preserve the reliability and accuracy of the data in subsequent analyses. Eliminating observations with missing values reduced the probability of bias or mistakes being triggered by imputation procedures. The dropna() method in the Pandas library efficiently filtered away rows with missing values in all columns, ensuring that only complete and reliable data were retained for analysis. This method was considered better since it reduced the possible influence of missing data on the analysis results, thereby improving the strength and dependability of the conclusions. Both the SPEI and agricultural productivity datasets were standardized to address the issue of differing scales among variables. The standardization method entailed adjusting the data to have a mean of 0 and a standard deviation of 1, ensuring that variables that had different scales had equal impact on the subsequent analysis.
2.3. SPEI
In this study, the meteorological variables including precipitation, and temperature with a resolution of 0.5° from the Climatic Research (CRU) TS3 dataset were used to estimate the SPEI from the difference (D) between precipitation (P) and potential evapotranspiration (PET) following Thornthwaite [31], in Equation (1)
where is the monthly precipitation (mm),
where is the monthly temperature from the daily data (°C), N is the number of days in the month, and L is the average day length of the month,
where I is the heat index as described in Equation (4),
where is the 12 monthly average temperatures.
While the estimation of the SPEI at difference time scale () was calculated as follows in Equation (5),
where k is the time scale of the aggregation, and n is the number of the estimation.
2.4. Empirical Orthogonal Function (EOF)
This study utilized Empirical Orthogonal Function (EOF) analysis to examine the spatiotemporal dynamics of the impact of drought on agricultural productivity by investigating the relationship between the Standardized Precipitation Evapotranspiration Index (SPEI), and crop productivities for rice and maize in Southeast Asia. EOF is a statistical methodology employed to decompose a dataset comprising multiple variables into mutually perpendicular components. It is a commonly utilized method in climate research and meteorology to examine spatiotemporal patterns and variability. Also, this analysis could reduce dimensions while preserving the variability of the data, which is beneficial for handling complex variables such as climate and crops. It also provides insights into the distribution and temporal evolution of climatic influences on crops in Southeast Asia.
The analysis of EOF provided a thorough evaluation of the spatiotemporal structure inherent in the dataset, facilitating the discernment of prevailing patterns in the relationship between drought and agricultural productivity. Each of these components serves to represent a unique mode of variation inherent within the dataset [32,33]. The methodology in controversy bears resemblance to Principal Component Analysis (PCA), albeit with a distinct focus on the analysis of spatiotemporal datasets [34,35,36,37]. Prior to the application of the EOF analysis, the datasets on the Standardized Precipitation Evapotranspiration Index (SPEI) and crops underwent a process of standardization.
To ensure uniform contribution from variables with differing scales and units, firstly, the SPEI and crop production data during 1970 to 2019 were combined. Subsequently, Singular Value Decomposition (SVD) was employed to decompose the data matrix into three matrixes as follows:
where U is the left singular vectors, Σ is the diagonal matrix of singular values, and is the right singular vector. To analyze the EOF patterns, they are shown in terms of the principal components (PCs) derived from the matrix, .
3. Results and Discussion
3.1. SPEI in Southeast Asia during 1970–2019
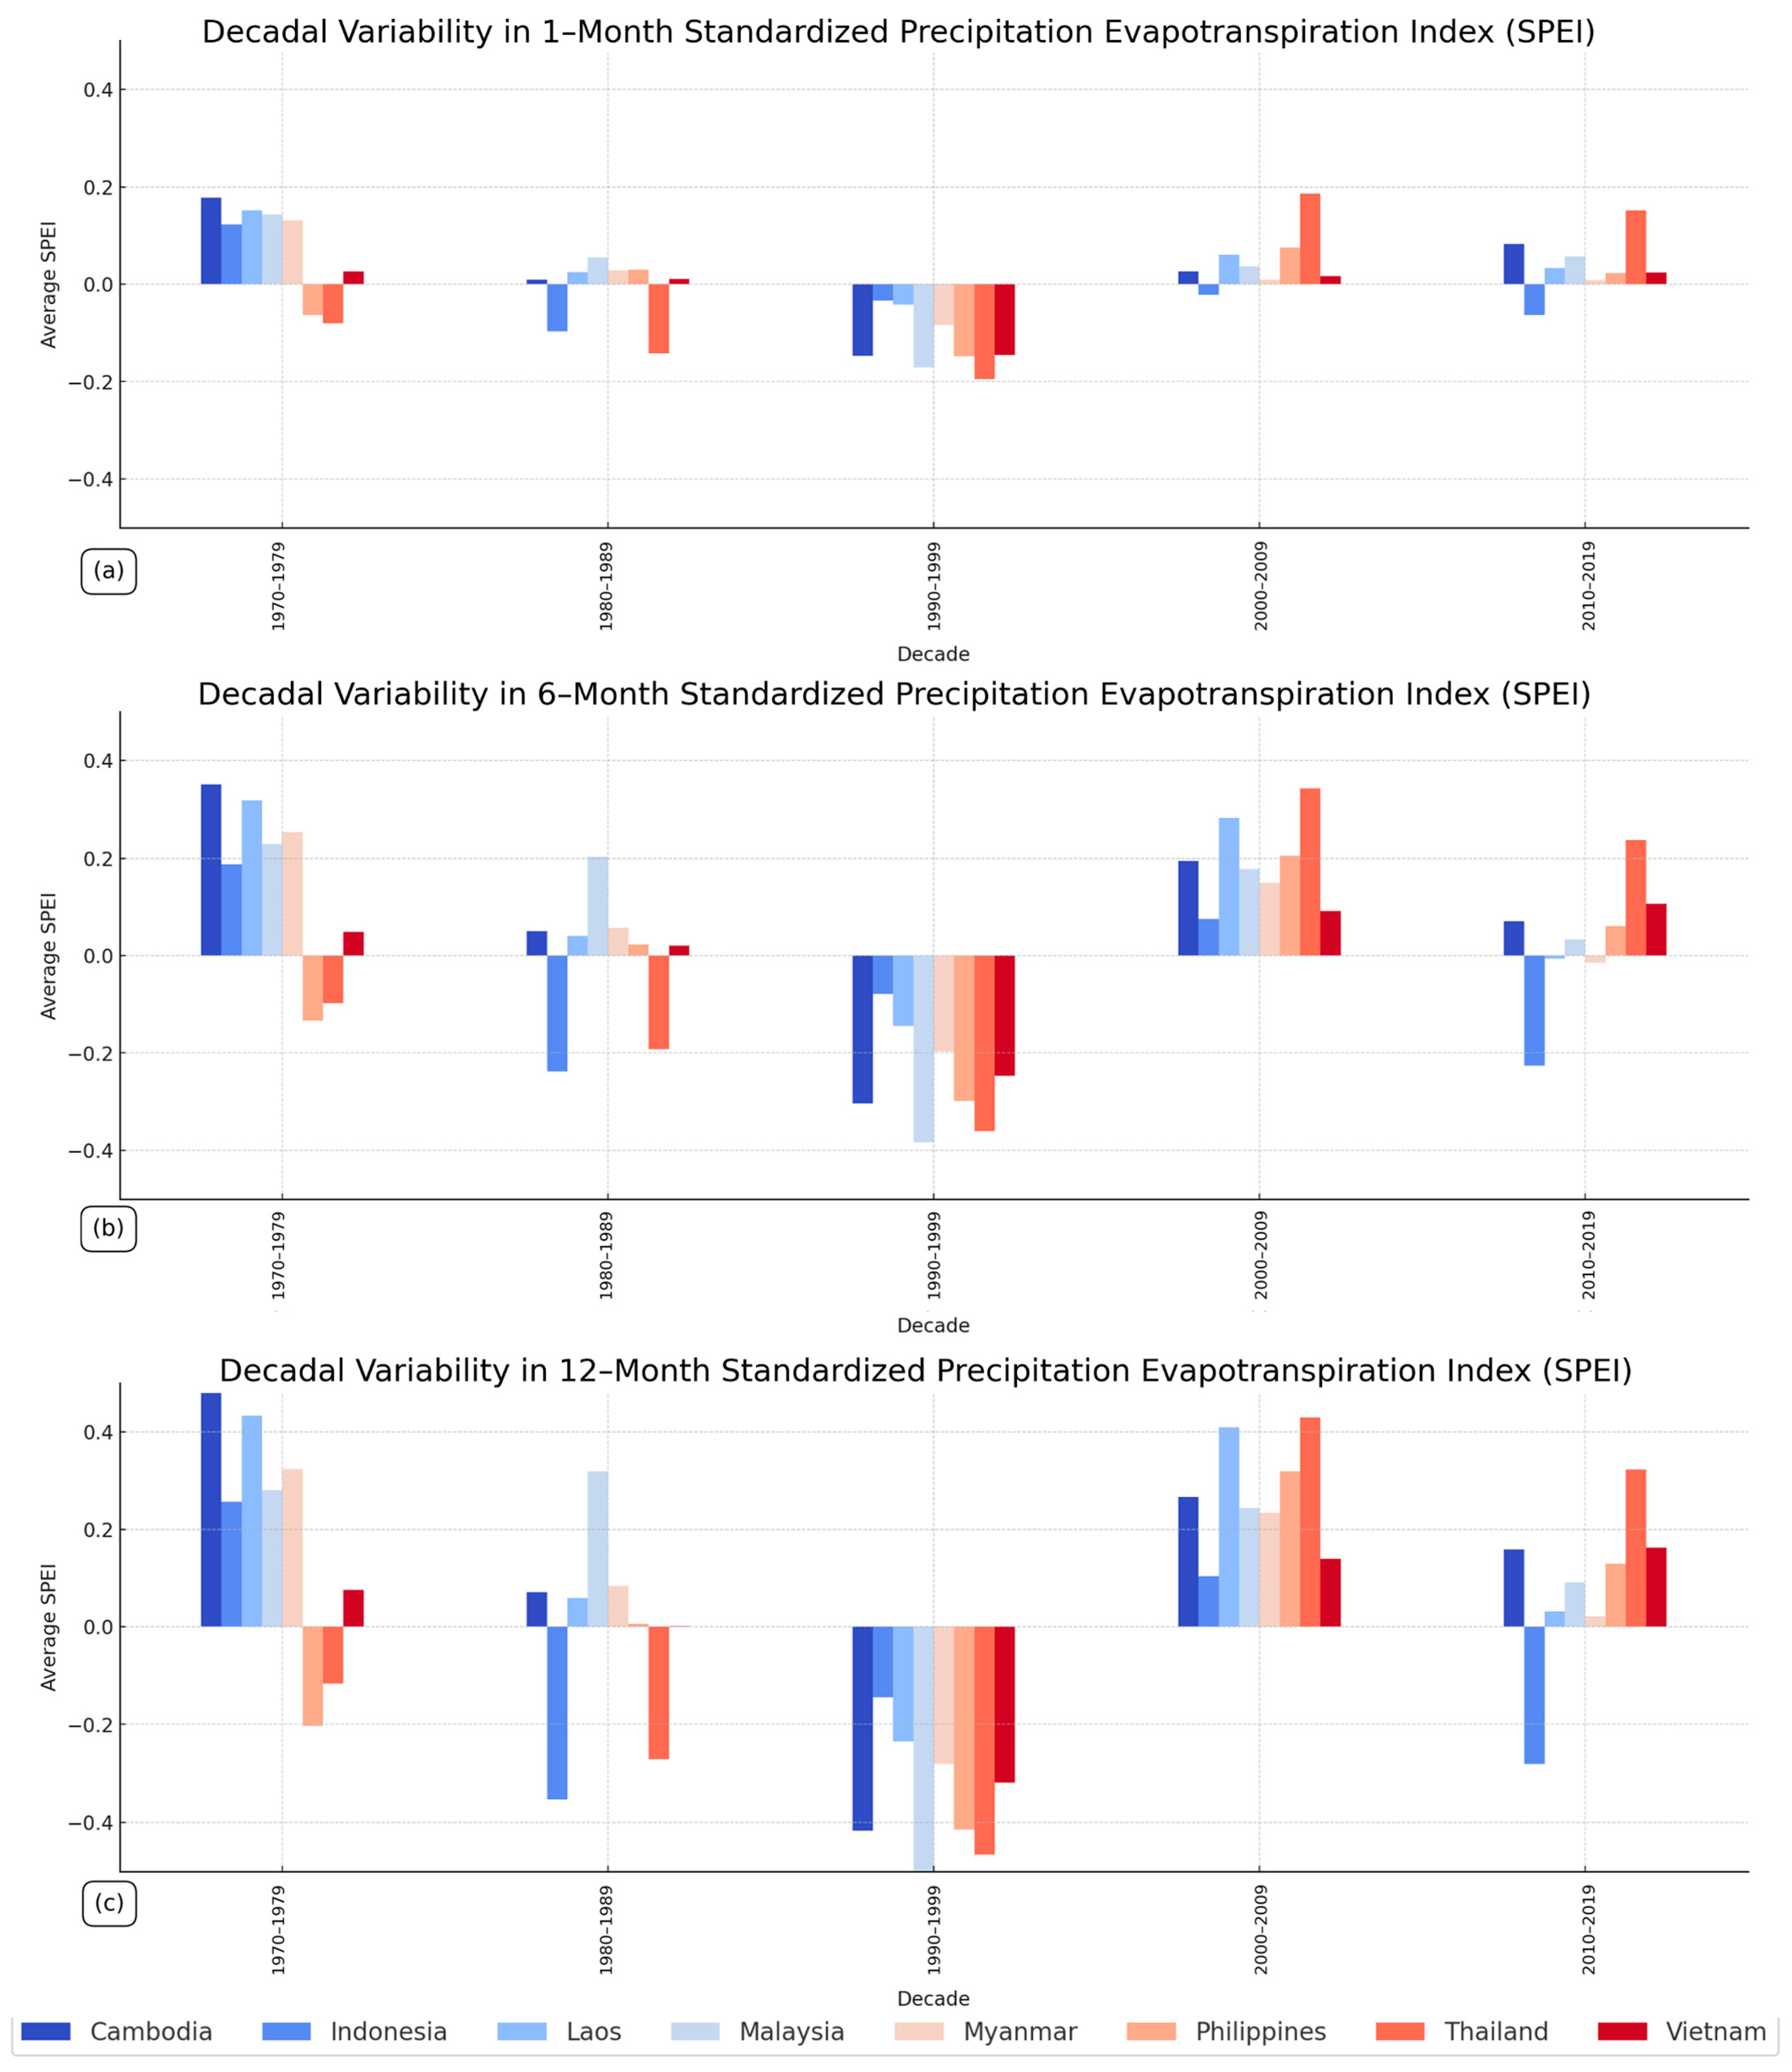
Figure 2 shows SPEI values at different time scales of 12 months, 6 months, and 1 month across Southeast Asia during the years 1970 to 2019. Notably, SPEI-12 exhibits the most fluctuation with an increase of 0.1 ± 0.05 per decade. While the decadal fluctuations of the SPEI across 12-, 3-, and 1-month time scales show a persistent and prevailing wet pattern in the Southeast Asian (Table 2), the decadal fluctuations of SPEI values were across a range of (−0.12)–(0.08), (−0.25)–(0.19), and (−0.35)–0.27 for 1 month, 6 months, and 12 months, respectively. In contrast, Southeast Asia faced dry episodes from 1980 to 1989 and 1990 to 1999. Meanwhile, the year 2000 was characterized as a wet episode. The decadal variation in SPEI values in Figure 3 across countries including Thailand, Myanmar, Laos, Cambodia, Vietnam, Malaysia, the Philippines, and Indonesia during the years 1970 to 2019 reveals a multifaceted and heterogeneous climate pattern in Southeast Asia. In the 1970s, the SPEI showed different levels of moisture in different parts of the country. Meanwhile, the 1980s were shown to exhibit a consistent continuation of a pattern where several countries had a tendency towards dry conditions, possibly indicating localized changes in the climate pattern. For the 1990s, there was a diverse pattern of precipitation, with some nations experiencing a slight rise in rain, some countries experiencing a slight increase in the rain, and others continuing to show a trend towards dryness. During the period of 2000 to 2009, there were noticeable variations in the SPEI in different counties. The variability persisted consistently from 2010 to 2019, with no clear dominant trend developing in terms of either increased drought or heightened precipitation levels.
Based on the above result, it suggests that there was noticeable variation in the moisture levels across Thailand and Malaysia over 1 month, indicating a dynamic weather pattern that likely implies short-term shifting of climate [38,39]. Particularly in the 1990s, a 6-month analysis revealed a drying pattern likely due to El Niño, which strongly influences weather patterns in Southeast Asia [40,41]. In addition, using a mesoscale perspective could reduce the temporary oscillations within 1 month, providing a thorough portrayal of the season of water resources and agriculture [42] by revealing decreased volatility in temporal trends, including the impact of prolonged weather conditions on agricultural cultivation and harvesting [43]. Also, the results indicate that many countries, including Indonesia and the Philippines have significant fluctuations in climate, suggesting a tendency for the annual oscillations within a 12-month period. This is likely due to the connections between oceanic-atmospheric dynamics and global climate changes, therefore affecting the trends of rainfall and temperature [26]. The 1990s experienced a significant lack of rainfall, likely due to the strong El Niño phenomena of 1997 to 1998, which substantially impacted local weather patterns; the SPEI provides a comprehensive, long-term perspective on this pattern by considering annual cycles in order to identify extended periods of drought or excessive moisture, indicating potential associations with the El Niño-Southern Oscillation phenomena [17,44,45].
Figure 4 displays the spatial pattern of the SPEI across time scales of 1 month, 6 months, and 12 months in Southeast Asia during the years 1970 to 2019. For the 1-month time scale, the averaged SPEI values are in the range of −1.0 to 1.0, indicating a moderate degree of dryness and humidity in many countries such as Thailand, Myanmar, Laos, Vietnam, Cambodia, Malaysia, and the Philippines. Conversely, Borneo and Sumatra islands experience predominantly dry conditions. The results indicate that the variation in the SPEI across different countries reflects the variability in monthly meteorological conditions [38], which enables the efficient development of timely solutions for agricultural planning, allocation of water resources, and the establishment of early warning systems for extreme weather events [46]. Both the 6-month and 12-month time scales suggest that many countries in Southeast Asia are experiencing mostly wet conditions, with SPEI values reaching up to 1.5. In contrast, Myanmar is unique in its phenomenon of dry conditions, as indicated by a SPEI value of −1.0. The 6-month SPEI indicates an understanding of the effects of extended wet or dry periods on crop cycles with significant seasonal fluctuations in precipitation [47]. A 12-month time frame enables the detection that extended periods of drought are higher than normal [48,49].
3.2. Rice and Maize Productivity in Southeast Asia during 1970–2019
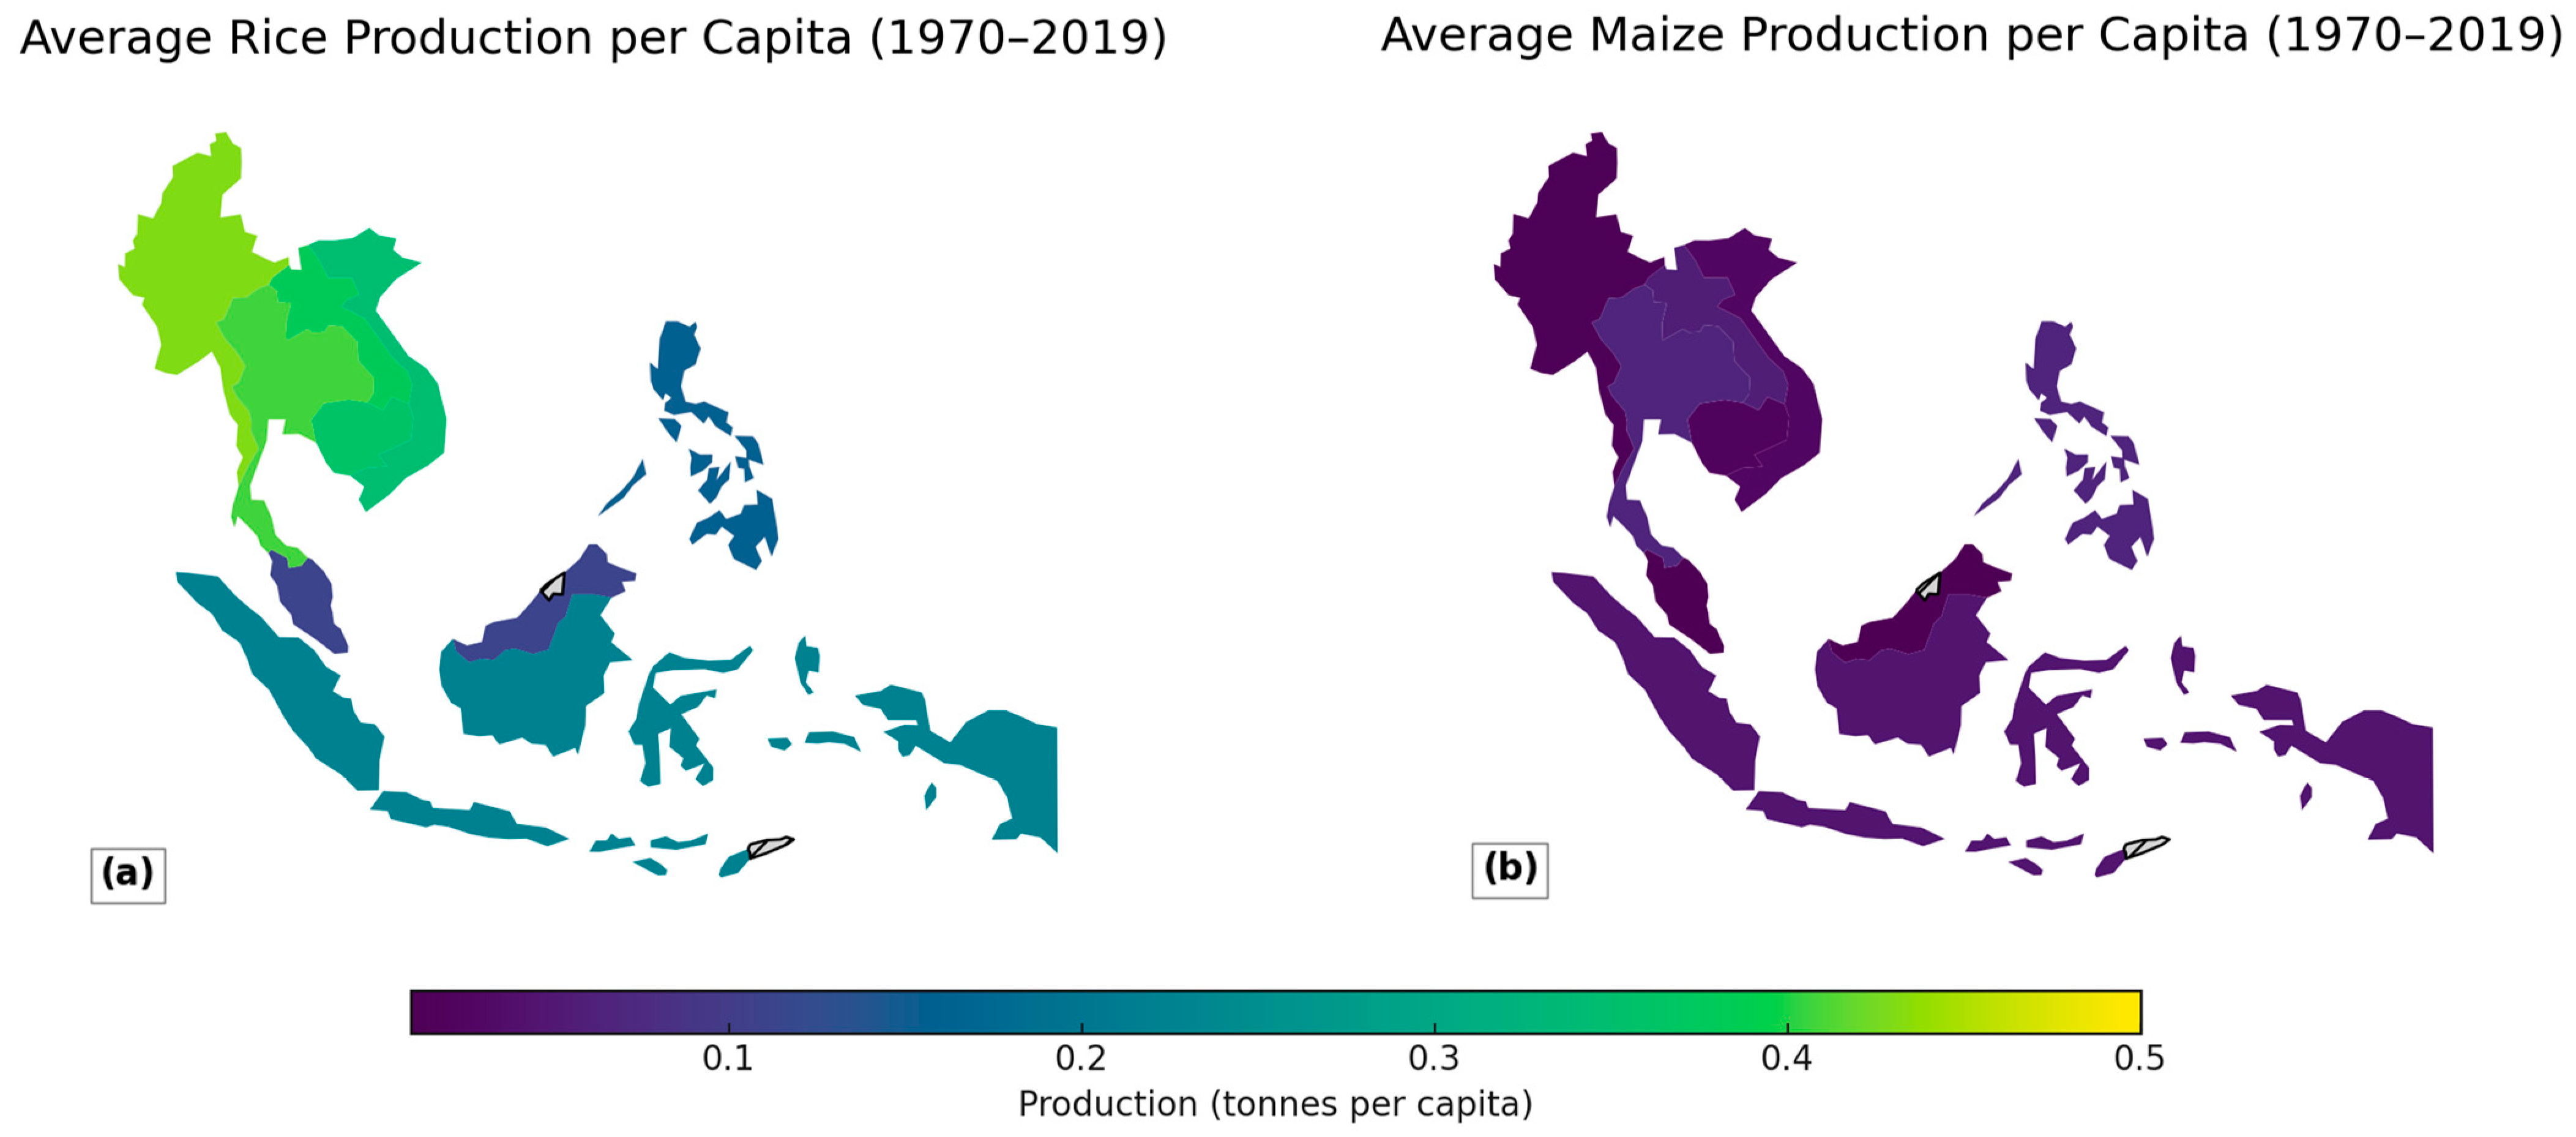
Figure 5 shows the spatial distribution of the average rice and maize productivities in Southeast Asia from 1970 to 2019. Many countries in mainland Southeast Asia, especially Thailand, Myanmar, Laos, Vietnam, and Cambodia, show a significant level of rice production, ranging from 0.4 to 0.5 tons per capita. Thailand and Indonesia show the maximum maize production, with a value of 0.1 tons per capita. Regions that have higher maize yields are likely related to locations that have optimal climate conditions for maize planting, such as regions with drier conditions or well-drained soils [50,51]. Figure 6 shows the analysis of the decadal variability in rice and maize production from 1970 to 2019. During the 1970s, there were significant differences in rice and maize production across the countries. In the 1980s, there was an increase in production in several countries. This is likely due to developments in agricultural technology and improved farming techniques [52,53,54]. In the 1990s, many countries showed a substantial increase in productivity, which continued to reinforce the existing trend. In the 2000s, there was a pattern that some countries experienced an increase in production. The variability could be related to multiple factors, including domestic agricultural policies, and economic and climate impacts, such as fluctuations in rainfall patterns [50]. In the 2010s, there were variations in the rice and maize productivities. These oscillations are likely due to the complicated interaction of several factors such as climate change, population, and agriculture technology [55].
3.3. Relationship between SPEI, RICE, and MAIZE in Southeast Asia
Figure 7 shows the annual rice and maize productivities, along with the SPEI in different time scales (1 month, 6 months, and 12 months) from 1970 to 2019. It shows that there has been an upward trend in both rice and maize production. The maxima for rice and maize productivities are 0.40 and 0.05 tons per capita, respectively. The production of both crops aligns with a positive trend in the SPEI across different time scales (12 months, 3 months, and 1 month), with values ranging from 0.1 to 0.4. Figure 7b shows the effect of the time scale on the reduction in the monthly oscillation, reflecting the significant effect of long-term climate change. Figure 7c also illustrates a summary of the climate pattern, with the 12-month SPEI effectively representing the annual climate patterns. It is crucial to take a broad view to properly understand the overall climate conditions over a year and how they collectively affect agricultural production [56].
The SPEI and crop productivities for maize and rice of the eight countries in Southeast Asia from 1970 to 2019 were obtained by performing an empirical orthogonal function (EOF) (Figure 8). The two primary components, namely PC1 and PC2, serve as the indicators of the prevailing patterns of the dataset. PC1 displayed variability across different countries and crops, including a positive orientation for rice and maize in Thailand, suggesting the heterogeneous nature of climate influences and a potential positive relationship with the SPEI. A difference in the magnitude of PC1 between the two crops is likely due to a differential susceptibility to the factors. The PC1 value pertaining to maize shows a statistically significant increase in comparison to rice, which suggests that maize production is more vulnerable to fluctuations in climate conditions as represented by the SPEI. For example, if the PC1 value is positive for maize and negative for rice, it suggests that maize agriculture is expected to do well under higher moisture levels, but rice development may be negatively impacted by similar conditions. PC2 showed a predominantly positive value for maize and rice, particularly in Myanmar and Malaysia. A significant PC2 score for rice cultivation may indicate rice production’s ability to resist specific climatic fluctuations that have a very minor impact, such as changes in seasonal precipitation patterns or temperature variances. Conversely, the PC2 values in Indonesia and the Philippines consistently show negativity, especially for maize. The positive PC2 values observed in Myanmar and Malaysia, as opposed to the negative values observed in Indonesia and the Philippines, highlight the regional differences in how secondary climatic factors affect agricultural productivity.
PC1 explained around 63% of the total variance in the Standardized Precipitation Evapotranspiration Index (SPEI) data, indicating its significant role in capturing the main patterns of variability in the climate of Southeast Asian countries. The significant variation ratio emphasizes the importance of PC1 in representing the main source of variability in the SPEI data and its impact on crop productivity. PC2 accounted for 19% of the in-general variance, providing additional comprehension of secondary patterns and relationships. Although PC2 explained less variance than PC1, its contribution is nonetheless significant in enhancing our comprehension of the complex relationships between climatic factors and agricultural results in the area.
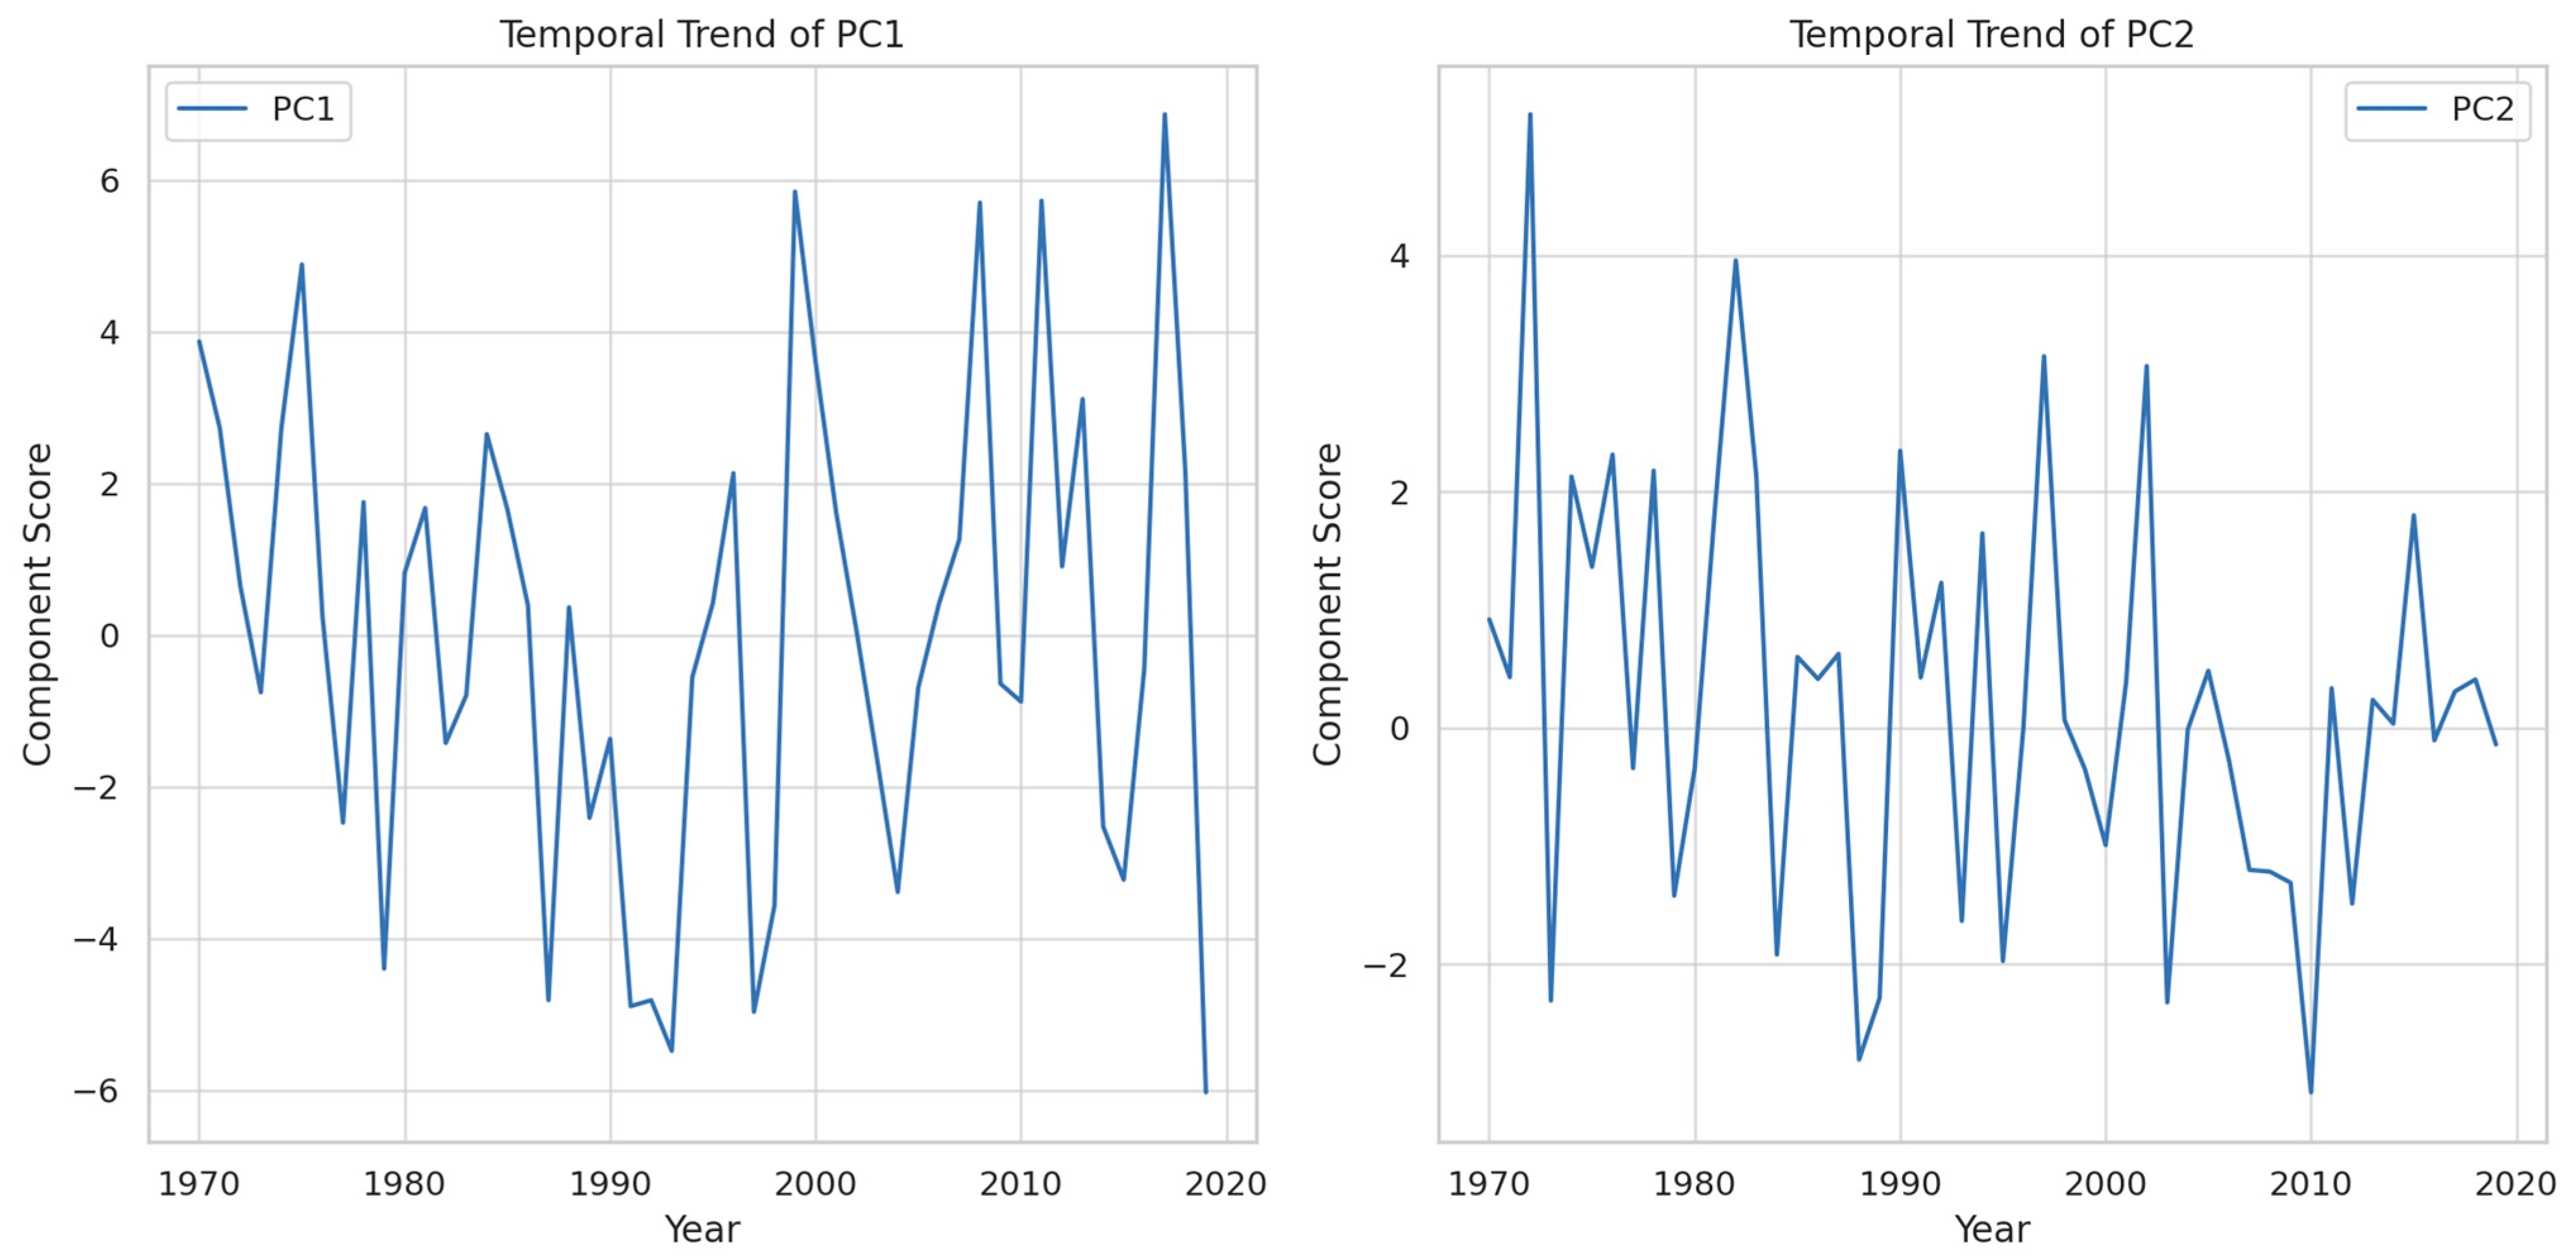
Figure 9 shows the temporal analysis of PC1 and PC2 from the SPEI and crop productivities from 1970 to 2019. The results illustrate that PC1 displayed a repetitive pattern for the entire time series, suggesting the pattern of climate oscillations, such as the El Niño-Southern Oscillation (ENSO) [3]. The periodic oscillations indicate a repetitive amplification and attenuation in the influence of climatic variables on agricultural yields [38]. The increase in PC1 for maize production in Vietnam suggests a positive correlation with improved crop yields, potentially related to La Niña phenomena [23]. In contrast, the upward trends in PC1 potentially signify intervals characterized by El Niño episodes. These climatic conditions have been known to have detrimental effects on rice cultivation in Cambodia [57]. The temporal patterns in PC1 serve to emphasize the imperative for agricultural systems to effectively adjust and accommodate the inherent fluctuations in climatic conditions [58]. Additionally, the optimization of irrigation practices may serve to ameliorate the effects of climatic variability [59,60].
PC2 displayed a pattern characterized by moderate fluctuations. The dynamics serve as discernible indicators of intricate climate interaction that exert an influence on the cultivation of crops [61]. For the Philippines, the correlation between the temporal dynamics of PC2 and rice production potentially attributed to regional climate anomalies, specifically the localized manifestations of the southwest monsoon or the ramifications of typhoon patterns on the archipelago [62,63]. In contrast, in Indonesia, the PC2 trend pertaining to maize production could potentially shed light on the significant impact exerted by soil moisture regimes, which play a crucial role in determining the viability of maize cultivation beyond paddy systems [64,65]. This underscores the need for resilience in the agricultural sector to effectively withstand the multifaceted impacts of climate change [66].
This study’s use of several primary components is beneficial because they are capable of capturing a variety of variances in the data. The fact that PC1 accounts for about 63% of the overall variation in the Standardized Precipitation Evapotranspiration Index (SPEI) data shows how important it is for understanding how climates change in Southeast Asian countries. PC2 explains an additional 19% of the variance. This indicates that PC2 captures additional or specific climate fluctuations that PC1 is not able to capture. Secondary patterns could be crucial for comprehending climatic occurrences, anomalies, or geographical variations that may have substantial consequences for crop yield.
Combining the two components provides a more thorough understanding. PC1 likely indicates widespread trends such as extended climate change or regular drought. On the other hand, PC2 can capture complex patterns of climate conditions in specific regions that may impact agricultural production. These differences are crucial for establishing a strong analytical framework that could help policymakers and farmers devise more efficient strategies for agricultural planning and adapting to climatic fluctuations. PC1 is important for finding the main source of variation, while PC2 is also important for finding other patterns that, while not adding much to the overall variation, could reveal important details about how climate change affects agriculture.
4. Conclusions
This study aims to investigate the effect of drought on crop productivity by analyzing the relationship between the SPEI and crop productivity, including rice and maize, using an empirical orthogonal function (EOF) in Southeast Asia during 1970–2019. The analysis of the SPEI indicates a noticeable variation in the moisture level in some countries, such as Thailand and Malaysia, within a 1-month time scale. A 6-month time scale also shows a noticeable trend, indicating a steady transition toward dryness throughout the specific time intervals, especially in the 1990s. Within a 12-month time scale, the results show a clear trend line, indicating significant changes in the climate patterns. Simultaneously, there were significant differences in rice and maize production across the countries during the 1970s. While an increase in crop production was found in many countries during the 1980s, a substantial increase in crop production was observed during the 1990s. The relationship analysis by using EOF suggests a potential positive correlation between the two crops and the climatic factors encapsulated by the SPEI. Especially maize production is more vulnerable to fluctuations in climate conditions, as represented by the SPEI. Also, the temporal analysis of the SPEI and crop productivity from 1970 to 2019 illustrates a repetitive pattern for the entire time series. This suggests that the pattern of climate oscillations, such as the El Niño-Southern Oscillation (ENSO), dominates agricultural yields in Southeast Asia.
Future research ought to encourage the employing of high-resolution regional climate models to predict future climate conditions and their possible effects on agriculture, permitting the development of more specific adaptation methods. Comprehensive studies regarding numerous staple and profitable crops should be conducted to comprehend the wider effects of climate variability on agricultural variety and food security. Studying the effectiveness of different adaptation and mitigation measures in agriculture to mitigate the negative impacts of climate change is necessary, with a focus on sustainable practices including water-efficient irrigation, drought-resistant crop types, and integrated pest management. Meanwhile, policymakers are encouraged to enhance rural infrastructure to promote effective water usage, decrease post-harvest losses, and improve market access. This will strengthen the agricultural value chain in the face of climatic variability. The skills and knowledge of farmers and agricultural stakeholders should be enhanced by providing education and training programs focused on climate-smart agriculture practices and technologies. To address the difficulties of climatic variability and drought, farmers should proactively implement multiple strategies to preserve their agricultural yield and secure their livelihoods. It is crucial to adopt climate-smart agricultural methods, such as diversifying crop varieties with drought-resistant and early-maturing species, and using agricultural conservation techniques. Effective water management techniques, such as using drip irrigation systems and building rainwater gathering structures, are essential for maximizing the exploitation of limited water resources. Crop diversification and rotation tactics can reduce risks by decreasing the reliance on a single crop and controlling pests and diseases, leading to more stable yields. Considering different ways of making a living, such as agroforestry or working off the farm, can offer extra sources of income, better protecting farmers against uncertainties caused by climate change.
Author Contributions
Conceptualization, T.A. and P.C.; methodology, T.A.; software, T.A.; validation, T.A.; formal analysis, T.A. and P.C.; investigation, T.A.; resources, T.A.; data curation, T.A.; writing—original draft preparation, T.A.; writing—review and editing, T.A. and P.C.; visualization, T.A.; supervision, T.A.; project administration, T.A. All authors have read and agreed to the published version of the manuscript.
Funding
This research was supported by University of Phayao and Thailand Science Research and Innovation Fund (Fundamental Fund 2024).
Data Availability Statement
The SPEI data are available at https://digital.csic.es/handle/10261/332007 (accessed on 1 February 2024), The rice and maize productivity data are available at https://www.fao.org/faostat/en/#data/QCL (accessed on 1 February 2024).
Acknowledgments
We wish to express our acknowledgment to the Food and Agriculture Organization for providing access to the FAOSTAT database and for its continued commitment to maintaining high data quality standards. We also acknowledgement the Spanish National Research Council for the SPEI data used in this study.
Conflicts of Interest
The authors declare no conflicts of interest.
References
- Schwabe, K.; Albiac, J.; Connor, J.D.; Hassan, R.M.; González, L.M. Drought in Arid and Semi-ARID Regions: A Multi-Disciplinary and Cross-Country Perspective; Springer: Berlin/Heidelberg, Germany, 2013. [Google Scholar]
- Amnuaylojaroen, T. Perspective on the Era of Global Boiling: A Future beyond Global Warming. Adv. Meteorol. 2023, 2023, 558060. [Google Scholar] [CrossRef]
- Jung, I.W.; Chang, H. Climate change impacts on spatial patterns in drought risk in the Willamette River Basin, Oregon, USA. Theor. Appl. Climatol. 2012, 108, 355–371. [Google Scholar] [CrossRef]
- Jenkins, K.; Warren, R. Quantifying the impact of climate change on drought regimes using the Standardised Precipitation Index. Theor. Appl. Climatol. 2015, 120, 41–54. [Google Scholar] [CrossRef]
- Dubrovsky, M.; Svoboda, M.D.; Trnka, M.; Hayes, M.J.; Wilhite, D.A.; Zalud, Z.; Hlavinka, P. Application of relative drought indices in assessing climate-change impacts on drought conditions in Czechia. Theor. Appl. Climatol. 2009, 96, 155–171. [Google Scholar] [CrossRef]
- Lee, D.-K.; Cha, D.-H.; Jin, C.-S.; Choi, S.-J. A regional climate change simulation over East Asia. Asia-Pac. J. Atmos. Sci. 2013, 49, 655–664. [Google Scholar] [CrossRef]
- Loo, Y.Y.; Billa, L.; Singh, A. Effect of climate change on seasonal monsoon in Asia and its impact on the variability of monsoon rainfall in Southeast Asia. Geosci. Front. 2015, 6, 817–823. [Google Scholar] [CrossRef]
- Manton, M.J.; Della-Marta, P.M.; Haylock, M.R.; Hennessy, K.; Nicholls, N.; Chambers, L.; Collins, D.; Daw, G.; Finet, A.; Gunawan, D.; et al. Trends in extreme daily rainfall and temperature in Southeast Asia and the South Pacific: 1961–1998. Int. J. Climatol. 2001, 21, 269–284. [Google Scholar] [CrossRef]
- Masud, M.B.; Soni, P.; Shrestha, S.; Tripathi, N.K. Changes in climate extremes over North Thailand, 1960–2099. J. Climatol. 2016, 2016, 4289454. [Google Scholar] [CrossRef]
- Amnuaylojaroen, T.; Chanvichit, P. Projection of near-future climate change and agricultural drought in Mainland Southeast Asia under RCP8.5. Clim. Chang. 2019, 155, 175–193. [Google Scholar] [CrossRef]
- Liang, X.Z.; Wu, Y.; Chambers, R.G.; Schmoldt, D.L.; Gao, W.; Liu, C.; Liu, Y.A.; Sun, C.; Kennedy, J.A. Determining climate effects on US total agricultural productivity. Proc. Natl. Acad. Sci. USA 2017, 114, E2285–E2292. [Google Scholar] [CrossRef]
- Troy, T.J.; Kipgen, C.; Pal, I. The impact of climate extremes and irrigation on US crop yields. Environ. Res. Lett. 2015, 10, 054013. [Google Scholar] [CrossRef]
- Zipper, S.C.; Qiu, J.; Kucharik, C.J. Drought effects on US maize and soybean production: Spatiotemporal patterns and his-torical changes. Environ. Res. Lett. 2016, 11, 094021. [Google Scholar] [CrossRef]
- Redfern, S.K.; Azzu, N.; Binamira, J.S. Rice in Southeast Asia: Facing risks and vulnerabilities to respond to climate change. Build Resil. Adapt. Clim. Change Agri. Sect. 2012, 23, 1–14. [Google Scholar]
- Amnuaylojaroen, T.; Parasin, N. The Future Extreme Temperature under RCP8.5 Reduces the Yields of Major Crops in Northern Peninsular of Southeast Asia. Sci. World J. 2022, 2022, 1410849. [Google Scholar] [CrossRef]
- Amnuaylojaroen, T.; Chanvichit, P.; Janta, R.; Surapipith, V. Projection of rice and maize productions in Northern Thailand under climate change scenario RCP8.5. Agriculture 2021, 11, 23. [Google Scholar] [CrossRef]
- Zhuang, J.; Suphachalasai, S.; Samson, J.N. The economics of climate change in Southeast Asia. Hum. Secur. Clim. Chang. Southeast Asia Manag. Risk Resil. 2012, 18, 18–42. [Google Scholar]
- Sekhar, C. Climate change and rice economy in Asia: Implications for trade policy. In The State of Agricultural Commodity Markets (SOCO); FAO: Rome, Italy, 2018. [Google Scholar]
- FAO. The impact of disasters and crises on agriculture and food security: 2021. In The Impact of Disasters and Crises on Agriculture and Food Security: 2021; FAO: Rome, Italy, 2021. [Google Scholar] [CrossRef]
- Wheeler, T.; Von Braun, J. Climate change impacts on global food security. Science 2013, 341, 508–513. [Google Scholar] [CrossRef] [PubMed]
- Lesk, C.; Rowhani, P.; Ramankutty, N. Influence of extreme weather disasters on global crop production. Nature 2016, 529, 84–87. [Google Scholar] [CrossRef] [PubMed]
- Gin, O.K.; Tuan, H.A. Early Modern Southeast Asia, 1350–1800; Routledge: London, UK, 2015. [Google Scholar]
- Wang, B. Rainy season of the Asian-Pacific summer monsoon. J. Clim. 2002, 15, 386–398. [Google Scholar] [CrossRef]
- Falvey, L. History of Rice in Southeast Asia and Australia. Rice: Origin, Antiquity and History; CRC Press: Boca Raton, FL, USA, 2010; pp. 183–224. [Google Scholar]
- Lal, M. Implications of climate change in sustained agricultural productivity in South Asia. Reg. Environ. Chang. 2011, 11 (Suppl. S1), 79–94. [Google Scholar] [CrossRef]
- Vicente-Serrano, S.M.; Beguería, S.; López-Moreno, J.I. A multiscalar drought index sensitive to global warming: The standard-ized precipitation evapotranspiration index. J. Clim. 2010, 23, 1696–1718. [Google Scholar] [CrossRef]
- Valiantzas, J.D. Simplified forms for the standardized FAO-56 Penman-Monteith reference evapotranspiration using limited weather data. J. Hydrol. 2013, 505, 13–23. [Google Scholar] [CrossRef]
- Harris, I.; Osborn, T.J.; Jones, P.; Lister, D. Version 4 of the CRU TS monthly high-resolution gridded multivariate climate da-taset. Sci. Data 2020, 7, 109. [Google Scholar] [CrossRef]
- Nikmatillah, V.M.; Anggraeni, D.; Hadi, A.F. Prediction interval in seasonal autoregressive integrated moving average (SARIMA) model for rainfall forecasting and drought. In Proceedings of the International Conference on Mathematics and Islam, Mataram, Indonesia, 3–5 August 2018. [Google Scholar] [CrossRef]
- Food and Agriculture Organization of the United Nations (FAO). 2023. Available online: https://www.fao.org/faostat/en/#data/QCL (accessed on 1 February 2024).
- Thornthwaite, C.W. An approach toward a rational classification of climate. Geogr. Rev. 1948, 38, 55–94. [Google Scholar] [CrossRef]
- Lorenz, E.N. Empirical Orthogonal Functions and Statistical Weather Prediction; MIT Department of Meteorology: Cambridge, MA, USA, 1956. [Google Scholar]
- Hannachi, A.; Jolliffe, I.T.; Stephenson, D.B. Empirical orthogonal functions and related techniques in atmospheric science: A review. Int. J. Climatol. 2007, 27, 1119–1152. [Google Scholar] [CrossRef]
- Jolliffe, I.T. Principal Component Analysis; Springer: Berlin/Heidelberg, Germany, 2002. [Google Scholar]
- North, G.R.; Bell, T.L.; Cahalan, R.F.; Moeng, F.J. Sampling errors in the estimation of empirical orthogonal functions. Mon. Weather Rev. 1982, 110, 699–706. [Google Scholar] [CrossRef]
- Monahan, A.H.; Fyfe, J.C.; Ambaum, M.H.; Stephenson, D.B.; North, G.R. Empirical orthogonal functions: The medium is the message. J. Clim. 2009, 22, 6501–6514. [Google Scholar] [CrossRef]
- von Storch, H.; Zwiers, F.W. Statistical Analysis in Climate Research; Cambridge University Press: Cambridge, UK, 1999. [Google Scholar]
- Heim, R.R., Jr. A review of twentieth-century drought indices used in the United States. Bull. Am. Meteorol. Soc. 2002, 83, 1149–1166. [Google Scholar] [CrossRef]
- Kurukulasuriya, P.; Rosenthal, S. Climate Change and Agriculture: A Review of Impacts and Adaptations; The International Bank for Reconstruction and Development/THE WORLD BANK: Washington, DC, USA, 2013. [Google Scholar]
- Kouadio, L.; Byrareddy, V.M.; Sawadogo, A.; Newlands, N.K. Probabilistic yield forecasting of robusta coffee at the farm scale using agroclimatic and remote sensing derived indices. Agric. For. Meteorol. 2021, 306, 108449. [Google Scholar] [CrossRef]
- Dai, A. Drought under global warming: A review. Wiley Interdiscip. Rev. Clim. Chang. 2011, 2, 45–65. [Google Scholar] [CrossRef]
- Eigenbrode, S.D.; Binns, W.P.; Huggins, D.R. Confronting climate change challenges to dryland cereal production: A call for collaborative, transdisciplinary research, and producer engagement. Front. Ecol. Evol. 2018, 5, 164. [Google Scholar] [CrossRef]
- Cook, B.I.; Mankin, J.S.; Anchukaitis, K.J. Climate change and drought: From past to future. Curr. Clim. Chang. Rep. 2018, 4, 164–179. [Google Scholar] [CrossRef]
- Taylor, K.E.; Stouffer, R.J.; Meehl, G.A. An overview of CMIP5 and the experiment design. Bull. Am. Meteoro-Log. Soc. 2012, 93, 485–498. [Google Scholar] [CrossRef]
- Spencer, R.W.; Braswell, W.D. The role of ENSO in global ocean temperature changes during 1955–2011 simulated with a 1D climate model. Asia-Pac. J. Atmos. Sci. 2014, 50, 229–237. [Google Scholar] [CrossRef]
- Lloyd-Hughes, B.; Saunders, M.A. A drought climatology for Europe. Int. J. Climatol. A J. R. Meteorol. Soc. 2002, 22, 1571–1592. [Google Scholar] [CrossRef]
- Beguería, S.; Vicente-Serrano, S.M.; Reig, F.; Latorre, B. Standardized precipitation evapotranspiration index (SPEI) revisited: Parameter fitting, evapotranspiration models, tools, datasets and drought monitoring. Int. J. Climatol. 2014, 34, 3001–3023. [Google Scholar] [CrossRef]
- McKee, T.B.; Doesken, N.J.; Kleist, J. (Eds.) The relationship of drought frequency and duration to time scales. In Proceedings of the 8th Conference on Applied Climatology, Anaheim, CA, USA, 17–22 January 1993. [Google Scholar]
- Wilhite, D.A. Drought as a Natural Hazard: Concepts and Definitions; Routledge Taylor and Francis Group: London, UK, 2000. [Google Scholar]
- FAO. The State of Food and Agriculture; Food and Agriculture Organization of the United Nations: Rome, Italy, 2016. [Google Scholar]
- Pingali, P. Westernization of Asian diets and the transformation of food systems: Implications for research and policy. Food Policy 2007, 32, 281–298. [Google Scholar] [CrossRef]
- Barker, R.; Herdt, R.W.; Rose, B. The Rice Economy of Asia; International Rice Research Institute (IRRI): Manila, Philippine, 1985. [Google Scholar]
- Pingali, P.L. Green revolution: Impacts, limits, and the path ahead. Proc. Natl. Acad. Sci. USA 2012, 109, 12302–12308. [Google Scholar] [CrossRef] [PubMed]
- Timmer, C.P. Rice and structural transformation. In Rice in the Global Economy: Strategic Research and Policy Issues for Food Security; International Rice Research Institute (IRRI): Manila, Philippine, 2010; pp. 37–60. [Google Scholar]
- International Panel on Climate Change (IPCC). Climate Change 2014: Impacts, Adaptation, and Vulnerability; Cambridge University Press: New York, NY, USA, 2014. [Google Scholar]
- Zhang, L.; Zhang, Z.; Zhang, J.; Luo, Y.; Tao, F. Response of rice phenology to climate warming weakened across China during 1981–2018: Did climatic or anthropogenic factors play a role? Environ. Res. Lett. 2022, 17, 064029. [Google Scholar] [CrossRef]
- Chhinh, N.; Millington, A. Drought monitoring for rice production in Cambodia. Climate 2015, 3, 792–811. [Google Scholar] [CrossRef]
- Liu, Z.; Qin, T.; Atienza, M.; Zhao, Y.; Nguyen, H.; Sheng, H.; Olukayode, T.; Song, H.; Panjvani, K.; Magalhaes, J.; et al. Constitutive basis of root system architecture: Uncovering a promising trait for breeding nutrient-and drought-resilient crops. Abiotech 2023, 4, 315–331. [Google Scholar] [CrossRef]
- Abram, N.J.; Henley, B.J.; Sen Gupta, A.; Lippmann, T.J.; Clarke, H.; Dowdy, A.J.; Sharples, J.J.; Nolan, R.H.; Zhang, T.; Wooster, M.J.; et al. Connections of climate change and variability to large and extreme forest fires in southeast Australia. Commun. Earth Environ. 2021, 2, 8. [Google Scholar] [CrossRef]
- FAO. Climate-Smart Agriculture Sourcebook; Food and Agriculture Organization of the United Nations: Rome, Italy, 2013. [Google Scholar]
- dos Santos, E.; Fortini, R.; Cardoso, L.; Zanuncio, J. Climate change in Brazilian agriculture: Vulnerability and adaptation assessment. Int. J. Environ. Sci. Technol. 2023, 20, 10713–10730. [Google Scholar] [CrossRef]
- Porter, J.R.; Semenov, M.A. Crop responses to climatic variation. Philos. Trans. R. Soc. B Biol. Sci. 2005, 360, 2021–2035. [Google Scholar] [CrossRef] [PubMed]
- Wassmann, R.; Jagadish, S.V.K.; Sumfleth, K.; Pathak, H.; Howell, G.; Ismail, A.; Serraj, R.; Redona, E.; Singh, R.K.; Heuer, S. Regional vulnerability of climate change impacts on Asian rice production and scope for adaptation. Adv. Agron. 2009, 102, 91–133. [Google Scholar]
- Sharma, G.; Shrestha, S.; Kunwar, S.; Tseng, T.-M. Crop diversification for improved weed management: A review. Agriculture 2021, 11, 461. [Google Scholar] [CrossRef]
- Gruere, G.P.; Bouët, A.; Mevel, S. Genetically Modified Food and International Trade: The Case of India, Bangladesh, Indonesia, and the Philippines; International Food Policy Research Institute: Washington, DC USA, 2007. [Google Scholar]
- FAO. Building Agricultural Resilience to Climate Variability; Food and Agriculture Organization of the United Nations: Rome, Italy, 2021. [Google Scholar]
Figure 1.
Study area.

Figure 2.
Time series of the Standardized Precipitation Evapotranspiration Index (SPEI) across Southeast Asia from 1970 to 2019 across three different timescales: 1-month, 6-month, and 12-month.
Figure 2.
Time series of the Standardized Precipitation Evapotranspiration Index (SPEI) across Southeast Asia from 1970 to 2019 across three different timescales: 1-month, 6-month, and 12-month.

Figure 3.
The Standardized Precipitation Evapotranspiration Index across different time scales: (a) 1-month, (b) 6-month, and (c) 12-month for Southeast Asian countries during the years 1970 to 2019.
Figure 3.
The Standardized Precipitation Evapotranspiration Index across different time scales: (a) 1-month, (b) 6-month, and (c) 12-month for Southeast Asian countries during the years 1970 to 2019.

Figure 4.
The spatial distribution of the average Standardized Precipitation Evapotranspiration Index (SPEI) across different time periods during 1970–2019: (a) 1 month (b) 6 months, and (c) 12 months.
Figure 4.
The spatial distribution of the average Standardized Precipitation Evapotranspiration Index (SPEI) across different time periods during 1970–2019: (a) 1 month (b) 6 months, and (c) 12 months.

Figure 5.
The average rice production per capita for countries in Southeast Asia across during 1970–2019 for (a) rice and (b) maize.
Figure 5.
The average rice production per capita for countries in Southeast Asia across during 1970–2019 for (a) rice and (b) maize.

Figure 6.
Decadal variability in rice productivity per capita for (a), rice, and (b) maize across countries in Southeast Asia.
Figure 6.
Decadal variability in rice productivity per capita for (a), rice, and (b) maize across countries in Southeast Asia.

Figure 7.
Time series of annual rice and maize production per capita and SPEI between 1970 and 2019 for (a) 1-month time scale, (b) 6-month time scale, and (c) 12-month time scale.
Figure 7.
Time series of annual rice and maize production per capita and SPEI between 1970 and 2019 for (a) 1-month time scale, (b) 6-month time scale, and (c) 12-month time scale.

Figure 8.
The values of the first two principal components (PC1 and PC2) for each country-crop combination.
Figure 8.
The values of the first two principal components (PC1 and PC2) for each country-crop combination.

Figure 9.
The temporal analysis of the first two principal components (PC1 and PC2).


Table 1.
The Standardized Precipitation Evapotranspiration Index (SPEI) drought index reproduced from [29].
Table 1.
The Standardized Precipitation Evapotranspiration Index (SPEI) drought index reproduced from [29].
| Drought Severity Classification | Definition |
|---|---|
| Extreme wet | A scenario where SPEI values are higher than 2.0, indicating notably higher moisture than normal. |
| Severe wet | A scenario where SPEI values are between 1.50 and 1.99, indicating moisture levels considerably above normal. |
| Moderate wet | A scenario where SPEI values are between 1.00 and 1.49, indicating slightly higher than normal moisture levels. |
| Normal | A scenario where SPEI values are between −0.99 and 0.99, indicating balanced moisture conditions |
| Moderate drought | A scenario where SPEI values are between −1.00 and −1.49, indicating that the onset of dry conditions could lead to drought if prolonged |
| Severe drought | A scenario where SPEI values are between −1.50 and −1.99, indicating a serious drought condition that requires attention to prevent worsening impacts |
| Extreme drought | A scenario where SPEI values are less than −2.00, indicating extremely low moisture levels that characterize extreme drought conditions |
Table 2.
Decadal variability in Standardized Precipitation Evapotranspiration Index (SPEI) values on 12-, 6-, and 1-month time scales in Southeast Asia.
Table 2.
Decadal variability in Standardized Precipitation Evapotranspiration Index (SPEI) values on 12-, 6-, and 1-month time scales in Southeast Asia.
| Decade | 1-Month | 6-Month | 12-Month |
|---|---|---|---|
| 1970–1979 | 0.08 | 0.14 | 0.19 |
| 1980–1989 | −0.01 | 0.00 | −0.01 |
| 1990–1999 | −0.12 | −0.25 | −0.35 |
| 2000–2009 | 0.05 | 0.19 | 0.27 |
| 2010–2019 | −0.01 | 0.03 | 0.08 |
Disclaimer/Publisher’s Note: The statements, opinions and data contained in all publications are solely those of the individual author(s) and contributor(s) and not of MDPI and/or the editor(s). MDPI and/or the editor(s) disclaim responsibility for any injury to people or property resulting from any ideas, methods, instructions or products referred to in the content. |
© 2024 by the authors. Licensee MDPI, Basel, Switzerland. This article is an open access article distributed under the terms and conditions of the Creative Commons Attribution (CC BY) license (https://creativecommons.org/licenses/by/4.0/).
Share and Cite
MDPI and ACS Style
Amnuaylojaroen, T.; Chanvichit, P. Historical Analysis of the Effects of Drought on Rice and Maize Yields in Southeast Asia. Resources 2024, 13, 44. https://doi.org/10.3390/resources13030044
AMA Style
Amnuaylojaroen T, Chanvichit P. Historical Analysis of the Effects of Drought on Rice and Maize Yields in Southeast Asia. Resources. 2024; 13(3):44. https://doi.org/10.3390/resources13030044
Chicago/Turabian StyleAmnuaylojaroen, Teerachai, and Pavinee Chanvichit. 2024. "Historical Analysis of the Effects of Drought on Rice and Maize Yields in Southeast Asia" Resources 13, no. 3: 44. https://doi.org/10.3390/resources13030044
Note that from the first issue of 2016, this journal uses article numbers instead of page numbers. See further details here.