Article

A Techno-Economic Analysis of Natural Gas Valuation in the Amazon Region to Increase the Liquefied Petroleum Gas (LPG) Production in Ecuador

Grupo de Investigación Aplicada en Materiales y Procesos (GIAMP), School of Chemical Sciences and Engineering, Yachay Tech University, Hacienda San José s/n y Proyecto Yachay, Urcuquí 100119, Ecuador
*
Author to whom correspondence should be addressed.
Resources 2023, 12(8), 91; https://doi.org/10.3390/resources12080091
Submission received: 3 July 2023 / Revised: 27 July 2023 / Accepted: 31 July 2023 / Published: 2 August 2023

Abstract

:
Liquefied petroleum gas (LPG) is a C3/C4’s hydrocarbon mixture used as fuel gas, obtained through natural gas processing or crude oil refining. The Ecuadorian LPG production (~1.88 MMbbl/year) comes from the Shushufindi gas plant and the Esmeraldas refinery. However, LPG production cannot meet the Ecuadorian market demand, and over 90% of this commodity is imported. At the same time, the natural gas produced in the Amazon region is not fully valued. A significant quantity of the associated gas is flared (~100 MMscfd), representing wasted energy with a significant environmental impact. Therefore, this study aimed to develop a technical and economic assessment of the potential natural gas valuation in the Amazon region to increase LPG production. The study started with a detailed review of the associated gas produced in the Amazon region. The data were analyzed considering the geographic location of the hydrocarbon fields, molar composition, flowrates, and operational conditions. Then, a natural gas value chain visualization was proposed and technically analyzed. Finally, an economic feasibility (class V) study was conducted, considering a preliminary analysis of capital expenditure (CAPEX) and an economic balance. The outcome of this study showed that by processing 21.50 MMscfd of associated gas from the Sacha field, domestic LPG production could increase by 30.9%. The required infrastructure consists of conventional processes for natural gas processing, with an estimated CAPEX of 36.6 MMUSD. Furthermore, despite the domestic subsidies of commodities, the potential savings for the country would be 32.13 MMUSD/year, an alternative more economically viable than the current LPG imports. Thus, the investment cost will be justified.

1. Introduction

Natural gas (NG) is one of the principal energy sources worldwide. It is also considered one of the cleanest, safest, and most useful energy sources. Owing to the increase in energy demand and the constant new policies of a lower-carbon economy, NG is becoming a convenient fuel, especially for power generation [1]. For 2022, NG supplied approximately 24% of the global primary energy, just after the crude oil and coal sources [2]. Natural gas processing is more straightforward and less complex than crude oil processing and refining [3]. Additionally, natural gas is essential for the petrochemistry industry as a raw material. Natural gas processing can produce fuel derivatives and primary feedstocks for producing ethylene, propylene, the manufacture of light olefins, and other petrochemistry products [4]. Liquefied petroleum gas (LPG) is a hydrocarbon mixture primarily composed of propane (C3) and butanes (C4´s) used as fuel gas. LPG comes from natural gas processing or crude oil refining [5]. LPG is widely used for residential, commercial, and industrial applications.
Worldwide, oil extraction yields associated gas, which, in some instances, is used to produce natural gas liquids, fuel for the turbines on-site, or well reinjection [6]. However, the largest source of gas flaring came from associated gas. Gas flaring is the burning of associated gas because of many issues, such as market and economic limitations, lack of appropriate infrastructure and regulations, and even political will. This burning practice releases pollutants, including carbon dioxide, methane, and black carbon [7,8]. Gas flaring is identified as a source of greenhouse gas emissions [9]. The World Bank estimates that in 2022, ~4.9 trillion cubic feet (~4.9 TCF) of natural gas were flared globally [10]. As this practice is identified as a waste of valuable resources with a considerable environmental impact, all attempts should be made to maximize energy efficiency and reduce flaring to the lowest amount and only for technical reasons and safety [9,11]. In the Ecuadorian Amazon region, associated gas is widely produced as a by-product of crude oil extraction. The efforts to take advantage of associated gas and improve energy efficiency have attracted attention in recent years. However, the Amazon region still flares large quantities of associated gas [12].
This study focused on natural gas valuation in the Ecuadorian Amazon region to take advantage of the associated gas produced to ensure and increase domestic LPG production, reduce the import dependency on this commodity, and reduce the amount of gas flaring and its environmental impact in the Amazon region. Hence, the present study started with reviewing and analyzing the associated gas produced in the Amazon region. Then, a valuation of the associated gas was visualized. Subsequently, a technical analysis was performed to take advantage of natural gas, considering the available techniques for gas processing. Finally, an economic feasibility (class V) study was conducted, considering a preliminary analysis of capital expenditure (CAPEX) and an economic balance.

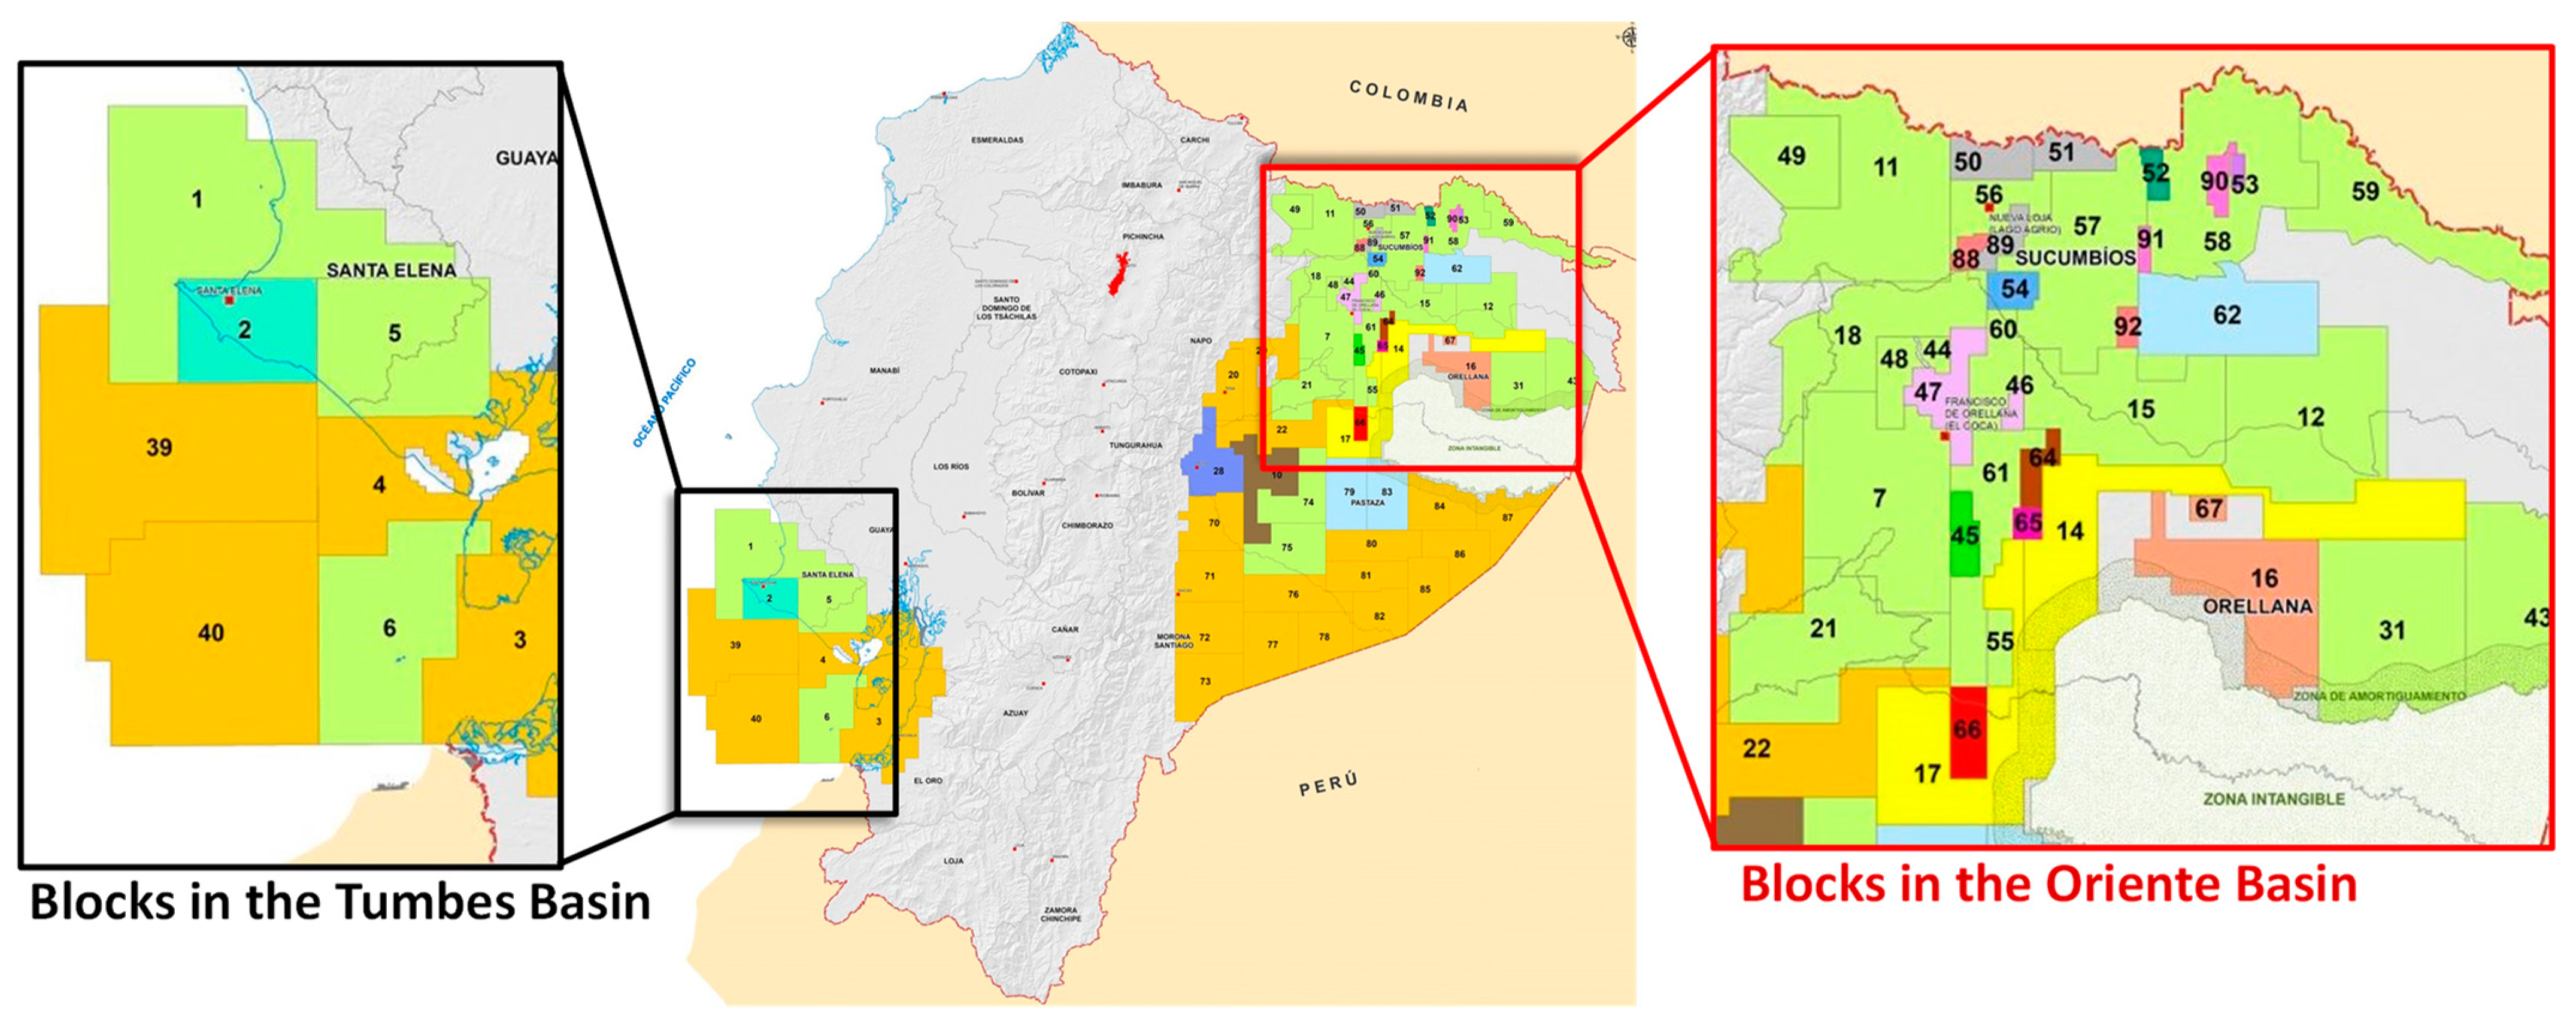
2. Natural Gas Industry in Ecuador: A Brief Review

The hydrocarbon resources in Ecuador (Figure 1) are mainly spread out in the Oriente Basin (Amazon region) and less in the Tumbes Basin (southwest of the country) [13]. These resources are divided into various blocks: geographic area divisions containing oil and gas fields with different wells where the oil and gas production is conducted. In Ecuador, natural gas production comes from non-associated gas extraction and oil extraction as associated gas.
Non-associated gas is produced in the Amistad field (block 6), an offshore facility in southwestern Ecuador, specifically in the Gulf of Guayaquil. The gas produced in this field for 2022 was 8404.4 MMscf, which implied around 23.0 MMscf per day [15]. First, the water content in the natural gas is reduced in a dehydration plant located in Bajo Alto (El Oro province). Then, the natural gas is delivered mainly to the Termogas Machala power plant and the remainder to the Bajo Alto liquefaction plant. Termogas Machala plant uses natural gas for electricity generation. Bajo Alto plant processes the natural gas into liquefied natural gas (LNG) to sell it mainly to the ceramic industry and a small quantity to other industries and residential sectors in the domestic market [14].
Associated gas is widely generated along the Amazon region, directly related to crude oil extraction. In this region, the associated gas production reported for 2022 was 33,101.8 MMscf [15]. In recent years, efforts to take advantage of this gas and improve energy efficiency have drawn attention by using this resource for electricity generation (within a few fields) and producing derived products. However, ~100 MMscfd of associated gas still flared daily [16,17]. There is still a considerable amount of gas flaring in the region, which is considered a waste resource and a cause of environmental pollution. Since gas flaring has negatively affected the health of the local inhabitants of the region, there have been legal drawbacks between the local communities and the hydrocarbon companies. The communities seek that companies aim to reduce gas flaring and change the present gas release technology, which wastes considerable energy [18].

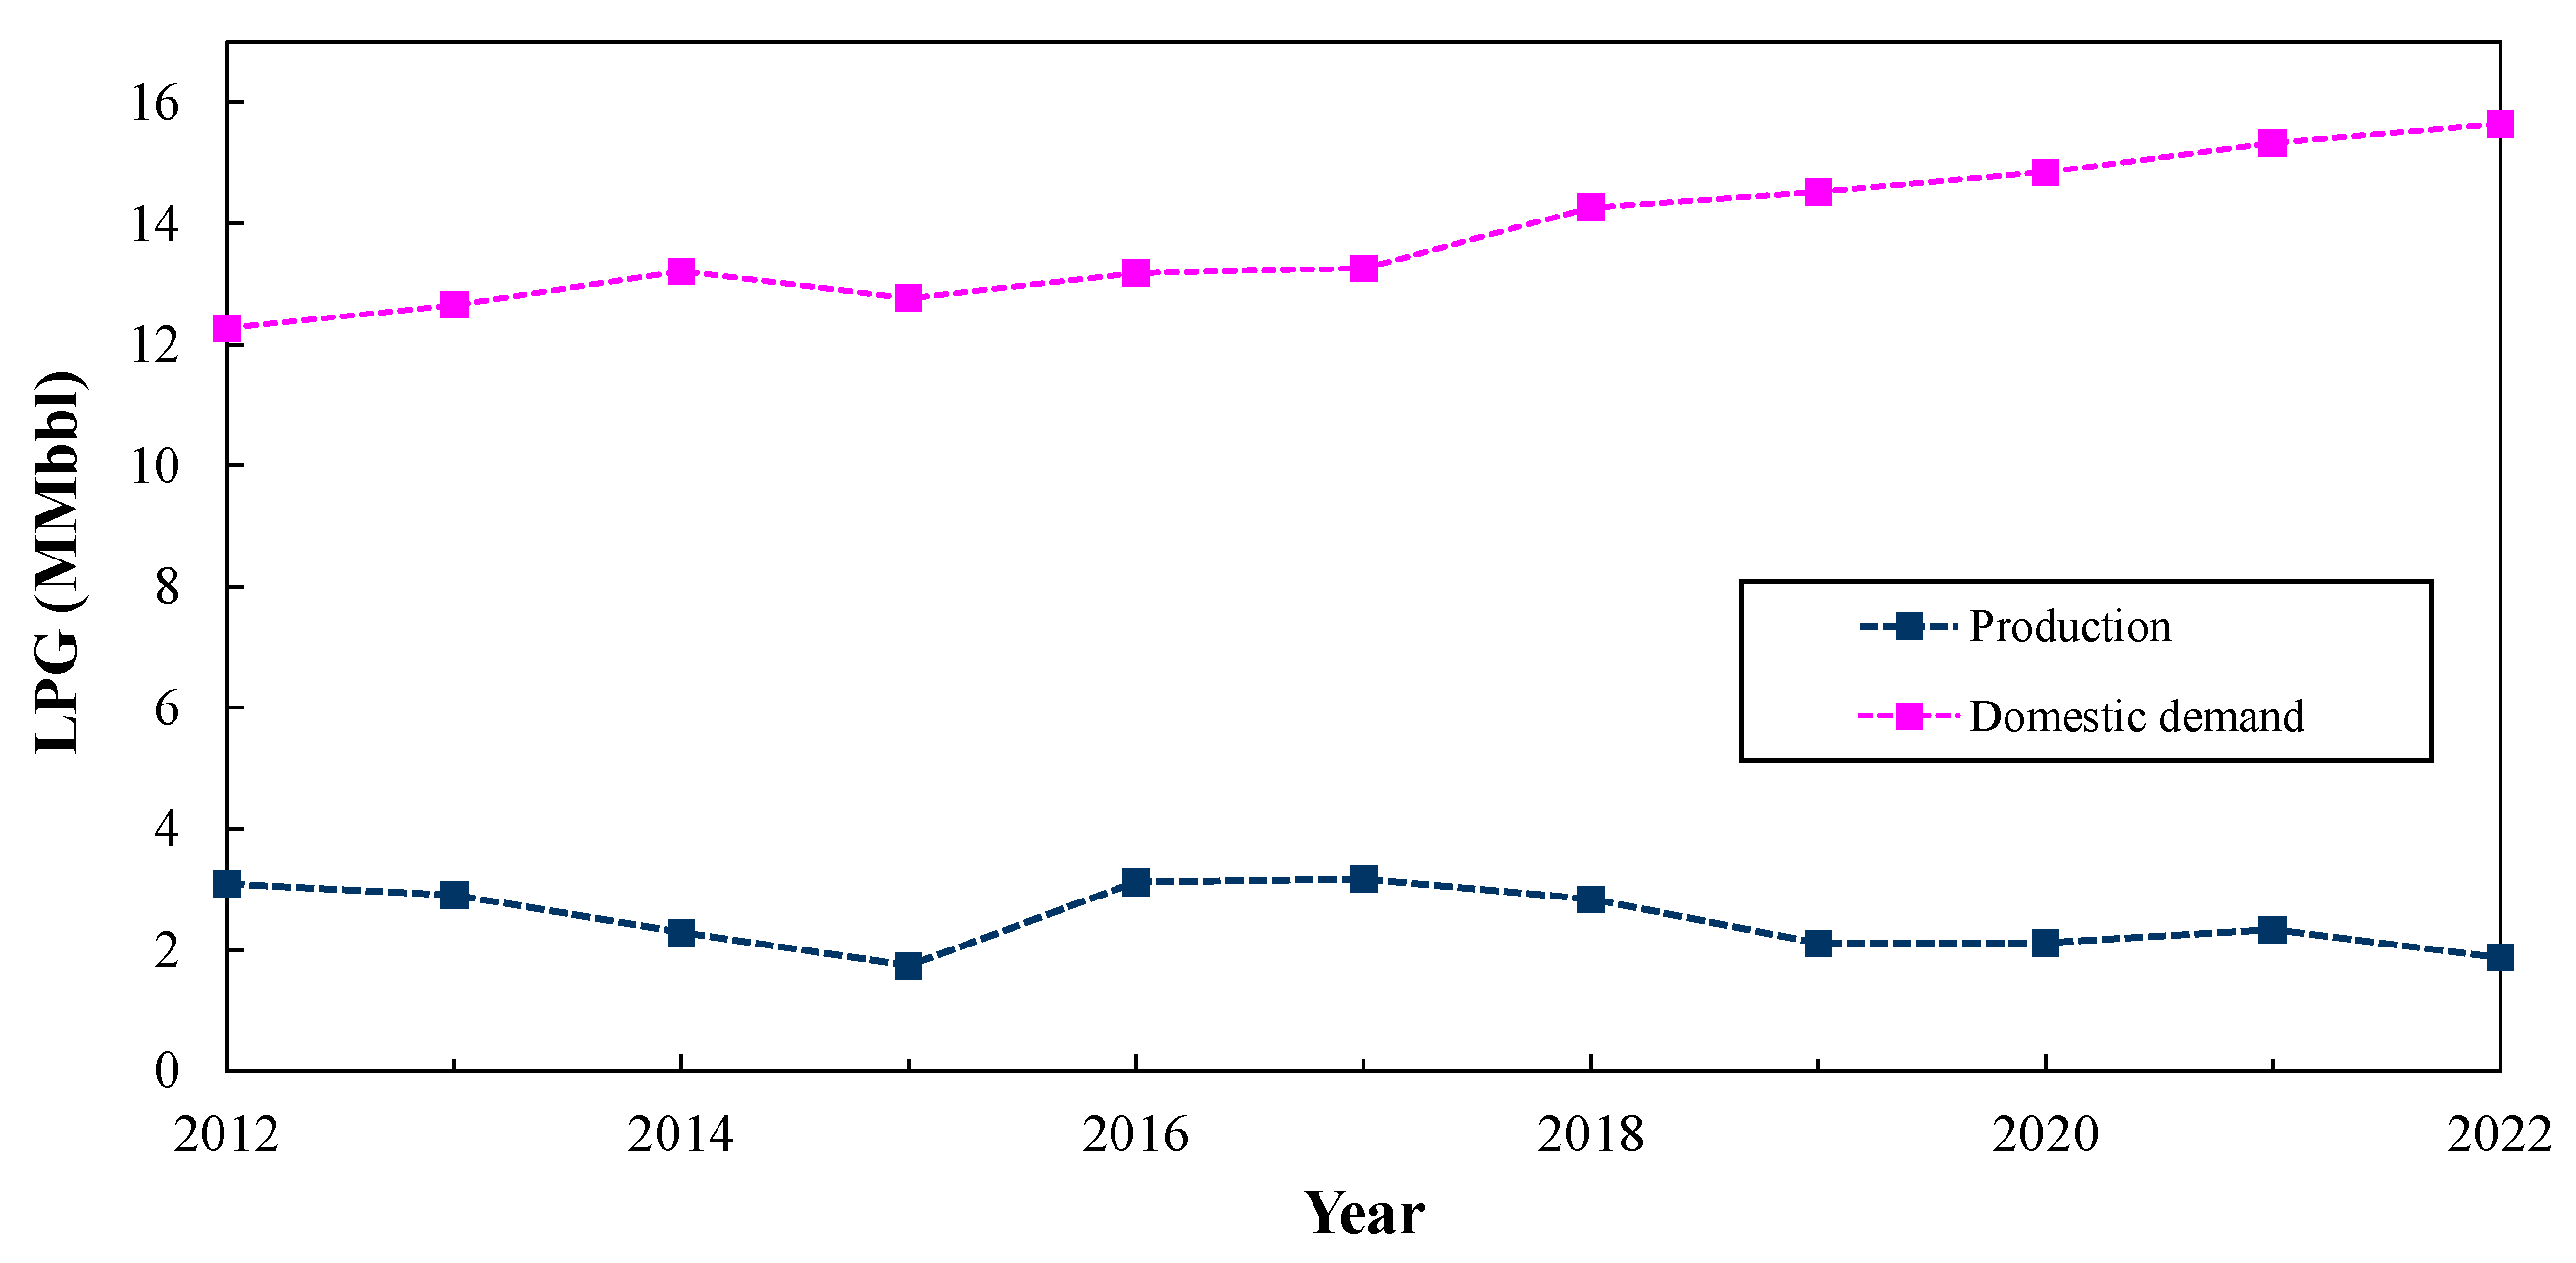
2.1. Liquefied Petroleum Gas Market

In Ecuador, liquefied petroleum gas is crucial for developing different economic and residential sectors. In 2022, this commodity’s domestic demand was ~15.65 million barrels (~15.65 MMbbl). The principal usage of LGP is for residential activities, constituting 89.19% of the total demand, while the remaining quantity is for industrial activities (7.05%), the transport sector (2.01%), and agroindustry (1.75%) [15]. LPG is packaged into steel vessels (cylinders) with a nominal capacity of 5, 10, 15, and 45 kg for market purposes [19]. For residential uses, LPG is mainly distributed in 15 kg cylinders. It is distributed in 45 kg cylinders and bulk containers for industrial uses, whereas for agro-industrial uses, LPG is commercialized in bulk containers [20].
The Ecuadorian LPG production comes from different facilities such as Esmeraldas and La Libertad refineries and the Shushufindi gas plant. Refineries obtain LPG as an oil processing product, while the gas plant obtains the LPG by processing the associated gas from the Amazon region. The national LPG production for 2022 was ~1.88 MMbbl. The primary production came from Esmeraldas refinery, with approximately 59.62%, and the Shushufindi gas plant, with almost 39.96% of the domestic LPG production [15]. Although this commodity is fundamental in the Ecuadorian energy supply, domestic LPG production does not meet the domestic market needs. The LPG production and demand in recent years in Ecuador are shown in Figure 2.
As noted above, the domestic LPG demand has increased in the last few years; meanwhile, LPG production has decreased in the country. LPG imports were needed to satisfy the domestic demand. For instance, in 2022, approximately 13.77 MMbbl of this commodity was imported, representing 87.98% of the total domestic demand. In economic terms, 808.46 MMUSD was spent to cover those commodity imports that year [15]. These economic expenses have been similar in recent years, despite the Shushufindi gas plant producing LPG from the raw associated gas in the Amazon region.

2.2. Shushufindi Gas Plant
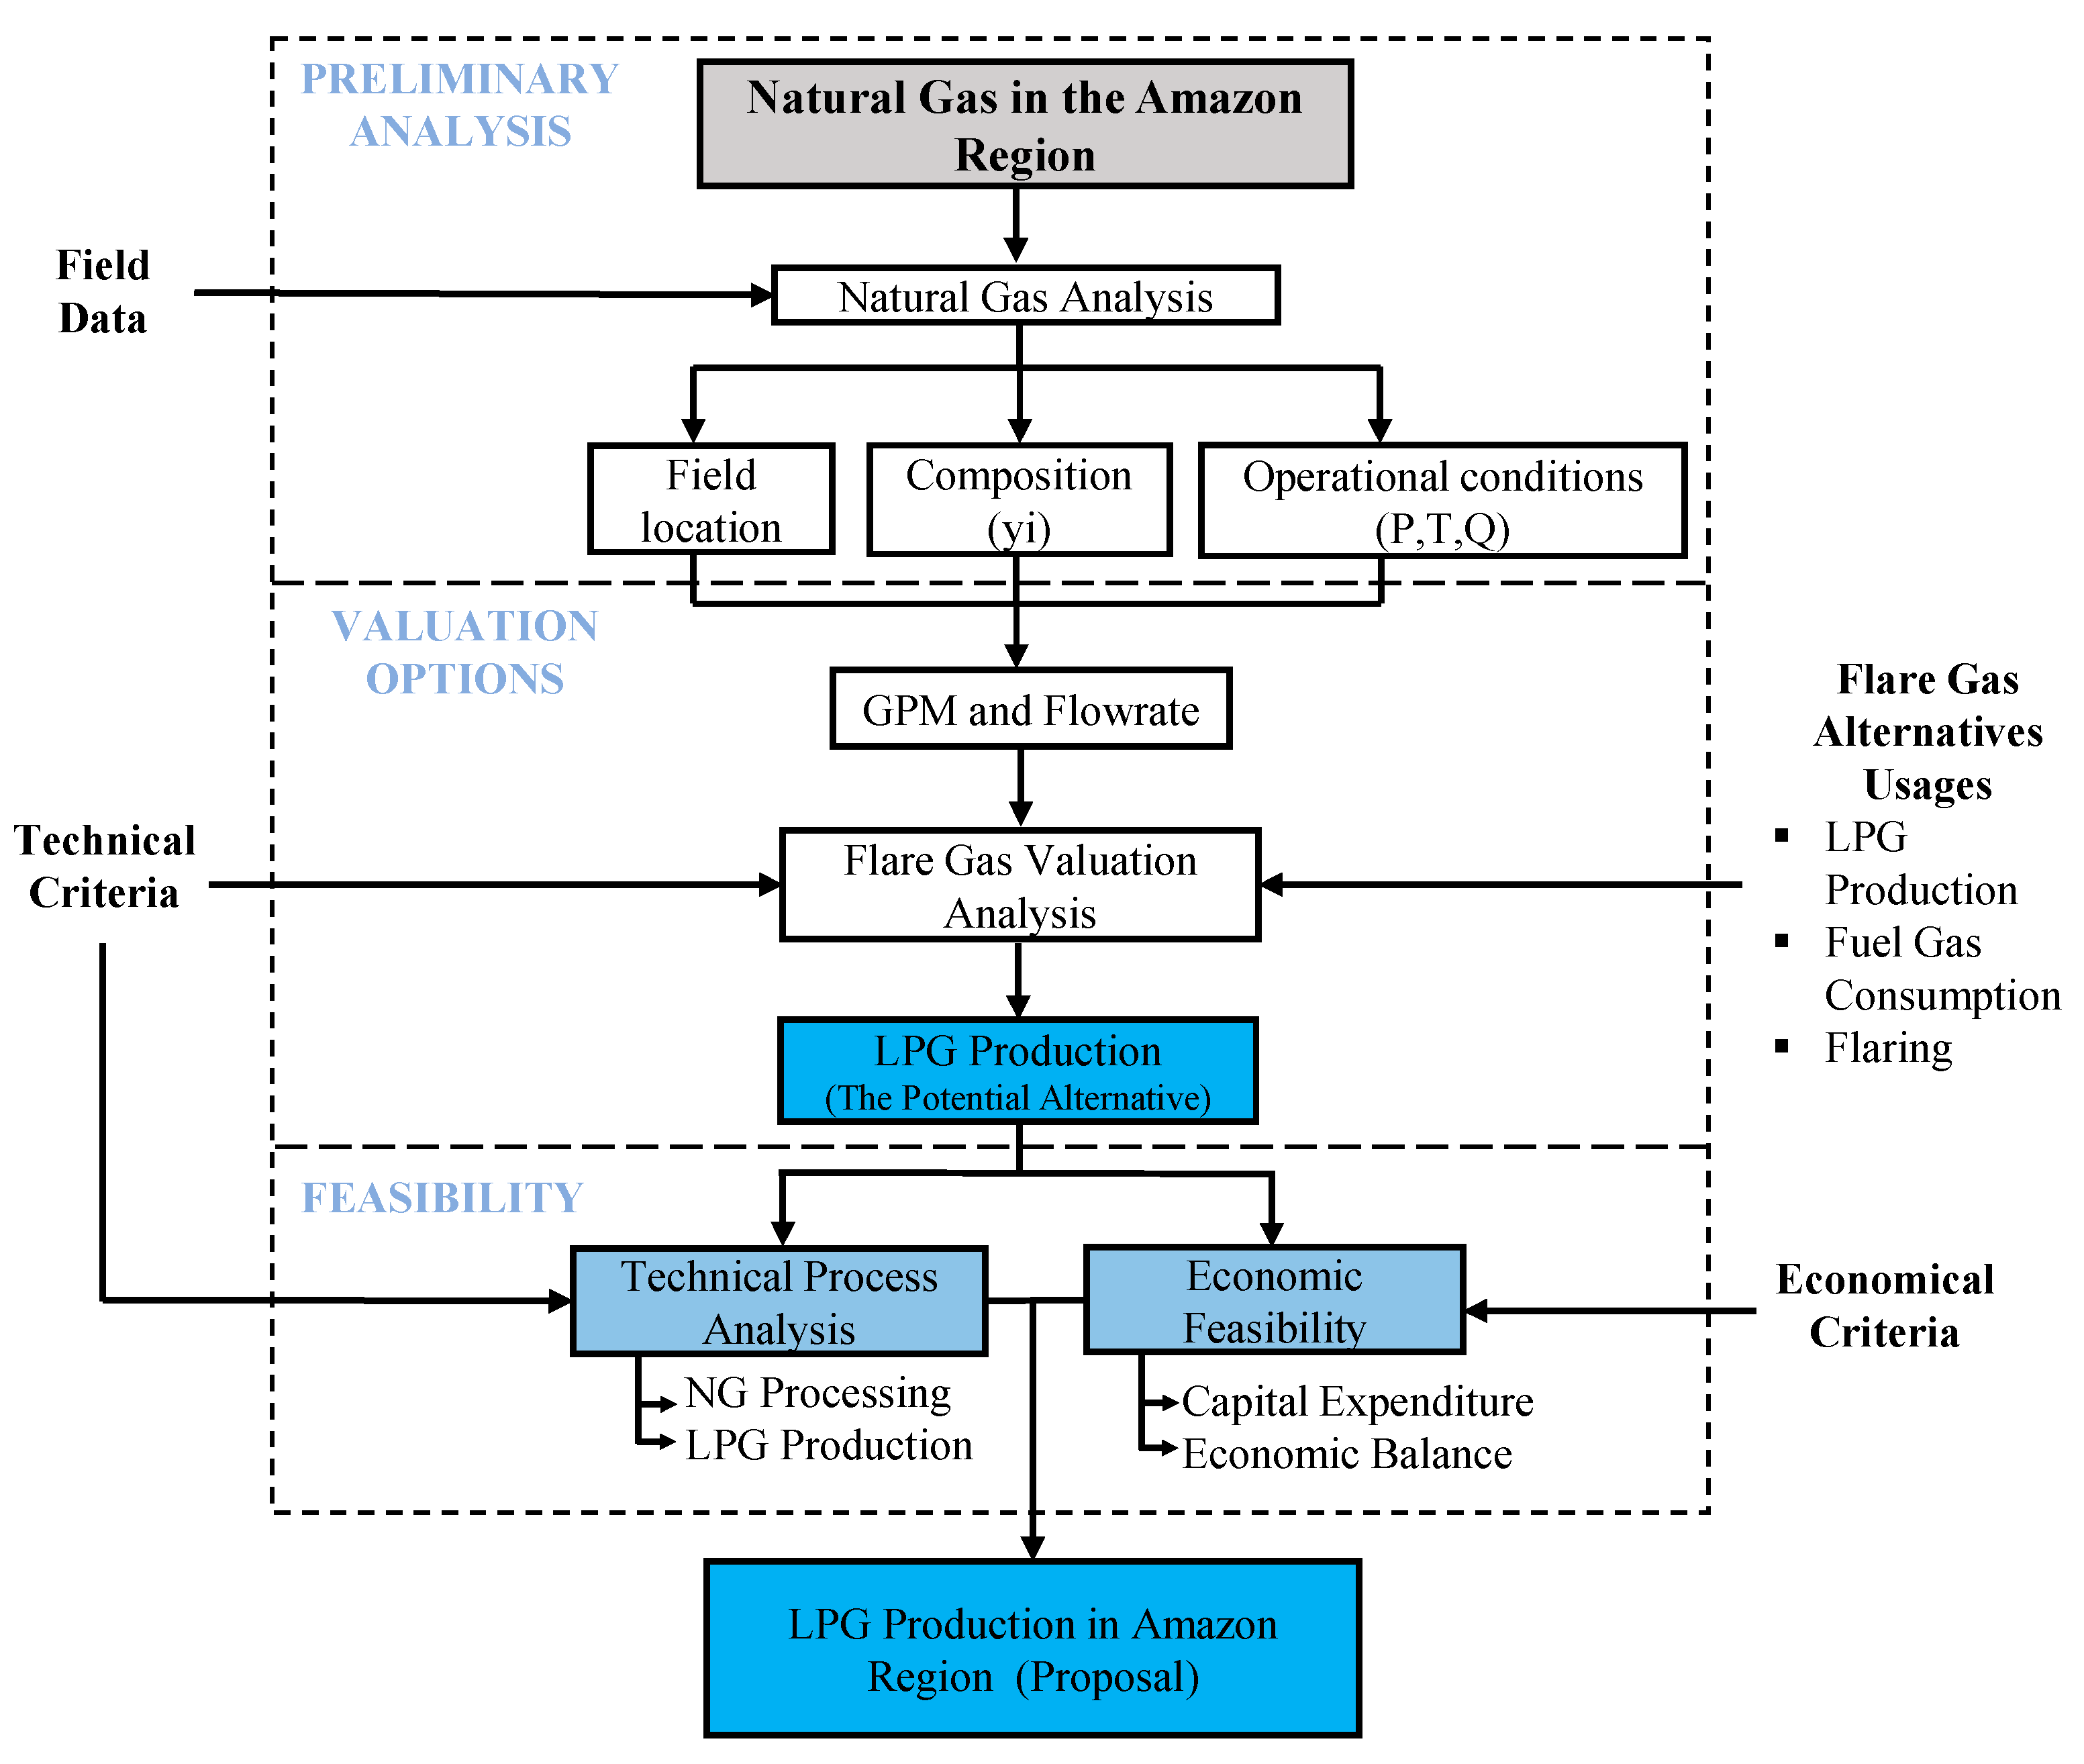
The Shushufindi gas plant (ShGP) is part of the Shushufindi industrial complex, located in Sucumbíos province in the Amazon region. The gas plant was designed to use associated gas from the oil fields to produce LPG and natural gasoline. The feed streams come into this plant as gas and condensate streams. The gas stream comes from Central, South, and North Shushufindi gas capture stations, and the condensates come from Central, South, and North Secoya gas capture stations [21]. The LPG products are delivered by a pipeline network throughout the country and sold in the domestic market [22]. For 2022, the ShGP processed 14.30 MMscfd of associated gas and 2909.59 bpd of condensates to produce 256.68 Tm/d of LPG [15]. The main parts of the gas processing plant are the reception and conditioning, the cooling, and the fractionation section [21]. Figure 3 shows a block diagram of the different process stages in the Shushufindi gas plant.
Echeverria et al. [21] studied the possibility of increasing LPG production in the Shushufindi gas plant through operational improvements. Still, it requires investments, and the plant’s LPG production would increase by 30%. In this context, developing more projects to help increase the current LPG production in the country is essential, even more so if there is a potential opportunity to value the associated gas from the Amazon region to produce LPG.

3. Methods

Figure 4 summarizes the steps followed in conducting the techno-economic assessment considering the natural gas valuation in the Amazon region to increase the LPG production in the Ecuadorian market. The study started with a review of the associated gas produced in the Amazon region. The data were analyzed using field locations, molar compositions, flowrates, and operational conditions. Then, a potential valuation of the associated gas was visualized. Subsequently, a technical analysis was performed to process one of the most attractive gases in the region, considering the conventional and available techniques. The natural gas processing stages included: sweetening, dehydration, natural gas liquid recovery, and fractionation. Finally, an economic feasibility (class V) study was conducted, considering a preliminary analysis of capital expenditure (CAPEX) and an economic balance. The LPG plant proposal was developed, considering all the aspects reviewed.
The bibliography research for natural gas production data in the Amazon region was challenging in this study because of the lack of published information about the topic. The materials used in this study were compiled from different sources [23], including high-quality reports, research articles, standards, undergraduate and graduate theses, and other contributions in recent years from official sources, such as the Ministry of Energy and Mines [14], the national oil company (EP Petroecuador) [15], the Ecuadorian normalization service [24], and the World Bank [25].

3.1. Preliminary Analysis of Natural Gas in the Amazon Region

The field locations, gas flowrates, and gas compositions were the main parameters for commercializing the associated gas considered in this study. Once these parameters were determined, making an appropriate valuation of this resource was viable.
The hydrocarbon fields in the Amazon region are arranged into different assets used to report operational information on oil and gas activities. These assets are considered a technical unit that manages one or more fields (which include platforms, production islands, wells, and facilities) focused on hydrocarbon exploration and extraction [14]. The assets selected for this study were those with more significant gas production than 1 MMscfd. Assets that met this criterion are listed in Figure 5.
Data collected on associated gas compositions were normalized for an accurate analysis. Additionally, note that, under consideration of this study, the gas composition from a single field represents the gas composition of the entire asset. Therefore, when referring to a hydrocarbon field, it will refer to all the fields in the corresponding asset.
Gas flowrates from each field were taken from the official databank [14,15] using the average production for 2022. Furthermore, C2+ GPM and C3+ GPM were calculated using the gas stream’s flowrate and compositions (mole basis), following the theoretical Equation (1):
G P M = g a l l o n s   o f   l i q u i d s   r e c o v e r a b l e t h o u s a n d   s t a n d a r d   c u b i c   f e e t   o f   g a s = g a l   N G L s M s c f   g a s
C2+ GPM considered ethane, propane, butanes, and heavier hydrocarbon components as liquid hydrocarbons, while C3+ GPM considered propane, butane, and heavier hydrocarbon components as liquid hydrocarbons [26].
This study considered a rich gas when its GPM was equal to or higher than 3 gal/Mscf [26,27]. On the other hand, a gas stream was considered lean gas when its GPM was lower than 3 gal/Mscf. Furthermore, associated gas was also considered commercial interest when its production exceeded 10 MMscfd. However, other commercial applications for associated gas streams with lower flowrates could exist.

3.2. Feasibility of Liquefied Natural Gas Production

The technical analysis was developed considering the well-known and available gas treatment and processing techniques. Feed gas conditions and design characteristics considered in this study were gas flowrates, composition, heavy hydrocarbon contents, water content, acid gas compositions, inlet pressure conditions, desired products, and available technology. Since the water content was not reported in chromatographic analysis, this study assumed that the feed gas stream was water saturated at the facility inlet conditions. Additionally, for the technical proposal, conventional processes (using mature and proven technologies) were selected in each stage of the gas plant.
Similarly, the economic feasibility analysis was developed as a class V study considering a preliminary analysis of capital expenditure (CAPEX) and the economic balance. The capital expenditure of the different sections of the gas processing plant considers the previous technical process analysis and other design and economic factors. For instance, to meet the best engineering design criteria, by overdesign, the inlet flowrate was incremented by 20% of the actual flowrate to get a higher operational range. In the same way, all the resulting costs for the units were estimated with the economic approach introduced by Tannehill and Chandra [28]. The cost data were a proper approximation for the first estimated capital cost of a gas processing plant. It came from consensus values from several engineering firms and current plant cost data. The premises and assumptions used for this analysis are shown in Table A1 (see Appendix A). In addition, the data apply only to new facilities (not applicable for retrofits or used equipment), and the costs were based on U.S. dollars.
The technical and economic proposal for the gas processing plant considered different equipment and conditions in each stage of the plant. Specifically, for the plant installation cost, the following assumptions were considered [28,29,30]:
  • Gas sweetening: In this section, the cost applied to remove the acid gases with diethanolamine (DEA) as a chemical solvent and an operating pressure from 585 to 785 psia. However, the cost excluded any gas dehydration after gas treatment.
  • Gas dehydration: In this section, to remove the water, the cost applied for the new glycol dehydration facility, having BTEX (benzene, toluene, ethylbenzene, and xylene) containment equipment, and for an operating pressure from 585 to 785 psia. However, the cost excluded improvements to generate concentrations of lean glycol greater than 98.6 wt.%.
  • Natural gas liquids recovery: In this section, to recover a single natural gas liquids (NGL) product stream, the cost applied for a straight refrigeration process, including limited storage, the use of ethylene-glycol injection for hydrate inhibition, and the cost of glycol regeneration. However, the cost excluded upstream compression and treating, liquid product fractionation, and any outlet-gas compression (pressure drop is small in this unit).
  • Natural gas liquid fractionation: The most conventional fractionation process was considered for this section. Furthermore, due to the lack of public data on fractionation cost, the cost for this stage was calculated as 50% of the natural gas liquids recovery stage.
  • Note that within the battery limit of the gas plant, the infrastructure costs for gas gathering and inlet compression were not considered.
A gas processing plant’s first estimated capital cost excludes certain associated expenses and other contingencies. These excluded costs were suggested to represent 25 to 40% of the total cost [29]. Therefore, for this study, to cover most of the required annexes’ costs and contingencies, the excluded cost represents an additional 40% of the total cost of the plant. Additionally, for obtaining a current preliminary estimate cost of the plant, the cost of the processes was updated from 2017 to 2023 using the Chemical Engineering Plant Cost Index (CEPCI), which gave a general estimate of the actual prices, according to Equation (2):
C o s t 2023 = I n d e x   v a l u e   a t   t h e   c u r r e n t   y e a r I n d e x   v a l u e   i n   2017 C o s t 2017
The CEPCI for the first quarter of 2023 was 800.6 [31], while the CEPCI for 2017 was 567.5 [32].
The economic balance of the gas processing plant was conducted under some essential considerations. The process’s inlet gas flowrate was the average field production flow. In the same way, the economic values of the raw and processed materials were taken from the expected prices of the industry. Additionally, the prices of natural gas liquids were contrasted and analyzed from the national and international markets. This consideration was made because, in the Ecuadorian market, NGL (such as LPG) are subsidized, and prices do not correspond to the current international value [14,15]. Furthermore, the operational time of the SA gas plant was established as 330 days per year, an accurate time for the actual operating time of the industrial plants. The processing cost represented all the total required expenses to maintain the plant working. In some cases, it is called OPEX, i.e., the operational expenditure needed to maintain a project running [33]. The gas processing costs were defined as U.S. dollars per thousand standard cubic feet of the gas processed (USD/Mscf). For this study, the OPEX included all the expenses related to the production, such as supplies, power energy, equipment maintenance, and residual gas treatment. However, it did not include the costs of labor (workers’ wages and insurance) required to maintain the gas processing plant or pumping costs.

4. Results and Discussion

4.1. Natural Gas Analysis in the Amazon Region

In the Amazon region, most fields produce associated gas as a by-product of hydrocarbon operations. The associated gases’ compositions and operating conditions differ from field to field. Therefore, obtaining and processing actual data about the gas properties was essential to evaluate the possible opportunities associated gas can bring to the Ecuadorian industry. Typically, in Ecuador, the hydrocarbon companies value more free gas than associated gas for industrial applications. However, the current free gas production is not significant in the country. On the other hand, the associated gas produced is considerable, but it is not fully valued. Additionally, the products that could be obtained from associated gas processing are widely needed in the domestic market. In the same way, the associated gas is usually related to rich gas production due to the heavy hydrocarbon content linked to crude oil extraction. The processing of rich gases is attractive for industry because they can produce more valuable products than lean gas processing [4]. Table 1 shows the compositions and operating conditions of associated gas produced along the Amazon region. By a brief overview of these data, the associated gas from Amazon was low in methane, but the heavy hydrocarbon content is significant. Thus, this gas could be used for hydrocarbon liquids recovery and fractionation. The flowrate of each field was also significant to be considered for industrial and commercial applications. However, the geographical scattering of the different hydrocarbon fields limits and hinders the installation of centralized associated gas processing systems in the Amazon region.
Note that most of the fields had medium- and low-pressure levels (<130 psia) and a temperature above room temperature (>60 °F). In addition, no data were reported about the H2S content. However, the carbon dioxide content was relevant in some fields, implying the technical need for a gas sweetening stage in the possible gas valuation. Furthermore, no data were reported about the H2O content. Still, it could be assumed as a water-saturated gas stream, implying the technical need for a gas dehydration stage in the possible gas valuation. The amount of liquids in the gas is crucial to determine the commercial applications. A gas stream with a higher GPM value has a more extensive availability to recover liquids. Therefore, the GPM parameter is essential to value associated gas produced accurately.

4.2. Associated Gas Valuation in the Amazon Region

GPM analysis was crucial to identify the quality of a gas stream. Most fields in the Amazon region produced rich gases (considering that a rich gas has a GPM ≥ 3 gal/Mscf, otherwise lean gas). Figure 6 presents the GPM C2+ and GPM C3+ in the different fields in the region. The fields that attracted the most attention were Lago Agrio (LA Gas), Shushufindi (SH Gas), Libertador (LI Gas), Cuyabeno (CU Gas), Auca (AU Gas), and Sacha (SA Gas) due to their high composition in C2+. They could be a potential source of hydrocarbon liquids recovery, specifically for ethane recovery. In the same way, these fields had the highest quantity of C3+ components, which could be used for propane and heavier hydrocarbon recovery. In this sense, LPG production could be potentially feasible. However, other parameters needed to be considered for an accurate valuation.
As noted above, the associated gases from the Amazon region were characteristically rich, and the opportunity for natural gas liquids recovery was appreciable. The level of GPM in a gas stream is essential but not the only aspect to consider when a gas valuation is conducted. Another critical parameter is the gas flowrate, which is indispensable for meeting the commercial criteria values. Thus, a higher gas flowrate is most commercially appreciated and must be directly related to the GPM value. Figure 7 shows the associated gas GPM and its flowrate in the studied region (considering that an associated gas stream with Q ≥ 10 MMscfd is of commercial interest).
The graphs simplify interesting aspects to obtain a possible gas valuation. From the graph, for the flowrate and GPM over 10 MMscfd and 3 gal/Mscf, respectively, the associated gas production was in a zone of rich gases with high commercial interest. It implied that natural gas liquids could potentially be recovered from these gases. For a flowrate over 10 MMscfd, but with GPM less than 3 gal/Mscf, the associated gas was still in a zone of commercial interest. However, as it is a lean gas, it could not be used for NGL recovery, but it could be used for power generation because of its methane content. For a flowrate less than 10 MMscfd, with a high content of liquids (over 3 gal/Mscf), a deep analysis would be required to identify the feasibility of gathering and its commercial value. On the other hand, for those lean gases with a flowrate of less than 10 MMscfd, treatment would be needed for their later disposal to the environment.
The most industrial attractive associated gases were those rich with high commercial value. They were gases from the Sacha field and the Shushufindi field. However, to obtain a proper valuation, an analysis of the current uses of these gases was indispensable. Industry only uses a few hydrocarbon fields for associated gas valuation in the Amazon region. For instance, the Shushufindi gas plant uses the associated gas from SH Gas, LI Gas, and LA Gas to produce LPG and natural gasoline. On the other hand, in SA Gas, a small amount of gas is used in optimizing power generation and energy efficiency projects [40]. Therefore, it was essential to value SA gas to produce natural gas liquids and, thus, avoid flaring and wasting resources.
According to hydrocarbon reserves reported for SA gas [14] and its current gas production [15], this field will produce ~64,778 MMscf during the next twelve years. The field’s new hydrocarbon drilling and extraction projects may increase this quantity. Due to its high heavy hydrocarbon content and commercial flowrate, one potential use of SA gas can be LPG production. The last alternative would significantly impact the current Ecuadorian LPG market and the national economy because of the low LPG production and high expenses that represent the imports of this commodity. SA gas treating and processing was necessary to obtain LPG from the associated gas. It involved different processing stages such as acid gas removal, water removal, liquids condensation, and liquids fractionation.

4.3. Liquefied Petroleum Gas Production Feasibility

The production of associated gas in the Amazon region needs to be considered a crucial national energy source. Therefore, this section discusses the feasibility of gas valuation for liquefied petroleum gas production from a technical and economic perspective. The gas-processing techniques and economy depend on the feed conditions and processing specifications. These parameters highly influenced the technology selected and unit configuration for the gas plant. Table 2 shows the feed gas conditions and processing specifications considered for this study to produce LPG from the associated gas from the Sacha field.
Note that the ethane content in SA gas was significant (>10 mole %). However, recovering it implied higher costs than just propane and butane recovery. In addition, ethane extraction also requires fixed customers in an established market.

4.3.1. Technical Processing Study

By treating and processing the gas from the Sacha field (with the current flowrate of 21.50 MMscfd and GPM C3+ of 5.5 gal/Mscf), the potential LPG production was 2548 barrels per day (219.16 Ton/day), implying an increase of approximately 14,600 LPG cylinders of 15 kg per day in the domestic LPG market, as seen in Figure 8. This production could easily supply nearly 219,000 households monthly in Ecuador (considering that residential LPG cylinders typically are used twice a month in a household). Furthermore, there was the possibility of processing 16.15 MMscfd residual gas that meets sale market specifications and obtains more revenues.
The principal stages of a natural gas processing plant proposal were gas sweetening, gas dehydration, NGL recovery, and NGL fractionation. The main products were liquefied petroleum gas, residual gas, and natural gasoline as a by-product of the plant operations. The technology applied in each section mainly depended on the treated raw gas conditions and the desired products. Thus, the following analysis focused on each section of a gas processing plant, reviewing the technology available for SA gas industrialization.
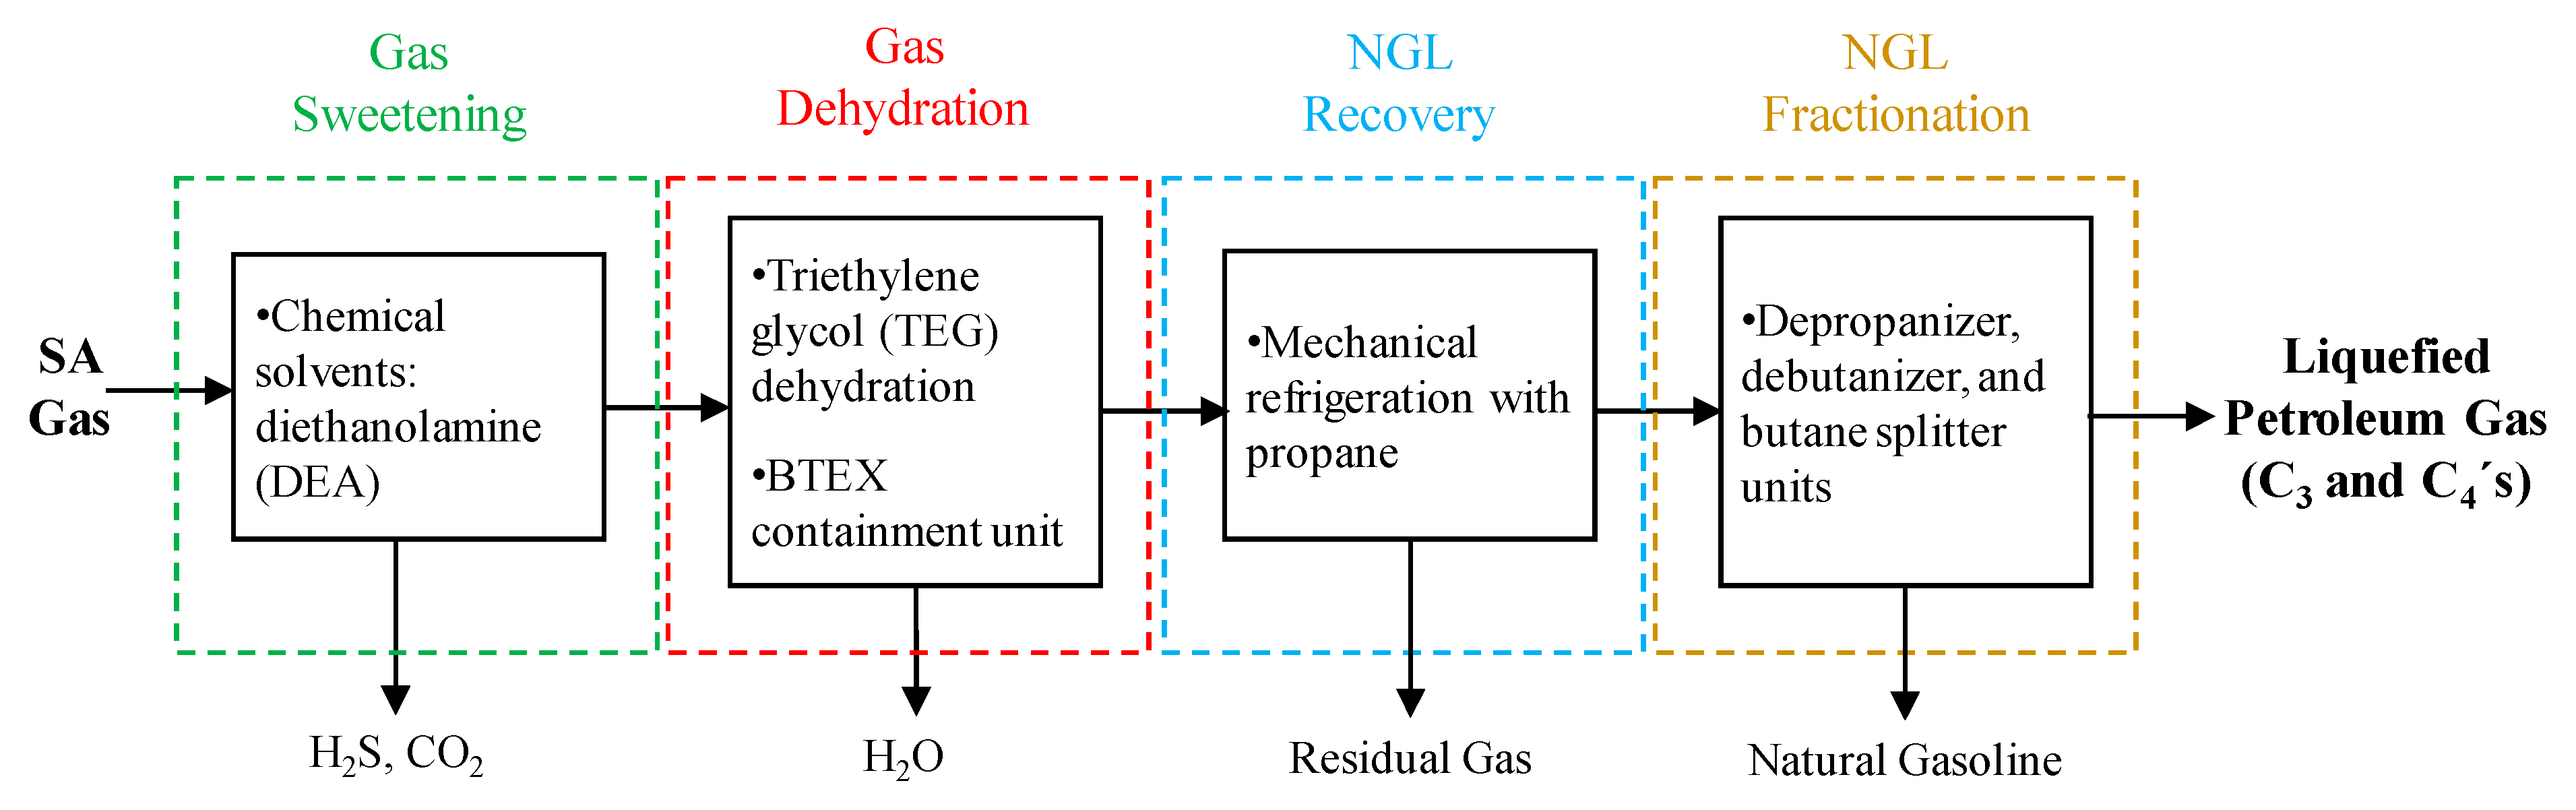
  • Gas sweetening: In the gas sweetening stage, the available technology (liquid-phase absorption) for removing acid gases included chemical, physical, and hybrid solvents. The use of each of them depended on different parameters, including the type and amount of acid gases, hydrocarbon composition, partial pressure in the feedstock, and others. The SA gas was characterized by a high quantity of natural gas liquids due to its GPM of 5.5. Physical solvents were not possible for this situation because, according to Gas Processors Suppliers Association (GPSA) [30], physical solvents tend to dissolve heavy hydrocarbons. Additionally, removing around 9.35 mole % of CO2 (and considering possible H2S removal simultaneously) required an intensive, not selective, acid gas removal. According to Kidnay et al. [29], the chemical solvents meet these requirements and partially remove COS and mercaptans. Chemical solvents also were favorable for low partial pressures of the acid gases. Therefore, a possible technology for this stage was chemical solvents, especially DEA, one of the most mature technologies of chemical solvents.
  • Gas Dehydration: Due to amine usage (in water solution), the treated gas left the sweetening stage saturated with water. In the gas dehydration stage, it was necessary to remove this water content. The conventional technologies for water remotion included absorption and adsorption methods. For selecting each of them, several factors must be considered. This process was not focused on cryogenic liquids recovery, so adsorption methods such as molecular sieves were not considered. According to Kidnay et al. [29], molecular sieve dehydration requires high energy consumption in the regeneration step.
  • Absorption methods such as glycol dehydration were more feasible to meet the specifications of this process. According to Mokhatab et al. [6], glycol dehydration is more economically expensive in capital investment and operating expenditure than molecular sieves technology. Also, it could meet the specification for NGL recovery as low as −40 °F. Therefore, a possible technology for the SA gas to remove water was glycol technology, especially the triethylene glycol (TEG) dehydration process. In addition, according to Myers, it was also required to include a BTEX containment unit [41]. This equipment avoided the absorption of BTEX hydrocarbons in the TEG process and their subsequent release to the atmosphere in the glycol regenerator.
  • Natural gas liquids recovery: A chart by Kidnay et al. [29] showed the ethane and propane recovery level dependency as a function of the C3+ content in the feed stream and the separation temperature. It was noticeable that recovery levels increased with a higher gas richness. For a 5.5 GPM C3+ gas, a 90% propane recovery required −30 to −40 °F at 614.7 psia. Furthermore, there was also a chance of high ethane recovery from the SA gas through different refrigeration techniques arrangement and combination. It also could increase the propane and butane recovery to almost 100%. However, ethane recovery, which required separation temperatures lower than 40 °F (cryogenic temperatures), was not within the scope of this study, but it could be considered for future projects.
  • For recovering NGL products, there were several refrigeration techniques, including valve expansion, mechanical refrigeration, and turboexpanders. Their use depended on different factors such as the desired products, the inlet conditions, the economic availability, and others. As this process was not focused on cryogenic recovery, which requires low temperatures for liquids condensation (−150 °F), turboexpanders were not considered because of their high operation cost [6]. Also, despite its simplicity in operation and low maintenance equipment, J-T units require high inlet pressures that the SA gas did not have. Therefore, in this case, a possible technology for NGL recovery was mechanical refrigeration (straight refrigeration), which could meet the current low inlet gas pressure conditions.
  • Furthermore, according to GPSA [30], straight refrigeration is quite flexible because it can be used for modest liquid recovery, high propane recovery (−40 °F), and reasonable quantities of ethane recovery (in the case of rich gases). For this process, an ideal system was mechanical refrigeration with propane, an industry-matured technology. Additionally, according to Kidnay et al. [29], ethylene glycol injection was also necessary for hydrate inhibition in this section (when the water content was higher).
  • Natural gas liquid fractionation: In the gas fractionation stage, conventional technology was considered for processing the raw NGL into individual products by fractionation. The NGL went through a four-column fractionation system. It included a de-ethanizer unit, a depropanizer unit, a debutanizer unit, and a butane splitter unit; which processes the gas from raw NGL into end products such as LPG and natural gasoline.
Figure 9 summarizes the above analysis of the potential technologies that can be applied in the different processing stages of SA gas.

4.3.2. Economic Feasibility Study

From an economic point of view in the industry, it is essential to focus investments on different projects. Therefore, in this section, various factors were analyzed for the economic feasibility of the SA gas processing plant.
The plant installation cost represented the total budget to build and start up the industrial gas plant. In some cases, it is called CAPEX, which means the capital expenditure needed to start a project, in this case, to build the plant [28]. Since gas flowrate could vary in the field, to build the infrastructure was necessary to consider the overdesign engineering capacity. Thus, the flowrate for the SA gas processing plant design was 25.8 MMscfd. The expenses for each section are detailed below:
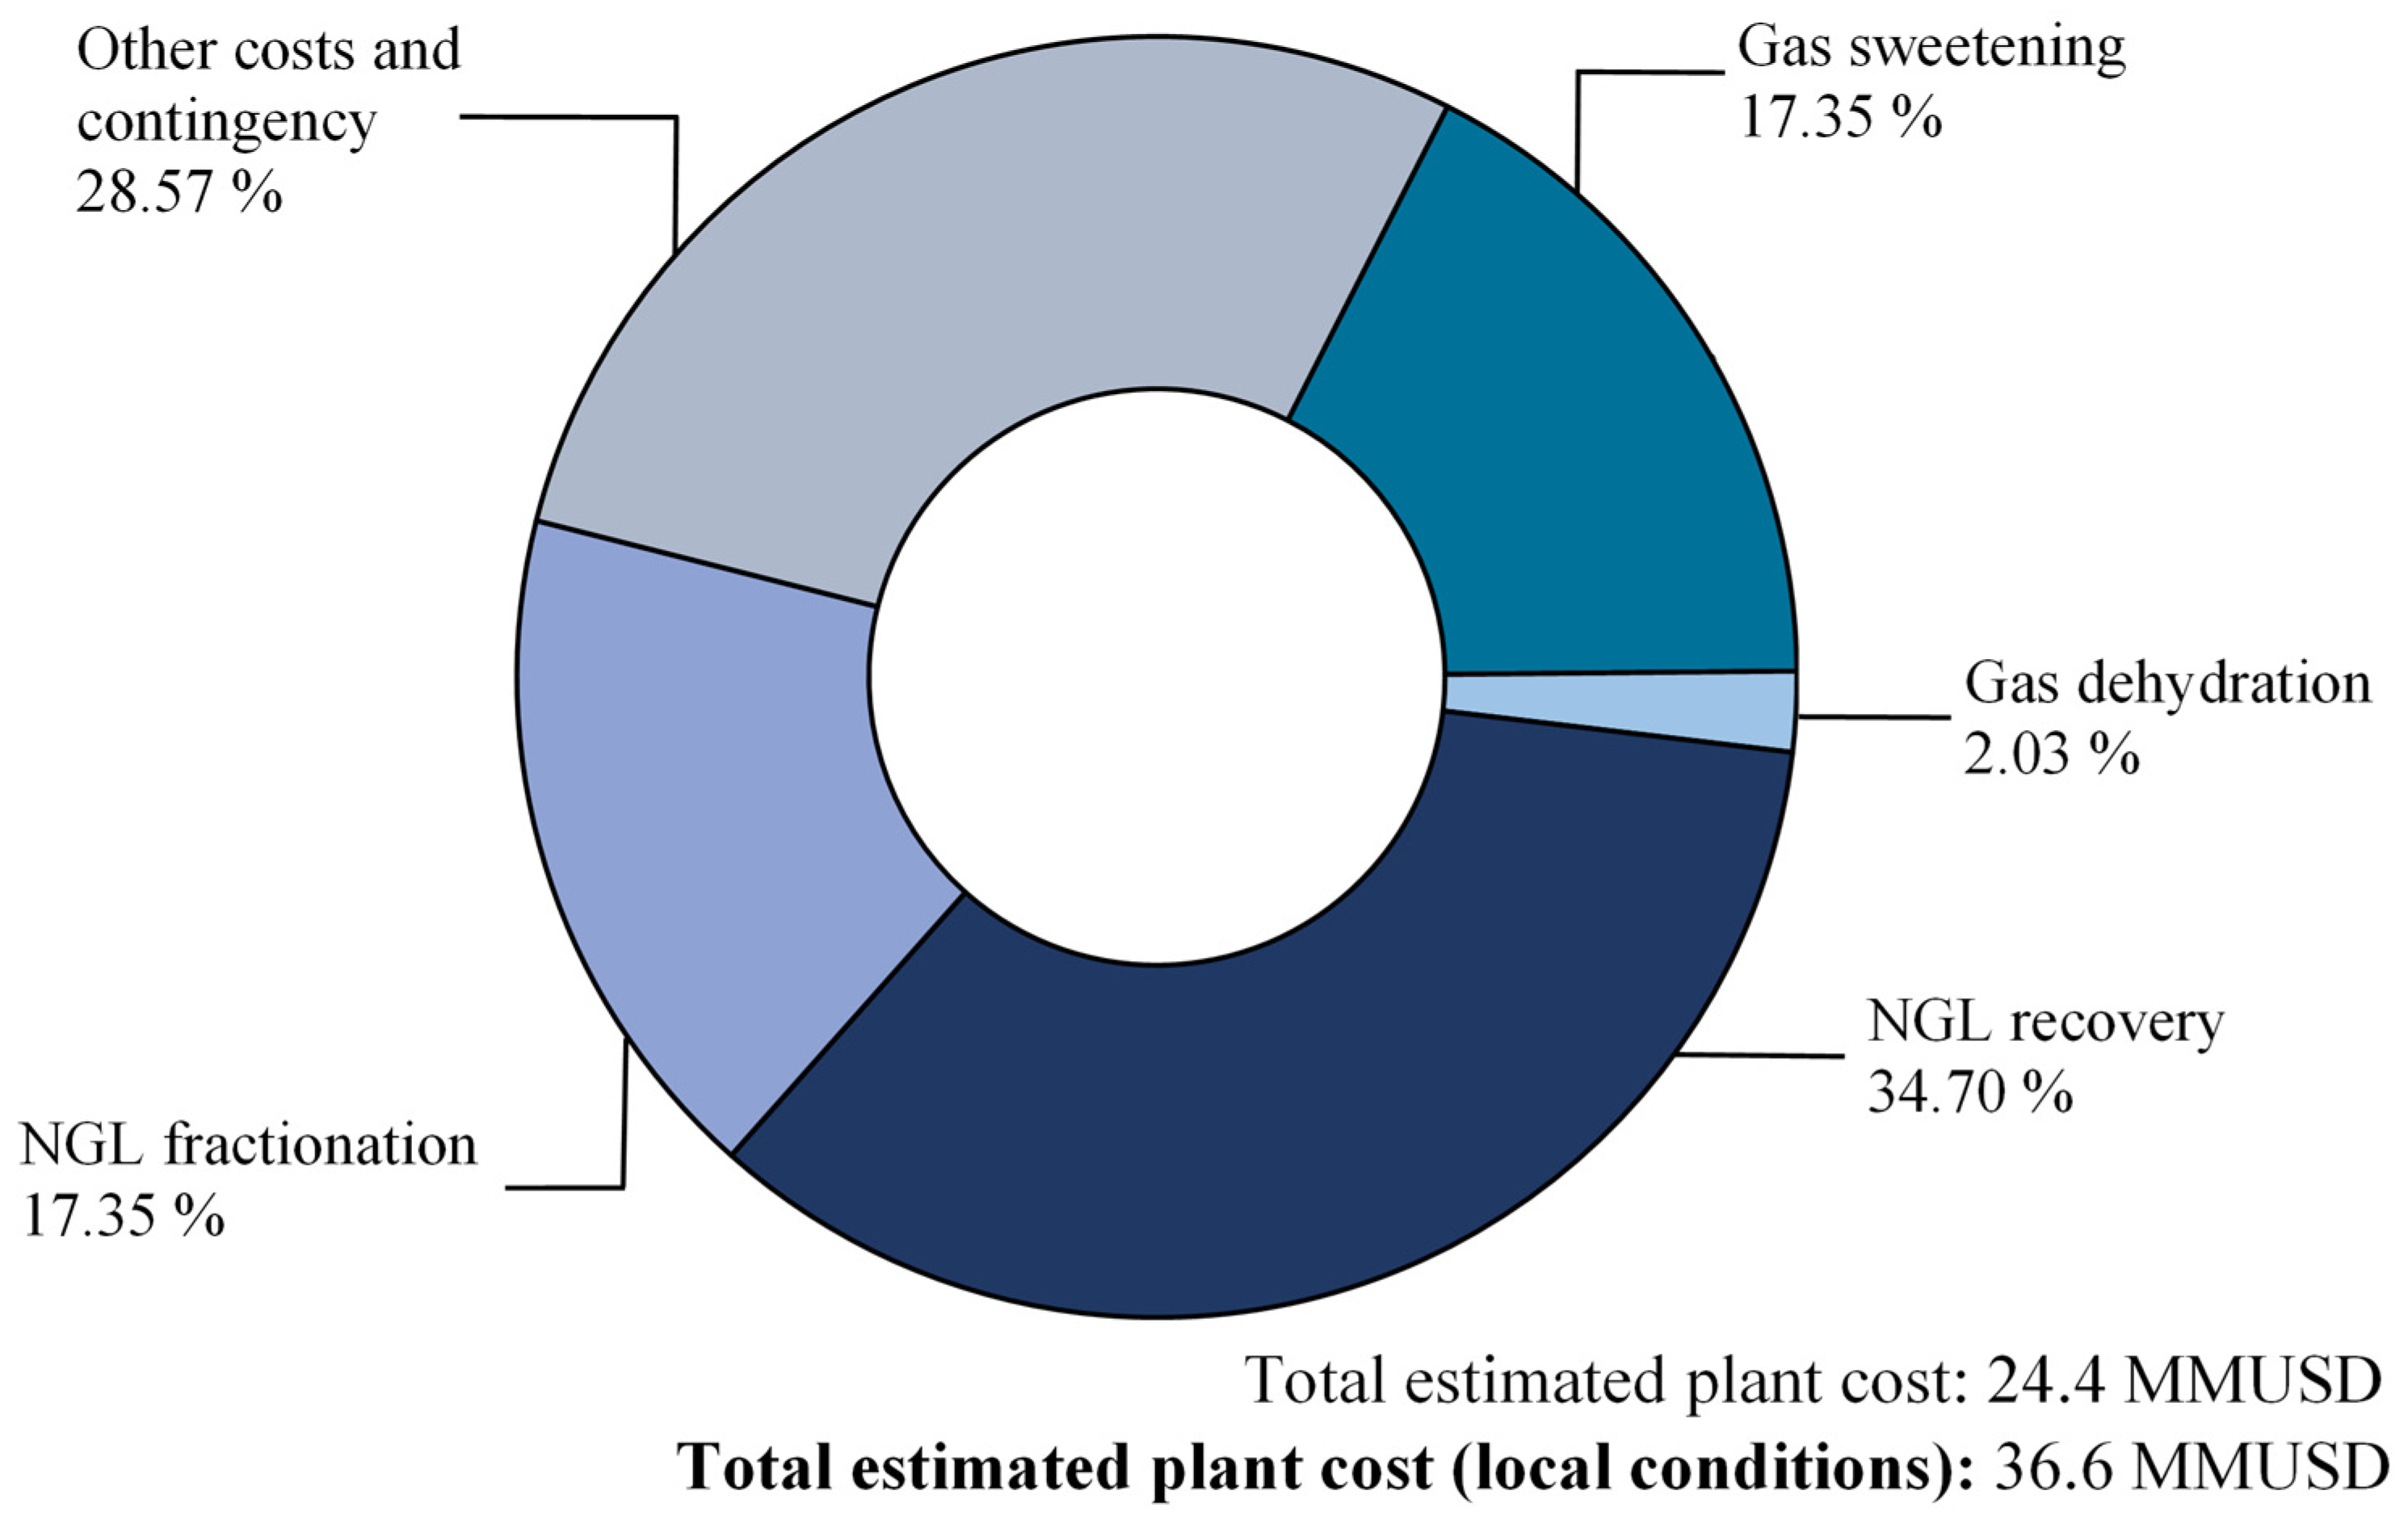
  • Gas Sweetening: In the gas sweetening stage, the aim was to remove the acid gases from the SA gas stream. Hence, it was necessary to remove ~9.35% of acid gases. The acid gas volume to remove was directly related to their operating and capital cost. Large removal volume implied high capacities (absorber and regenerator) to manage the amine recirculation rates. Thus, it required higher costs. In this study, the estimated capital cost for SA gas sweetening, using DEA as a solvent, was ~4.23 MMUSD.
  • Gas Dehydration: In the gas dehydration stage, the aim was to remove the water content from the SA gas stream. There is a water-saturated gas, so the dehydration capital and operation costs depend on the inlet flowrate. For the SA gas dehydration facility, it was necessary to have ~0.49 MMUSD as the capital cost using TEG technology.
  • Natural gas liquids recovery: In natural gas liquids recovery, the aim was to condense the heavy hydrocarbons from the SA gas stream. The increase in the GPM (on a C3+ basis) impacted the recovery cost, mainly because of the more significant load of refrigeration required. Hence, for SA gas, with a GPM of 5.5, the capital cost for the NGL recovery facility was ~8.46 MMUSD.
  • Natural gas liquid fractionation: In the natural gas liquids fractionation stage, the aim was to separate the NGL from SA gas into individuals. For this study, the estimated capital cost for NGL fractionation was ~4.23 MMUSD.
Figure 10 summarizes the CAPEX for the SA gas processing plant in a million dollars for the current year. The estimated cost (class V) for the SA gas processing plant was 24.4 MMUSD. However, to accurately approximate the first capital cost estimate, the cost considered local conditions (Ecuadorian market), such as transportation, taxes, and national insurance. For this study, the local considerations increased 50% the estimated capital cost. Thus, the CAPEX for the gas processing plant considering local conditions was 36.6 MMUSD. Finally, the estimated construction time is essential in economic studies because it affects planning, revenue, tied-up capital, and interest cost. For the case of this study, and according to [29], the construction time for the SA gas processing plant would take around 18 months (construction time required for plants smaller than 200 MMscfd).
An economic balance study of the gas-processing plant is indispensable to recognizing revenues and investment returns. It will help to decide if a project is profitable, and it is vital to determine the different incomes and outcomes of the gas plant. Different monetary values are related to the SA gas processing plant; each varies according to location, politics, and international environment. Thereby, Table 3 shows the raw natural gas price, processing cost, and natural gas liquids price considered for this study.
It is important to know that the prices tend to change constantly. Thus, the economic balance was based on the prices for the first quarter of 2023. Given these parameters, a simplified flow sheet of the SA gas processing plant economy is shown in Figure 11. The expense “E” represents the purchase of raw natural gas (19.50 MMUSD/year). “C” represents the total processing cost of the gas plant (21.29 MMUSD/year). On the other hand, “I” represents the total income due to the sales of liquefied petroleum gas and treated residual gas in the market at international prices (70.06 MMUSD/year). An overall balance showed a gas plant profit of 29.28 MMUSD per year, which indicated a profitable project, taking advantage of the associated gas from the Sacha field in the Amazon region instead of flaring it.
Nevertheless, natural and liquefied petroleum gas are considerably subsidized in Ecuador [44]. The current subsidized price for natural gas is 2 USD/MMBTU [45], whereas the LPG subsidized price is 0.106 USD/kg (9.17 USD/bbl) [15]. Hence, Figure 12 shows the different balance scenarios for the SA-gas-processing plant considering the domestic and international markets. Note that, because of the hydrocarbon subsidies, the 15 kg cylinders should cost 5.17 USD instead of the subsidized price (1.60 USD) for an equilibrium economy at the gas plant in the local market.
However, considering the domestic market, by processing 21.5 MMscfd of the associated gas from the Sacha field in the Amazon region, the potential LPG production could be 2548 bbl/day, which is an amount representing ~30.9% of current national LPG production and 49.36 MMUSD/year in commodity imports. Figure 13 shows the cost of introducing 2548 bbl/day of LPG to the domestic market through regular imports and the cost of introducing the same amount of LPG through the SA gas processing plant proposed by this study. Despite the significant local hydrocarbon subsidies, the potential savings of national LPG production (through the SA gas plant proposal) for the Ecuadorian economy would be 32.13 MMUSD/year, an alternative more economically viable than the net LPG import option. Thus, the investment cost would be justified.
By introducing 2548 bbl/day of LPG into the domestic Ecuadorian market (through the associated gas valuation), import dependency on this commodity would be reduced. Additionally, the associated gas valuation would represent a tremendous social impact because of the increase of ~14,600 LPG cylinders of 15 kg per day to the domestic market. Finally, it has to be considered that other fields also presented commercial characteristics to be analyzed for industrial valuation opportunities.

4.4. Final Remarks

A relevant aspect of this work is that it allowed an order of magnitude study (class V) on the costs associated with installing an LPG production plant as an alternative to reduce gas flaring in the Ecuadorian Amazon region. With this plant, it would be possible to reduce the import of LPG, contributing 2548 bbl/day of this commodity to the domestic market. Additionally, the region’s development could be promoted by implementing infrastructure and industrial facilities to value natural gas [46], electrification of hydrocarbon production facilities in underdevelopment areas [47], and a unified transport and logistics system [48], which could generate jobs directly and indirectly. Furthermore, by processing the associated gas, a significant reduction in gas flaring can be achieved, leading to positive effects on the environment and communities near the oil fields. Developing the oil and gas industry in environmentally sensitive areas (such as the Ecuadorian Amazon region or Russian Arctic) requires establishing sustainable development policies where the environment and the area’s natural habitat are respected [49]. Environmental impact studies on the proposal presented in this study are subject to analysis, and the results will be presented later.

5. Conclusions and Recommendations

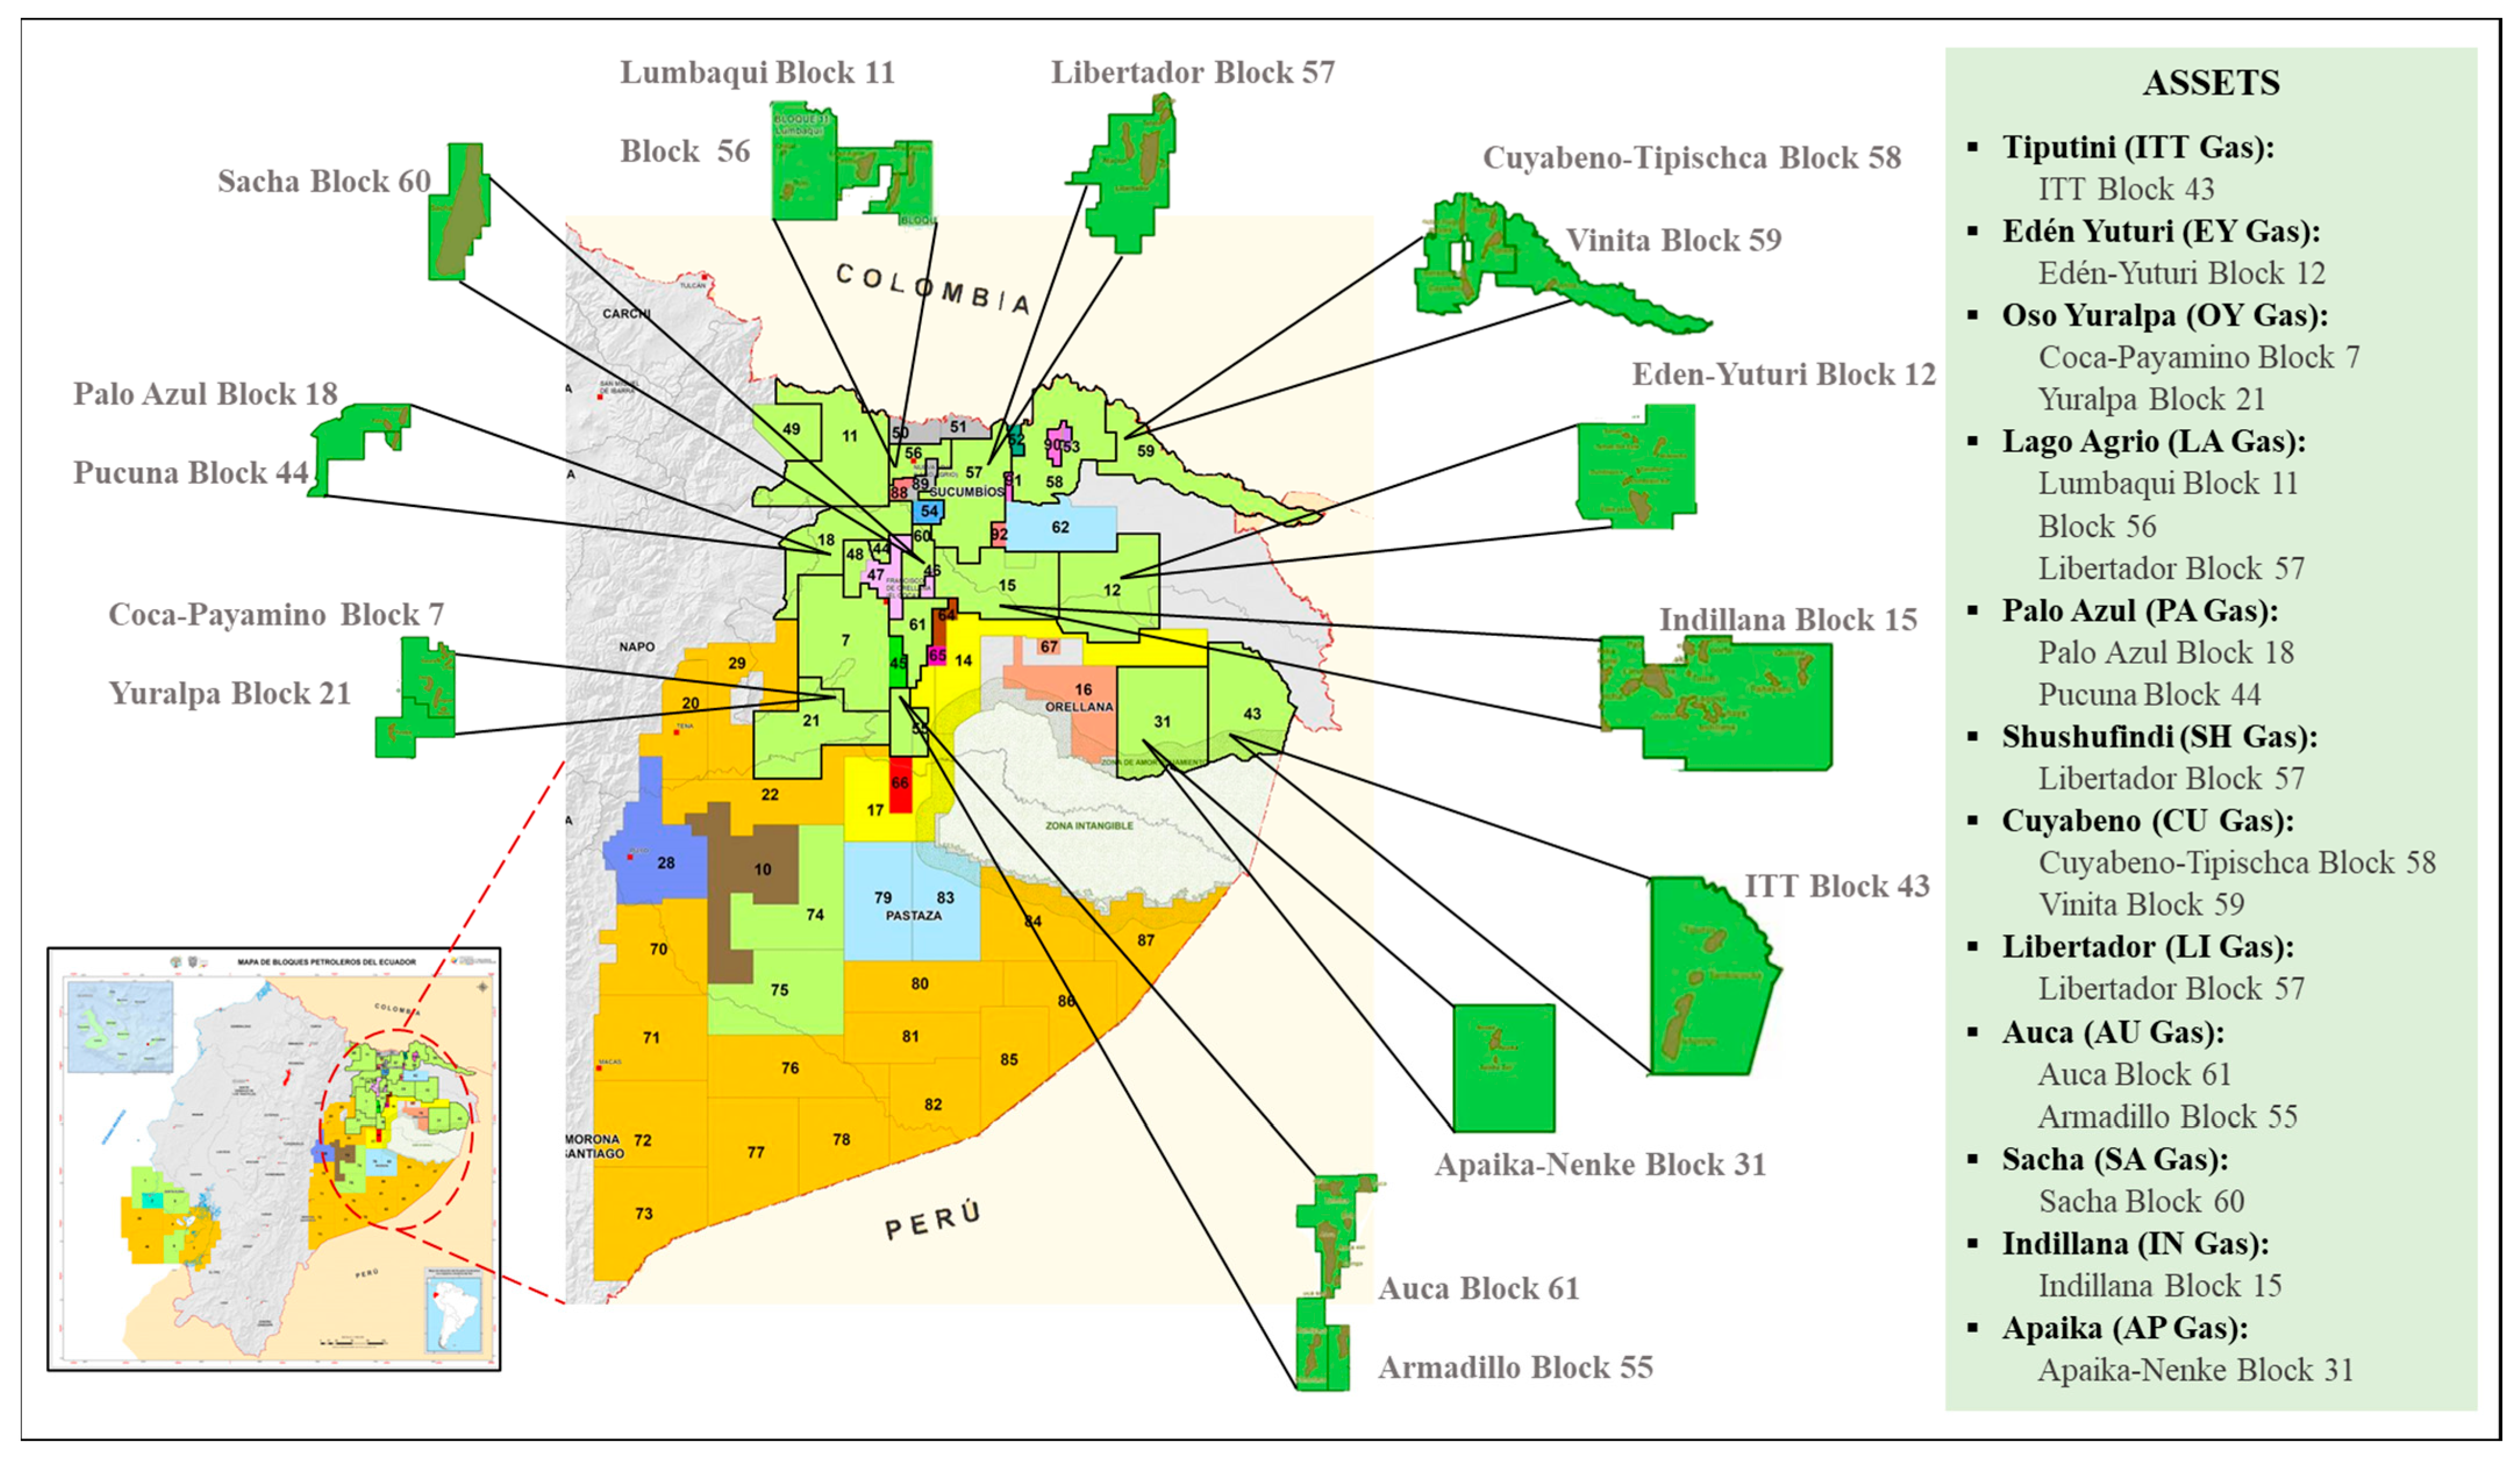
  • In the Amazon region, the associated gas produced had a high content of heavy hydrocarbons (GPM C2+ ≥ 3 gal/Mscf and GPM C3+ ≥ 3 gal/Mscf) and commercial characteristics. Therefore, there was an opportunity to take advantage of this gas by natural gas processing, increasing industrial revenues and reducing gas flaring.
  • The processed gas from the Sacha field could produce 2548 bbl/day of LPG, constituting an increase of 30.9% of the current domestic LPG production. This associated gas valuation would represent a tremendous social impact by introducing ~14,600 LPG cylinders of 15 kg daily to the domestic market. It easily could represent the LPG supply of nearly 219,000 households per month in Ecuador. Inserting this amount of LPG into the domestic market would highly reduce the import dependency on this commodity.
  • The technical analysis determined that the potential technology to process the associated gas from the Sacha field includes gas sweetening, dehydration, natural gas liquids recovery, and fractionation units.
  • The economic study (class V) showed that the estimated capital expenditure (CAPEX) of the gas processing plant for the SA gas was 36.6 MMUSD, considering local conditions. The plant consisted of gas sweetening, dehydration, recovery, and fractionation stages.
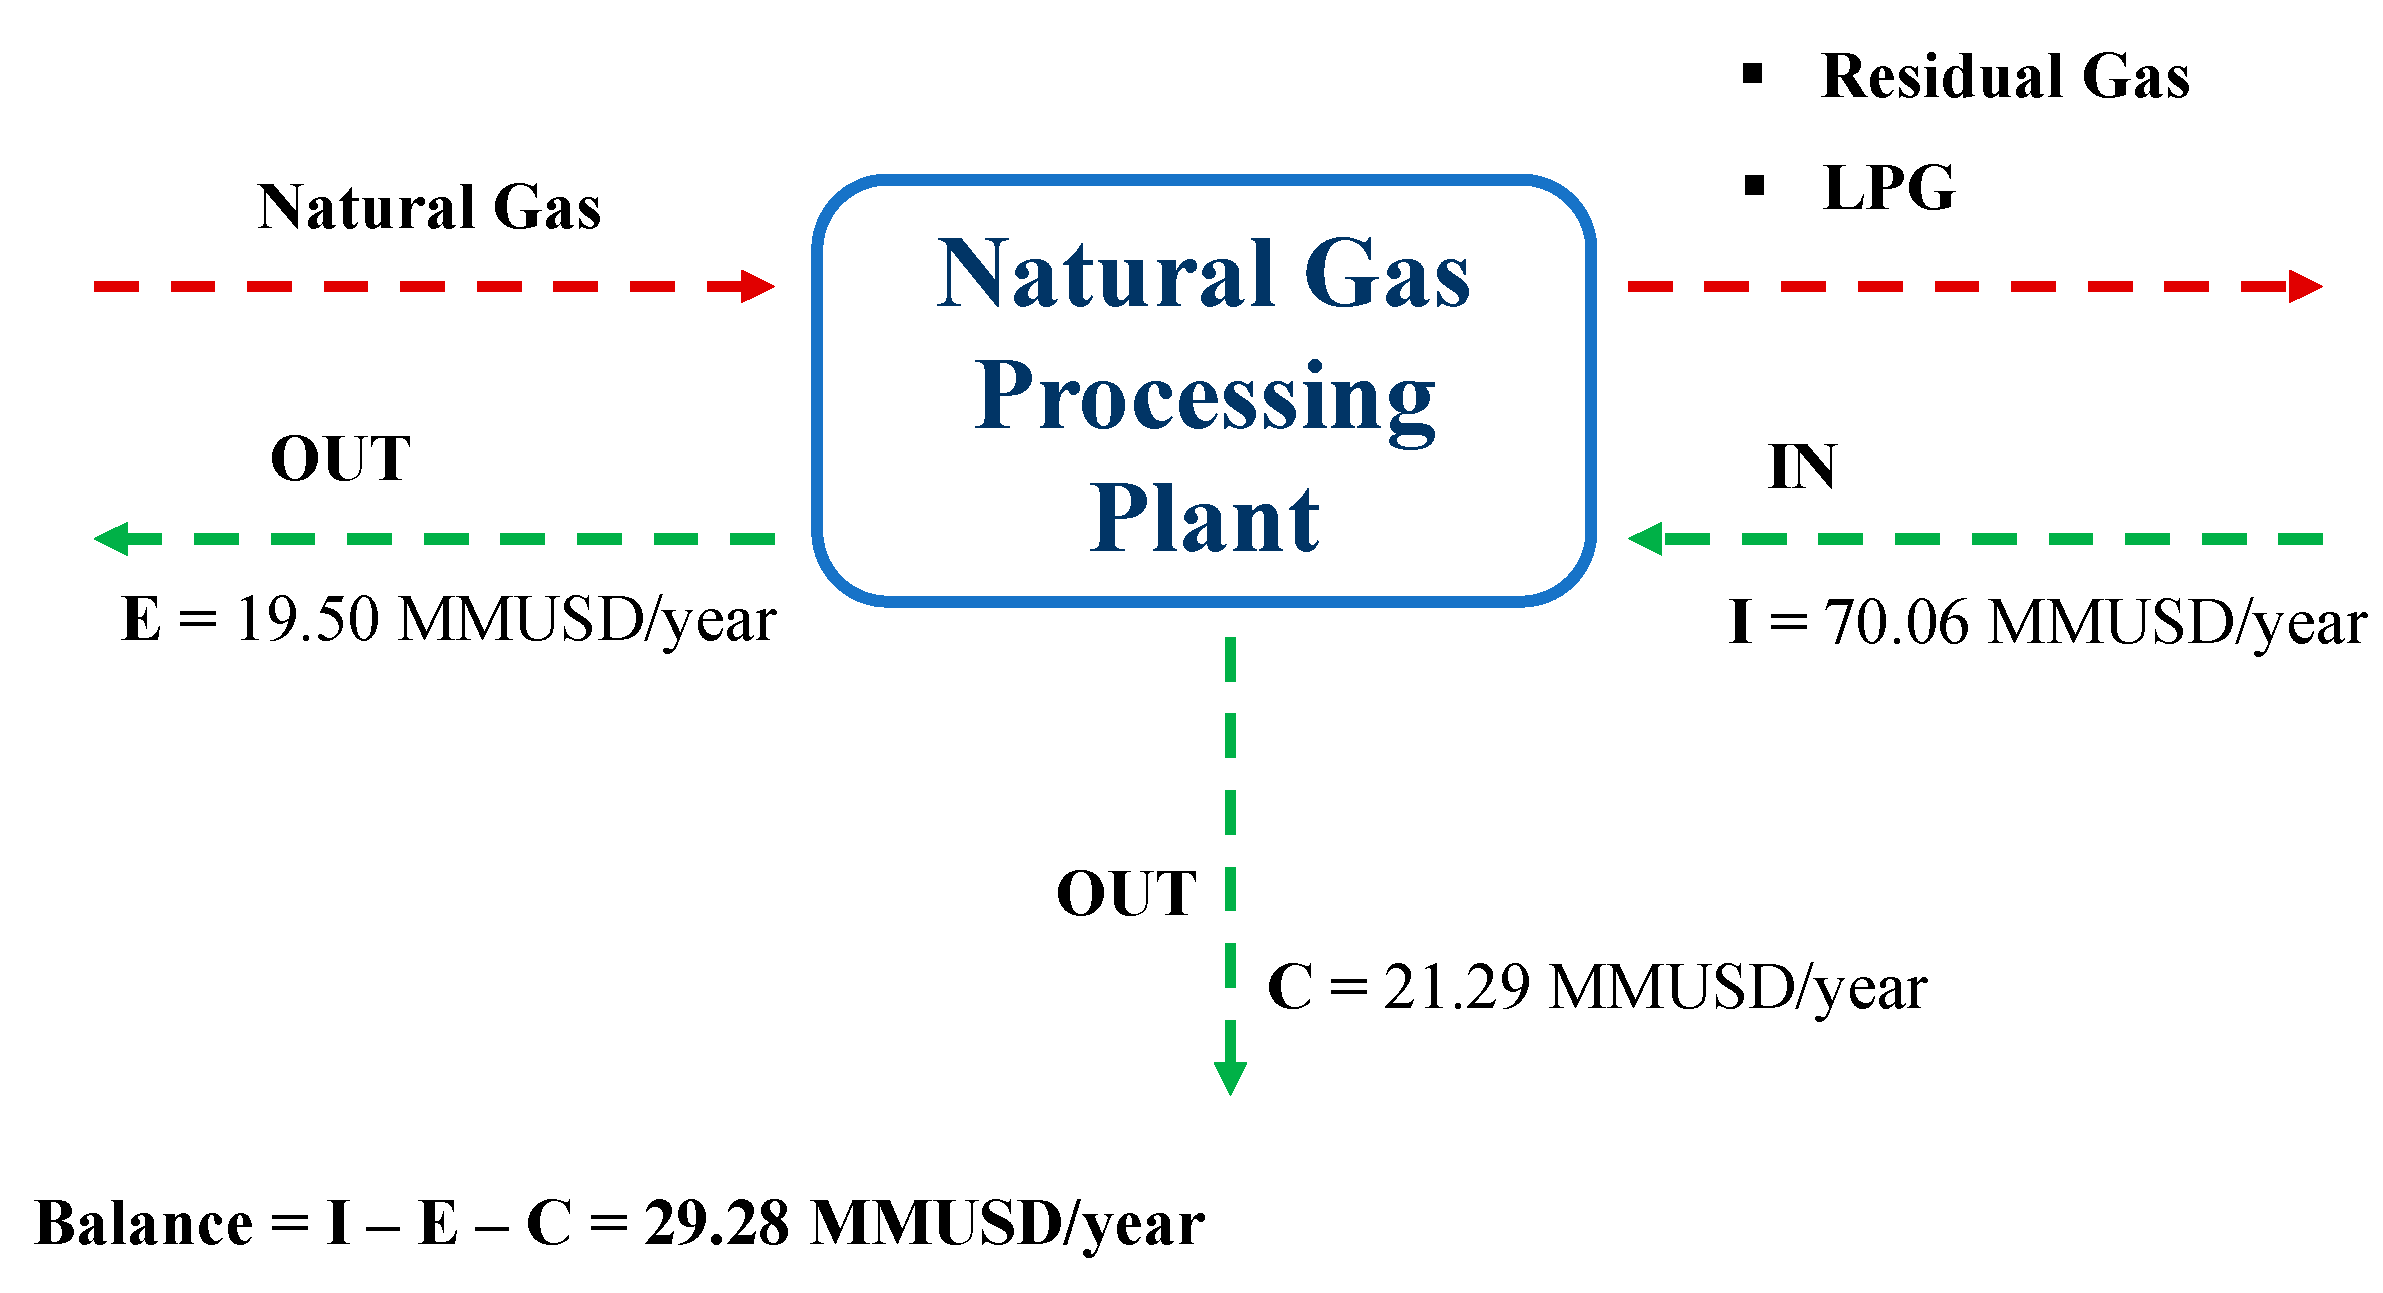
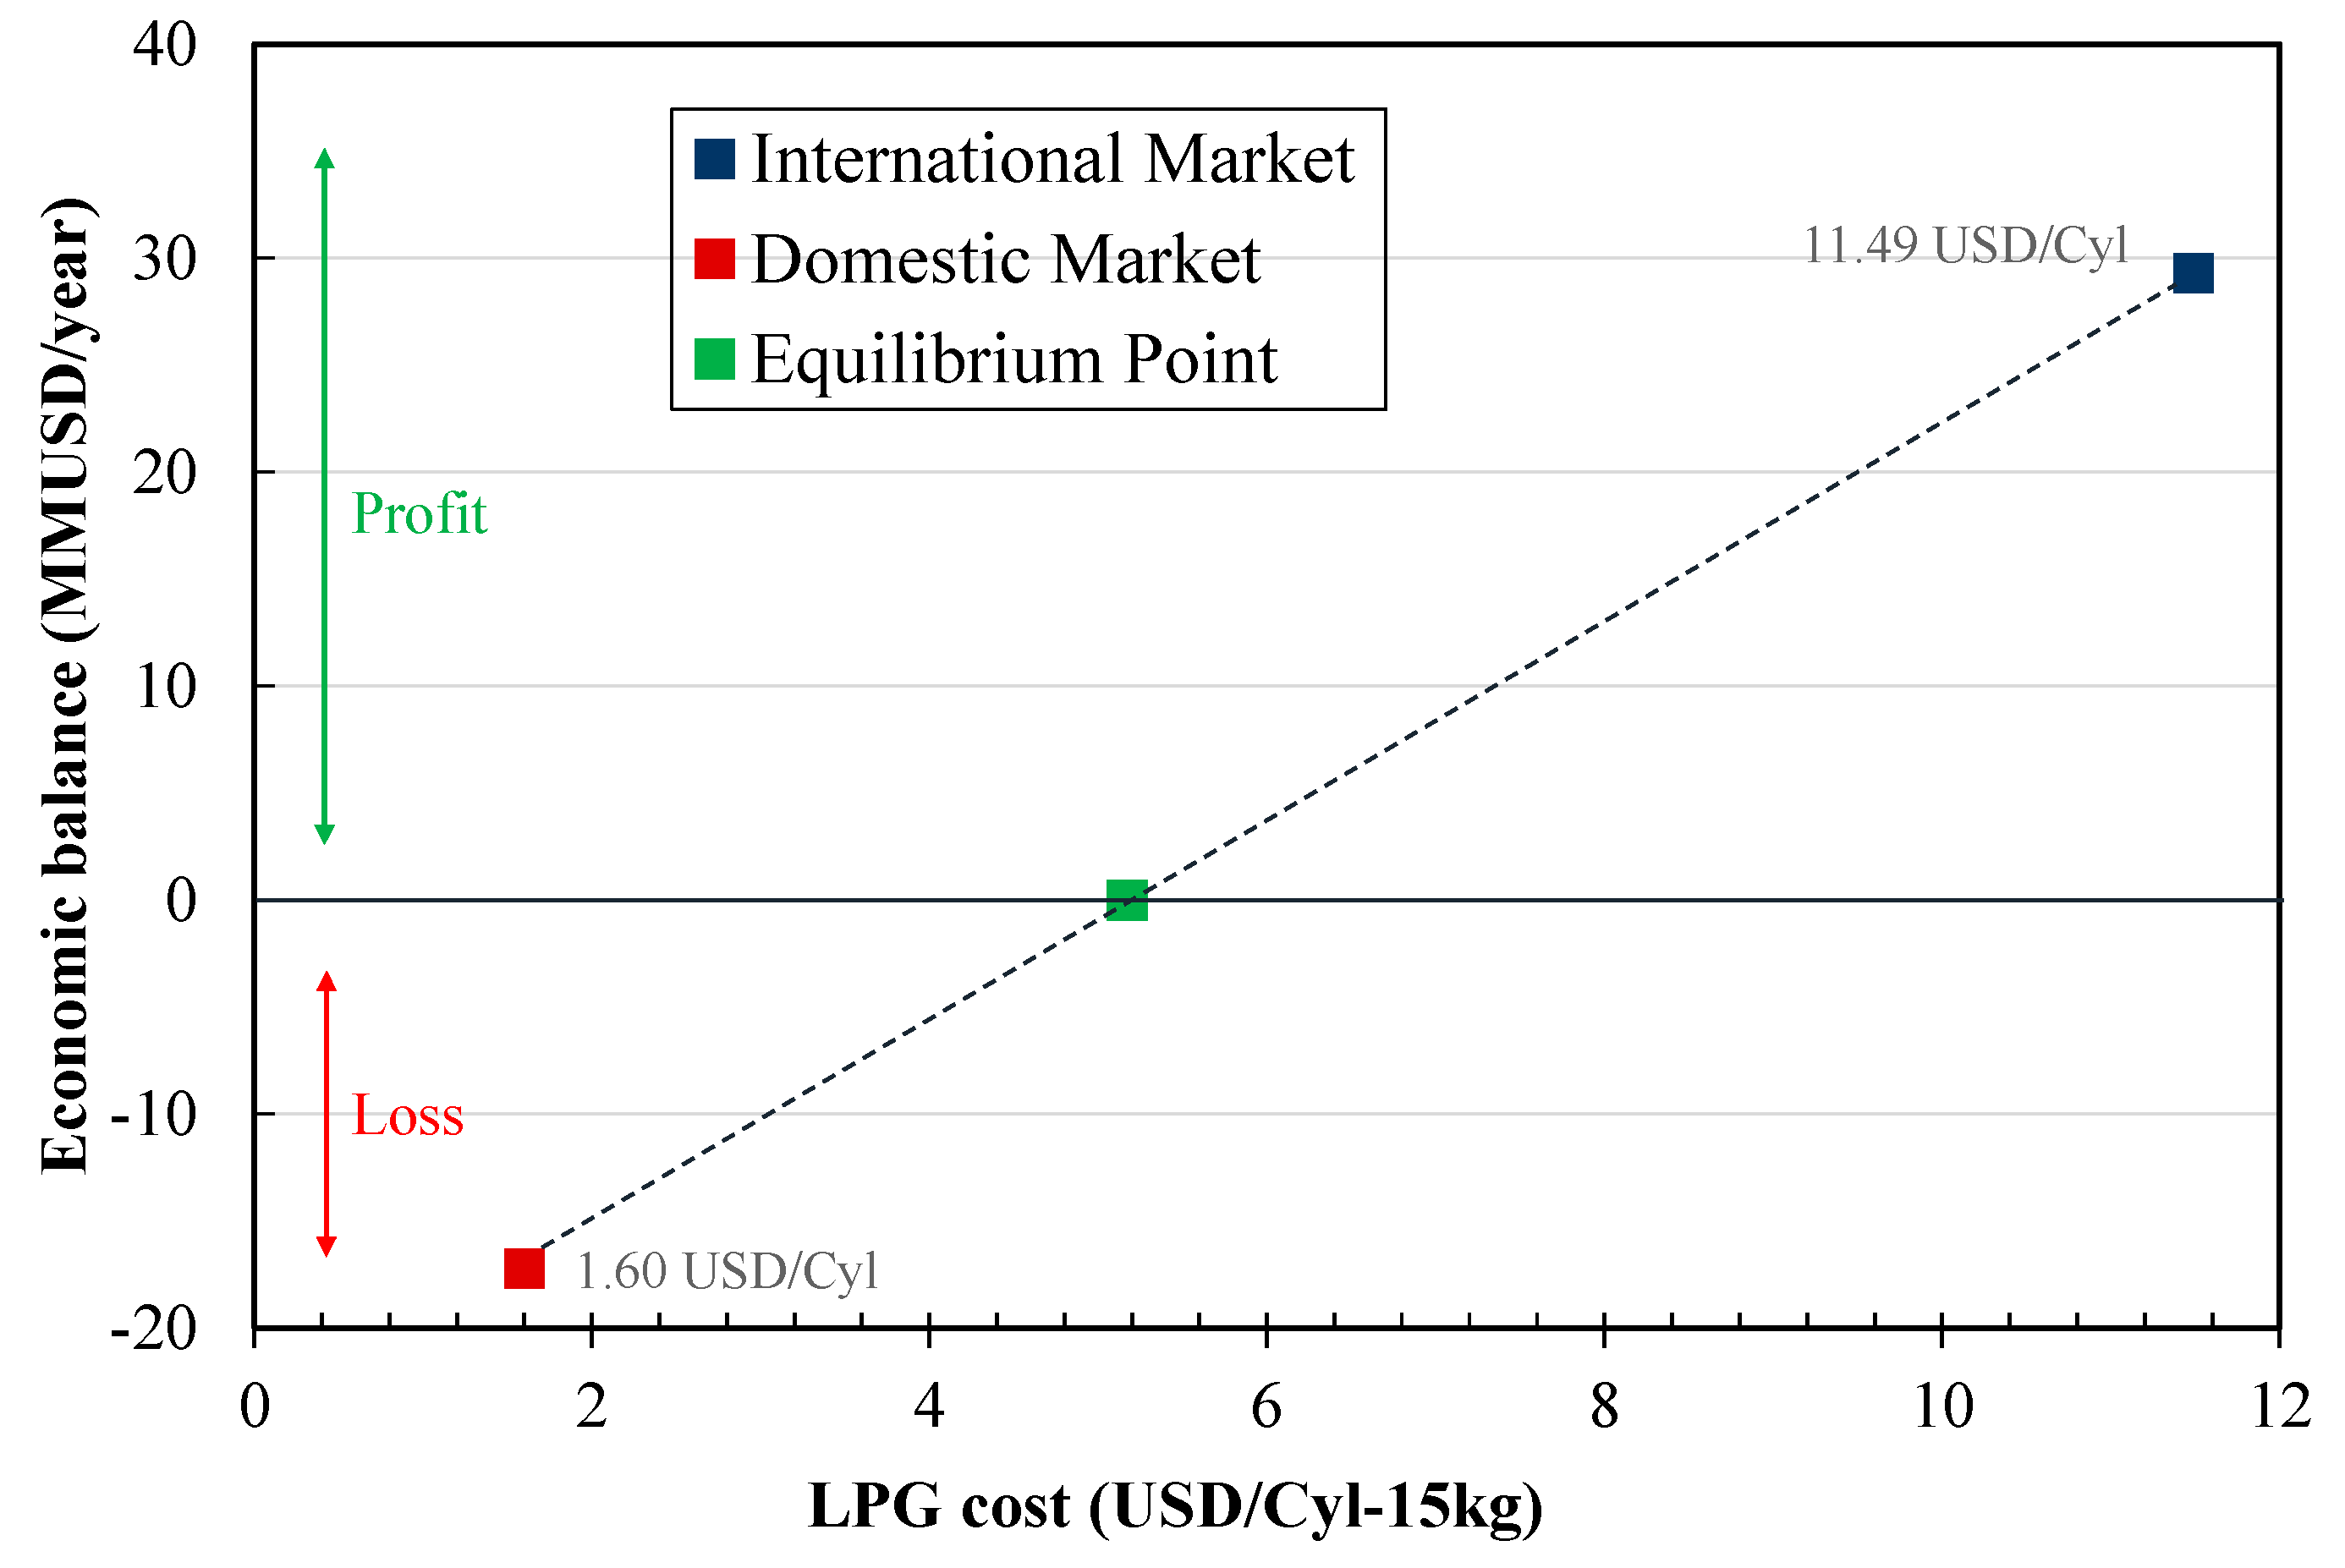
  • The economic balance study of the SA gas processing plant showed that the introduction of 2548 bbl/day of LPG would replace 49.37 MMUSD/year in LPG imports. The potential savings of producing this amount of LPG would give the Ecuadorian economy a 32.13 MMUSD/year profit.
  • The study results showed that it is possible to value natural gas streams—through conventional conditioning and processing technologies—to produce LPG as an alternative to reduce gas flaring in Ecuador. It would make it possible to supply the internal market with this commodity, which has a high social impact, as it is used in homes as fuel for food preparation and hot water services, as well as in the local commercial sector dedicated to food services. Additionally, this study was raised to demonstrate that despite the LPG price being regulated in Ecuador, the development of an LPG production plant is viable. Modest capital investments would be required, financed with the money saved by reducing the import of LPG. The findings of this study can be used in similar engineering analyses worldwide that require the valuation of natural gas using conventional and mature technologies, emphasizing those countries where the government subsidizes LPG and other commodities.
  • Finally, an economic study of the associated gas compression, gathering process, and related infrastructure is recommended to have a more accurate value of the CAPEX of the gas processing plant. In addition, it is required to estimate labor costs (workers’ wages and insurance) to have a better perspective of the economy of the gas processing plant. For future studies on this topic, conducting a deep analysis of the associated gas produced in the different wells of the Amazon region was recommended to select more flexible equipment with a minimum operating range to process the gas.

Author Contributions

Conceptualization, D.O., A.V. and M.R.; methodology, D.O. and M.R.; validation, A.V. and M.R.; formal analysis, A.V.; investigation, D.O., D.C. and M.R.; data curation, D.O. and D.C.; writing—original draft preparation, D.O.; writing—review and editing, D.O. and M.R.; visualization, M.R.; supervision, M.R. All authors have read and agreed to the published version of the manuscript.

Funding

This research received no external funding.

Data Availability Statement

The data supporting this study’s findings are available from the corresponding author (M.R.), upon reasonable request.

Acknowledgments

The authors acknowledge the support of the School of Chemical Sciences and Engineering at Yachay Tech University (project number CHEM21-10). We express thanks to the Ministry of Energy and Mines for authorizing us to use and adapt Ecuador’s map of blocks and oil infrastructure (official letter No. MEM-VH-2023-0321-OF).

Conflicts of Interest

The authors declare no conflict of interest.

Abbreviations

AU Gasassociated natural gas from the Auca field
BTEXbenzene, toluene, ethylbenzene, and xylene
BTU/ft3British thermal unit per cubic feet
C1methane
C2ethane
C3propane
C4’sbutanes (n-butane and i-butane)
C5+natural gasoline
CO2carbon dioxide
CAPEXcapital expenditure
CEPCIchemical engineering plant cost index
Cylcylinder
Cyl-15kg15 kg cylinder
CU Gasassociated natural gas from the Cuyabeno field
bpdbarrels per day
DEAdiethanolamine
EY Gasassociated natural gas from the Edén Yuturi field
GalU.S. gallons
gpmUS gallons per minute
GPMliquid hydrocarbon content expressed in gallons can be obtained for every 1000 cubic feet of natural gas at standard conditions
GPSAgas processors suppliers association
H2Shydrogen sulfide
IN Gasassociated natural gas from the Indillana field
ITT Gasassociated natural gas from the Tiputini field
LA Gasassociated natural gas from the Lago Agrio field
LI Gasassociated natural gas from the Libertador field
lb/MMscfpound per million standard cubic feet
LPGliquefied petroleum gas
LNGliquefied natural gas
MMbblmillion barrels
MMbbl/yearmillion barrels per year
MMBTUmillion British thermal unit
Mscfthousand standard cubic feet
MMscfmillion standard cubic feet
MMscfdmillion standard cubic feet per day
MMUSDmillion U.S. dollars
MMUSD/yearmillion U.S. dollars per year
NGnatural gas
NGLnatural gas liquids
N2nitrogen
OGE&EEoptimization of power generation and energy efficiency
OPEXoperational expenditure
OY Gasassociated natural gas from the Oso Yuralpa field
Ppressure (psia)
PA Gasassociated natural gas from the Palo Azul field
ppmvparts per million by volume
Qgas flowrate (MMscfd)
SA Gasassociated natural gas from the Sacha field
SH Gasassociated natural gas from the Shushufindi field
ShGPShushufindi gas plant
TCFtrillion cubic feet (1012 cubic feet)
TEGtriethylene glycol
Tm/dmetric tons per day
USD/MMBTUUS dollar per million British thermal unit
USD/MscfU.S. dollar per thousand standard cubic feet
USD/bblU.S. dollar per barrel
Ttemperature (°F)

Appendix A

Table A1. Premises and assumptions for the capital cost data [28,29].
Cost IncludeCost Exclude
Costs are directly associated with the process.
Two-month startup operating expenses.
Initial supplies and minimum spare parts.
Sales taxes.
Contingency of 10%.
New facilities only.
2017 US Gulf Coast location.
Miscellaneous equipment associated with grass-roots plant.
Costs not directly associated with the process.
Site and site preparation.
Owner home office costs.
Interest in investment during construction.
Construction insurance and bond costs.

References

  1. Bahadori, A. Natural Gas Processing Technology and Engineering Design, 2nd ed.; Elsevier: Oxford, UK, 2014. [Google Scholar] [CrossRef]
  2. Energy Institute. Statistical Review of World Energy, 72nd ed.; Energy Institute: London, UK, 2023; Available online: https://www.energyinst.org/statistical-review (accessed on 27 June 2023).
  3. ElBadawy, K.; Teamah, M.; Shehata, A.; Hanfy, A. Simulation of liquefied petroleum gas (LPG) production from natural gas using fractionation towers. Int. J. Adv. Sci. Technol. Res. 2018, 6, 148–153. [Google Scholar] [CrossRef]
  4. Hubbard, R. The role of gas processing in the natural-gas value chain. J. Pet. Technol. 2009, 61, 65–71. [Google Scholar] [CrossRef]
  5. Speight, J.G. Natural Gas: A Basic Handbook, 2nd ed.; Elsevier: Cambridge, UK, 2019; ISBN 9780128095706. [Google Scholar]
  6. Mokhatab, S.; Poe, W.; Mak, J. Handbook of Natural Gas Transmission and Processing: Principles and Practices, 3rd ed.; Gulf Professional Publishing: Oxford, UK, 2015. [Google Scholar] [CrossRef]
  7. The World Bank. Seven Countries Account for Two-Thirds of Global Gas Flaring. 2021. Available online: https://www.worldbank.org/en/news/press-release/2021/04/28/seven-countries-account-for-two-thirds-of-global-gas-flaring (accessed on 27 June 2023).
  8. Elvidge, C.; Zhizhin, M.; Baugh, K.; Hsu, F.-C.; Ghosh, T. Methods for global survey of natural gas flaring from visible infrared imaging radiometer suite data. Energies 2016, 9, 14. [Google Scholar] [CrossRef] [Green Version]
  9. The World Bank. Environmental, Health and Safety Guidelines for Onshore Oil and Gas Development, 1st ed.; World Bank Group: Washington, DC, USA, 2007; Available online: http://documents.worldbank.org/curated/en/130481486373751616/Environmental-health-and-safety-guidelines-for-onshore-oil-and-gas-development (accessed on 27 June 2023).
  10. The World Bank. Global Gas Flaring Tracker Report; World Bank Group: Washington, DC, USA, 2023; Available online: https://www.worldbank.org/en/topic/extractiveindustries/publication/2023-global-gas-flaring-tracker-report (accessed on 27 June 2023).
  11. The World Bank. Global Gas Flaring Reduction. A Public-Private Partnership. A Voluntary Standard for Global Gas Flaring and Venting Reduction; World Bank Group: Washington, DC, USA, 2004; Available online: https://documents1.worldbank.org/curated/en/342761468780614074/pdf/295550GGF0a0pu1ship10no10401public1.pdf (accessed on 27 June 2023).
  12. Ayala, D.; Padilla, W.; Ayala, S. Energy efficiency and secondary recovery: Two management options for a mature fields in Ecuador. In Proceedings of the SPE Canadian Energy Technology Conference and Exhibition, Calgary, AB, Canada, 10 March 2023. [Google Scholar]
  13. Carbon Limits AS. Reduction of Gas Flaring in Ecuador and Peru-Final Report; Carbon Limits AS: Oslo, Norway, 2017. [Google Scholar]
  14. Ministerio de Energía y Minas. Mapas Petroleros del Ecuador. 2023. Available online: https://www.recursosyenergia.gob.ec/mapas/ (accessed on 27 June 2023).
  15. EP Petroecuador. Cifras Institucionales. 2023. Available online: https://www.eppetroecuador.ec/?p=3721 (accessed on 27 June 2023).
  16. Facchinelli, F.; Pappalardo, S.E.; Codato, D.; Diantini, A.; Della Fera, G.; Crescini, E.; De Marchi, M. Unburnable and unleakable carbon in Western Amazon: Using VIIRS nightfire data to map gas flaring and policy compliance in the Yasuní biosphere reserve. Sustainability 2020, 12, 58. [Google Scholar] [CrossRef] [Green Version]
  17. Durango-Cordero, J.; Saqalli, M.; Parra, R.; Elger, A. Spatial inventory of selected atmospheric emissions from oil industry in Ecuadorian Amazon: Insights from comparisons among satellite and institutional datasets. Saf. Sci. 2019, 120, 107–116. [Google Scholar] [CrossRef] [Green Version]
  18. Facchinelli, F.; Pappalardo, S.E.; Della Fera, G.; Crescini, E.; Codato, D.; Diantini, A.; Moncayo Jimenez, D.R.; Fajardo Mendoza, P.E.; Bignante, E.; De Marchi, M. Extreme citizens science for climate justice: Linking pixel to people for mapping gas flaring in Amazon rainforest. Environ. Res. Lett. 2022, 17, 024003. [Google Scholar] [CrossRef]
  19. Instituto Ecuatoriano de Normalización. NTE INEN 0111: 1998 Cilindros de Acero Soldados para gas Licuado de Petróleo GLP. Requisitos e Inspección; INEN: Quito, Ecuador, 1998. [Google Scholar]
  20. Orellana, M. Estimación Del Costo de Comercialización de Los Cilindros de GLP En La CEM “Austrogas”. Bachelor’s Thesis, Universidad de Cuenca, Cuenca, Ecuador, 2011. [Google Scholar]
  21. Echeverria, M.; Viloria, A.; Ricaurte, M. Identification of Operational Improvements in the Production of LPG through the Simulation of Processes: Case Study Ecuadorian Market. Bol. Acad. Nac. Ing. Y Hábitat 2021, 52, 78–84. [Google Scholar]
  22. Pazos, J. Optimización de la Captación de Gas Natural y Producción de GLP en los Complejos Petroleros del Nororiente Ecuatoriano. Master’s Thesis, Instituto de Altos Estudios Nacionales, Quito, Ecuador, 2008. [Google Scholar]
  23. Ricaurte, M.; Ordóñez, P.; Navas-Cárdenas, C.; Meneses, M.; Tafur, J.; Viloria, A. Industrial processes online teaching: A good practice for undergraduate engineering students in times of COVID-19. Sustainability 2022, 14, 4776. [Google Scholar] [CrossRef]
  24. Instituto Ecuatoriano de Normalización. Catálogo de Normas Técnicas; INEN: Quito, Ecuador, 2023; Available online: http://apps.normalizacion.gob.ec/descarga/ (accessed on 27 June 2023).
  25. The World Bank. World Development Indicators Database. 2023. Available online: https://databank.worldbank.org/home# (accessed on 27 June 2023).
  26. Montenegro, J.; Veloz, C.; Ricaurte, M. Estimating water content of natural gas mixtures considering heavy hydrocarbons contribution using artificial neural networks. Pet. Sci. Technol. 2023, 41, 819–833. [Google Scholar] [CrossRef]
  27. Ricaurte, M.; Fernández, J.M.; Viloria, A. An improved method for calculating critical temperatures and critical pressures in natural gas mixtures with up to nC11 hydrocarbons. Oil Gas Sci. Technol.–Rev. d’IFP Energies Nouv. 2019, 74, 53. [Google Scholar] [CrossRef] [Green Version]
  28. Tannehill, C.; Chandra, A. Budget Estimate Capital Cost Curves for Gas Conditioning and Processing-Updated 2018; GPSA: Tulsa, OK, USA, 2018. [Google Scholar]
  29. Kidnay, A.; Parrish, W.; McCartney, D. Fundamentals of Natural Gas Processing, 3rd ed.; Taylor & Francis Group: New York, NY, USA, 2020. [Google Scholar] [CrossRef]
  30. Gas Processors Suppliers Association. Engineering Data Book, 12th ed.; GPSA: Tulsa, OK, USA, 2004. [Google Scholar]
  31. Towering Skills. Cost Indices. Available online: https://toweringskills.com/financial-analysis/cost-indices/#chemical-engineering-plant-cost-index-cepci (accessed on 25 June 2023).
  32. Chemical Engineering. The Chemical Engineering Plant Cost Index. Available online: https://www.chemengonline.com/pci-home (accessed on 25 June 2023).
  33. Cleveland, C.; Morris, C. Dictionary of Energy, 2nd ed.; Elsevier: Amsterdam, The Netherlands, 2015; ISBN 978-0-08-096811-7. [Google Scholar]
  34. López, M. Optimización del Transporte de Crudo Pesado, Mediante la Implementación de un Sistema de Calentamiento de Fluido en el Campo Ishpingo-Tambococha-Tiputini (ITT). Bachelor’s Thesis, Universidad Central del Ecuador, Quito, Ecuador, 2017. [Google Scholar]
  35. Sánchez, N. Estudio de Condiciones Técnicas para la Inyección de CO2 Como Método de Recuperación Mejorada en el Campo Edén Yuturi EPF Bloque 12. Bachelor’s Thesis, Universidad Tecnológica Equinoccial, Quito, Ecuador, 2016. [Google Scholar]
  36. Quezada, D.; Vázquez, C. Estudio de Simulación Matemática para la Evaluación de un Fracturamiento Hidráulico en el Campo Lobo. Bachelor’s Thesis, Universidad Central del Ecuador, Quito, Ecuador, 2018. [Google Scholar]
  37. Vicuña, S. Evaluación de la Factibilidad de Industrializar Helio a Partir de Gas Natural y Gases de Pozos Petroleros Producidos en Ecuador. Bachelor’s Thesis, Escuela Politécnica Nacional, Quito, Ecuador, 2011. [Google Scholar]
  38. Jiménez, C. Optimización de los Procesos en las Facilidades de Producción en el Campo Sacha, Estación Sacha Central. Bachelor’s Thesis, Escuela Politécnica Nacional, Quito, Ecuador, 2009. [Google Scholar]
  39. Martínez, G. Estudio Técnico de la Obtención de CO2 a Partir del Gas Asociado en el Campo Indillana y su Aprovechamiento para ser Utilizado en Recuperación Mejorada. Bachelor’s Thesis, Universidad Central del Ecuador, Quito, Ecuador, 2017. [Google Scholar]
  40. Godoy, J.C.; Villamar, D.; Soria, R.; Vaca, C.; Hamacher, T.; Ordóñez, F. Preparing the Ecuador’s power sector to enable a large-scale electric land transport. Energies 2021, 14, 5728. [Google Scholar] [CrossRef]
  41. United States Environmental Protection Agency. Methane Emissions from the Natural Gas Industry. Volume 14: Glycol Dehydrators; EPA: Austin, TX, USA, 1995. [Google Scholar]
  42. U.S. Energy Information Administration. Henry Hub Natural Gas Spot Price. Available online: https://www.eia.gov/dnav/ng/hist/rngwhhdM.htm (accessed on 28 June 2023).
  43. Carrillo, C.; Parra, R. Comportamiento del margen de refinación en el sector hidrocarburífero del Ecuador en el 2018. FIGEMPA Investig. Y Desarro. Univ. Cent. Ecuador 2021, 11, 30–39. [Google Scholar] [CrossRef]
  44. EP Petroecuador. Precios de Combustibles. 2021. Available online: https://www.eppetroecuador.ec/?p=6855 (accessed on 28 June 2023).
  45. Agencia de Regulación y Control de Energía y Recursos Naturales no Renovables. Precio de Combustibles. Available online: https://www.controlrecursosyenergia.gob.ec/precios-combustibles/ (accessed on 26 June 2023).
  46. Katysheva, E. Creation of the Integrated Field Model to Increase the Oil and Gas Assets Management. In Proceedings of the 20th International Multidisciplinary Scientific GeoConference SGEM, Albena, Bulgaria, 16–25 August 2020. [Google Scholar] [CrossRef]
  47. Marinina, O.; Nechitailo, A.; Stroykov, G.; Tsvetkova, A.; Reshneva, E.; Turovskaya, L. Technical and economic assessment of energy efficiency of electrification of hydrocarbon production facilities in underdeveloped areas. Sustainability 2023, 15, 9614. [Google Scholar] [CrossRef]
  48. Katysheva, E. Analysis of the Interconnected development potential of the oil, gas and transport industries in the Russian Arctic. Energies 2023, 16, 3124. [Google Scholar] [CrossRef]
  49. Katysheva, E.G. Application of bigdata technology to improve the efficiency of Arctic shelf fields development. IOP Conf. Ser. Earth Environ. Sci. 2021, 937, 042080. [Google Scholar] [CrossRef]
Figure 1. Hydrocarbon resources in Ecuador (adapted from [14]).
Resources 12 00091 g001
Figure 2. LPG production and demand in Ecuador in recent years (data from [14,15]).
Resources 12 00091 g002
Figure 3. Shushufindi gas plant block diagram (adapted from [21]).
Resources 12 00091 g003
Figure 4. Methodology outline.
Resources 12 00091 g004
Figure 5. Associated gas production in the Amazon Region (adapted from [14]).
Resources 12 00091 g005
Figure 6. GPM C2+ and C3+ in the Amazon region.
Resources 12 00091 g006
Figure 7. Associated gas flowrate and GPM in the Amazon region. (a) GPM based upon C2+, (b) GPM based upon C3+.
Resources 12 00091 g007
Figure 8. Value chain and potential production of the SA gas processing plant.
Resources 12 00091 g008
Figure 9. Technology selection for SA gas processing: a proposal.
Resources 12 00091 g009
Figure 10. Estimated costs (class V) for the SA gas processing plant for 2023.
Resources 12 00091 g010
Figure 11. Simplified economic balance for SA gas processing plant considering an international market.
Resources 12 00091 g011
Figure 12. Economic balance considering some possible scenarios.
Resources 12 00091 g012
Figure 13. Cost of introducing 2548 barrels per day to the domestic LPG market.
Resources 12 00091 g013
Table 1. Associated gas in the Amazon region.
Mole Percent (Mole %)
CompoundsITT GasEY GasOY GasLA GasPA GasSH GasCU GasLI GasAU GasSA GasIN Gas
C145.0130.9371.2055.873.8237.1014.5625.9755.2258.5438.58
C24.915.319.5511.801.4010.534.279.349.3610.546.56
C34.977.419.0514.784.7616.4811.5617.1314.4613.779.35
i-C40.971.721.902.071.162.662.372.372.814.432.41
n-C42.022.732.224.642.946.755.386.924.940.001.40
C5+1.121.841.983.174.716.775.968.183.570.821.45
N230.515.940.732.091.132.651.811.823.822.554.81
CO210.4944.123.365.5880.0817.0654.0928.275.829.3535.44
Pressure (psia)128.70112.7054.7039.7064.2040.4538.7045.2040.9539.7064.70
Temperature (°F)161.00130.0080.0084.00189.05129.61142.52153.77119.6684.00160.00
Flowrate (MMscfd) [15]2.474.731.027.067.7217.654.808.9710.6621.504.11
References[34][35][36][22][37][37][37][37][37][38][39]
ITT Gas: Tiputini; EY Gas: Edén Yuturi; OY Gas: Oso Yaralpa; LA Gas: Lago Agrio; PA Gas: Palo Azul; SH Gas: Shushufindi; CU Gas: Cuyabeno; LI Gas: Libertador; AU Gas: Auca; SA Gas: Sacha; IN Gas: Indillana.
Table 2. Feed SA gas conditions and processing specifications.
Feed SA Gas Conditions
Componentsmole %
C158.54
C210.54
C313.77
i-C44.43
n-C40.00
C5+0.82
N22.55
CO29.35
Pressure (psia)39.70
Temperature (°F)84.00
Flowrate (MMscfd)21.50
GPM C3+5.5
C3+ Gas Content19.02 mole %
SA Gas Processing Specifications
Separation Efficiency (C3+)90%
Table 3. Economic values for the balance analysis.
ValueUnitSource
Natural gas price *2.65 USD/MMBTU[42]
Natural gas processing cost 3.0USD/Mscf[43]
Liquefied petroleum gas price 65.89 USD/bbl[15]
Notes: * Henry Hub Natural Gas Spot Price for the first quarter of 2023. Referential value with refineries operating cost in Ecuador, assuming a post residual gas conditioning. Import LPG price (international price) reported by the national oil company for the first quarter of 2023.
Disclaimer/Publisher’s Note: The statements, opinions and data contained in all publications are solely those of the individual author(s) and contributor(s) and not of MDPI and/or the editor(s). MDPI and/or the editor(s) disclaim responsibility for any injury to people or property resulting from any ideas, methods, instructions or products referred to in the content.

