Article

The Application of Image Acquisition and Processing Techniques for the Determination of Wooden Pellet Length as an Alternative to ISO 17829

Department of Agricultural, Food and Environmental Sciences, Marche Polytechnic University, Via Brecce Bianche, 60131 Ancona, Italy
*
Author to whom correspondence should be addressed.
Resources 2023, 12(10), 125; https://doi.org/10.3390/resources12100125
Submission received: 7 September 2023 / Revised: 10 October 2023 / Accepted: 19 October 2023 / Published: 20 October 2023

Abstract

:
Global market developments of wooden pellets have led to an increased attention towards pellet quality. ISO 17829 defines the procedure to assess pellets’ geometrical parameters, which play a key role in pellet overall quality. For instance, pellet length influences the spatial arrangement within the stove brazier, affecting the interaction between combustion air and solid biofuel, thus affecting CO emissions. The ISO 17829 method is time-consuming and affected by the operator’s accuracy. Recent studies have investigated the application of new methods, such as image processing, for monitoring the aforementioned parameter. While also assessing the representativeness of ISO 17829’s method, this paper proposes an alternative measuring tool based on image processing named Pellet Length Detector (PLD). Samples were obtained from Italian pellet suppliers and subjected to a multiple dimensional analysis via PLD and caliper. The PLD’s overall performance led to satisfactory results, with only 10% of the samples having a bias between replicates of >2 mm. Compared to caliper, PLD led to an average bias of 0.5 mm. Moreover, a one-way ANOVA highlighted that increasing the sample size between caliper and PLD leads to a greater statistical similarity of the data obtained for different replicates. Given the prototype status of the device, a further performance upgrade is possible, especially through error modeling.

1. Introduction

The last decade has been characterized by a global increase in attention towards wooden pellets [1,2]. For instance, since 2012, Europe has witnessed a 29% increase in pellet production [3]. Noteworthy cases are Germany which, between 2012 and 2021, increased production by 49% or Estonia which, from a 442-thousand-ton production in 2012, reached 1600 thousand tons in 2021 (corresponding to a 260% increase). Whilst Italy, since 2010, which was one of the largest producers in Europe, has been subjected to a decline in production that has been reversed in recent years [3,4].
Concurrent to production, the attention towards pellet quality has increased as well. In fact, since 2011, the worldwide commercialization of ENplus certified pellets has increased from 1 million up to 8 million tons [5]. This suggests an increase in attention towards the quality of pellets by both producers and consumers.
Pellet threshold values of quality parameters or proprieties such as chemical, energetical and physical ones, are defined by standard ISO 17225-2 [6]. Monitoring these parameters not only helps manufacturers in the production of a more readily marketable and higher-appeal product but also aids consumers in the purchasing of a low-polluting and energy-efficient solid biofuel.
In fact, pellets’ properties, such as moisture, ash content and dimensional parameters, play a key role in the pellets’ combustion quality. For instance, moisture content highly and negatively impacts the calorific value [7,8,9], whilst a higher average pellet length leads to an increase in CO emissions during combustion [10,11]. Moreover, pellet length impacts the fuels’ durability and therefore the fines’ content and dust generation during handling and other logistic stages [12].
Standards are not limited to outlining the qualitative parameters of solid biofuels, but they also define procedures for monitoring them.
Specifically, ISO 17829 defines the procedure to assess pellets’ length and diameter [13]. However, specified procedures are unclear and might lead to an unrepresentative analysis. Namely, there is a discordance in sample size to be analyzed, once stated in mass and later in the number of pellets. Regardless, considering the latter to be valid, ISO 17829 suggests an analysis of 40–50 pellets through the use of a precision caliper. This operation is time-consuming and is affected by the operator’s accuracy.
Studies have highlighted the importance of a wide sample size for obtaining data representative of larger mass piles [14]. However, increasing the sample size leads to higher costs in time and personnel. Specifically for pellets, 40–50 pellets are thought to be an insufficient number to effectively represent a standard 15 kg bag.
Recent studies have investigated the application of new technologies for the monitoring of fuels’ and biomasses’ overall quality [15,16]. For example, Oh et al. applied image processing for the assessment of the particle size distribution of carbon pellets, emphasizing the need to find alternative and time-efficient measurement methods that can be used directly on the production line [17]. Furthermore, image processing techniques have begun to be widely investigated for the assessment of the quality parameters of densified biomasses, such as briquettes and pellets [16,18]. For example, Jägers et al. proposed an innovative method for the determination of the sample size via image acquisition, binarization and the detection of pellets [19]. These studies highlight the industry’s interest in affordable and alternative methods that allow for the analysis of a large number of pellets thoroughly and within a short time, possibly also enabling monitoring activities directly on the production line. Thus, while also assessing the representativeness of the sample size suggested by ISO 17829 in relation to a whole pellet bag, this paper proposes and evaluates a rapid and alternative measuring tool based on image processing to assess pellets’ dimensional parameters, especially pellet length. In addition, the components’ low cost and the device’s portability make it easily accessible to all industry operators.

2. Materials and Methods

2.1. Sample Preparation

A total of 20 soft-wood pellet bags of 15 kg each were provided by Italian pellet suppliers. Each bag was considered as a sample. Each sample was homogenized and reduced through coning and quartering, according to standard methodology [20]. Lastly, from each reduced bag, a total of 100 pellets were manually and randomly selected, making up 20 samples of 100 pellets each, as intended for a dimensional analysis.

2.2. Dimensional Analysis

Each sample was analyzed assessing pellet dimensional parameters through the use of a Borletti digital caliper with 0.01 mm resolution, according to ISO 17829’s methodology, and a prototypal image-based measuring system, named Pellet Length Detector (PLD). The latter was produced by the Italian IT company Metacortex in collaboration with Laboratorio Biomasse founded by the Polytechnic University of Marche (Figure 1). Each sample was analyzed by the same experienced operator.
The PLD is made up of the following components: (i) a Raspberry Pi 4 Model B computing unit, (ii) a 5 MP Raspberry Pi Camera V2.1, (iii) Pi Fan Brushless, (iv) a Raspberry Pi DSI Display V1.0 (12.1 × 7.6 cm) and (v) the Python software version 3.12. In addition, for its operation, the PLD requires a green board for sample placing with a red plastic square (2 × 2 cm) on its top left corner that serves as a reference during measurements. Therefore, upon placing an exhaustive number of samples on the board (approximately 15), the PLD measures the length of pellets through (i) image acquisition, (ii) smoothing and binarization, (iii) object detection and segmentation and (iv) data acquisition through a comparison with the reference. Images should be taken at a height which exclusively allows for the green board on the scene to be shown and with the same camera focus in order to obtain images with an equal resolution.
Thus, pellets of each sample were analyzed three times via the PLD and once through the caliper. The PLD analyses were performed under the same natural ambient lighting conditions. The length data obtained via the caliper were considered as a ground truth for the PLD’s performance assessment.
Considering that the pellet production process ensures constant diameter values (6 ± 0.5 mm), the latter dimensional parameter was excluded from further data analysis.
Data from single PLD analyses, or replicates, and for each sample were compared to assess the reliability and variability of the obtained data.
Moreover, the average data of the three replicates for each sample obtained via the PLD (Lp) were compared with the caliper (Lc) to assess the bias of the PLD’s measurements and the bias on sample length (BL). The latter indicates the significance of measurement errors in relation to the actual length of the sample (Lc). Negative bias values indicate an overestimation of the PLD, whilst positive bias values indicate an underestimation.
During main dimensional analyses, the time required to perform the dimensional analysis via the PLD and caliper of the first 15 pellets of each sample was recorded. The timing data were used to estimate the time required to analyze a number of pellets consistent with what has been established by ISO 17829. A critical evaluation of the timing data was carried out to assess the operational advantages that PLDs can provide to the industry.

2.3. Representativeness Assessment of Standard Method

To evaluate the variability and representativeness of the data obtained via the ISO 17829 method, a total of 5 additional replicates via the caliper were performed on 10 random samples out of the previously analyzed 20 samples. Each replicate consisted of the measurement of 50 randomly selected pellets from the original whole 15 kg bags, for a total of 250 additional pellets for each sample. Moreover, to assess how analysis on larger samples could dilute the error given by the lack of representativeness, the same 10 samples were ulteriorly analyzed via the PLD performing an additional 5 replicates of 100 pellets each, for a total of 500 pellets for each sample. Each replicate was carried out by the same experienced operator who conducted the previous dimensional analysis (Figure 2).
The range of the average and quartiles was compared to evaluate the variability of the data between replicates of the same sample. Lastly, a one-way ANOVA was carried out to assess the significance of the differences between the replicates’ average data.

3. Results and Discussion

3.1. Single Replicates’ Data

The average data of the three PLD replicates (Lp1, Lp2 and Lp3) of each sample are reported in Table 1, as well as the average PLD measurement values (Lp), standard deviation, coefficient of variation (CV) and the range between the maximum and minimum replicate values.
Since PLD measurement is a non-standard measuring method, it proves difficult to define the repeatability and reproducibility of coefficients, all the more so ISO 17829 does not specify a repeatability and reproducibility assessment procedure. Therefore, a tolerance limit system was used to evaluate range values and highlight the variability between replicates. Range was chosen over standard deviation and CV given the increased intuitiveness.
The system classifies replicates on the basis of threshold values chosen on the basis of the authors’ subjective assessment. Thus, considering three range threshold values (≤1 mm, <2.1 mm and ≥2.1 mm), replicates of 45% of the samples showed a range of ≤1 mm, 45% showed a range of <2.1 mm and the remaining 10% of the samples showed a range of ≥2.1 mm (Figure 3). Further testing is needed to assess the variables that may have led to excessive range values.

3.2. Average Data

The average Lc and Lp data of each sample are reported in Table 2, as well as the bias values and BL, whilst a comparison of Lc, Lp and the measurement bias are shown in Figure 4a.
No relation between the mean samples’ length and absolute bias measurement values (Pearson: −0.2) was obtained. Out of the two samples characterized by high range values between replicates (G9259 and G9740), only G9259 led to an excessive bias (3.1 mm). Figure 4b highlights over- and underestimation bias trends between the samples. Negative bias values indicate the PLDs’ overestimation, whilst positive values indicate an underestimation. Thus, 60% of samples have been characterized by an overestimation of PLDs’ measurements, up to 3 mm.
The PLDs’ overestimation tendency, compared to the caliper measurements, might be given by object detection and segmentation stages during image acquisition. Specifically, segmentation measures the distance between the most extreme pixels of detected objects. Thus, the jagged ends of pellets, which, during caliper measurement, may encounter compression or breakage, although thin and of negligible size, in an image processing analysis contribute to a number of pixels per object.
As stated, given the absence of a procedure for the evaluation of repeatability, to assess the overall reliability of the PLDs’ average measurements, a bias tolerance threshold system was used.
Considering absolute bias values and hypothetical bias tolerance thresholds of 1, 2 and 3 mm, 8 out of 20 samples led to a bias greater than 1 mm, whilst 3 out of 20 samples led to a bias greater than 2 mm and only 1 sample led to a bias greater than 3 mm. Likewise, with BL threshold values of 5% and 10%, 7 out 20 samples led to a BL greater than 5% and 3 out of 20 sample led to a BL greater than 10%. Lastly, almost half of the samples (12 out of 20) led to bias values below both the 1 mm and 5% BL threshold values.
Whilst a measurement error of 3 mm could lead to unreliable and unrepresentative data, on the basis of the authors’ experience, a 2 mm tolerance threshold can be considered as an acceptable trade-off between accuracy and measurement quickness compared to the standard methodology. Alternative to a fixed millimeter bias threshold, a 10% BL threshold could represent a suitable tolerance threshold, which, considering that the average length of the analyzed samples was ~20 mm, corresponds to a 2 mm bias. Furthermore, it was observed that similar bias values have different significances between samples. For instance, samples G9723 and G9010 led to similar biases (2.4 mm and 2.6 mm) but different mean lengths, thus leading to different BL values (12.7% and 9.9%). Moreover, a strong correlation between the BL and bias was found (R2 = 0.9), suggesting that a limited increment of the measurement bias (e.g., 1 mm) leads to a significant increase in BL.
Lastly, the averaging mean data of all samples allowed for an overall evaluation of the PLDs’ performance (Table 3). Compared to the caliper analysis, the PLD led to an average overestimation of 0.5 mm and a BL average bias of 4.7%. Both values are considered acceptable, especially referring to commonly commercialized pellet samples which have an average length of 20 mm.

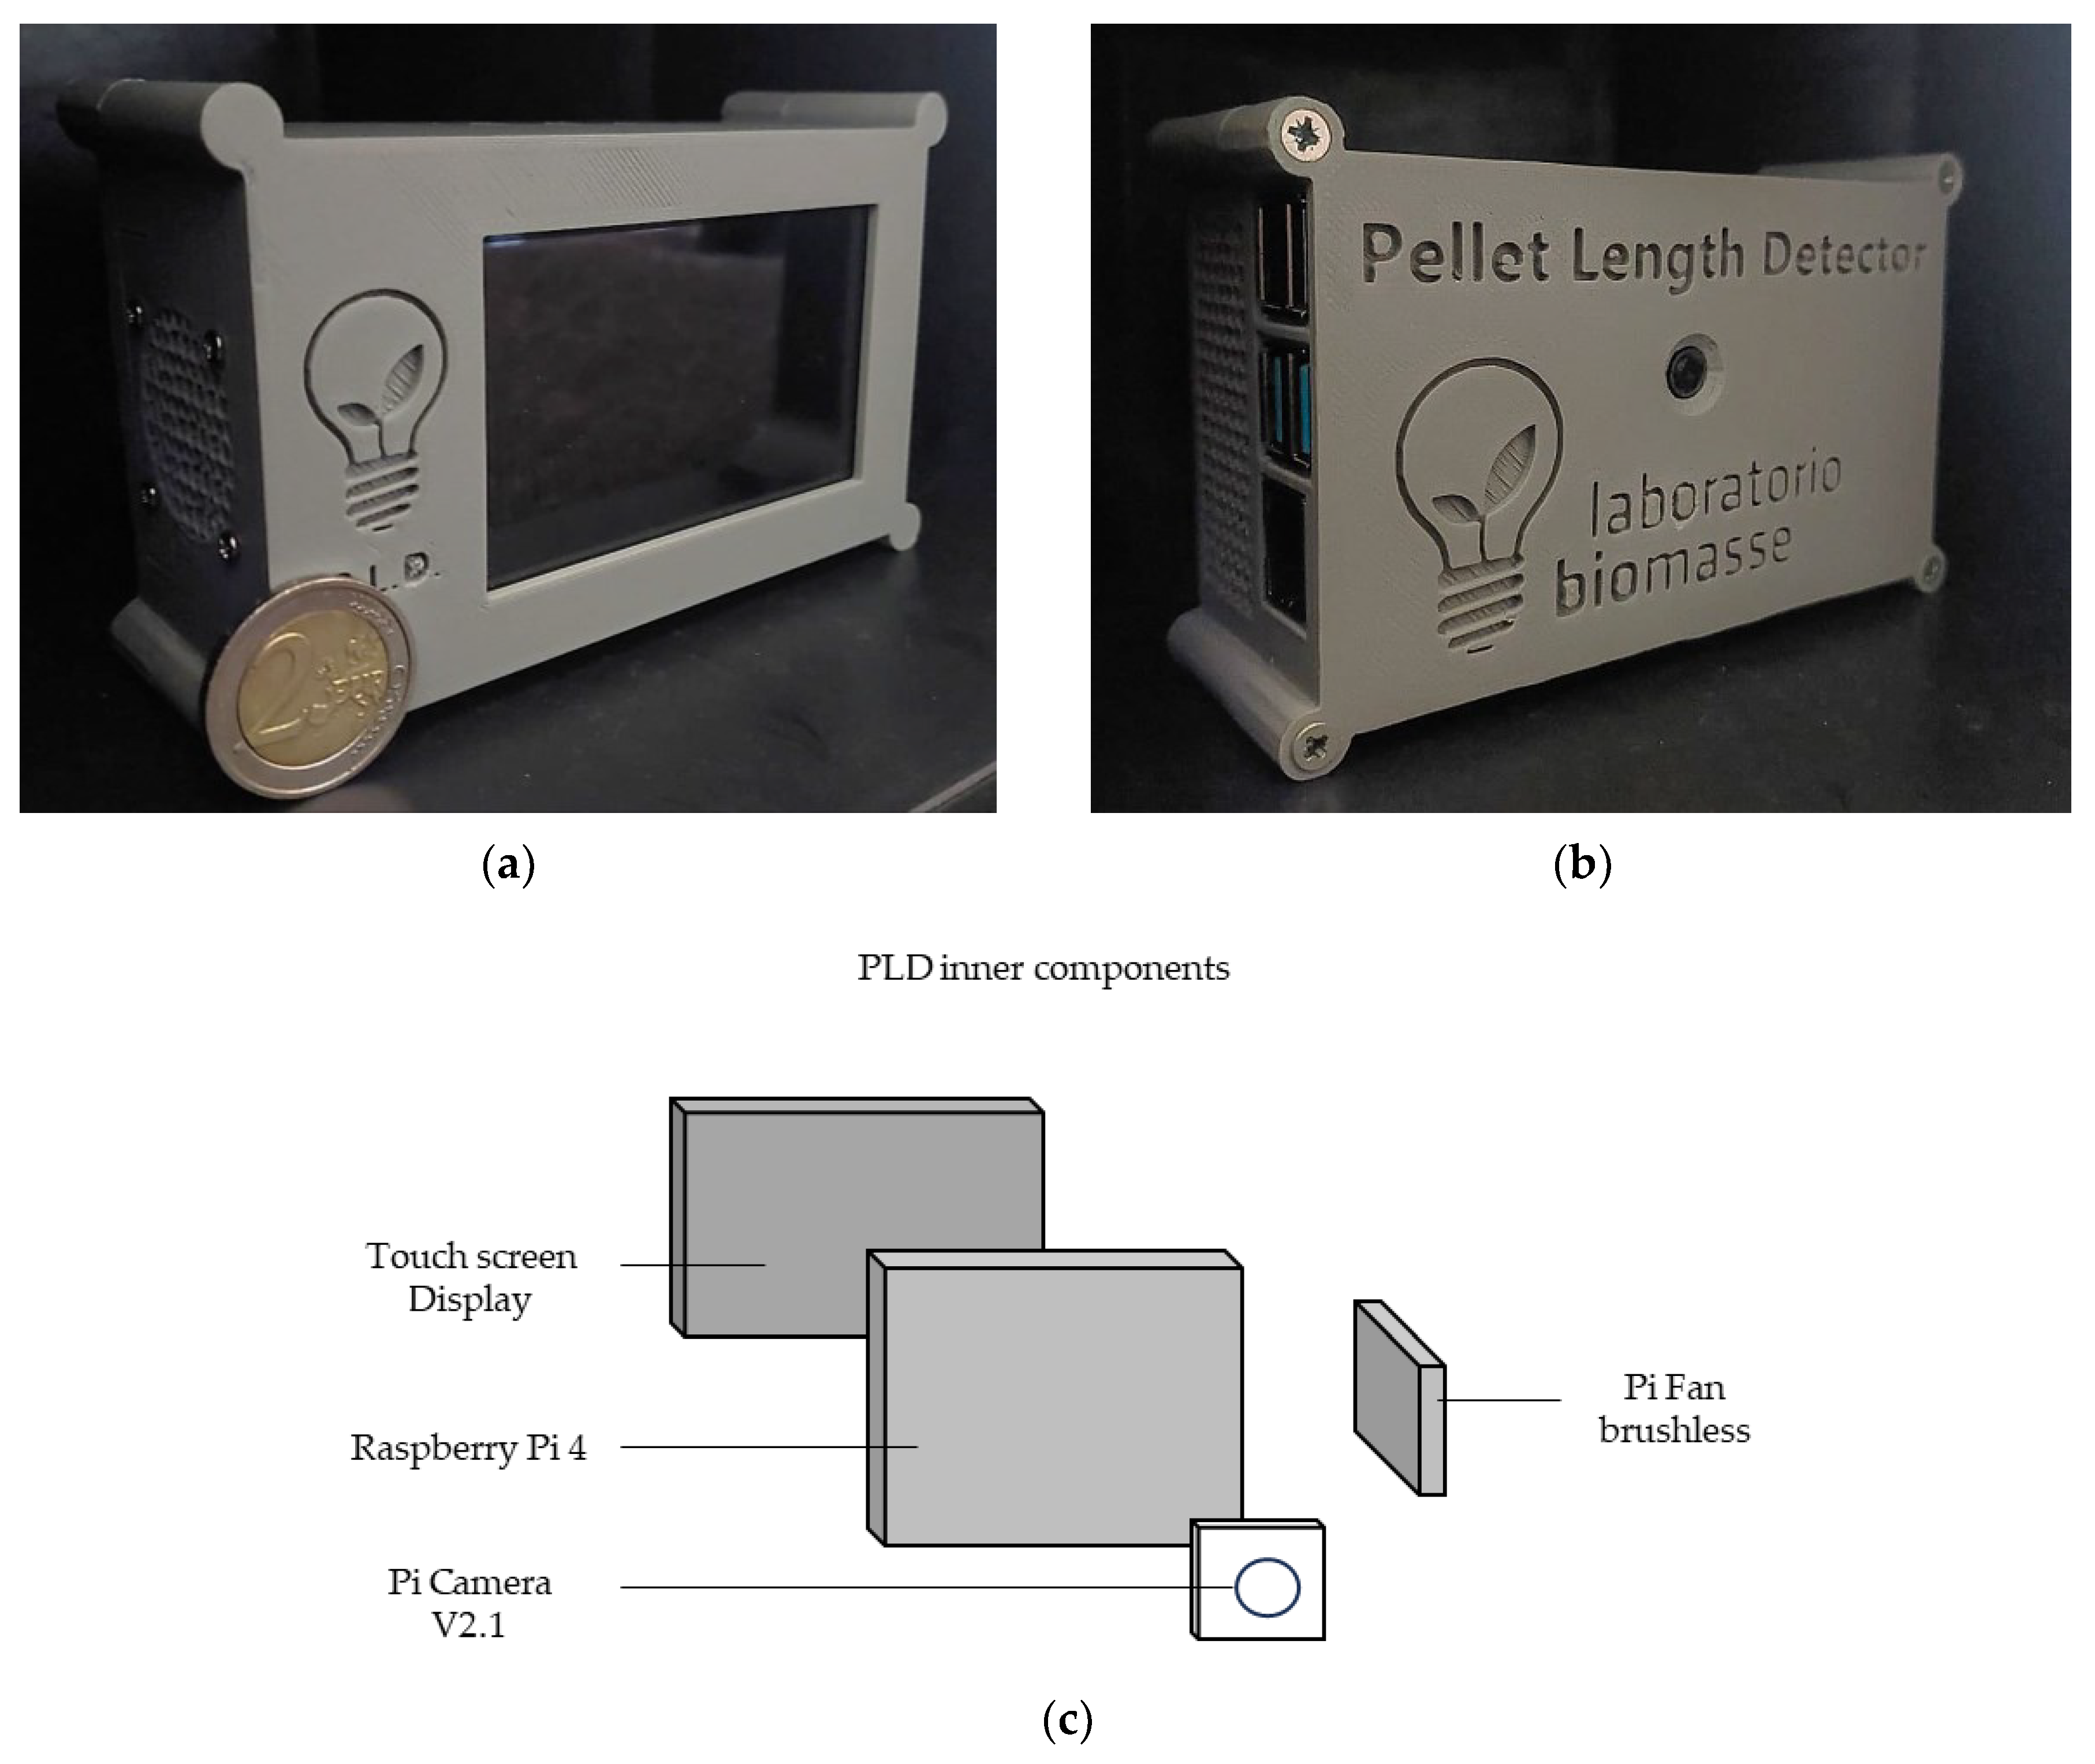
3.3. PLD’s Operational Advantage

The caliper analyses of the first 15 pellets for each sample required different timings (Tc), while still ranging from 145 s up to 170 s. No significant relation was found between the Tc and average length of the samples (Pearson: 0.16). Nevertheless, it is thought that jagged ends of pellets might be a factor that leads to analysis slowdowns. That is, heterogeneous pellet ends easily break during measurements, leading to an increase in repeating the analysis which leads to an increase in the Tc. Meanwhile, the PLD led to 78% shorter analysis timings compared to the Tc.
When comparing the caliper and PLD (Tp) analyses timings, the latter always resulted in significantly shorter timings. In fact, not only does the PLD solely require sample placement on the green board for data acquisition, but the sample size does not affect analysis timings, as opposed to the caliper where an increase in pellets leads to increases in timings. Specifically, for an estimation of the timings required to measure samples in line with what ISO 17829 suggests, the Tc might drastically increase by up to 500–550 s for each sample.
Thus, with the times being equal, the PLD allows for a larger sample to be analyzed, which results in an increased reliability and representativeness of the obtained data. Furthermore, the PLD allows for an instant and automatic obtaining of additional data, such as the pellets’ class size distribution, which is believed to be of particular importance in describing the dimensional properties of pellets, in view of the effects they have on the overall quality of this form of solid biofuel.

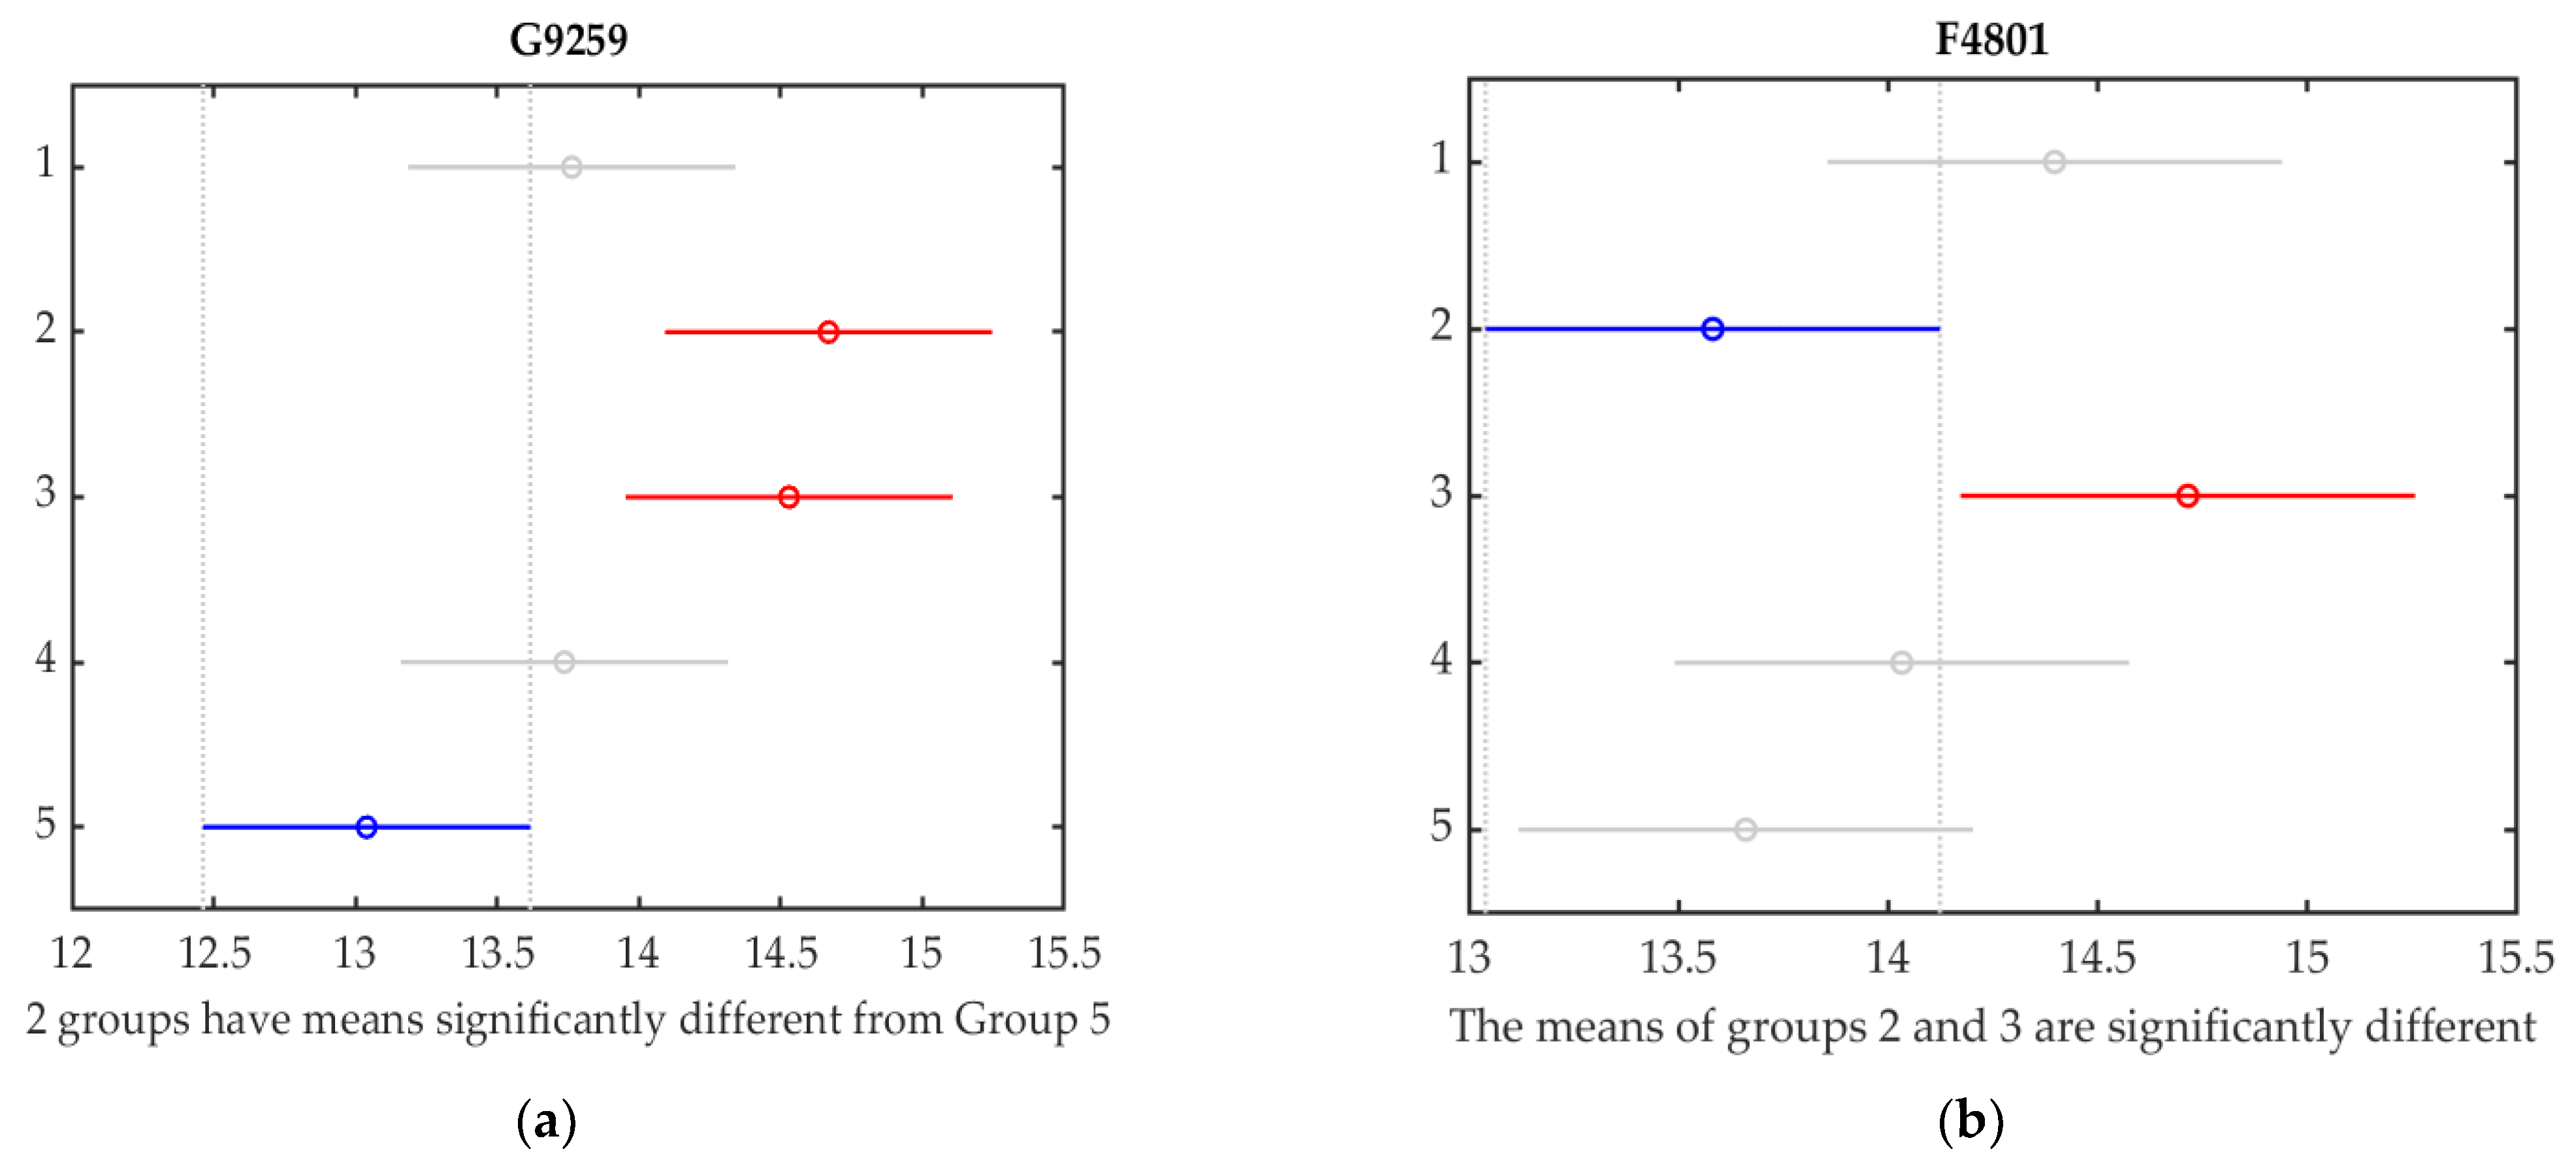
3.4. Representativeness Assessment of the Standard Method

The average data and standard deviation of the further replicates performed on 10 out of 20 samples are reported in Table 4, each replicate consisting of the measurements of 50 pellets via the caliper and of 100 pellets via the PLD.
The average length values obtained via the caliper were found to be more variable compared to the PLD replicates. Namely, the fourth replicate of sample G9259 was significantly different compared to the other four replicates. This same trend was seen in the majority of the samples. For instance, sample G2076 led to significantly different average lengths between the first and fourth replicates. Conversely, the PLD replicates, performed on 100 pellets instead of 50, led to definitely more similar results. Namely, samples G9259 and G2076 led to no significant differences of average length between the replicates.
The range of average lengths and quartile values of data obtained via the caliper (Rcavg, RcQ1, RcQ2 and RcQ3) and PLD (Rpavg, RpQ1, RpQ2 and RpQ3) are shown in Figure 5. The majority of the samples led to higher range values when analyzed via the caliper, namely, when replicates consisted of 50 pellets. Increasing the sample size to 100 pellets during the PLD analyses led to a reduction in the range values and thus to a reduction in variability.
Furthermore, the larger sample sizes led to more homogeneous quartile values, with the exception of samples G9576, F4809 and F4797 which led to slightly higher RpQ3 values compared to the RcQ3 ones. More similar quartile values suggest a more uniform and consistent distribution of the data between the replicates, which translates into a more accurate description of the distribution of the length classes of the analyzed pellets.
Lastly, a one-way ANOVA (95% confidence interval) was performed to assess the statistical differences between the replicates for both the caliper and PLD (Table 5). The caliper replicates led to statistically significant differences between the means for 4 out of 10 samples, namely, G9259 (F = 20.340, p = 1.75 × 10⁻¹⁴), G2076 (F = 6.311, p = 7.55 × 10⁻⁵), G4216 (F = 5.4795, p = 3.06 × 10⁻⁴) and G9683 (F = 2.504, p = 4.29 × 10⁻²). Meanwhile, only 2 out of 10 PLD replicates led to statistically significant differences between the means, specifically, G9259 (F = 4.919, p = 6.75 × 10⁻⁴) and F4801 (F = 2.943, p = 2.01 × 10⁻²).
A Multiple Comparison Test that was performed on sample G9259 (Figure 6a) highlighted the significative difference between replicates r2–r5 (p = 1.10 × 10⁻³) and r3–r5 (p = 3.90 × 10⁻³), whilst for sample F4801 (Figure 6b), it highlighted the difference between replicates r2–r3 (p = 3.53 × 10⁻³).

4. Conclusions

The authors believe that PLD represents a major technological breakthrough in the measurement of pellet length, especially considering the low cost of components that make up the prototypal device. Although not accurate as a caliper, replicates of the same sample performed via the PLD appeared highly precise, with only 2 out of 20 samples leading to replicates differing by ≥2.1 mm between them.
The streamlined PLD measurement method, leading to 50% shorter measurement times than the standard method, allows for the analysis of more extensive samples. This, in turn, yields more representative results, with more a homogeneous data distribution among the replicates. A one-way ANOVA highlighted less statistical differences between the PLD replicates (p ≤ α for 2 out of 10 samples) than those carried out via the caliper (p ≤ α for 4 out of 10 samples).
The PLD’s overall performance is satisfactory, with an average bias of −0.5 mm (ϭ = 1.3), compared to the caliper measurements, and an average maximum bias value of 3.1 mm. There is no relation between the bias and average pellet length (Pearson: −0.2). Negative bias values highlight the overestimation trend, which occurred in 60% of the analyzed samples and is thought to be given by the jagged ends of pellets, which, as fine and fragile as they may be during caliper analysis, in image processing, contribute to the increase in the number of pixels per object.
Given the prototype status of the device, a performance upgrade is believed to be possible, especially through further measurements that could allow for the highlighting of factors which could influence the quality of measurements. Future tests should be conducted directly at pellet production plants to assess the response and interest of pellet producers to the rapid and in-line measurements of pellets. Furthermore, future tests should be carried out with varying lighting conditions during measurements to assess the effects of light and pellet surface reflectance on the measurement quality. Lastly, the authors believe there are prerequisites for implementing this innovative method on additional devices, such as smartphones, for lowering system expenses and for establishing the groundwork for the involvement of a broader audience in pellet quality assessments.

Author Contributions

Conceptualization, G.T.; methodology, G.T. and T.G.; validation, G.T.; formal analysis, T.G. and G.C.; investigation, G.T.; data curation, T.G. and E.L.; writing—original draft preparation, T.G. and E.L.; writing—review and editing, T.G. and C.D.F.; visualization, C.D.F. and T.G.; supervision, G.T.; project administration, G.T.; funding acquisition, G.T. All authors have read and agreed to the published version of the manuscript.

Funding

This research was funded by ‘Fondazione Cassa di Risparmio di Trento e Rovereto CARITRO’ (SIME ‘2020.0414.2020’) and it is a part of the project ‘Bioenergia di Precisione’ (ID # 10856) launched by Laboratorio Biomasse of the Polytechnic University of Marche.

Data Availability Statement

The data presented in this study are available on request from the corresponding author.

Acknowledgments

A special thanks to Metacortex for their support in the development of the prototype Pellet Length Detector.

Conflicts of Interest

The authors declare no conflict of interest.

References

  1. Schipfer, F.; Kranzl, L.; Olsson, O.; Lamers, P. The European Wood Pellets for Heating Market—Price Developments, Trade and Market Efficiency. Energy 2020, 212, 118636. [Google Scholar] [CrossRef]
  2. Sahoo, K.; Bilek, E.M.; Mani, S. Techno-Economic and Environmental Assessments of Storing Woodchips and Pellets for Bioenergy Applications. Renew. Sustain. Energy Rev. 2018, 98, 27–39. [Google Scholar] [CrossRef]
  3. Eurostat Data Browser—Roundwood, Fuelwood and Other Basic Products. Available online: https://ec.europa.eu (accessed on 18 May 2023).
  4. Sikkema, R.; Steiner, M.; Junginger, M.; Hiegl, W.; Hansen, M.T.; Faaij, A. The European Wood Pellet Markets: Current Status and Prospects for 2020. Biofuels Bioprod. Biorefining 2011, 5, 250–278. [Google Scholar] [CrossRef]
  5. ENplus Statistics. Available online: https://enplus-pellets.eu/ (accessed on 10 May 2023).
  6. ISO 17225-2:2021; Solid Biofuels—Fuel Specifications and Classes—Part 2: Graded Wood Pellets. International Organization for Standardization: Geneva, Switzerland, 2021.
  7. Shanmukharadhya, K.S.; Sudhakar, K.G. Effect of Fuel Moisture on Combustion in a Bagasse Fired Furnace. J. Energy Resour. Technol. Trans. ASME 2007, 129, 248–253. [Google Scholar] [CrossRef]
  8. Liang, L.; Fang, G.; Deng, Y.; Wu, T.; Liang, L.; Xiong, Z.; Fang, G. Determination of Moisture Content and Basic Density of Poplar Wood Chips under Various Moisture Conditions by Near-Infrared Spectroscopy. For. Sci. 2019, 65, 548–555. [Google Scholar] [CrossRef]
  9. Toscano, G.; Riva, G.; Foppa Pedretti, E.; Corinaldesi, F.; Mengarelli, C.; Duca, D. Investigation on Wood Pellet Quality and Relationship between Ash Content and the Most Important Chemical Elements. Biomass Bioenergy 2013, 56, 317–322. [Google Scholar] [CrossRef]
  10. Wöhler, M.; Jaeger, D.; Reichert, G.; Schmidl, C.; Pelz, S.K. Influence of Pellet Length on Performance of Pellet Room Heaters under Real Life Operation Conditions. Renew. Energy 2017, 105, 66–75. [Google Scholar] [CrossRef]
  11. Mack, R.; Schön, C.; Kuptz, D.; Hartmann, H.; Brunner, T.; Obernberger, I.; Behr, H.M. Influence of Pellet Length, Content of Fines, and Moisture Content on Emission Behavior of Wood Pellets in a Residential Pellet Stove and Pellet Boiler. Biomass Convers. Biorefin. 2022, 1–18. [Google Scholar] [CrossRef]
  12. Gilvari, H.; de Jong, W.; Schott, D.L. The Effect of Biomass Pellet Length, Test Conditions and Torrefaction on Mechanical Durability Characteristics According to ISO Standard 17831-1. Energies 2020, 13, 3000. [Google Scholar] [CrossRef]
  13. ISO 17829:2015; Solid Biofuels—Determination of Length and Diameter of Pellets. International Organization for Standardization: Geneva, Switzerland, 2015.
  14. Toscano, G.; Leoni, E.; Feliciangeli, G.; Duca, D.; Mancini, M. Application of ISO Standards on Sampling and Effects on the Quality Assessment of Solid Biofuel Employed in a Real Power Plant. Fuel 2020, 278, 118142. [Google Scholar] [CrossRef]
  15. Igathinathane, C.; Melin, S.; Sokhansanj, S.; Bi, X.; Lim, C.J.; Pordesimo, L.O.; Columbus, E.P. Machine Vision Based Particle Size and Size Distribution Determination of Airborne Dust Particles of Wood and Bark Pellets. Powder Technol. 2009, 196, 202–212. [Google Scholar] [CrossRef]
  16. Tumuluru, J.S.; Fillerup, E.; Kane, J.J.; Murray, D. Advanced Imaging Techniques to Understand the Impact of Process Variables on the Particle Morphology in a Corn Stover Pellet. Chem. Eng. Res. Des. 2020, 161, 130–145. [Google Scholar] [CrossRef]
  17. Oh, S.M.; Park, J.; Yang, J.; Oh, Y.G.; Yi, K.W. Image Processing for Analysis of Carbon Black Pellet Size Distribution during Pelletizing: Carbon Black PSD (PSD: Pellet Size Distribution) by Image Processing. Measurement 2021, 174, 108963. [Google Scholar] [CrossRef]
  18. Rezaei, H.; Lim, C.J.; Lau, A.; Sokhansanj, S. Size, Shape and Flow Characterization of Ground Wood Chip and Ground Wood Pellet Particles. Powder Technol. 2016, 301, 737–746. [Google Scholar] [CrossRef]
  19. Jägers, J.; Wirtz, S.; Scherer, V. An Automated and Continuous Method for the Optical Measurement of Wood Pellet Size Distribution and the Gravimetric Determination of Fines. Powder Technol. 2020, 367, 681–688. [Google Scholar] [CrossRef]
  20. ISO 21945:2020; Solid Biofuels—Simplified Sampling Method for Small Scale Applications. International Organization for Standardization: Geneva, Switzerland, 2020.
Figure 1. PLD portable measuring device. (a) PLD’s rear view with a touch screen; (b) PLD’s front view with a central camera; (c) diagram of PLD’s inner components.
Resources 12 00125 g001
Figure 2. Summary diagram of the experimental stages.
Resources 12 00125 g002
Figure 3. The tolerance limit system visually highlights the distribution of replicates based on three range threshold values marked by the black lines (≤1 mm colored in green, <2.1 mm and ≥2.1 mm respectively colored in yellow and red).
Resources 12 00125 g003
Figure 4. Average bias trends. (a) Comparison between average sample length and absolute bias between caliper and PLD measurements; (b) Bias trend highlighted the PLDs’ overestimation tendency (negative bias values).
Resources 12 00125 g004
Figure 5. Range trends of average lengths and quartile values obtained via the caliper in green (Rcavg, RcQ1, RcQ2 and RcQ3) and PLD in blue (Rpavg, RpQ1, RpQ2 and RpQ3).
Resources 12 00125 g005
Figure 6. Multiple Comparison Test results. (a) Statistically significant difference between replicates r5 (blue line) and both r2 and r3 (red lines); (b) Statistically significant difference between replicates r2 (blue line) and r3 (red line).
Resources 12 00125 g006
Table 1. Key data obtained from the three replicates performed via the PLDs (Lp1, Lp2 and Lp3), average data (Lp) and corresponding basic statistics.
SampleLp1
mm
Lp2
mm
Lp3
mm
Lp
mm
Std. D.CVRange
mm
F480119.819.719.519.70.21%0.3
F521119.018.919.919.20.53%1.0
G972322.122.721.222.00.73%1.5
G925923.724.021.423.11.46%2.6
F480919.320.619.119.70.84%1.5
G207621.421.022.321.60.63%1.3
F482121.021.020.220.70.42%0.8
G915021.921.921.521.80.21%0.4
G941123.422.923.223.20.31%0.6
G988221.122.322.321.90.73%1.2
F479722.422.722.622.60.21%0.4
G843522.622.422.722.60.11%0.2
G968326.224.724.625.10.93%1.5
G961124.122.524.423.61.04%1.9
G972525.424.325.525.10.73%1.2
G957624.224.324.124.20.10%0.2
G974023.326.524.224.71.77%3.2
G607625.525.423.824.91.04%1.7
G421624.725.725.925.40.73%1.3
G901024.023.823.923.90.10%0.2
Table 2. Average length data of samples obtained via caliper (Lc) and PLD (Lp), as well as Bias (Lc–Lp) and BL (Bias/Lc).
SampleLcLpBiasBL
mmstd. dev.mmstd. devmm%
F480117.72.919.74.3−1.911.0%
F521119.55.519.26.20.31.5%
G972319.51.922.03.6−2.512.7%
G925919.93.723.14.5−3.115.6%
F480920.15.119.75.50.42.1%
G207620.23.721.64.4−1.36.7%
F482120.54.720.75.3−0.20.9%
G915021.04.721.86.0−0.83.7%
G941121.24.323.25.5−1.99.1%
G988221.76.021.96.4−0.20.7%
F479722.33.722.64.6−0.31.4%
G843522.54.422.64.8−0.10.5%
G968323.53.925.15.6−1.77.2%
G961123.95.223.65.40.31.1%
G972524.06.225.17.1−1.14.4%
G957624.46.324.26.40.20.9%
G974025.06.124.76.70.31.1%
G607625.54.324.95.00.62.3%
G421626.07.925.47.50.62.2%
G901026.58.823.98.12.69.9%
Table 3. Overall PLDs’ performance, where Lc = average length via caliper, Lp = average length via PLD, Bias = Lc–Lp and BL = Bias/Lc. Maximum and minimum values are given as absolute values.
Lc LpBiasBL
mmmmmm%
mean22.322.7−0.54.7%
std. dev.2.51.91.30.1
max 26.525.43.116%
min17.719.20.11%
Table 4. Average length data of samples obtained via caliper and PLD during each replicate.
SampleCaliperPLD
r1
mm
r2
mm
r3
mm
r4
mm
r5
mm
r1
mm
r2
mm
r3
mm
r4
mm
r5
mm
G9259mean13.916.416.010.714.013.814.714.513.713.0
std. dev.3.63.93.03.24.12.63.53.13.32.3
G2076mean13.315.416.018.016.715.815.015.315.115.4
std. dev.4.55.34.54.55.33.83.83.84.04.3
G4216mean19.319.421.821.718.518.518.217.717.818.2
std. dev.5.24.34.74.34.55.34.64.34.14.2
G9683mean18.818.916.217.317.816.916.817.417.717.9
std. dev.5.24.95.24.55.03.93.64.54.64.0
G9576mean18.818.420.019.021.119.318.820.020.220.7
std. dev.7.66.87.57.37.75.85.95.75.65.6
G9740mean21.121.519.819.818.321.220.920.619.719.2
std. dev.7.86.57.36.07.45.86.56.35.65.3
F5211mean18.917.117.017.116.416.616.615.915.315.7
std. dev.6.97.25.25.65.24.94.74.65.14.6
F4801mean14.814.915.415.514.314.413.614.714.013.7
std. dev.2.93.03.43.82.73.22.63.02.72.5
F4809mean17.217.419.519.617.917.818.217.316.416.7
std. dev.5.86.35.45.75.55.04.24.74.75.2
F4797mean15.818.317.717.616.616.416.916.015.615.4
std. dev.5.35.04.45.13.85.15.64.53.84.0
Table 5. Summary of main results obtained via one-way ANOVA for both the caliper and PLD replicates.
SampleCaliperPLD
F ValuepH0F ValuepH0
G925920.31.75 × 10−14Rejected4.96.75 × 10−4Rejected
G20766.37.55 × 10−5Rejected0.66.88 × 10−1
G42165.53.06 × 10−4Rejected0.66.99 × 10−1
G96832.54.29 × 10−2Rejected1.32.85 × 10−1
G95761.13.50 × 10−1 1.71.55 × 10−1
G97401.61.68 × 10−1 1.91.07 × 10−1
F52111.23.33 × 10−1 1.52.01 × 10−1
F48011.23.17 × 10−1 2.92.01 × 10−2Rejected
F48092.09.84 × 10−2 2.45.16 × 10−2
F47972.17.82 × 10−2 1.61.64 × 10−1
Disclaimer/Publisher’s Note: The statements, opinions and data contained in all publications are solely those of the individual author(s) and contributor(s) and not of MDPI and/or the editor(s). MDPI and/or the editor(s) disclaim responsibility for any injury to people or property resulting from any ideas, methods, instructions or products referred to in the content.

