Uncovering Olive Biodiversity through Analysis of Floral and Fruiting Biology and Assessment of Genetic Diversity of 120 Italian Cultivars with Minor or Marginal Diffusion

 , , ,
, , ,  and
and
Abstract
1. Introduction
2. Materials and Methods
2.1. Phenological and Physiological Characteristics
2.1.1. Amount of Flowering
2.1.2. Timing and Duration of Flowering
2.1.3. Length of the Inflorescences, Number of Flowers per Inflorescence, and Pistil Abortion
2.1.4. Percentage of Fruit Set from Open and Self-Pollination
2.1.5. Fruit Drop
2.1.6. Drupe Weight
2.2. Model-Based Phenological Characterization
2.3. Molecular Characterisation via SSR(simple sequence repeat) Analysis
Molecular Data Analysis
3. Results
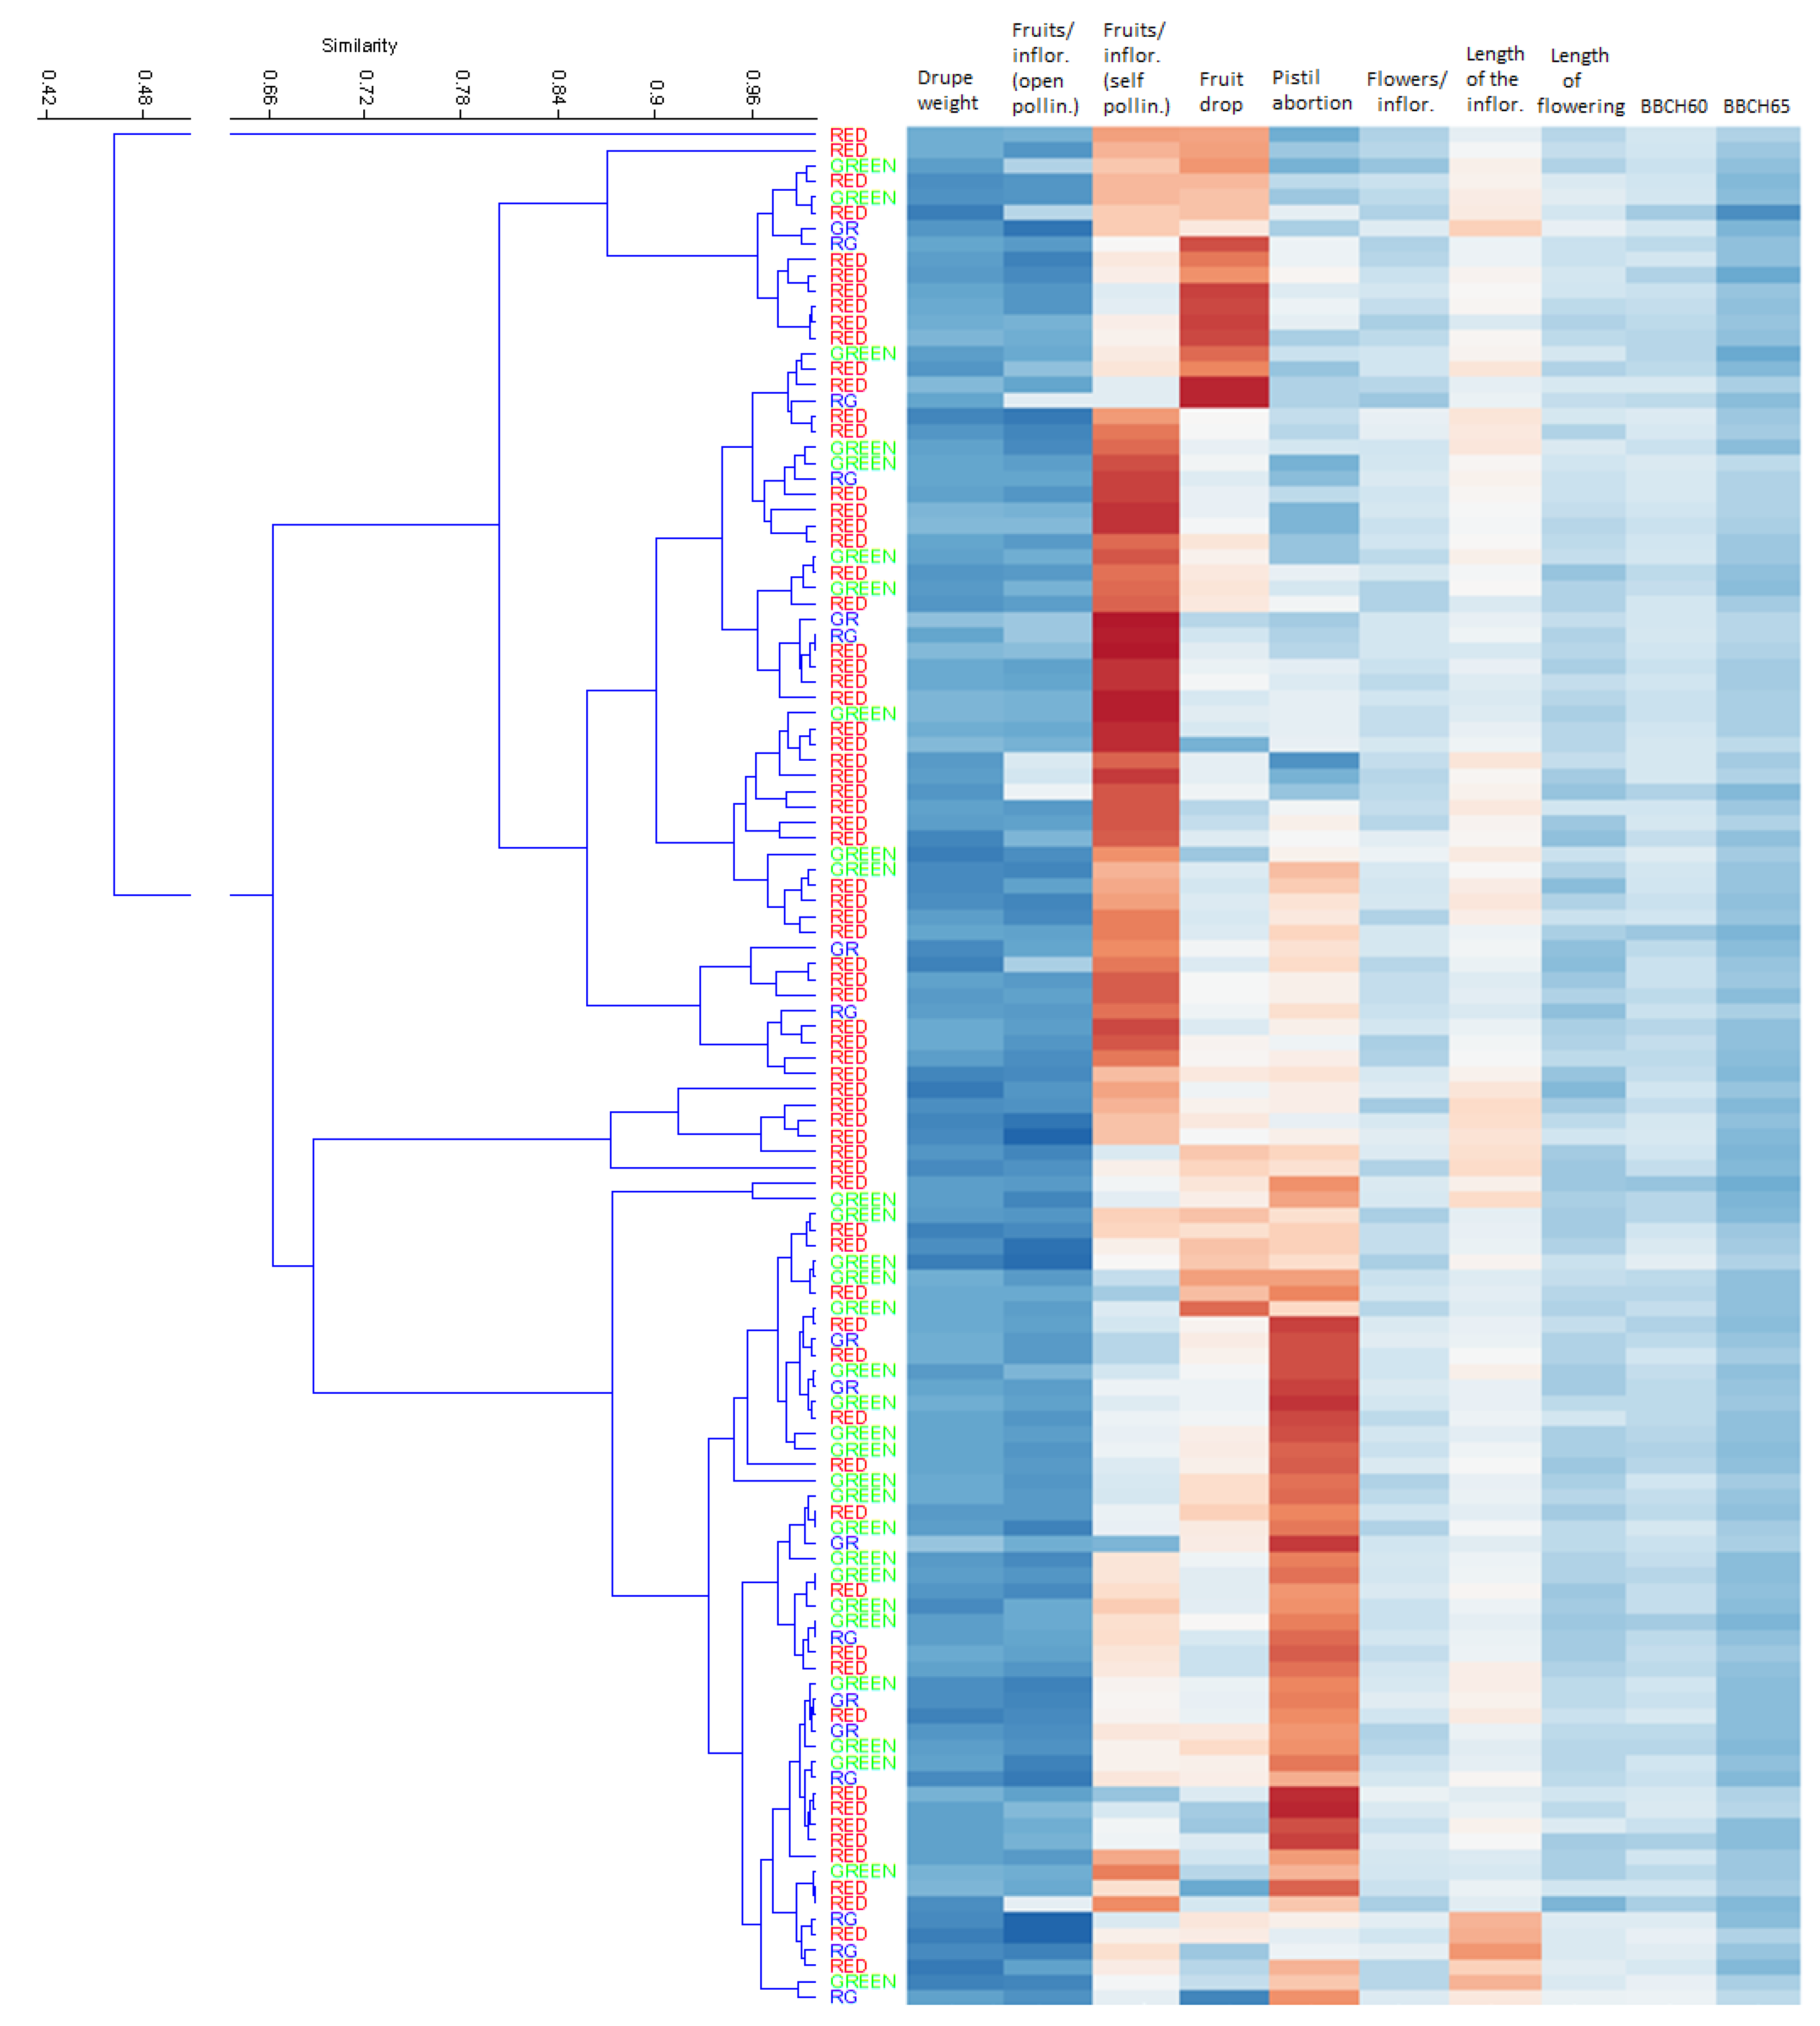
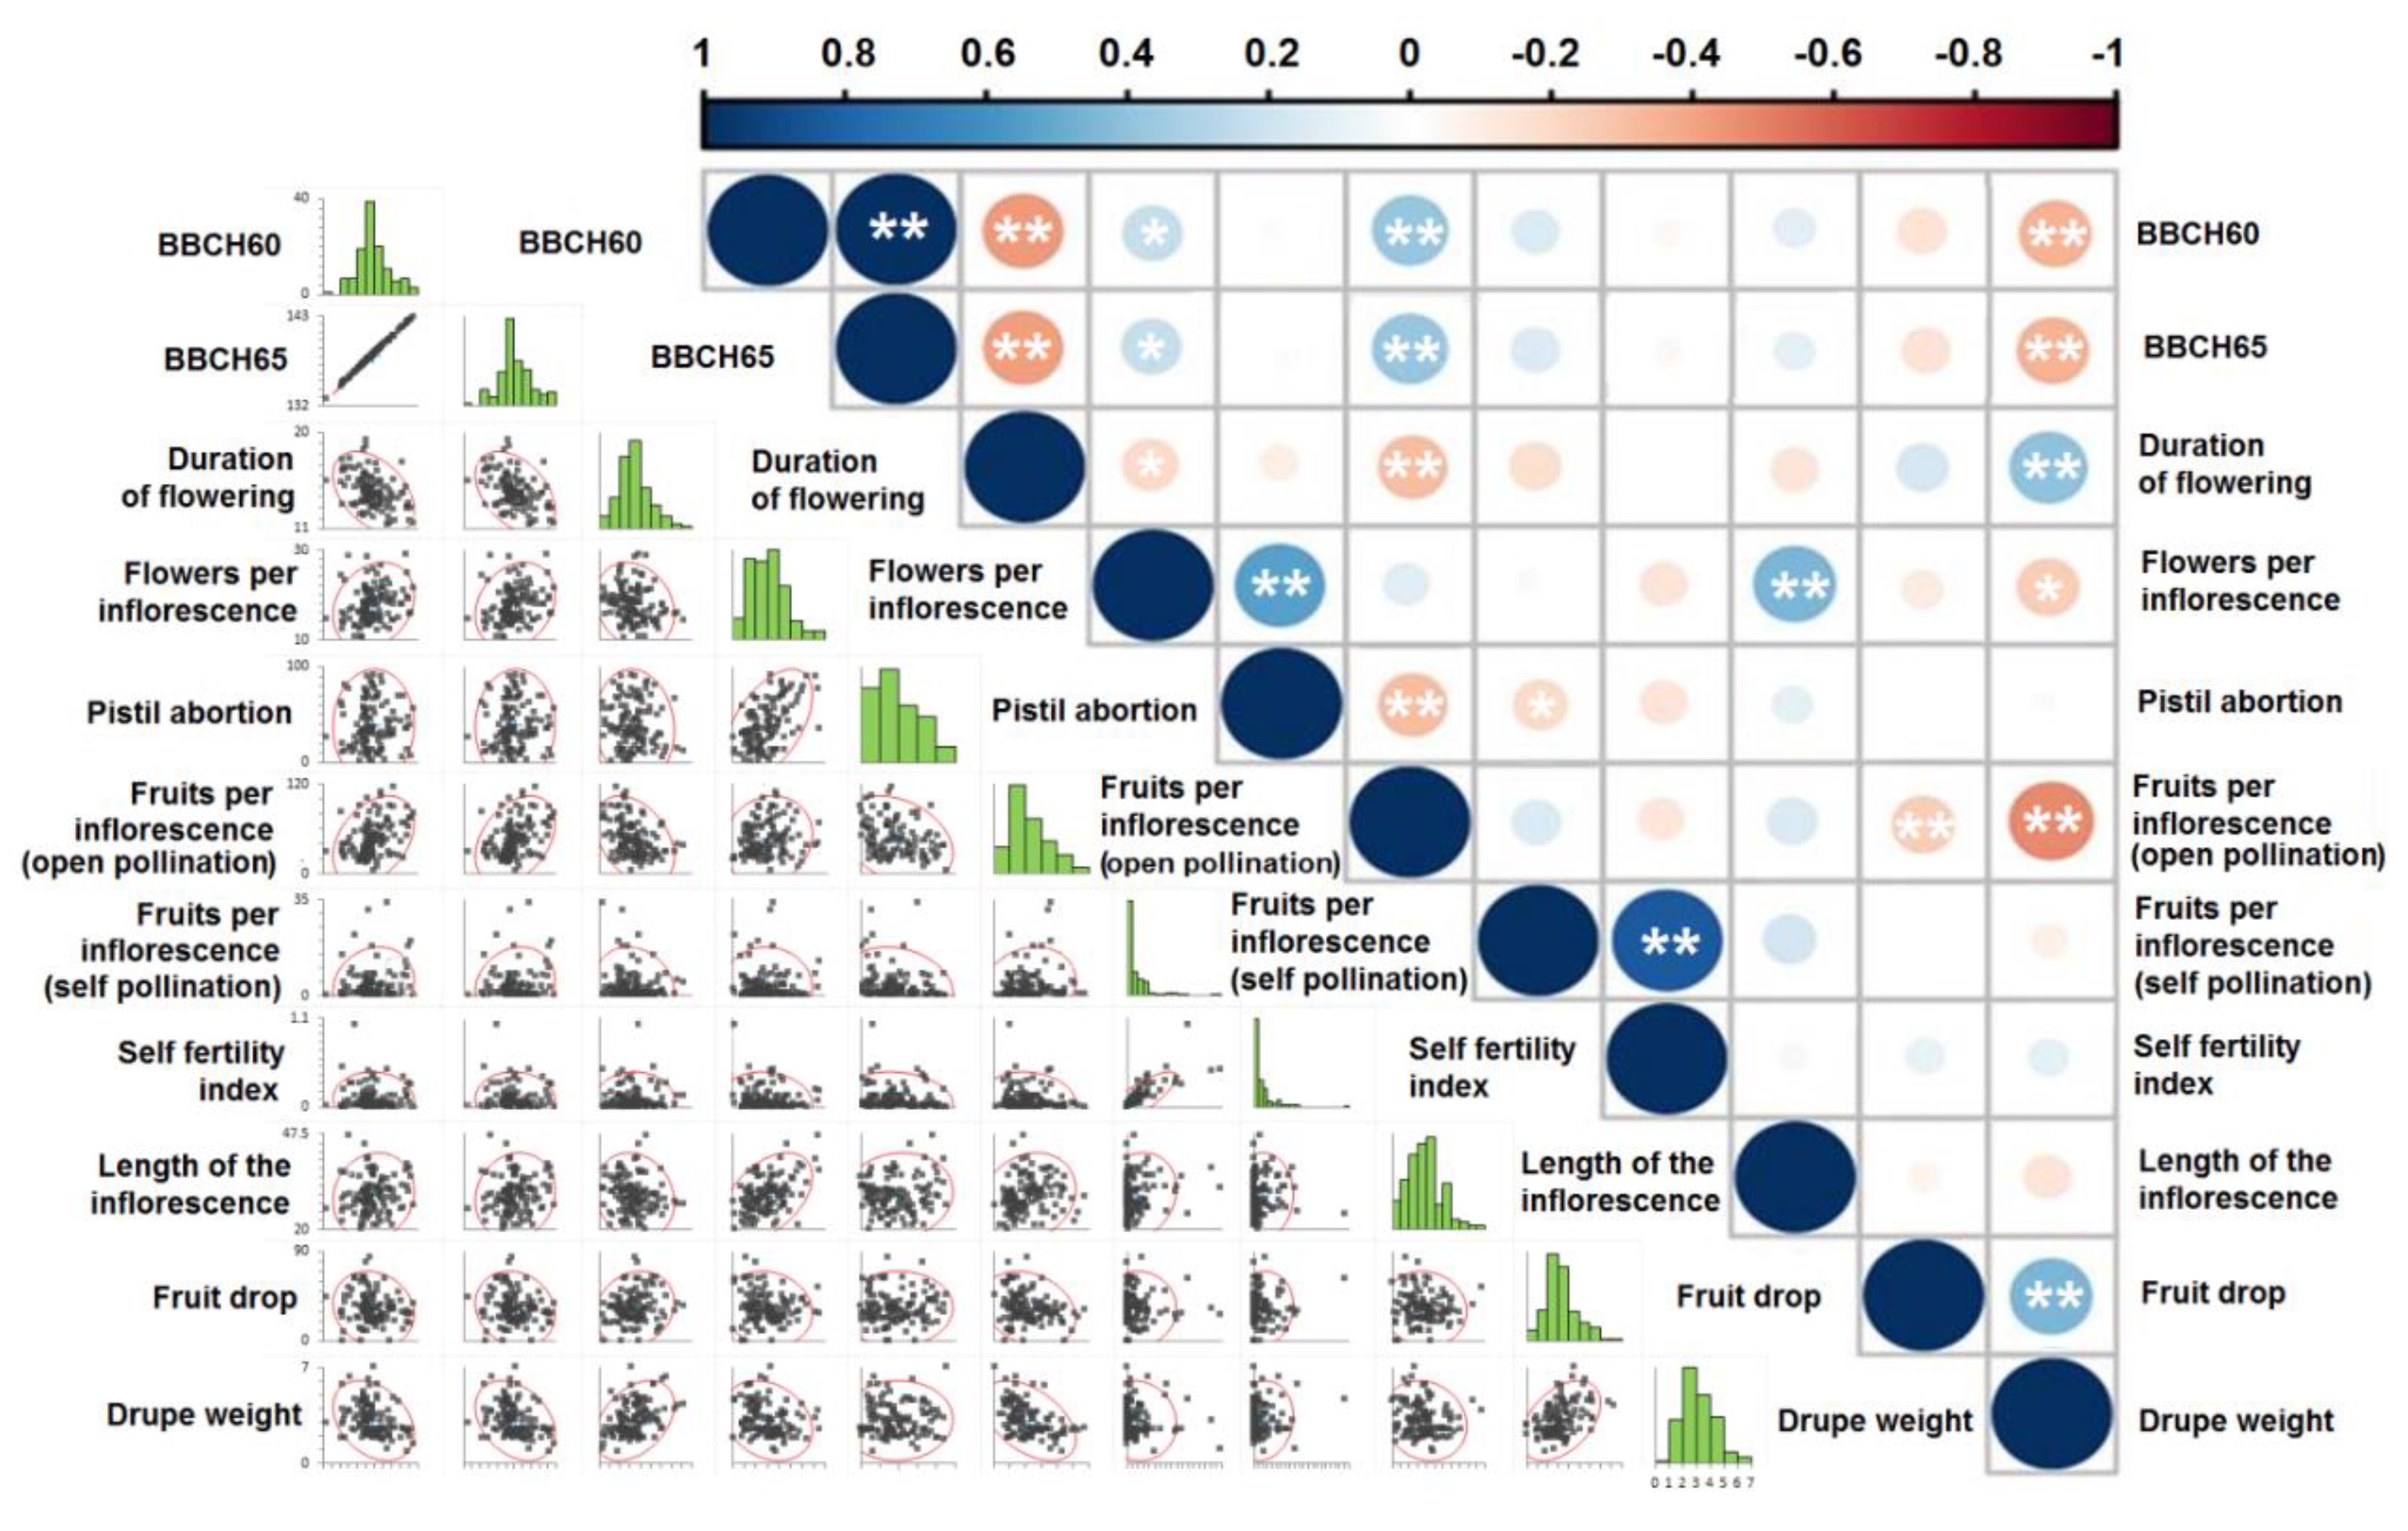
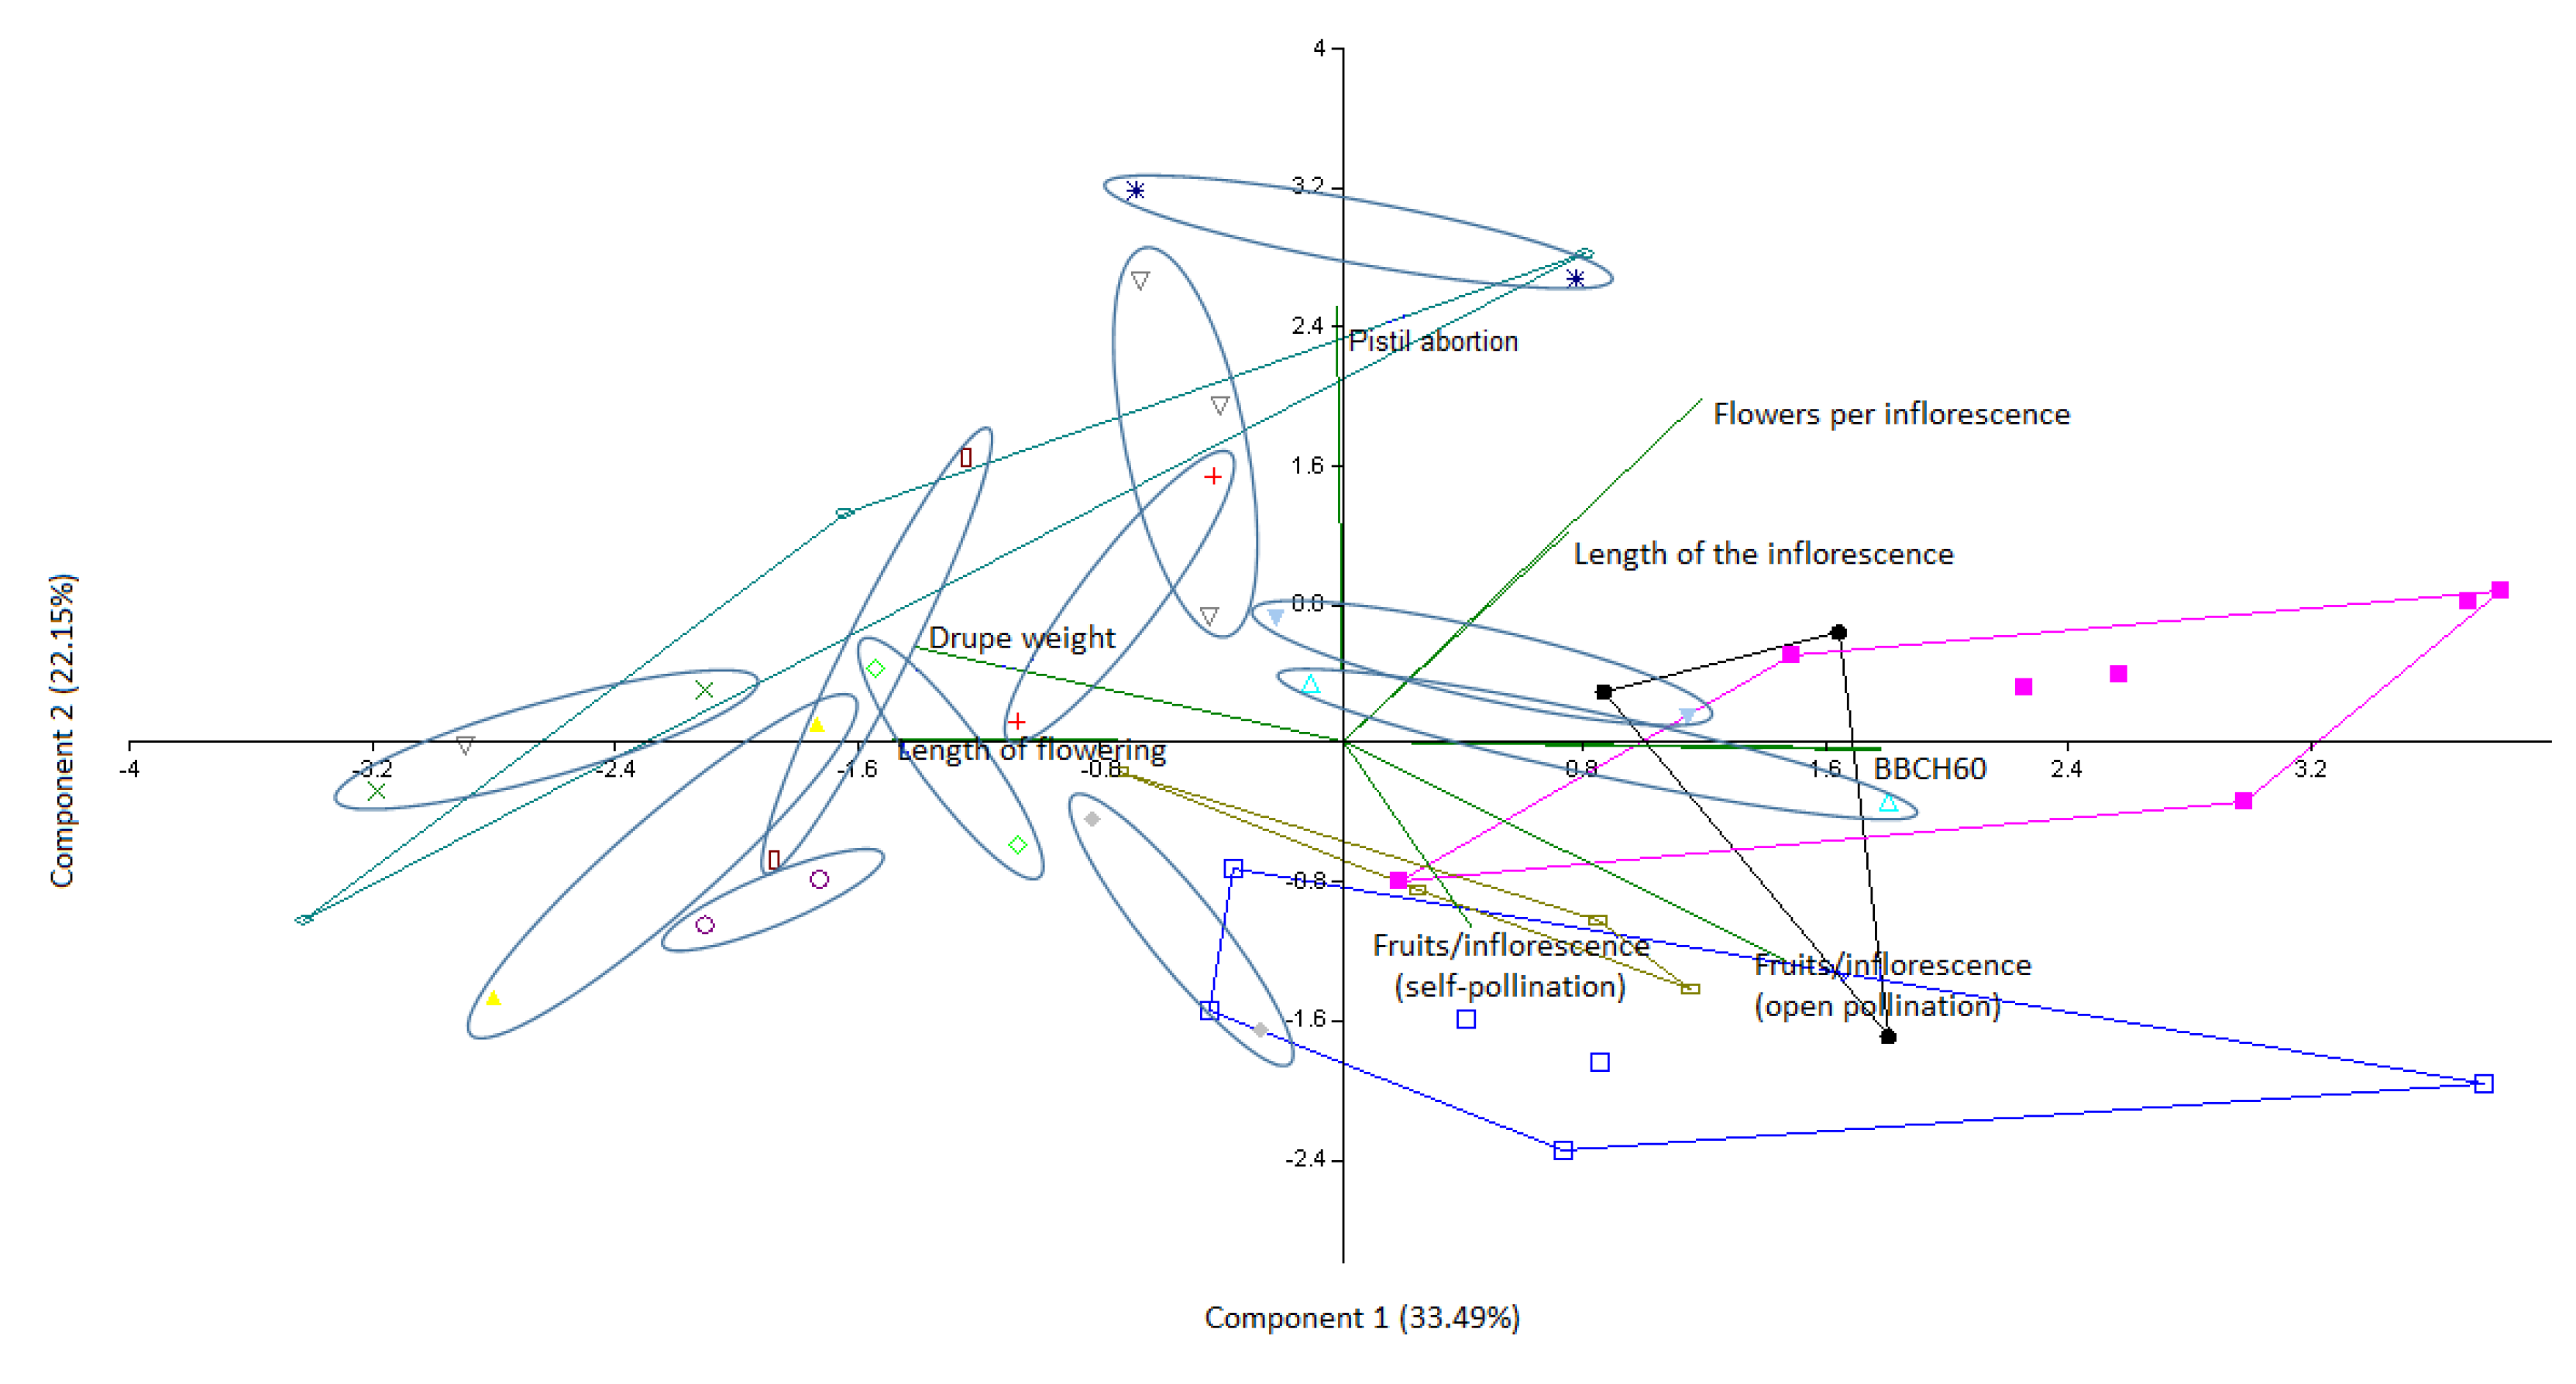
3.1. Phenological and Physiological Characteristics
3.1.1. Amount of Flowering
3.1.2. Timing of Flowering
3.1.3. Duration of Flowering
3.1.4. Length of Inflorescences and Average Number of Flowers per Inflorescence
3.1.5. Pistil Abortion
3.1.6. Fruit Set by Open Pollination
3.1.7. Fruit Set from Self-Pollination
3.1.8. Self-Pollination Index
3.1.9. Fruit Drop
3.1.10. Drupe Weight
3.2. Model Evaluation
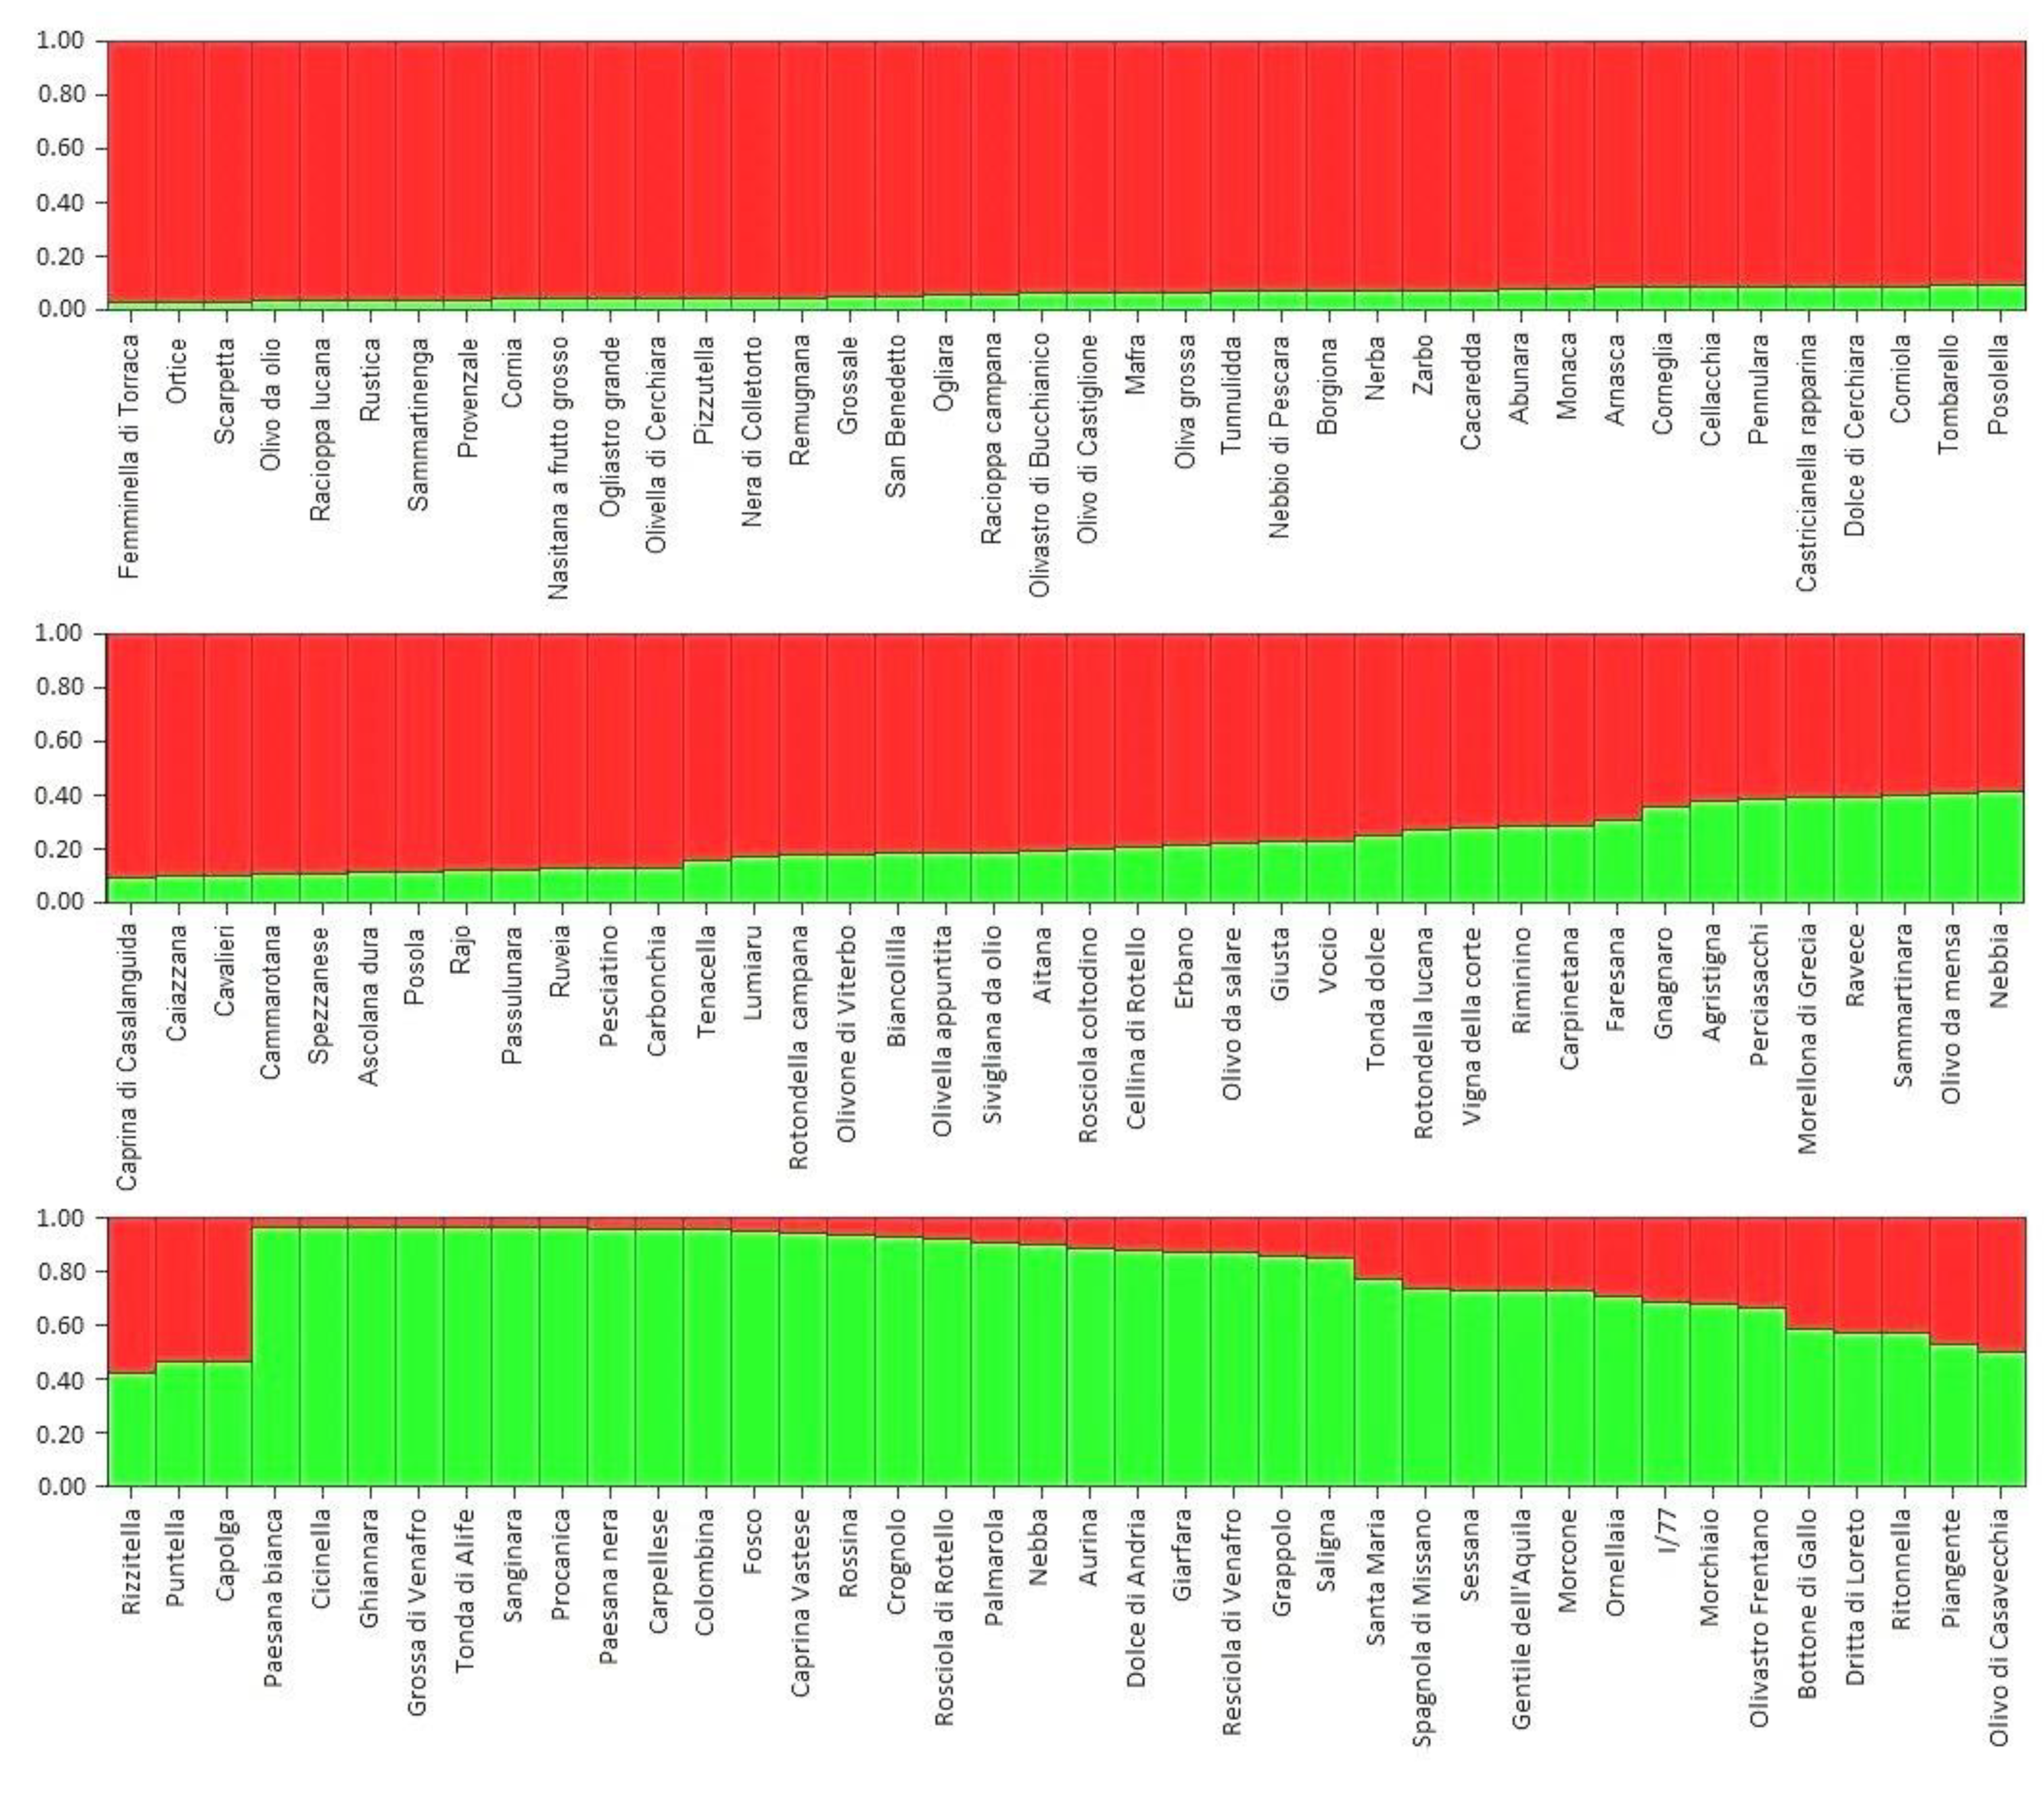
3.3. SSR Diversity and Population Structure Analysis
4. Discussions
4.1. Bio-Agronomic Characterization
4.2. Molecular Characterisation
5. Conclusions
Supplementary Materials
Author Contributions
Funding
Acknowledgments
Conflicts of Interest
References
- Aguilera, F.; Valenzuela, L.R. Microclimatic-induced fluctuations in the flower and pollen production rate of olive trees (Olea europaea L.). Grana 2012, 51, 228–239. [Google Scholar] [CrossRef]
- Lavee, S.; Rallo, L.; Rapoport, H.F.; Troncoso, A. The floral biology of the olive, effect of flower number, type and distribution on fruitset. Sci. Hortic. 1996, 66, 149–158. [Google Scholar] [CrossRef]
- Cuevas, J.; Polito, V.S. The role of staminate flowers in the breeding system of Olea europaea (Oleaceae), an andromonoecious, wind-pollinated taxon. Ann. Bot. 2004, 93, 547–553. [Google Scholar] [CrossRef] [PubMed]
- Camposeo, S.; Ferrara, G.; Palasciano, M.; Godini, A. About the biological behaviour of cv. Coratina. Acta Hortic. 2012, 949, 129–133. [Google Scholar] [CrossRef]
- Farinelli, D.; Boco, M.; Tombesi, A. Results of four years of observations on self-sterility behaviour of several olive cultivars and significance of cross-pollination. In Proceedings of the 2nd International Seminar Olivebioteq, Marsala-Mazara del Vallo, Italy, 5–10 November 2006; Volume 1, pp. 275–282. [Google Scholar]
- Rojo, J.; Salido, P.; Pérez-Badia, R. Flower and pollen production in the ‘Cornicabra’ olive (Olea europaea L.) cultivar and the influence of environmental factors. Trees 2015, 29, 1235–1245. [Google Scholar] [CrossRef]
- FAO. The Second Report on the State of the World’s Plant Genetic Resources for Food and Agriculture; FAO: Rome, Italy, 2010; 370p, ISBN 978-92-5-106534-1. [Google Scholar]
- Petri, L. Osservazioni sulla biologia e patologia del fiore dell’olivo. Atti Reale Accad. Lincei 1910, 19, 436–454. [Google Scholar]
- Campbell, C. L’aborto Fiorale dell’ Olivo; Italia Agricola: Massanzago, Italy, 1911. [Google Scholar]
- Bradley, M.V.; Griggs, W.H. Morphological evidence of incompatibility in Olea europaea L. Phytomorphology 1963, 13, 141–156. [Google Scholar]
- Villemur, P.; Musho, U.S.; Delmas, J.M.; Maamar, M.; Ouksili, A. Contribution à l’étude de la biologie florale de l’olivier (Olea europaea L.), stérilité mâle, flux pollinique et période effective de pollinisation. Fruits 1984, 39, 467–473. [Google Scholar]
- Mookerjee, S.; Guerin, J.; Collins, G.; Ford, C.M. Paternity analysis using microsatellite markers to identify pollen donors in an olive grove. Theor. Appl. Genet. 2005, 111, 1174–1182. [Google Scholar] [CrossRef]
- Moutier, N.; Terrien, E.; Pécout, R.; Hostalnou, E.; Margier, J.F. Un groupe d’étude des compatibilités polliniques entre variétés d’olivier. Nouv. Oliv. 2006, 51, 8–11. [Google Scholar]
- Diaz, A.; Martin, A.; Rallo, P.; Barranco, D.; De la Rosa, R. Self-incompatibility of ‘Arbequina’ and ‘Picual’ olive assessed by SSR Markers. JASHS 2006, 131, 250–255. [Google Scholar] [CrossRef]
- El-Hady, E.S.; Haggag, L.F.; Abdel-Migeed, M.M.M.; Desouky, I.M. Studies on sex compatibility of some olive varieties. Res. J. Agric. Biol. Sci. 2007, 3, 504–509. [Google Scholar]
- Farinelli, D.; Hassani, D.; Tombesi, A. Self-sterility and cross-pollination responses of nine olive cultivars in Central Italy. In Proceedings of the Fifth Symposium on Olive Growing, Izmir, Turkey, 27 September–3 October 2004. [Google Scholar]
- Taslimpour, M.; Bonyampour, A.; Rahemi, R. Determining the best pollinizer of olive (Olea europaea L.) (Dezfoul’) in Fars Province. Am. Euras. J. Agric. Environ. Sci. 2008, 4, 682–686. [Google Scholar]
- Eassa, K.B.; El-Tweel, A.A.; Gorda, A.M. Studies and cross-pollination for Kalamata olive cultivar grown on a sandy soil. J. Agric. Kafer El-Sheik Univ. 2011, 37, 127–140. [Google Scholar]
- Rosati, A.; Caporali, S.; Paoletti, A.; Famiani, F. Pistil abortion is related to ovary mass in olive (Olea europaea L.). Sci. Hortic. 2011, 127, 515–519. [Google Scholar] [CrossRef]
- Sadok, I.B.; Celton, J.M.; Essalouh, L.; El Aabidine, A.Z.; Garcia, G.; Martinez, S.; Grati-Kamoun, N.; Rebai, A.; Costes, E.; Bouchaib Khadari, B. QTL Mapping of Flowering and Fruiting Traits in Olive. PLoS ONE 2014, 9, e62831. [Google Scholar] [CrossRef]
- Rallo, L.; Barranco, D.; Díez, C.M.; Rallo, P.; Paz Suárez, M.; Trapero, C.; Pliego-Alfaro, F. Strategies for Olive (Olea europaea L.) Breeding: Cultivated Genetic Resources and Crossbreeding. In Advances in Plant Breeding Strategies: Fruits; Al-Khayri, J., Jain, S., Johnson, D., Eds.; Springer: Cham, Switzerland, 2018. [Google Scholar]
- Bartolini, S.; Guerriero, R. Self-compatibility in several clones of oil olive cv. Leccino. Adv. Hortic. Sci. 1995, 9, 71–74. [Google Scholar]
- Lombardo, N.; Alessandrino, M.; Godino, G.; Madeo, A. Comparative observation regarding the floral biology of 150 Italian olive (Olea europaea L.) cultivars. Adv. Hortic. Sci. 2006, 4, 247–255. [Google Scholar]
- Lombardo, L.; Lombardo, N.; Briccoli Bati, C. Osservazioni sulla biologia fiorale e di fruttificazione dell’olivo. Acta Italus Hortus 2011, 1, 194–197. [Google Scholar]
- Santilli, E.; Lombardo, L.; Varlaro, M.; Nannelli, R.; Gagnarli, E.; Briccoli Bati, C. Effectiveness of the GAEC cross compliance standard Maintenance of olive groves in good vegetative condition in avoiding the deterioration of habitats and land abandonment. Ital. J. Agron. 2011, 6, e15. [Google Scholar] [CrossRef]
- Mariotti, R.; Mousavi, S.; Pandolfi, S.; Cultrera, N.G.M.; Costantini, L.; Baldoni, L. La Coltivazione Antica Dell’olivo a Confronto con le Varietà Attuali: Il Contributo Della Ricerca Genetica; Rivista di Storia dell’Agricoltura: Firenze, Italy, 2016; pp. 1–2. [Google Scholar]
- Bartolini, G. Olive Germplasm (Olea europaea L.), Cultivars, Synonyms, Cultivation Area, Collections, Descriptors. Available online: http://www.oleadb.it/ (accessed on 24 June 2019).
- D’Agostino, N.; Taranto, F.; Camposeo, S.; Mangini, G.; Fanelli, V.; Gadaleta, S.; Miazzi, M.M.; Pavan, S.; Di Rienzo, V.; Sabetta, W.; et al. GBS-derived SNP catalogue unveiled wide genetic variability and geographical relationships of Italian olive cultivars. Sci. Rep. 2018, 8, 15877. [Google Scholar] [CrossRef] [PubMed]
- Sanz-Cortes, F.; Martinez-Calvo, J.; Badenes, M.L.; Bleiholder, H.; Hack, H.; Llacer, G.; Meier, U. Phenological growth stages of olive trees (Olea europaea). Ann. Appl. Biol. 2002, 140, 151–157. [Google Scholar] [CrossRef]
- Baldoni, L.; Cultrera, N.G.; Mariotti, R.; Ricciolini, C.; Arcioni, S.; Vendramin, G.G.; Buonamici, A.; Porceddu, A.; Sarri, V.; Ojeda, M.A.; et al. A consensus list of microsatellite markers for olive genotyping. Mol. Breed. 2009, 24, 213–231. [Google Scholar] [CrossRef]
- Muzzalupo, I.; Vendramin, G.G.; Chiappetta, A. Genetic Biodiversity of Italian Olives (Olea europaea) Germplasm Analyzed by SSR Markers. Sci. World J. 2014, 2014, 296590. [Google Scholar] [CrossRef] [PubMed]
- Sarri, V.; Baldoni, L.; Porceddu, A.; Cultrera, N.; Contento, A.; Frediani, M.; Belaj, A.; Trujillo, I.; Cionini, P. Microsatellite markers are powerful tools for discriminating among olive cultivars and assigning them to geographically defined populations. Genome 2006, 49, 1606–1615. [Google Scholar] [CrossRef] [PubMed]
- Mohamed, M.B.; Zelasco, S.; Guasmi, S.B.; Triki, T.; Conforti, F.L.; Naziha, G.K. Exploring olive trees genetic variability in the South East of Tunisia. Genet. Mol. Res. 2017, 16, gmr16039850. [Google Scholar] [CrossRef]
- Koehmstedt, A.M.; Aradhya, M.K.; Soleri, D.; Smith, J.L.; Polito, V.S. Molecular characterization of genetic diversity, structure, and differentiation in the olive (Olea europaea L.) germplasm collection of the United States Department of Agriculture. Genet. Res. Crop. Evol. 2011, 58, 519–531. [Google Scholar] [CrossRef]
- Trujillo, I.; Ojeda, M.A.; Urdiroz, N.M.; Potter, D.; Barranco, D.; Rallo, L.; Diez, C.M. Identification of the Worldwide Olive Germplasm Bank of Córdoba (Spain)using SSR and morphological markers. Tree Genet. Genomes 2014, 10, 141–155. [Google Scholar] [CrossRef]
- Sefc, K.M.; Lopes, M.S.; Mendonça, D.; Santos, M.R.D.; Machado, L.M.; Machado, A.D.C. Identification of microsatellite loci in olive (Olea europaea) and their characterization in Italian and Iberian olive trees. Mol. Ecol. 2000, 9, 1171–1173. [Google Scholar] [CrossRef]
- Carriero, F.; Fontanazza, G.; Cellini, F.; Giorio, G. Identification of simple sequence repeats (SSRs) in olive (Olea europaea L.). Theor. Appl. Genet. 2002, 104, 301–307. [Google Scholar] [CrossRef]
- Cipriani, G.; Marrazzo, M.T.; Marconi, R.; Cimato, A.; Testolin, R. Microsatellite markers isolated in olive (Olea europaea L.) are suitable for individual fingerprinting and reveal polymorphism within ancient cultivars. Theor. Appl. Genet. 2002, 104, 223–228. [Google Scholar] [CrossRef] [PubMed]
- De La Rosa, R.; James, C.M.; Tobutt, K.R. Isolation and characterization of polymorphic microsatellites in olive (Olea europaea L.) and their transferability to other genera in the Oleaceae. Mol. Ecol. Notes 2002, 2, 265–267. [Google Scholar] [CrossRef]
- Mariotti, R.; Cultrera, N.G.M.; Mousavi, S.; Baglivo, F.; Rossi, M.; Albertini, E.; Alagna, F.; Carbone, F.; Perrotta, G.; Baldoni, L. Development, evaluation, and validation of new EST-SSR markers in olive (Olea europaea L.). Tree Genet. Genomes 2016, 12, 120. [Google Scholar] [CrossRef]
- Dice, L.R. Measures of the Amount of Ecologic Association Between Species. Ecology 1945, 26, 297–302. [Google Scholar] [CrossRef]
- Sneath, P.H.; Sokal, R.R. Numerical Taxonomy the Principles and Practice of Numerical Classification, 1st ed.; W.H. Freeman and Co.: San Francisco, CA, USA, 1973; 573p. [Google Scholar]
- Marshall, T.C.; Slate, J.; Kruuk, L.E.; Pemberton, J.M. Statistical confidence for likelihood-based paternity inference in natural populations. Mol. Ecol. 1998, 7, 639–655. [Google Scholar] [CrossRef] [PubMed]
- Kalinowski, S.T.; Taper, M.L.; Marshall, T.C. Revising how the computer program CERVUS accommodates genotyping error increases success in paternity assignment. Mol. Ecol. 2007, 16, 1099–1106. [Google Scholar] [CrossRef]
- Kalinowski, S.T.; Taper, M.L.; Marshallm, T.C. Corrigendum. Mol. Ecol. 2010, 19, 1512. [Google Scholar] [CrossRef]
- Yeh, F.C.; Yang, R.C.; Boyle, T.B.; Ye, Z.; Mao, J.X. Popgene, the User-Friendly Shareware for Population Genetic Analysis; Molecular Biology and Biotechnology Centre, University of Alberta: Edmonton, AB, Canada, 1997; 10p. [Google Scholar]
- Pritchard, J.K.; Stephens, M.; Donnelly, P.J. Inference of population Structure using multilocus genotype data. Genetics 2000, 155, 945–959. [Google Scholar]
- Earl, D.A.; Von Holdt, B.M. Structure Harvester, a website and program for visualizing STRUCTURE output and implementing the Evanno method. Cons. Genet. Resour. 2012, 4, 359–361. [Google Scholar] [CrossRef]
- Orlandi, F.; Lanari, D.; Romano, B.; Fornaciari, M. New model to predict the timing of olive (Olea europaea) flowering, a case study in central Italy. N. Z. J. Crop Hortic. Sci. 2006, 34, 93–99. [Google Scholar] [CrossRef]
- Bonofiglio, T.; Orlandi, F.; Sgromo, C.; Romano, B.; Fornaciari, M. Influence of temperature and rainfall on timing of olive (Olea europaea) flowering in southern Italy. N. Z. J. Crop Hortic. Sci. 2008, 36, 59–69. [Google Scholar] [CrossRef]
- Orlandi, F.; Avolio, E.; Bonofiglio, T.; Federico, S.; Romano, B.; Fornaciari, M. Potential shifts in olive flowering according to climate variations in Southern Italy. Meteorol. Appl. 2013, 20, 497–503. [Google Scholar] [CrossRef]
- Burnham, K.P.; Anderson, D.R. Model Selection and Multimodel Inference, A Practical Information-Theoretic Approach, 2nd ed.; Springer-Verlag: New York, NY, USA, 2002; 488p. [Google Scholar]
- Perri, E.; Zelasco, S.; Benincasa, C.; Vizzarri, V.; Carbone, F.; Lo Feudo, G.; Alessandrino, S.; Salimonti, A.; Romano, E.; Pellegrino, M.; et al. Il Germoplasma Olivicolo del Campo Collezione del Consiglio per la Ricerca in Agricoltura e l’analisi Dell’economia Agraria; Crea-oli Cosenza: Rende, Italy, 2016; 404p.
- Marchese, A.; Marra, F.P.; Costa, F.; Quartararo, A.; Fretto, S.; Caruso, T. An investigation of the self- and inter-incompatibility of the olive cultivars ‘Arbequina’ and ‘Koroneiki’ in the Mediterranean climate of Sicily. Aust. J. Crop Sci. 2016, 10, 88–93. [Google Scholar]
- Saumitou-Laprade, P.; Vernet, P.; Vekemans, X.; Billiard, S.; Gallina, S.; Essalouh, L.; Mhaïs, A.; Moukhli, A.; El Bakkali, A.; Barcaccia, G.; et al. Elucidation of the genetic architecture of self-incompatibility in olive, Evolutionary consequences and perspectives for orchard management. Evol. Appl. 2017, 10, 867–880. [Google Scholar] [CrossRef] [PubMed]
- Serrano, I.; Olmedilla, A. Histochemical location of key enzyme activities involved in receptivity and self-incompatibility in the olive tree (Olea europaea L.). Plant Sci. 2012, 197, 40–49. [Google Scholar] [CrossRef] [PubMed]
- Baldini, E. Aspetti genetici della sterilità dell’olivo. Olivicoltura 1951, 1, 3–9. [Google Scholar]
- Reale, L.; Sgromo, C.; Bonofiglio, T.; Orlandi, F.; Fornaciari, M.; Ferranti, F.; Romano, B. Reproductive biology of Olive (Olea europaea L.) DOP Umbria cultivars. Sex. Plant Reprod. 2006, 19, 151–161. [Google Scholar] [CrossRef]
- Galán, C.; Garcia-Mozo, H.; Vazquez, L.; Ruiz-Valenzuela, L.; Díaz de la Guardia, C.; Trigo-Perez, M. Heat requirement for the onset of the Olea europaea L. pollen season in several places of Andalusia region and the effect of the expected future climate change. Int. J. Biometeorol. 2005, 49, 184–188. [Google Scholar] [CrossRef]
- Snyder, R.; Spano, D.; Cesaraccio, C.; Duce, P. Determining degree-day thresholds from field observations. Int. J. Biometeorol. 1999, 42, 177–182. [Google Scholar] [CrossRef]
- Yang, S.; Logan, J.; Coffey, D.L. Mathematical formulae for calculating the base temperature for growing degree days. Agric. For. Meteorol. 1995, 75, 61–74. [Google Scholar] [CrossRef]
- Ruml, M.; Vuković, A.; Milatović, D. Evaluation of different methods for determining growing degree-day thresholds in apricot cultivars. Int. J. Biometeorol. 2010, 54, 411–422. [Google Scholar] [CrossRef] [PubMed]
- Marra, F.P.; Caruso, T.; Costa, F.; Di Vaio, C.; Mafrica, R.; Marchese, A. Genetic relationships, structure and parentage simulation among the olive tree (Olea europaea L. subsp. europaea) cultivated in Southern Italy revealed by SSR markers. Tree Genet. Genomes 2013, 9, 961–973. [Google Scholar] [CrossRef]


| Fruit Set (%) | |||||||||||||||
|---|---|---|---|---|---|---|---|---|---|---|---|---|---|---|---|
| Flowering | Length of the Inflorescence | Flowers per Inflorescence | Pistil Abortion | Free Pollination (A) | Self-Pollination (B) | Self-Pollination Index | Fruit Drop | Drupe Weight | |||||||
| Cultivar | Region | Amount | Timing | Length | (mm) | (n) | (%) | Fruits/ Inflorescence | Fruits/ Perfect Flowers | Fruits/ Inflorescence | Fruits/ Perfect Flowers | (B/A) | (%) | (g) | |
| 1 | Abunara | Sicilia | high | medium | long | 26.19 | 16.31 | 15.6 | 28.48 | 2.07 | 7.88 | 0.57 | 0.28 | 44.47 | 6.26 |
| 2 | Agristigna | Calabria | high | medium | long | 23.92 | 17.46 | 55.75 | 16.92 | 2.19 | 1.72 | 0.22 | 0.1 | 55.73 | 6.04 |
| 3 | Aitana | Sicilia | high | medium | long | 30.19 | 17.05 | 21.55 | 21.26 | 1.59 | 0.28 | 0.02 | 0.01 | 63.48 | 3.30 |
| 4 | Arnasca | Liguria | high | medium | medium | 22.01 | 19.76 | 12.62 | 103.34 | 5.99 | 4.04 | 0.23 | 0.04 | 27.17 | 2.57 |
| 5 | Ascolana dura | Marche | high | late | medium | 28.71 | 14.72 | 68.7 | 22.77 | 4.94 | 0 | 0 | 0 | 48.42 | 4.44 |
| 6 | Aurina | Molise | medium | late | short | 26.86 | 21.28 | 55.76 | 80.31 | 8.53 | 0.11 | 0.01 | 0 | 36.85 | 1.37 |
| 7 | Biancolilla | Sicilia | high | medium | medium | 24.05 | 13.12 | 29.73 | 43.65 | 4.73 | 5.61 | 0.61 | 0.13 | 83.69 | 4.16 |
| 8 | Borgiona | Umbria | medium | medium | medium | 37.40 | 15.14 | 35.66 | 30.33 | 3.11 | 4.48 | 0.46 | 0.15 | 38.42 | 3.67 |
| 9 | Bottone di gallo | Sicilia | high | medium | medium | 30.86 | 20.11 | 66.19 | 43.02 | 6.33 | 0.54 | 0.08 | 0.01 | 25.27 | 2.00 |
| 10 | Cacaredda | Sicilia | medium | early | long | 27.28 | 14.09 | 11.57 | 35.83 | 2.87 | 4.74 | 0.38 | 0.13 | 34.68 | 4.23 |
| 11 | Caizzana | Campania | high | medium | medium | 31.09 | 16.65 | 20.52 | 34.97 | 2.64 | 0 | 0 | 0 | 28.13 | 2.24 |
| 12 | Cammorotana | Campania | medium | medium | medium | 22.85 | 13.37 | 22.74 | 30.09 | 2.91 | 0.86 | 0.08 | 0.03 | 45.64 | 4.70 |
| 13 | Capolga | Marche | high | medium | medium | 20.96 | 14.91 | 47.51 | 27.59 | 3.53 | 0.21 | 0.03 | 0.01 | 28.74 | 4.70 |
| 14 | Caprina di Casalanguida | Abruzzo | medium | early | medium | 22.08 | 12.26 | 58.08 | 38.19 | 7.43 | 0.1 | 0.02 | 0 | 0.00 | 2.78 |
| 15 | Caprina Vastese | Abruzzo | medium | late | short | 31.46 | 18.64 | 27.74 | 90.04 | 6.68 | 0.36 | 0.03 | 0 | 0.00 | 2.11 |
| 16 | Carbonchia | Abruzzo | medium | medium | medium | 24.17 | 12.25 | 29.62 | 23.32 | 2.71 | 0.1 | 0.01 | 0 | 32.82 | 1.91 |
| 17 | Carpellese | Campania | medium | medium | medium | 34.89 | 15.68 | 7.08 | 72.64 | 4.99 | 19.69 | 1.35 | 0.27 | 27.09 | 2.44 |
| 18 | Carpinetana | Abruzzo | high | medium | short | 29.49 | 20.09 | 39.49 | 75.7 | 6.23 | 0.74 | 0.06 | 0.01 | 23.69 | 3.47 |
| 19 | Castricianella rapparina | Sicilia | high | medium | medium | 29.49 | 21.32 | 50.05 | 28.18 | 2.65 | 0.67 | 0.06 | 0.02 | 23.56 | 2.05 |
| 20 | Cavalieri | Sicilia | high | medium | medium | 27.24 | 18.04 | 41.85 | 32.18 | 3.07 | 0.26 | 0.03 | 0.01 | 29.88 | 2.90 |
| 21 | Cellacchia | Lazio | high | late | medium | 26.06 | 20.68 | 69.06 | 19.69 | 3.08 | 7.29 | 1.14 | 0.37 | 11.44 | 2.47 |
| 22 | Cellina di Rotello | Molise | medium | medium | medium | 37.64 | 18.49 | 12.94 | 69.58 | 4.32 | 30.65 | 1.9 | 0.44 | 32.10 | 3.07 |
| 23 | Cicinella | Campania | high | medium | medium | 24.62 | 16.46 | 34.78 | 62.53 | 5.83 | 4.08 | 0.38 | 0.07 | 30.63 | 2.31 |
| 24 | Colombina | Emilia | medium | medium | medium | 31.17 | 18.97 | 7.32 | 61.48 | 3.5 | 2.82 | 0.16 | 0.05 | 20.46 | 2.44 |
| 25 | Corneglia | Campania | low | medium | medium | 31.15 | 16.31 | 17.64 | 24.38 | 1.81 | 2.67 | 0.2 | 0.11 | 9.84 | 3.39 |
| 26 | Cornia | Campania | medium | medium | medium | 28.01 | 10.34 | 26.43 | 17.76 | 2.33 | 2.26 | 0.3 | 0.13 | 11.39 | 1.83 |
| 27 | Corniola | Calabria | high | medium | medium | 25.20 | 18.24 | 52.51 | 35.6 | 4.11 | 0.74 | 0.09 | 0.02 | 26.25 | 3.24 |
| 28 | Crognolo | Lazio | medium | medium | medium | 32.31 | 14.22 | 1.41 | 50.52 | 3.6 | 17.92 | 1.28 | 0.35 | 21.09 | 2.50 |
| 29 | Dolce di Andria | Puglia | medium | early | long | 35.95 | 15.2 | 11.28 | 38.69 | 2.87 | 2.22 | 0.16 | 0.06 | 78.42 | 4.49 |
| 30 | Dolce di Cerchiara | Calabria | medium | medium | medium | 27.78 | 15.11 | 66.25 | 19.81 | 3.88 | 0 | 0 | 0 | 45.25 | 3.43 |
| 31 | Dritta di Loreto | Marche | high | medium | medium | 23.40 | 14.75 | 22.24 | 77.42 | 6.75 | 0.77 | 0.07 | 0.01 | 32.11 | 1.82 |
| 32 | Erbano | Sicilia | high | late | medium | 25.72 | 17.66 | 42.53 | 42.07 | 4.14 | 3.16 | 0.31 | 0.08 | 39.45 | 1.85 |
| 33 | Faresana | Basilicata | high | medium | medium | 44.13 | 21.79 | 53.46 | 25.37 | 2.5 | 0 | 0 | 0 | 36.47 | 4.56 |
| 34 | Femminella di Torraca | Campania | medium | medium | medium | 30.60 | 19.72 | 35.76 | 43.11 | 3.4 | 2.43 | 0.19 | 0.06 | 33.95 | 1.97 |
| 35 | Fosco | Lazio | medium | late | short | 38.61 | 24.59 | 35.67 | 50.24 | 3.18 | 6.93 | 0.44 | 0.14 | 29.49 | 2.25 |
| 36 | Gentile dell’Aquila | Abruzzo | medium | medium | long | 24.56 | 16.35 | 57.27 | 35.41 | 5.07 | 2.14 | 0.31 | 0.06 | 44.59 | 4.50 |
| 37 | Ghiannara | Basilicata | medium | medium | medium | 28.34 | 12.84 | 18.22 | 54.51 | 5.19 | 6.99 | 0.67 | 0.13 | 35.56 | 2.34 |
| 38 | Giarfara | Sicilia | high | medium | long | 30.07 | 14.04 | 10.86 | 51.71 | 4.13 | 0.19 | 0.02 | 0 | 55.44 | 5.70 |
| 39 | Giusta | Basilicata | medium | early | medium | 30.04 | 14.34 | 15.2 | 46.8 | 3.85 | 0.3 | 0.02 | 0.01 | 20.64 | 3.69 |
| 40 | Gnagnaro | Molise | medium | late | short | 32.13 | 19.47 | 13.52 | 87.82 | 5.22 | 10.11 | 0.6 | 0.12 | 18.76 | 0.79 |
| 41 | Grappolo | Toscana | medium | late | medium | 29.45 | 17.73 | 33.8 | 115.48 | 9.84 | 0.3 | 0.03 | 0 | 31.07 | 2.53 |
| 42 | Grossa di Venafro | Molise | medium | late | medium | 36.88 | 28.78 | 35.35 | 66.41 | 3.57 | 12.5 | 0.67 | 0.19 | 26.91 | 2.49 |
| 43 | Grossale | Campania | medium | medium | medium | 28.74 | 18.22 | 45.32 | 26.99 | 2.71 | 1.53 | 0.15 | 0.06 | 22.58 | 3.13 |
| 44 | I/77 | Umbria | high | medium | medium | 36.15 | 20.89 | 81.76 | 35.25 | 9.25 | 0 | 0 | 0 | 46.60 | 3.79 |
| 45 | Lumiaru | Sicilia | medium | medium | medium | 30.74 | 18.22 | 32.75 | 17.95 | 1.47 | 3.24 | 0.26 | 0.18 | 34.20 | 5.20 |
| 46 | Mafra | Calabria | high | medium | medium | 37.80 | 25.38 | 79.23 | 25.81 | 4.9 | 0.51 | 0.1 | 0.02 | 42.58 | 3.31 |
| 47 | Monaca | Sicilia | high | medium | medium | 29.51 | 25.08 | 73.33 | 15.05 | 2.25 | 0.21 | 0.03 | 0.01 | 40.80 | 4.29 |
| 48 | Morchiaio | Toscana | high | medium | medium | 27.22 | 18.14 | 24.35 | 31.52 | 2.3 | 0.38 | 0.03 | 0.01 | 21.79 | 4.27 |
| 49 | Morcone | Toscana | high | medium | medium | 27.50 | 21.25 | 25.47 | 39.69 | 2.51 | 3.78 | 0.24 | 0.1 | 11.26 | 1.64 |
| 50 | Morellona di Grecia | Puglia | medium | late | short | 30.96 | 18.8 | 29.04 | 88.26 | 6.62 | 0.18 | 0.01 | 0 | 32.48 | 3.13 |
| 51 | Nasitana a frutto grosso | Sicilia | high | medium | medium | 28.38 | 15.99 | 21.13 | 14.75 | 1.17 | 0.8 | 0.06 | 0.05 | 22.74 | 4.20 |
| 52 | Nebba | Sicilia | high | medium | medium | 31.22 | 15.79 | 26.1 | 23.63 | 2.02 | 1.43 | 0.12 | 0.06 | 62.03 | 5.03 |
| 53 | Nebbia | Marche | medium | medium | medium | 28.54 | 16.68 | 7.15 | 99.7 | 6.44 | 5.18 | 0.33 | 0.05 | 10.14 | 2.39 |
| 54 | Nebbio di Pescara | Abruzzo | medium | medium | medium | 40.30 | 20.69 | 68.95 | 42.73 | 6.65 | 0.18 | 0.03 | 0 | 19.05 | 2.46 |
| 55 | Nera di Colletorto | Molise | medium | medium | medium | 31.25 | 13.08 | 32.93 | 50.89 | 5.8 | 0.05 | 0.01 | 0 | 18.17 | 3.15 |
| 56 | Nerba | Sicilia | medium | medium | medium | 23.07 | 14.01 | 45.45 | 22.14 | 2.9 | 1.79 | 0.23 | 0.08 | 63.64 | 4.43 |
| 57 | Ogliara | Campania | high | medium | medium | 29.82 | 16.43 | 9.13 | 58.95 | 3.95 | 0.07 | 0 | 0 | 37.22 | 2.44 |
| 58 | Ogliastro grande | Campania | high | late | medium | 28.01 | 14.17 | 52.41 | 24.62 | 3.65 | 0.33 | 0.05 | 0.01 | 33.80 | 4.71 |
| 59 | Oliva grossa | Emilia | high | medium | medium | 26.96 | 18.46 | 90.75 | 2.27 | 1.33 | 0 | 0 | 0 | 45.53 | 6.97 |
| 60 | Olivastro di Bucchianico | Abruzzo | medium | medium | medium | 35.49 | 18.63 | 65.79 | 19.66 | 3.08 | 7.8 | 1.22 | 0.4 | 30.62 | 2.46 |
| 61 | Olivastro frentano | Abruzzo | high | late | short | 34.00 | 18.48 | 82.84 | 50.45 | 15.91 | 0.28 | 0.09 | 0.01 | 18.90 | 1.86 |
| 62 | Olivella appuntita | Campania | high | late | short | 24.83 | 18.03 | 38.17 | 69.14 | 6.2 | 1.93 | 0.17 | 0.03 | 33.10 | 3.19 |
| 63 | Olivella di Cerchiara | Calabria | high | medium | medium | 29.26 | 20.71 | 84.07 | 25.28 | 7.66 | 0.43 | 0.13 | 0.02 | 31.28 | 3.45 |
| 64 | Olivo da mensa | Basilicata | high | medium | medium | 31.34 | 17.58 | 67.85 | 13.86 | 2.45 | 0.09 | 0.02 | 0.01 | 34.73 | 4.60 |
| 65 | Olivo da olio | Campania | high | medium | medium | 28.58 | 14.91 | 12.74 | 58.94 | 4.53 | 0.23 | 0.02 | 0 | 22.18 | 2.42 |
| 66 | Olivo da salare | Campania | medium | medium | long | 26.94 | 13.12 | 26.37 | 30.28 | 3.13 | 0.93 | 0.1 | 0.03 | 63.70 | 3.17 |
| 67 | Olivo di Casavecchia | Toscana | medium | medium | medium | 30.48 | 13.8 | 16.85 | 22.08 | 1.92 | 0.4 | 0.03 | 0.02 | 22.90 | 3.06 |
| 68 | Olivo di Castiglione | Sicilia | high | medium | medium | 20.00 | 10.56 | 9.7 | 18.21 | 1.91 | 0.82 | 0.09 | 0.05 | 59.00 | 4.51 |
| 69 | Olivone di Viterbo | Lazio | high | medium | medium | 40.01 | 28.16 | 88.93 | 37.18 | 11.93 | 7.76 | 2.49 | 0.21 | 28.00 | 3.23 |
| 70 | Ornellaia | Toscana | high | medium | medium | 36.46 | 13.77 | 30.72 | 41.92 | 4.39 | 4.7 | 0.49 | 0.11 | 29.81 | 4.16 |
| 71 | Ortice | Campania | medium | medium | medium | 34.54 | 22.84 | 58.17 | 45.27 | 4.74 | 0.15 | 0.02 | 0 | 25.89 | 2.54 |
| 72 | Paesana bianca | Molise | medium | medium | medium | 35.29 | 16.92 | 10.69 | 35.38 | 2.34 | 9.79 | 0.65 | 0.28 | 51.40 | 2.45 |
| 73 | Paesana nera | Molise | high | late | short | 34.26 | 23.18 | 29.86 | 69.38 | 4.27 | 2.88 | 0.18 | 0.04 | 43.37 | 2.49 |
| 74 | Palmarola | Basilicata | medium | late | medium | 26.37 | 12.7 | 2.6 | 62.67 | 5.07 | 3.54 | 0.29 | 0.06 | 61.79 | 2.35 |
| 75 | Passulunara | Sicilia | medium | medium | medium | 31.98 | 11.87 | 8.55 | 43.4 | 4 | 14.1 | 1.3 | 0.32 | 50.05 | 4.87 |
| 76 | Pennulara | Calabria | medium | medium | medium | 24.29 | 10.64 | 13.22 | 21.62 | 2.34 | 21.94 | 2.38 | 1.01 | 62.05 | 4.61 |
| 77 | Perciasacchi | Campania | high | medium | medium | 27.02 | 20.97 | 76.06 | 29.69 | 5.91 | 0.9 | 0.18 | 0.03 | 40.66 | 3.04 |
| 78 | Pesciatino | Toscana | medium | medium | medium | 25.08 | 22.45 | 76.06 | 89.58 | 16.67 | 1.09 | 0.2 | 0.01 | 17.00 | 2.26 |
| 79 | Piangente | Toscana | high | medium | long | 32.65 | 17.74 | 4.85 | 67.01 | 3.97 | 0.77 | 0.05 | 0.01 | 28.74 | 2.58 |
| 80 | Pizzutella | Sicilia | high | medium | medium | 21.19 | 24.41 | 68.1 | 8.1 | 1.04 | 0.11 | 0.01 | 0.01 | 19.74 | 3.56 |
| 81 | Posola | Abruzzo | medium | late | medium | 22.53 | 15.51 | 35.52 | 27.73 | 2.77 | 0.22 | 0.02 | 0.01 | 37.36 | 3.81 |
| 82 | Posolella | Abruzzo | medium | medium | medium | 35.28 | 18.79 | 36.4 | 48.01 | 4.02 | 0.7 | 0.06 | 0.01 | 21.02 | 1.91 |
| 83 | Procanica | Lazio | medium | medium | short | 35.06 | 15.87 | 1.07 | 90.44 | 5.76 | 2.49 | 0.16 | 0.03 | 34.41 | 2.54 |
| 84 | Provenzale | Campania | high | early | long | 26.02 | 13.59 | 49 | 22.31 | 3.22 | 4.68 | 0.68 | 0.21 | 9.01 | 3.09 |
| 85 | Puntella | Abruzzo | medium | late | medium | 31.34 | 21 | 71.55 | 49.57 | 8.3 | 3.91 | 0.65 | 0.08 | 23.07 | 2.05 |
| 86 | Racioppa campana | Campania | high | late | medium | 31.06 | 21.38 | 13.57 | 47.46 | 2.57 | 0.71 | 0.04 | 0.01 | 26.02 | 3.50 |
| 87 | Racioppa | Basilicata | medium | medium | medium | 24.82 | 19.58 | 31.21 | 107.62 | 7.99 | 0.55 | 0.04 | 0.01 | 24.10 | 2.41 |
| 88 | Rajo | Umbria | high | medium | long | 37.06 | 15.43 | 28.32 | 62.91 | 5.69 | 1.49 | 0.14 | 0.02 | 13.92 | 2.48 |
| 89 | Ravece | Campania | high | medium | medium | 25.68 | 14.76 | 51.74 | 36.88 | 5.18 | 1.19 | 0.17 | 0.03 | 36.15 | 2.99 |
| 90 | Remugnana | Molise | medium | medium | medium | 32.59 | 18.28 | 2.26 | 81.07 | 4.54 | 0.96 | 0.05 | 0.01 | 26.87 | 1.96 |
| 91 | Resciola di Venafro | Molise | medium | late | short | 35.36 | 19.99 | 44.47 | 49.36 | 4.45 | 6.84 | 0.62 | 0.14 | 20.29 | 2.55 |
| 92 | Riminino | Lazio | high | early | medium | 46.65 | 28.59 | 76.56 | 39.32 | 5.87 | 2.82 | 0.42 | 0.07 | 53.71 | 3.82 |
| 93 | Ritonnella | Campania | high | medium | long | 27.32 | 21.19 | 69.95 | 12.93 | 2.03 | 4.08 | 0.64 | 0.32 | 58.93 | 3.54 |
| 94 | Rizzitella | Campania | medium | medium | short | 24.08 | 17.66 | 57.25 | 26.32 | 3.49 | 1.96 | 0.26 | 0.07 | 45.36 | 2.15 |
| 95 | Rosciola coltodino | Lazio | high | early | medium | 36.49 | 24.04 | 61.69 | 82.01 | 8.9 | 1.13 | 0.12 | 0.01 | 28.01 | 1.85 |
| 96 | Rosciola di Rotello | Molise | medium | medium | medium | 31.59 | 13.55 | 9.23 | 59.03 | 4.8 | 5.08 | 0.41 | 0.09 | 30.75 | 2.37 |
| 97 | Rossina | Emilia | high | medium | medium | 21.23 | 14.18 | 30.1 | 62.99 | 6.36 | 3.34 | 0.34 | 0.05 | 38.93 | 1.52 |
| 98 | Rotondella campana | Campania | high | medium | long | 27.50 | 15.52 | 45.38 | 49.71 | 5.87 | 2.88 | 0.34 | 0.06 | 52.27 | 3.31 |
| 99 | Rotondella lucana | Basilicata | high | medium | medium | 28.20 | 12.25 | 30.41 | 23.47 | 2.75 | 6.63 | 0.78 | 0.28 | 12.27 | 2.91 |
| 100 | Rustica | Abruzzo | high | medium | long | 27.71 | 15.41 | 66.52 | 27.65 | 5.36 | 0.46 | 0.09 | 0.02 | 29.46 | 3.88 |
| 101 | Ruveia | Campania | high | medium | short | 21.21 | 19.11 | 55.66 | 52.89 | 6.24 | 0 | 0 | 0 | 16.76 | 2.23 |
| 102 | Saligna | Molise | high | late | medium | 30.73 | 18.92 | 46.42 | 62.07 | 6.12 | 17.63 | 1.74 | 0.28 | 25.70 | 2.24 |
| 103 | Sammartinara | Sicilia | medium | medium | medium | 30.23 | 14.16 | 34.31 | 56.66 | 6.09 | 0.34 | 0.04 | 0.01 | 31.19 | 3.76 |
| 104 | Sammartinenga | Basilicata | high | early | long | 29.50 | 22.99 | 80.84 | 20.04 | 4.55 | 0 | 0 | 0 | 38.36 | 1.81 |
| 105 | San Benedetto | Puglia | high | early | long | 28.64 | 15.65 | 10.18 | 28.69 | 2.04 | 0.09 | 0.01 | 0 | 23.91 | 3.93 |
| 106 | Sanginara | Campania | high | medium | medium | 29.09 | 20.18 | 43.82 | 45.27 | 3.99 | 0.95 | 0.08 | 0.02 | 21.52 | 1.96 |
| 107 | Santa Maria | Campania | medium | late | short | 37.47 | 15.58 | 39.11 | 73.69 | 7.77 | 2.81 | 0.3 | 0.04 | 17.85 | 1.91 |
| 108 | Scarpetta | Basilicata | medium | late | medium | 29.29 | 15.98 | 27.91 | 86.06 | 7.47 | 0.43 | 0.04 | 0.01 | 21.75 | 2.11 |
| 109 | Sessana | Campania | high | late | medium | 26.51 | 17.71 | 50.02 | 42.13 | 4.76 | 7.36 | 0.83 | 0.17 | 23.54 | 1.98 |
| 110 | Sivigliana da olio | Sardegna | medium | medium | medium | 33.20 | 26.21 | 89.24 | 35.77 | 12.68 | 0 | 0 | 0 | 35.59 | 1.73 |
| 111 | Spagnola di Missano | Liguria | high | medium | medium | 32.36 | 21.51 | 74.48 | 52.66 | 9.59 | 7.05 | 1.28 | 0.13 | 39.64 | 3.61 |
| 112 | Spezzanese | Calabria | high | early | long | 24.86 | 13.95 | 19.28 | 29.48 | 2.62 | 14.46 | 1.28 | 0.49 | 30.31 | 5.70 |
| 113 | Tenacella | Campania | high | late | short | 31.79 | 18.98 | 61.68 | 73.82 | 10.15 | 33.76 | 4.64 | 0.46 | 26.57 | 1.01 |
| 114 | Tombarello | Calabria | high | medium | medium | 27.45 | 19.34 | 13.25 | 37 | 2.2 | 0.33 | 0.02 | 0.01 | 22.44 | 1.79 |
| 115 | Tonda di Alife | Campania | high | late | medium | 31.16 | 22.13 | 42.77 | 57.91 | 4.57 | 8 | 0.63 | 0.14 | 31.09 | 2.70 |
| 116 | Tonda dolce | Calabria | medium | early | medium | 25.84 | 14.26 | 25.45 | 27.74 | 2.61 | 0.17 | 0.02 | 0.01 | 43.28 | 2.89 |
| 117 | Tunnulidda | Sicilia | medium | early | long | 27.18 | 15.73 | 14.9 | 37.97 | 2.84 | 5.31 | 0.4 | 0.14 | 37.60 | 4.13 |
| 118 | Vigna della corte | Campania | medium | medium | medium | 21.25 | 12.71 | 30.97 | 14.32 | 1.63 | 1.12 | 0.13 | 0.08 | 0.00 | 2.72 |
| 119 | Vocio | Umbria | medium | medium | medium | 25.51 | 15.17 | 36.32 | 23.57 | 2.44 | 5.17 | 0.54 | 0.22 | 20.23 | 4.09 |
| 120 | Zarbo | Sicilia | low | medium | medium | 29.59 | 13.41 | 29.4 | 64.8 | 6.85 | 1.51 | 0.16 | 0.02 | 33.81 | 5.66 |
| Locus | Na | Ho | He | HW | F (null) | PIC | NE-I | NE-SI |
|---|---|---|---|---|---|---|---|---|
| dca3 | 11 | 0.916 | 0.847 | * | −0.0421 | 0.824 | 0.044 | 0.339 |
| dca5 | 15 | 0.831 | 0.696 | *** | −0.1179 | 0.673 | 0.114 | 0.432 |
| dca8 | 18 | 0.975 | 0.845 | ** | −0.0760 | 0.822 | 0.044 | 0.340 |
| dca16 | 23 | 0.689 | 0.858 | ** | 0.1122 | 0.843 | 0.033 | 0.331 |
| dca18 | 12 | 0.957 | 0.852 | NS | −0.0607 | 0.831 | 0.041 | 0.336 |
| gapu71b | 8 | 0.881 | 0.784 | *** | −0.0626 | 0.745 | 0.084 | 0.381 |
| emo090 | 8 | 0.786 | 0.713 | NS | −0.0621 | 0.672 | 0.122 | 0.426 |
| dca9 | 22 | 0.924 | 0.898 | NS | −0.0182 | 0.884 | 0.021 | 0.308 |
| udo15 | 8 | 0.75 | 0.858 | ND | ND | 0.78 | 0.063 | 0.363 |
| udo12 | 3 | 0.733 | 0.66 | NS | −0.0842 | 0.565 | 0.204 | 0.482 |
| dca11 | 10 | 0.379 | 0.771 | *** | 0.3390 | 0.735 | 0.085 | 0.389 |
| olest23 | 3 | 0.4 | 0.511 | ND | ND | 0.41 | 0.341 | 0.605 |
| Mean | 11.75 | 0.77 | 0.77 | 0.73 |
| Cultivar | Provenience | Allele Size | Locus |
|---|---|---|---|
| Carbonchia | Abruzzo | 159 | DCA18 |
| Rustica | Abruzzo | 202 | DCA9 |
| Sammartinenga | Basilicata | 241 | DCA3 |
| Sammartinenga | Basilicata | 164 | DCA16 |
| Scarpetta | Basilicata | 184 | EMO090 |
| Giusta | Basilicata | 196 | DCA5 |
| Corniola | Calabria | 135 | DCA8 |
| Dolce di Cerchiara | Calabria | 162 | DCA16 |
| Santa Maria | Campania | 255 | DCA3 |
| Corneglia | Campania | 204 | DCA5 |
| Olivone di Viterbo | Lazio | 136 | DCA16 |
| Gnagnaro | Molise | 134 | DCA16 |
| Rosciola di Rotello | Molise | 196 | EMO090 |
| Gnagnaro | Molise | 130 | DCA11 |
| Biancolilla | Sicilia | 210 | DCA9 |
| Bottone di Gallo | Sicilia | 129 | DCA8 |
| Castricianella Rapparina | Sicilia | 161 | DCA8 |
| Castricianella Rapparina | Sicilia | 192 | EMO090 |
| Erbano | Sicilia | 166 | DCA9 |
| Rajo | Umbria | 188 | DCA9 |
| Cultivar | Geographic Provenience | Dice Similarity Index | Structure Group |
|---|---|---|---|
| Carpinetana | Abruzzo | 0.87 | admixture |
| Olivella Appuntita | Campania | admixture | |
| Arnasca | Liguria | 0.84 | Red |
| Pesciatino | Toscana | 1 | Red |
| Ruveia | Campania | Red | |
| Ogliara | Campania | 0.87; 0.77; 0.77 | Red |
| Olivo da olio | Campania | 0.9; 0.9 | Red |
| Gentile Nera di Colletorto | Molise | 0.87 | Red |
| Remugnana | Molise | Red | |
| Faresana | Basilicata | 0.86 | admixture |
| Olivo da Mensa | Basilicata | admixture | |
| Ritonnella | Campania | 0.9 | admixture |
| Rotondella lucana | Basilicata | admixture | |
| Dolce di Cerchiara | Calabria | 0.87; 0.81 | Red |
| Mafra | Calabria | 0.87 | Red |
| Spezzanese | Calabria | Red | |
| Nasitana Frutto Grosso | Sicilia | 0.94 | Red |
| San Benedetto | Puglia | Red | |
| Cacaredda | Sicilia | 0.94 | Red |
| Tunnulidda | Sicilia | Red | |
| Nerba | Sicilia | 0.86 | Red |
| Olivo di Castiglione | Sicilia | Red | |
| Perciasacchi | Campania | 1 | admixture |
| Ravece | Campania | admixture | |
| Grossale | Campania | 0.84 | Red |
| Provenzale | Campania | Red | |
| Ogliastro grande | Campania | 0.93 | Red |
| Racioppa Campana | Campania | Red | |
| Giarfara | Sicilia | 0.96 | Green |
| Nebba | Sicilia | Green | |
| Carpellese | Campania | 0.77; 0.84;0.84; 0.81;0.71 | Green |
| Crognolo | Lazio | 0.94; 0.93; 0.92; 0.8 | Green |
| Ghiannara | Basilicata | 1; 1; 0.87 | Green |
| Paesana Bianca | Molise | 1; 0.87 | Green |
| Procanica | Lazio | 0.85 | Green |
| Rosciola di Rotello | Molise | Green | |
| Caprina vastese | Abruzzo | 0.83; 0.83; 0.83; 0.8; 0.76; 0.77 | Green |
| Cicinella | Campania | 1; 1; 0.9; 0.93; 0.87 | Green |
| Sanginara | Campania | 1; 0.9; 0.93; 0.87 | Green |
| Tonda di Alife | Campania | 0.9; 0.93; 0.87 | Green |
| Fosco | Lazio | 0.9; 0.9 | Green |
| Grossa di Venafro | Molise | 0.94 | Green |
| Paesana nera | Molise | Green | |
| Olivone di Viterbo | Lazio | 0.96 | admixture |
| Riminino | Lazio | admixture | |
| Passulunara | Sicilia | 0.83 | Red |
| Zarbo | Sicilia | Red |
| Offspring ID | Region | First Candidate ID | Region | Second Candidate ID | Region |
|---|---|---|---|---|---|
| Abunara | Sicily | Giarfara | Sicily | Scarpetta | Basilicata |
| Aitana | Sicily | Giarfara | Sicily | Scarpetta | Basilicata |
| Capolga | Marche | Morellona di Grecia | Puglia | Rossina | E. Romagna |
| Colombina | E. Romagna | Carpellese | Campania | Palmarola | Basilicata |
| Gentile dell’Aquila | Abruzzo | Fosco | Lazio | Posola | Abruzzo |
| Grappolo | Tuscany | Paesana Bianca | Molise | Piangente | Tuscany |
| I/77 | Umbria | Cicinella | Campania | Olivo di Castiglione | Sicily |
| Lumiaru | Sicily | Caiazzana | Campania | Rustica | Abruzzo |
| Oliva grossa | E. Romagna | Spagnola di Missano | Liguria | Zarbo | Sicily |
| Olivo da salare | Campania | Arnasca | Liguria | Bottone di gallo | Sicily |
| Palmarola | Basilicata | Colombina | E. Romagna | Paesana bianca | Molise |
| Rizzitella | Campania | Bottone di gall | Sicily | Racioppa lucana | Basilicata |
| Rosciola coltodino | Lazio | Carpinetana | Abruzzo | Racioppa lucana | Basilicata |
| Rossina | E. Romagna | Giarfara | Sicily | Paesana near | Molise |
| Sammartinara | Sicily | Nebba | Sicily | Scarpetta | Basilicata |
| Santa Maria | Campania | Aurina | Molise | Rossina | E. Romagna |
| Sessana | Campania | Procanica | Lazio | Vigna della Corte | Campania |
| Spagnola di Missano | Liguria | Carpellese | Campania | Oliva grossa | E. Romagna |
| Vigna della corte | Campania | Monaca | Sicily | Rotondella lucana | Basilicata |
| Vocio | Umbria | Carpinetana | Abruzzo | Olivo da salare | Campania |
| Zarbo | Sicily | Giarfara | Sicily | Scarpetta | Basilicata |
| One of the parental genotypes and the offspring share the same region of origin. | |||||
| Neighboring regions of origin for the two parental genotypes. | |||||
| No type of geographical relationship. | |||||
© 2019 by the authors. Licensee MDPI, Basel, Switzerland. This article is an open access article distributed under the terms and conditions of the Creative Commons Attribution (CC BY) license (http://creativecommons.org/licenses/by/4.0/).
Share and Cite
Lombardo, L.; Fila, G.; Lombardo, N.; Epifani, C.; Duffy, D.H., III; Godino, G.; Salimonti, A.; Zelasco, S. Uncovering Olive Biodiversity through Analysis of Floral and Fruiting Biology and Assessment of Genetic Diversity of 120 Italian Cultivars with Minor or Marginal Diffusion. Biology 2019, 8, 62. https://doi.org/10.3390/biology8030062
Lombardo L, Fila G, Lombardo N, Epifani C, Duffy DH III, Godino G, Salimonti A, Zelasco S. Uncovering Olive Biodiversity through Analysis of Floral and Fruiting Biology and Assessment of Genetic Diversity of 120 Italian Cultivars with Minor or Marginal Diffusion. Biology. 2019; 8(3):62. https://doi.org/10.3390/biology8030062
Chicago/Turabian StyleLombardo, Luca, Gianni Fila, Nicola Lombardo, Chiara Epifani, Donald H. Duffy, III, Gianluca Godino, Amelia Salimonti, and Samanta Zelasco. 2019. "Uncovering Olive Biodiversity through Analysis of Floral and Fruiting Biology and Assessment of Genetic Diversity of 120 Italian Cultivars with Minor or Marginal Diffusion" Biology 8, no. 3: 62. https://doi.org/10.3390/biology8030062
APA StyleLombardo, L., Fila, G., Lombardo, N., Epifani, C., Duffy, D. H., III, Godino, G., Salimonti, A., & Zelasco, S. (2019). Uncovering Olive Biodiversity through Analysis of Floral and Fruiting Biology and Assessment of Genetic Diversity of 120 Italian Cultivars with Minor or Marginal Diffusion. Biology, 8(3), 62. https://doi.org/10.3390/biology8030062