Article

Application of Fluorescence Two-Dimensional Difference In-Gel Electrophoresis as a Proteomic Biomarker Discovery Tool in Muscular Dystrophy Research

1
Department of Biology, National University of Ireland, Maynooth, Kildare, Ireland
2
Department of Physiology II, University of Bonn, Bonn D-53115, Germany
*
Author to whom correspondence should be addressed.
Biology 2013, 2(4), 1438-1464; https://doi.org/10.3390/biology2041438
Submission received: 24 September 2013 / Revised: 5 November 2013 / Accepted: 12 November 2013 / Published: 2 December 2013
(This article belongs to the Special Issue Advances in Proteomics Methods)

Abstract

:
In this article, we illustrate the application of difference in-gel electrophoresis for the proteomic analysis of dystrophic skeletal muscle. The mdx diaphragm was used as a tissue model of dystrophinopathy. Two-dimensional gel electrophoresis is a widely employed protein separation method in proteomic investigations. Although two-dimensional gels usually underestimate the cellular presence of very high molecular mass proteins, integral membrane proteins and low copy number proteins, this method is extremely powerful in the comprehensive analysis of contractile proteins, metabolic enzymes, structural proteins and molecular chaperones. This gives rise to two-dimensional gel electrophoretic separation as the method of choice for studying contractile tissues in health and disease. For comparative studies, fluorescence difference in-gel electrophoresis has been shown to provide an excellent biomarker discovery tool. Since aged diaphragm fibres from the mdx mouse model of Duchenne muscular dystrophy closely resemble the human pathology, we have carried out a mass spectrometry-based comparison of the naturally aged diaphragm versus the senescent dystrophic diaphragm. The proteomic comparison of wild type versus mdx diaphragm resulted in the identification of 84 altered protein species. Novel molecular insights into dystrophic changes suggest increased cellular stress, impaired calcium buffering, cytostructural alterations and disturbances of mitochondrial metabolism in dystrophin-deficient muscle tissue.

Graphical Abstract

1. Introduction

Skeletal muscle proteomics is concerned with the global analysis of protein populations from voluntary contractile tissues. Starting material may consist of crude extracts from total muscle preparations, protein constellations from defined muscle-associated cell types, isolated organelles, supramolecular protein complexes or the fibre secretome. The separation of muscle proteins is usually performed by gel electrophoresis and/or liquid chromatography and followed by the computer-assisted analysis of proteomic maps. In order to reproducibly generate peptide signatures of separated proteins, standardized digestion protocols are applied in muscle proteomics. Mass spectrometry is the method of choice for the rapid and reliable identification of individual protein species by their peptide fingerprint or amino acid sequence. Immunoblotting surveys, immunofluorescence microscopy, biochemical assays and functional testing are usually carried out to verify large-scale proteomic data. Comprehensive reviews have critically examined the impact of mass spectrometry-based proteomics in basic and applied myology [1,2,3]. In the long-term, proteomic biomarker discovery promises to be instrumental for the swift identification of novel indicators that may decisively increase our knowledge base of basic physiological and complex pathophysiological mechanisms, as well as improve a variety of diagnostic, prognostic and therapeutic approaches in the field of neuromuscular disorders [4].
Various forms of high-resolution two-dimensional gel electrophoresis are routinely used for separating complex protein mixtures [5,6,7]. In the case of muscle proteomics, gel electrophoresis is highly suitable for the high-throughput analysis of the most abundant muscle proteins, such as myosins, actins, troponins, tropomyosins, glycolytic enzymes, mitochondrial proteins, cytoskeletal proteins and molecular chaperones [8]. Although the exact number of proteins representing the skeletal muscle proteome is not known, the accessible portion of proteins probably make up the majority of the skeletal muscle proteome [9]. The actomyosin apparatus and its auxiliary sarcomeric elements constitute nearly half of all muscle proteins [10], the enzymes of glycolysis represent the 10 most abundant proteins of the diffusible fraction of the vertebrate muscle proteome [11], mitochondrial proteins account for approximately one fifth of the muscle protein complement [12] and chaperones are also relatively abundant in skeletal muscle tissues [13]. Thus, gel-based studies with urea-soluble proteins cover a considerable portion of the total skeletal muscle proteome and are therefore suitable for both protein cataloging exercises and comparative studies. However, certain classes of protein are clearly underrepresented in proteomic approaches that employ gel electrophoresis as its main protein separation method [8]. These types of muscle-associated proteins include especially integral membrane proteins, very high molecular mass proteins and low-abundance proteins. To overcome this technical problem, other than using sophisticated liquid chromatography approaches [14], alternative electrophoretic methods can be employed to supplement routine 2D-gel based investigations. This includes agarose 2D gel electrophoresis [15,16], Native-Blue gel electrophoresis [17,18], non-reducing/reducing diagonal 2D gel electrophoresis [19,20], off-gel electrophoresis [21,22] and on-membrane digestion of proteins separated by large one-dimensional gradient gels [23,24]. In addition to studies involving 2D gels, normal and diseased skeletal muscle tissues have been extensively studied by 1D gel electrophoresis coupled to HPLC-ESI-MS/MS analysis and quantitative approaches such as the SILAC or ICAT method [9,11,12,25,26,27]. Combined outcomes from gel-based and gel-free separation methods and data generation from labeling versus label-free MS analyses often result in complementary findings that can give a more comprehensive overview than that achieved by just using a single proteomic approach.
Over the last few years, fluorescence two-dimensional difference in-gel electrophoresis has proven to be an excellent biomarker discovery tool for comparative studies in neuromuscular biology [28]. Originally described by Minden and co-workers [29], this key proteomic method can be used with fluorescent 2-CyDye or 3-CyDye systems to differentially label proteins from dissimilar protein mixtures prior to gel electrophoresis [30,31,32], as diagrammatically shown in Figure 1. Using optimized 2D software analysis tools [33,34], advanced DIGE analysis can highly accurately quantitate multiple protein samples on the same 2D gel, which greatly reduces the introduction of potential artifacts due to gel-to-gel variations [35,36]. For comparative muscle proteomics, routinely 50 μg protein aliquots from individual fractions are labeled with Cy2, Cy3 or Cy5 dyes. Pre-electrophoretically labeled proteins usually account for a representative proportion of key contractile, structural, metabolic and regulatory muscle proteins [37]. In general, selective labeling artifacts do not appear to play a major role in the case of soluble protein species, as suggested by the statistical analysis of the experimental variation of DIGE gels [38]. This usually eliminates the need for reverse DIGE labeling controls during routine proteomic studies. Here, we have used the 2D-DIGE technique to demonstrate its unparalleled capability as a comparative analytical tool for the characterization of animal disease models.
Animal models of human diseases are widely used in the initial identification of novel biomolecules involved in tissue degeneration [39]. In the field of experimental muscle pathology, a large number of animal genocopies are available to study the basic mechanisms of major neuromuscular diseases [40]. Although these genetic disease models are often not perfect phenocopies of a highly complex human etiology, proteomic screening of pathobiochemical changes in their expression profiles can be helpful for the initial identification of new biomarker candidates [41]. In the case of Duchenne muscular dystrophy, a lethal x-linked disorder of childhood that is caused by primary abnormalities in the dmd gene coding for the membrane cytoskeletal protein dystrophin [42], a variety of spontaneous and engineered animal models are available for biomedical studies [43,44]. Mammalian animal phenocopies of dystrophinopathy are highly valuable tools for elucidating the molecular pathogenesis of x-linked muscular dystrophy and developing novel therapeutic strategies [45,46]. Various muscle specimens from the mdx mouse model and the grmd dog have been used in mass spectrometry-based proteomic studies [25,26,27,37,47,48] including the successful evaluation of experimental exon-skipping therapy with novel proteomic biomarkers [49].
Building on the findings from previous proteomic studies of genetic animal models of muscular dystrophy [50] and the fact that aged muscle fibres from the dystrophic mdx mouse closely resemble the human pathology of Duchenne muscular dystrophy [51,52,53,54], we carried out here an optimized proteomic analysis of normal versus mdx tissues using aged mice. Recent proteomic investigations from our laboratories have analyzed young mdx versus senescent mdx muscles and shown a variety of protein changes in the dystrophin-deficient mouse during aging [48,55,56]. Here, we have directly compared dystrophic mdx diaphragm with age-matched normal muscle from senescent mice. In agreement with severe degeneration occurring in the mdx diaphragm, proteomics revealed considerable changes in a variety of proteins in dystrophic diaphragm tissue. Altered proteins are associated with the contractile apparatus, the extracellular matrix, the cellular stress response, metabolite transport and mitochondrial energy metabolism.
Figure 1. Overview of the fluorescence difference in-gel electrophoresis method: Shown are the main approaches used in fluorescence gel-based proteomics, whereby 2-dye or 3-dye difference in-gel electrophoresis (DIGE) is most commonly applied for studying global changes in complex protein populations. In the case of muscular dystrophy research, normal and dystrophic specimens are differentially labeled with CyDyes prior to electrophoresis, then proteins separated based on the unique combination of their isoeletric point and molecular masses and finally image analysis used to evaluate differential expression pattern of fluorescently labeled proteins.
Biology 02 01438 g001

2. Experimental Section

2.1. Chemicals and Materials

For the gel electrophoresis-based proteomic analysis of aged diaphragm muscle, Coomassie Brilliant Blue, CyDye DIGE Fluor minimal dyes Cy3 and Cy5, ampholytes, acetonitrile, cover fluid and immobilised pH gradient (IPG) drystrips pH 3–11 were purchased from Amersham Biosciences/GE Healthcare (Little Chalfont, Buckinghamshire, UK). Acrylamide stock solutions were obtained as ultrapure Protogel from National Diagnostics (Atlanta, GA, USA). Laemmli-type electrophoresis buffer, protein molecular weight ladders and the Bradford reagent for protein quantification were purchased from Biorad Laboratories (Hemel-Hempstead, Hertfordshire, UK). For protein digestion, sequencing grade-modified trypsin was obtained from Promega (Madison, WI, USA). Formic acid and LC-MS Chromasolv water were from Fluka (Milwaukee, WI, USA) and spin filters were purchased from Fisher Scientific (Loughborough, UK). To verify key proteomic findings by immunoblotting, primary antibodies were obtained from Abcam, Cambridge, UK (ab111233 to the cardiovascular heat shock protein cvHSP; ab43176 to ATP synthase; ab6588 to collagen; ab28172 to prohibitin; and ab11427 to parvalbumin), Sigma Chemical Company, Dorset, UK (ab L-9393 to laminin), Santa Cruz Biotechnology, Santa Cruz, CA, USA (ab sc-33701 to β-dystroglycan), Affinity Bioreagents, Golden, CO, USA (mAb VIIID12 to fast calsequestrin) and Enzo Stressgen, Victoria, BC, Canada (ab ADI-SPA-811 to heat shock protein Hsp70/72). All secondary antibodies used were obtained from Chemicon International (Temecula, CA, USA). Protease inhibitors were from Roche Diagnostics (Mannheim, Germany). Ultrapure lysine for quenching the DIGE labelling reaction and all general reagents were obtained from Sigma Chemical Company (Dorset, UK).

2.2. Preparation of Diaphragm Extracts from Aged mdx Mice

Since the diaphragm muscle of the aged mdx mouse is: (i) missing dystrophin isoform Dp427 due to a point mutation [57]; (ii) closely resembles the fibre pathology of Duchenne muscular dystrophy [58]; and (iii) exhibits an accelerated progression of muscle degeneration [51,52,53,54], we have here used 22-month old samples from mdx diaphragm versus wild type diaphragm to study global changes in dystrophinopathy. Skeletal muscle specimens were obtained from the bioresource unit of the University of Bonn [55]. Animals were kept under standard conditions and all procedures were performed in accordance with German guidelines on the use of animals for scientific experiments. Senescent mdx mice and age-matched non-dystrophic mice were sacrificed by cervical dislocation and post-mortem diaphragm tissues quickly removed, quick-frozen in liquid nitrogen and stored at −80 °C prior to usage. For the gel electrophoresis-based proteomic analysis of the mdx diaphragm, total muscle protein extracts from 4 dystrophic and 4 non-dystrophic muscle specimens were individually pulverized by grinding tissue pieces in liquid nitrogen using a mortar and pestle. A volume of 1 mL of lysis buffer, consisting of 2% IPG buffer pH 3–10, 7 M urea, 2 M thiourea, 4% CHAPS and 2% dithiothreitol, was employed to solubilize proteins from 100 mg of ground muscle powder. Importantly, the lysis buffer was supplemented with a freshly prepared protease inhibitor cocktail [37] to prevent excess protein degradation. The suspensions were centrifuged for 15 min at 15,000 × g at 4 °C, following gentle rocking for 60 min, and then the protein concentration determined [48].

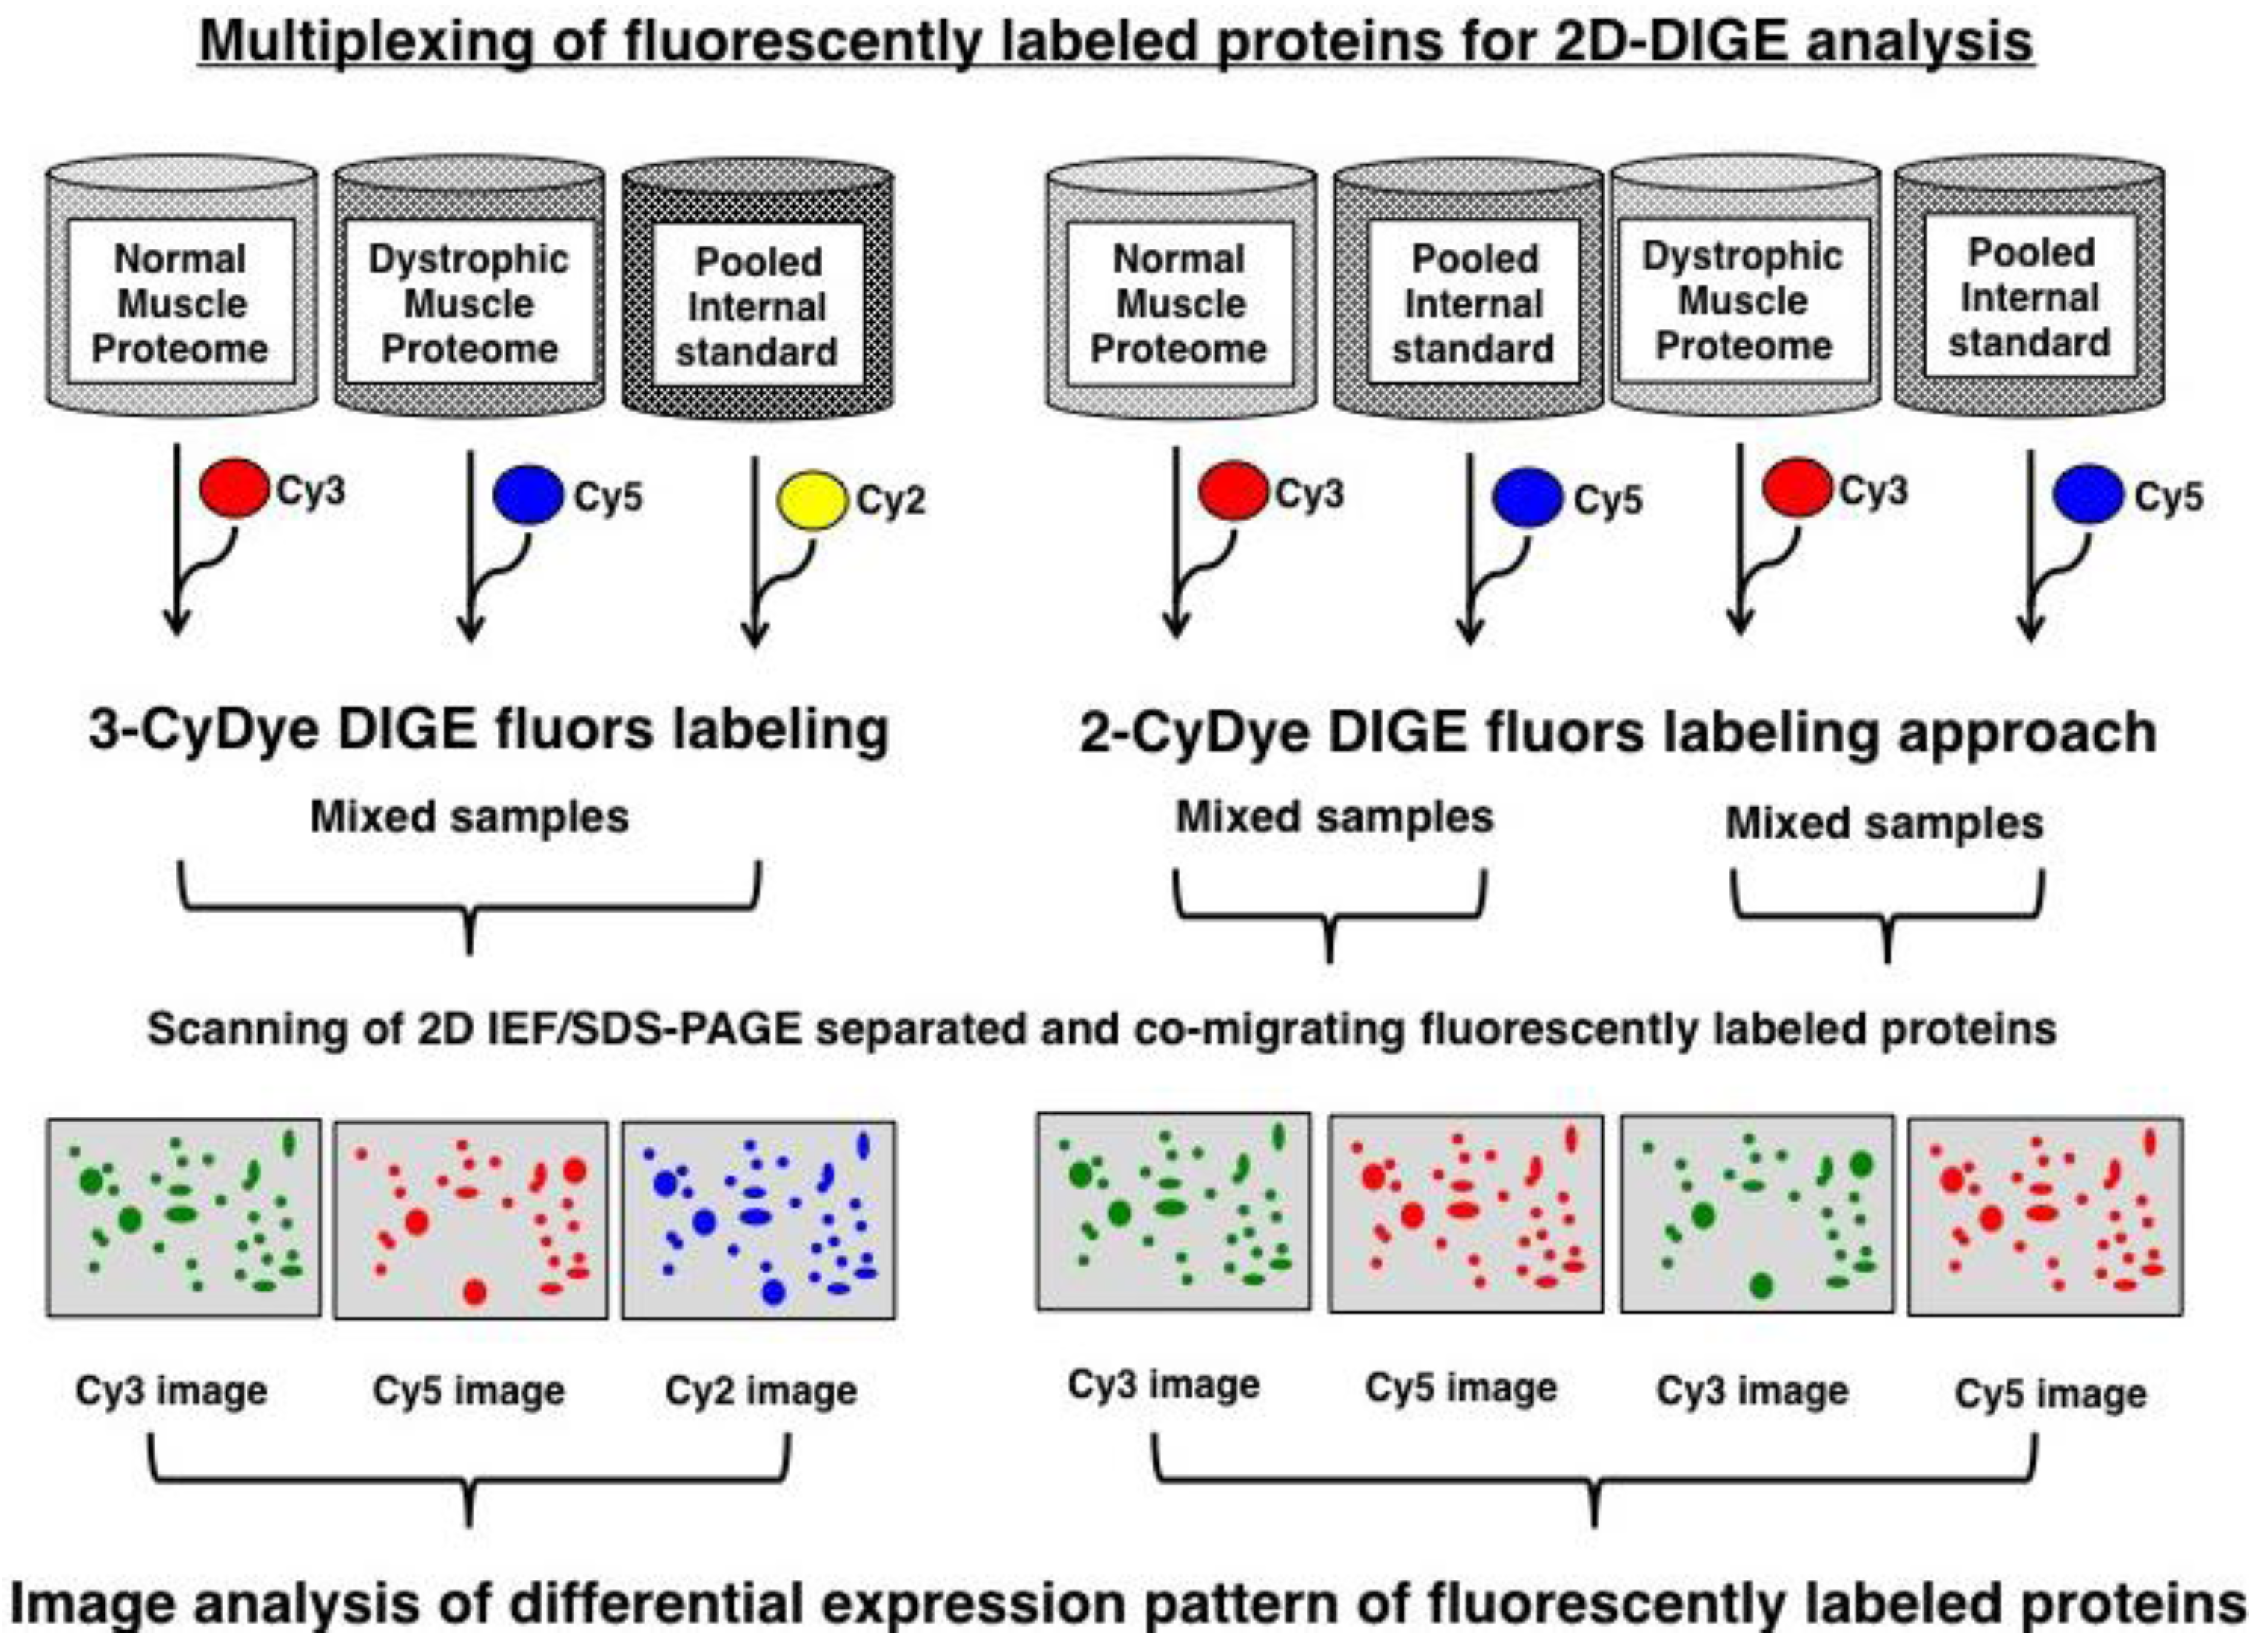
2.3. Fluorescence Two-Dimensional Difference In-Gel Electrophoretic Analysis of the Diaphragm Muscle Proteome

For the pre-electrophoretic labeling of urea-soluble diaphragm muscle proteins, 50 μg protein aliquots from individual samples were fluorescently labelled with Cy3 DIGE Fluor dye [59]. The pooled internal standard was labelled with Cy5 DIGE Fluor dye. Individual samples were mixed with the appropriate amount of dye at pH 8.5, carefully vortexed and then incubated on ice for 30 min in the dark. The reaction was quenched by the addition of 10 mM lysine [60]. Following the incubation of the dye-protein mixture with lysine for 10 min on ice in the dark, fluoresecently labelled protein samples were immediately loaded onto IPG strips for electrophoretic separation in the first dimension. The gel electrophoretic separation of diaphragm proteins was performed with a total amount of 100 μg protein per analytical 2D-DIGE gel. Standardized two-dimensional gel electrophoresis was carried out with isoelectric focusing in the first dimension using 24 cm pH 3–11 strips in a IPGphor system from Amersham Biosciences/GE Healthcare (Little Chalfont, Buckinghamshire, UK) using the following running conditions: 4 h at 80 V, 2 h at 100 V, 1.5 h at 500 V, 1.5 h at 1,000 V, 1 h at 2,000 V, 1 h at 4,000 V, 2 h at 6,000 V and a final 2.5 h step at 8,000 V. IPG strips were then equilibrated twice for 20 min using 6 M urea, 30% glycerol, 2% SDS and 100 mM Tris-HCl, pH 8.8. The first incubation step was carried out in the presence of 100 mM dithiothreitol and the second incubation step using 0.25 M iodoacetamide. Subsequently IPG strips were washed in SDS running buffer (125 mM Tris, 0.96 M glycine, 0.1% (w/v) sodium dodecyl sulfate) and placed on top of 12.5% slab gels and proteins separated in the second dimension with the help of an Amersham EttanDalt-twelve system [59]. Analytical slab gels were run in parallel at 0.5 W/gel for 60 min and then 15 W/gel until the blue dye front had disappeared from the bottom of the gel. A Typhoon Trio variable mode imager was used to visualize electrophoretically separated and DIGE-labelled diaphragm proteins. Protein expression changes between mdx specimens and non-dystrophic specimens were analyzed using Progenesis SameSpots analysis software [61] (Non Linear Dynamics, Newcastle upon Tyne, UK). Individual gels were warped to a single master gel and the following parameters used during analysis: n = 4; p < 0.05; and a power value of >0.8. Diaphragm proteins with a significantly changed concentration in mdx versus normal specimens were picked for tryptic digestion from Coomassie Blue-stained preparative gels [59].

2.4. Mass Spectrometric Identification of Diaphragm Proteins

The unequivocal identification of individual diaphragm proteins, which exhibited a changed abundance in the aged mdx model of Duchennne muscular dystrophy, was carried out with corresponding protein spots from Coomassie-stained pick gels. Spots were excised, washed, destained and then digested with a previously optimized in-gel tryptic digestion protocol [62] and resulting peptide populations evaluated by electrospray ionization LC-MS/MS analysis [63] using a Model 6340 Ion Trap LC/MS apparatus from Agilent Technologies (Santa Clara, CA, USA). Drying of peptide mixtures was carried out by vacuum centrifugation and samples then resuspended in MS-grade distilled water and 0.1% (v/v) formic acid, spun down through spin filters and added to LC-MS vials for mass spectrometric identification. Separation of peptides was performed with a nanoflow Aligent 1200 series system. Peptide mixtures were loaded into the enrichment at a capillary flow rate set to 2 μL/min with a mix of 0.1% (v/v) formic acid and 50% (v/v) acetonitrile and formic acid at a ratio of 19:1. The voltage was set to 2,000 V. Database searches were carried out using Mascot MS/MS Ion search. Criterion for each search was set at (i) species Mus musculus; (ii) two missed cleavages by trypsin; (iii) variable modification: oxidation of methionine; (iv) fixed modification: carboxymethylation of cysteines and (v) mass tolerance of precursor ions ±2 Da and product ions ±1 Da.

2.5. Bioinformatics Analysis of Protein Classes and Potential Protein Interactions

For the determination of clustering of molecular functions and the identification of potential protein interactions of the mass spectrometrically identified proteins with a changed abundance in dystrophic mdx diaphragm muscle, standard bioinformatics software was used. Analyses were performed with the PANTHER ([64]; version 8.1) comprehensive database of protein families for the cataloging of molecular functions [65] and the STRING ([66]; version 9.1) database of known and predicted protein interactions that include direct physical and indirect functional protein associations [67].

2.6. Immunoblot Analysis

For the independent verification of key proteomic hits, the abundance of laminin, β-dystroglycan, collagen, cvHsp, Hsp70, prohibitin, parvalbumin, calsequestrin and ATP synthase was evaluated by immunoblotting of mdx diaphragm samples versus normal muscle samples. One-dimensional gel electrophoresis and immunoblot analysis were carried out by a standard protocol, as previously described in detail [62]. The electrophoretic separation of diaphragm proteins from 22-month old mdx mice and age-matched normal mice was performed with 5%–10% gradient SDS-PAGE gels. Electrophoretic transfer was carried out at 100 V for 70 min using Whatman Protan nitrocellulose sheets and a Transblot Cell from BioRad Laboratories (Hemel Hempstead, Hertfordshire, UK). Blots were blocked for 1 hour with a 5% (w/v) fat-free milk protein solution in phosphate-buffered saline [68]. Following incubation with 1:1,000 diluted primary antibodies for 3 h with gentle agitation at 4 °C, membranes were washed 3 times for 10 min and then re-incubated for 1 h at 4 °C with secondary peroxidase-conjugated antibodies diluted in blocking solution. Finally, blots were washed again and the immuno-decorated protein bands visualized by the enhanced chemiluminescence method. Densitometric scanning and evaluation of immunoblots was performed with a HP PSC-2355 scanner and ImageJ (NIH, Bethesda, MD, USA) and GraphPad Prism (San Diego, CA, USA) software.

3. Results

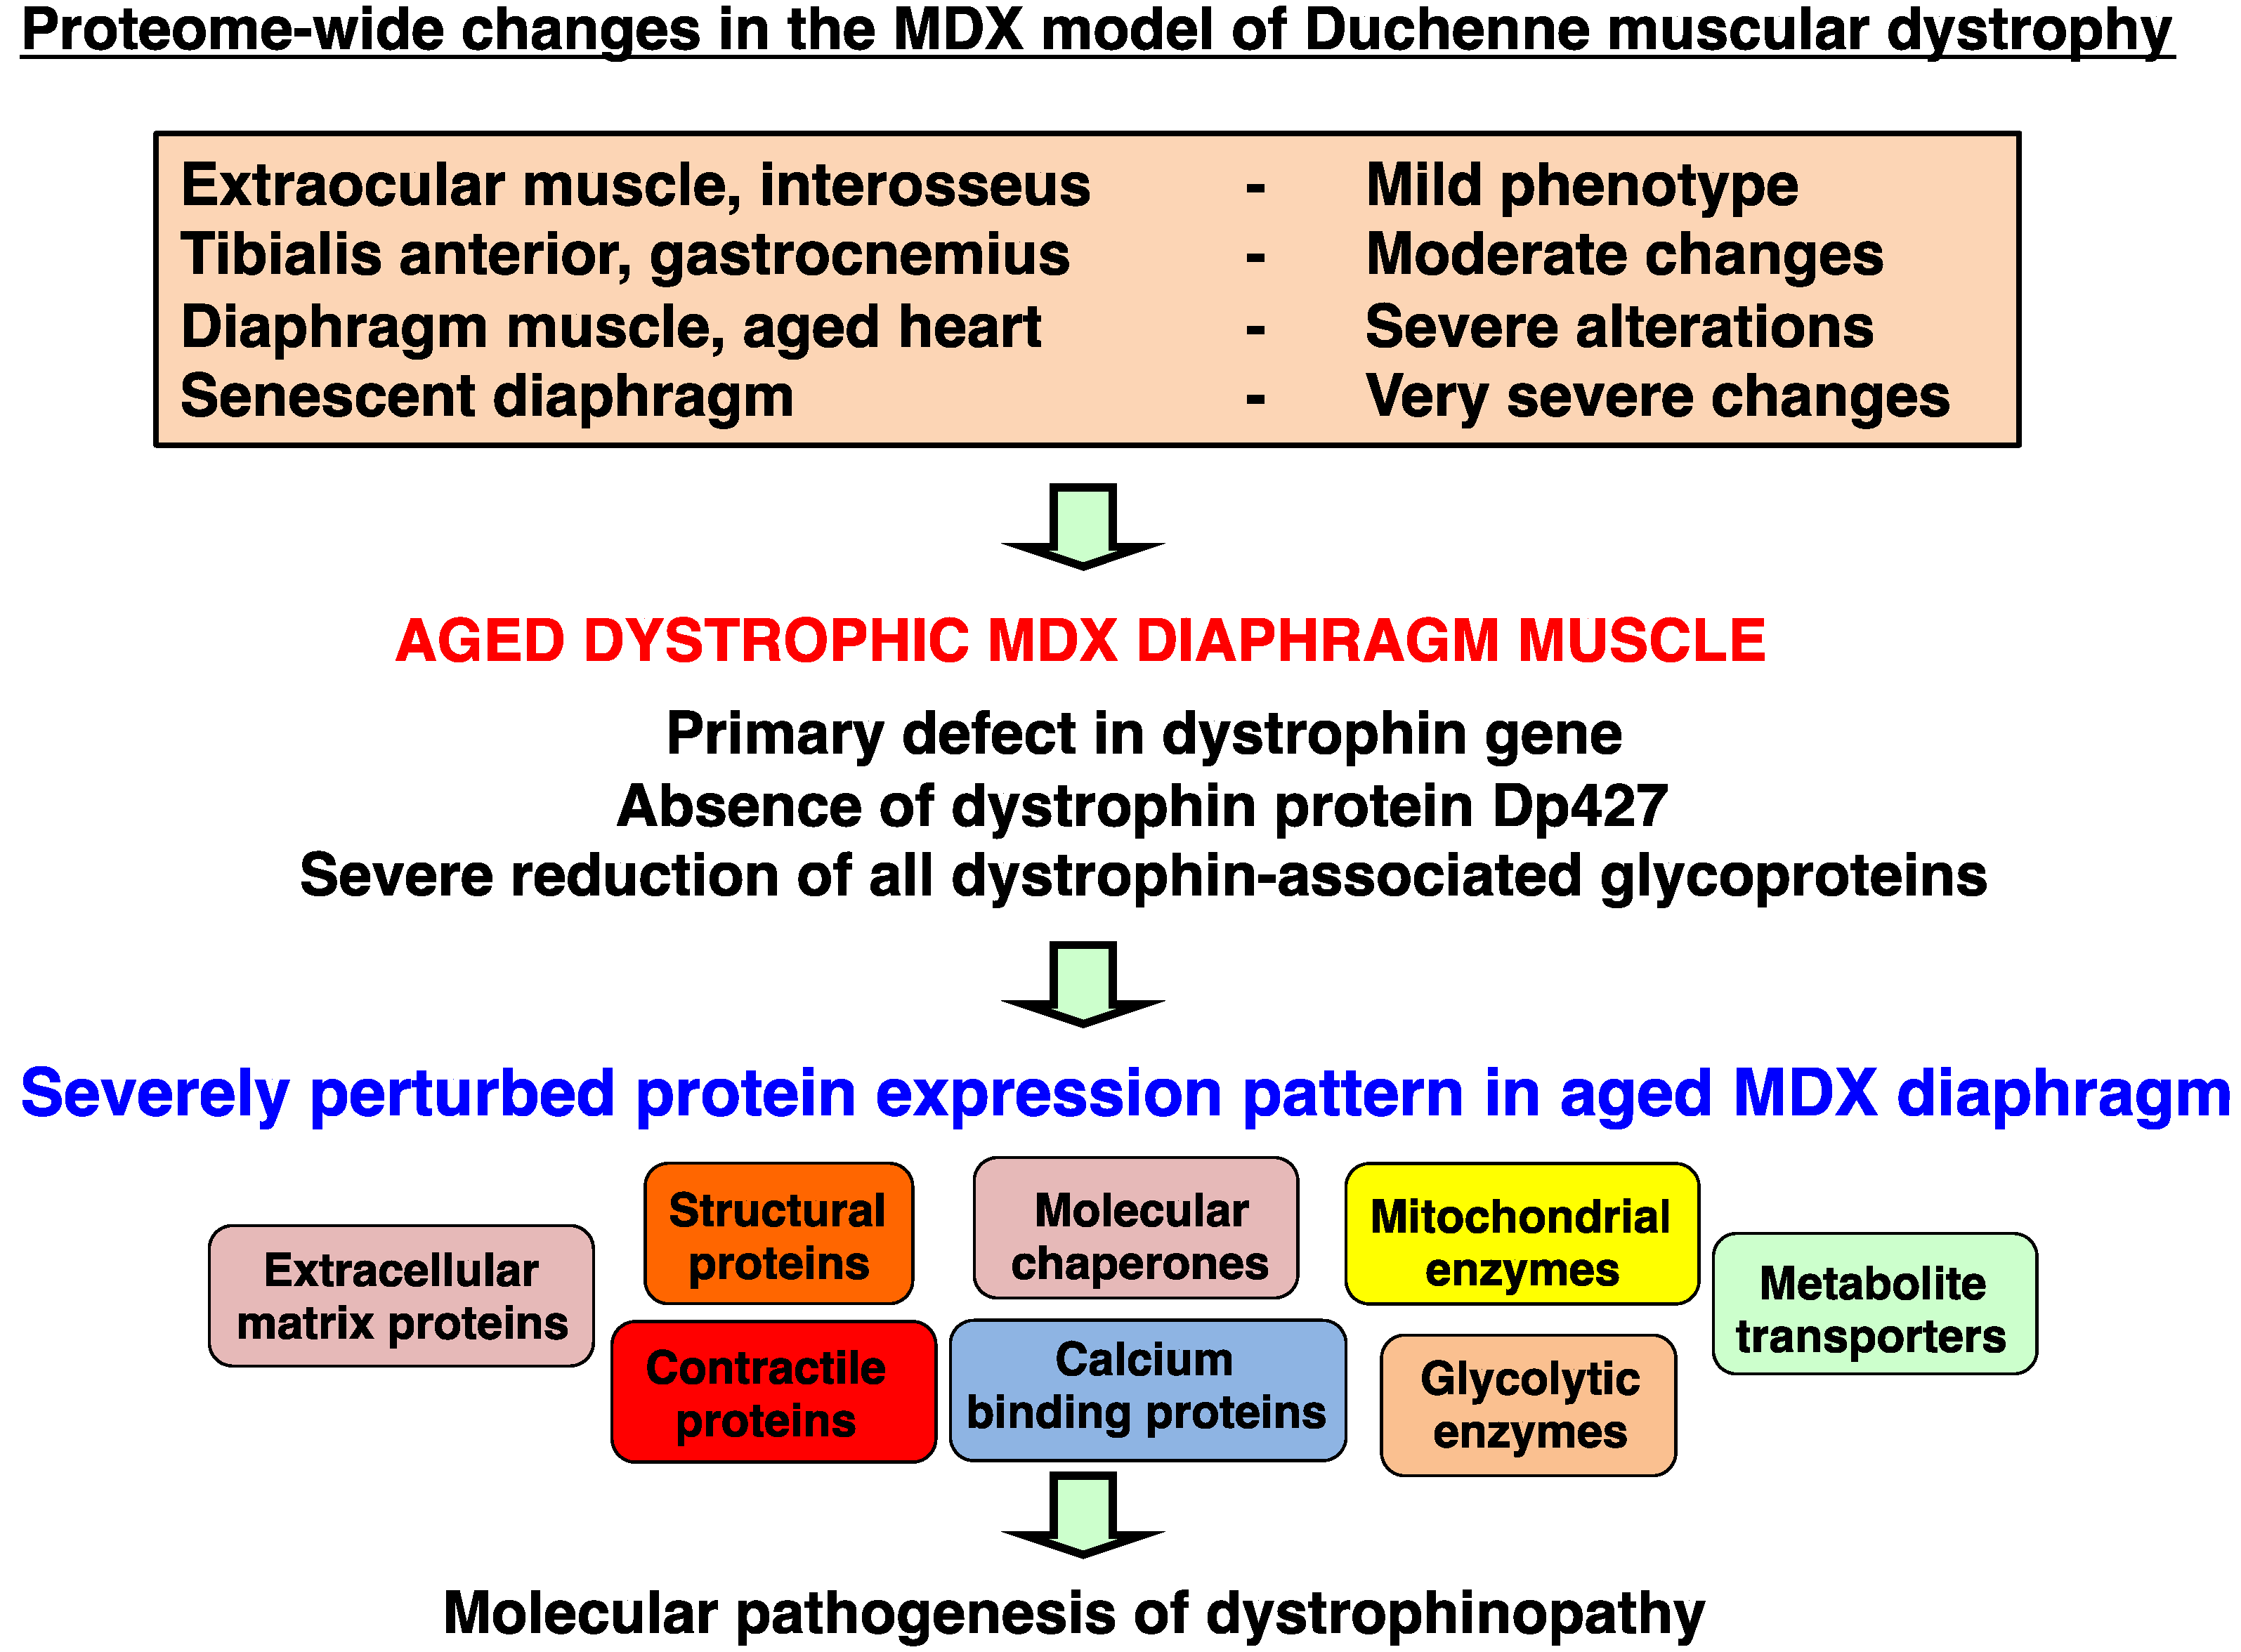
3.1. Overview of Proteomic Surveys of the mdx Animal Model of Duchenne Muscular Dystrophy

The optimization of animal models is a crucial part of biomedical proteomics and proteomic biomarker discovery. In the field of muscular dystrophy research, the mdx mouse is a widely used model system to study the molecular pathogenesis of dystrophinopathy and the suitability of novel experimental therapies to counteract dystrophic symptoms. We have recently reviewed the past usage of mass spectrometry-based proteomics to study the dystrophin-glycoprotein complex and secondary changes in the dystrophic mdx mouse [69]. Figure 2 summarizes the various age groups and types of muscle evaluated by proteomics and also gives an outline of the comparative proteomic approach used in this report. It is important to stress that the majority of muscles in the mdx mouse exhibit moderate symptoms, such as segmental necrosis in hind limb muscles. Certain mdx muscles, such as extraocular fibres or the interosseus muscle are even less necrotic than tibialis anterior, extensor digitorum longus, gastrocnemius or soleus muscles. In contrast, the mdx diaphragm muscle is severely affected by the deficiency in the membrane cytoskeletal protein dystrophin [58], and aging was shown to exacerbate the dystrophic phenotype [55]. Thus, the senescent mdx diaphragm muscle most closely resembles the human pathology. We therefore optimized here the usage of the mdx mouse for animal model proteomics. Using fluorescence difference in-gel electrophoresis, we have created a proteomic reference map of the senescent mdx diaphragm. This represents a highly improved proteomic application within the field of muscular dystrophy research.
Figure 2. Mass spectrometry-based proteomic profiling of the mdx mouse model of Duchenne muscular dystrophy: The upper panel of the figure summarizes the types of muscle and age groups of mdx mice that have been used over the last few years to identify global changes in the dystrophic muscle proteome. All listed proteomic studies have been recently discussed in comprehensive reviews of the proteomics of the dystrophin-glycoprotein complex and dystrophinopathy [50,69]. The lower panel gives an overview of the difference in-gel electrophoretic (DIGE) analysis of the aged mdx diaphragm muscle presented in this report.
Biology 02 01438 g002

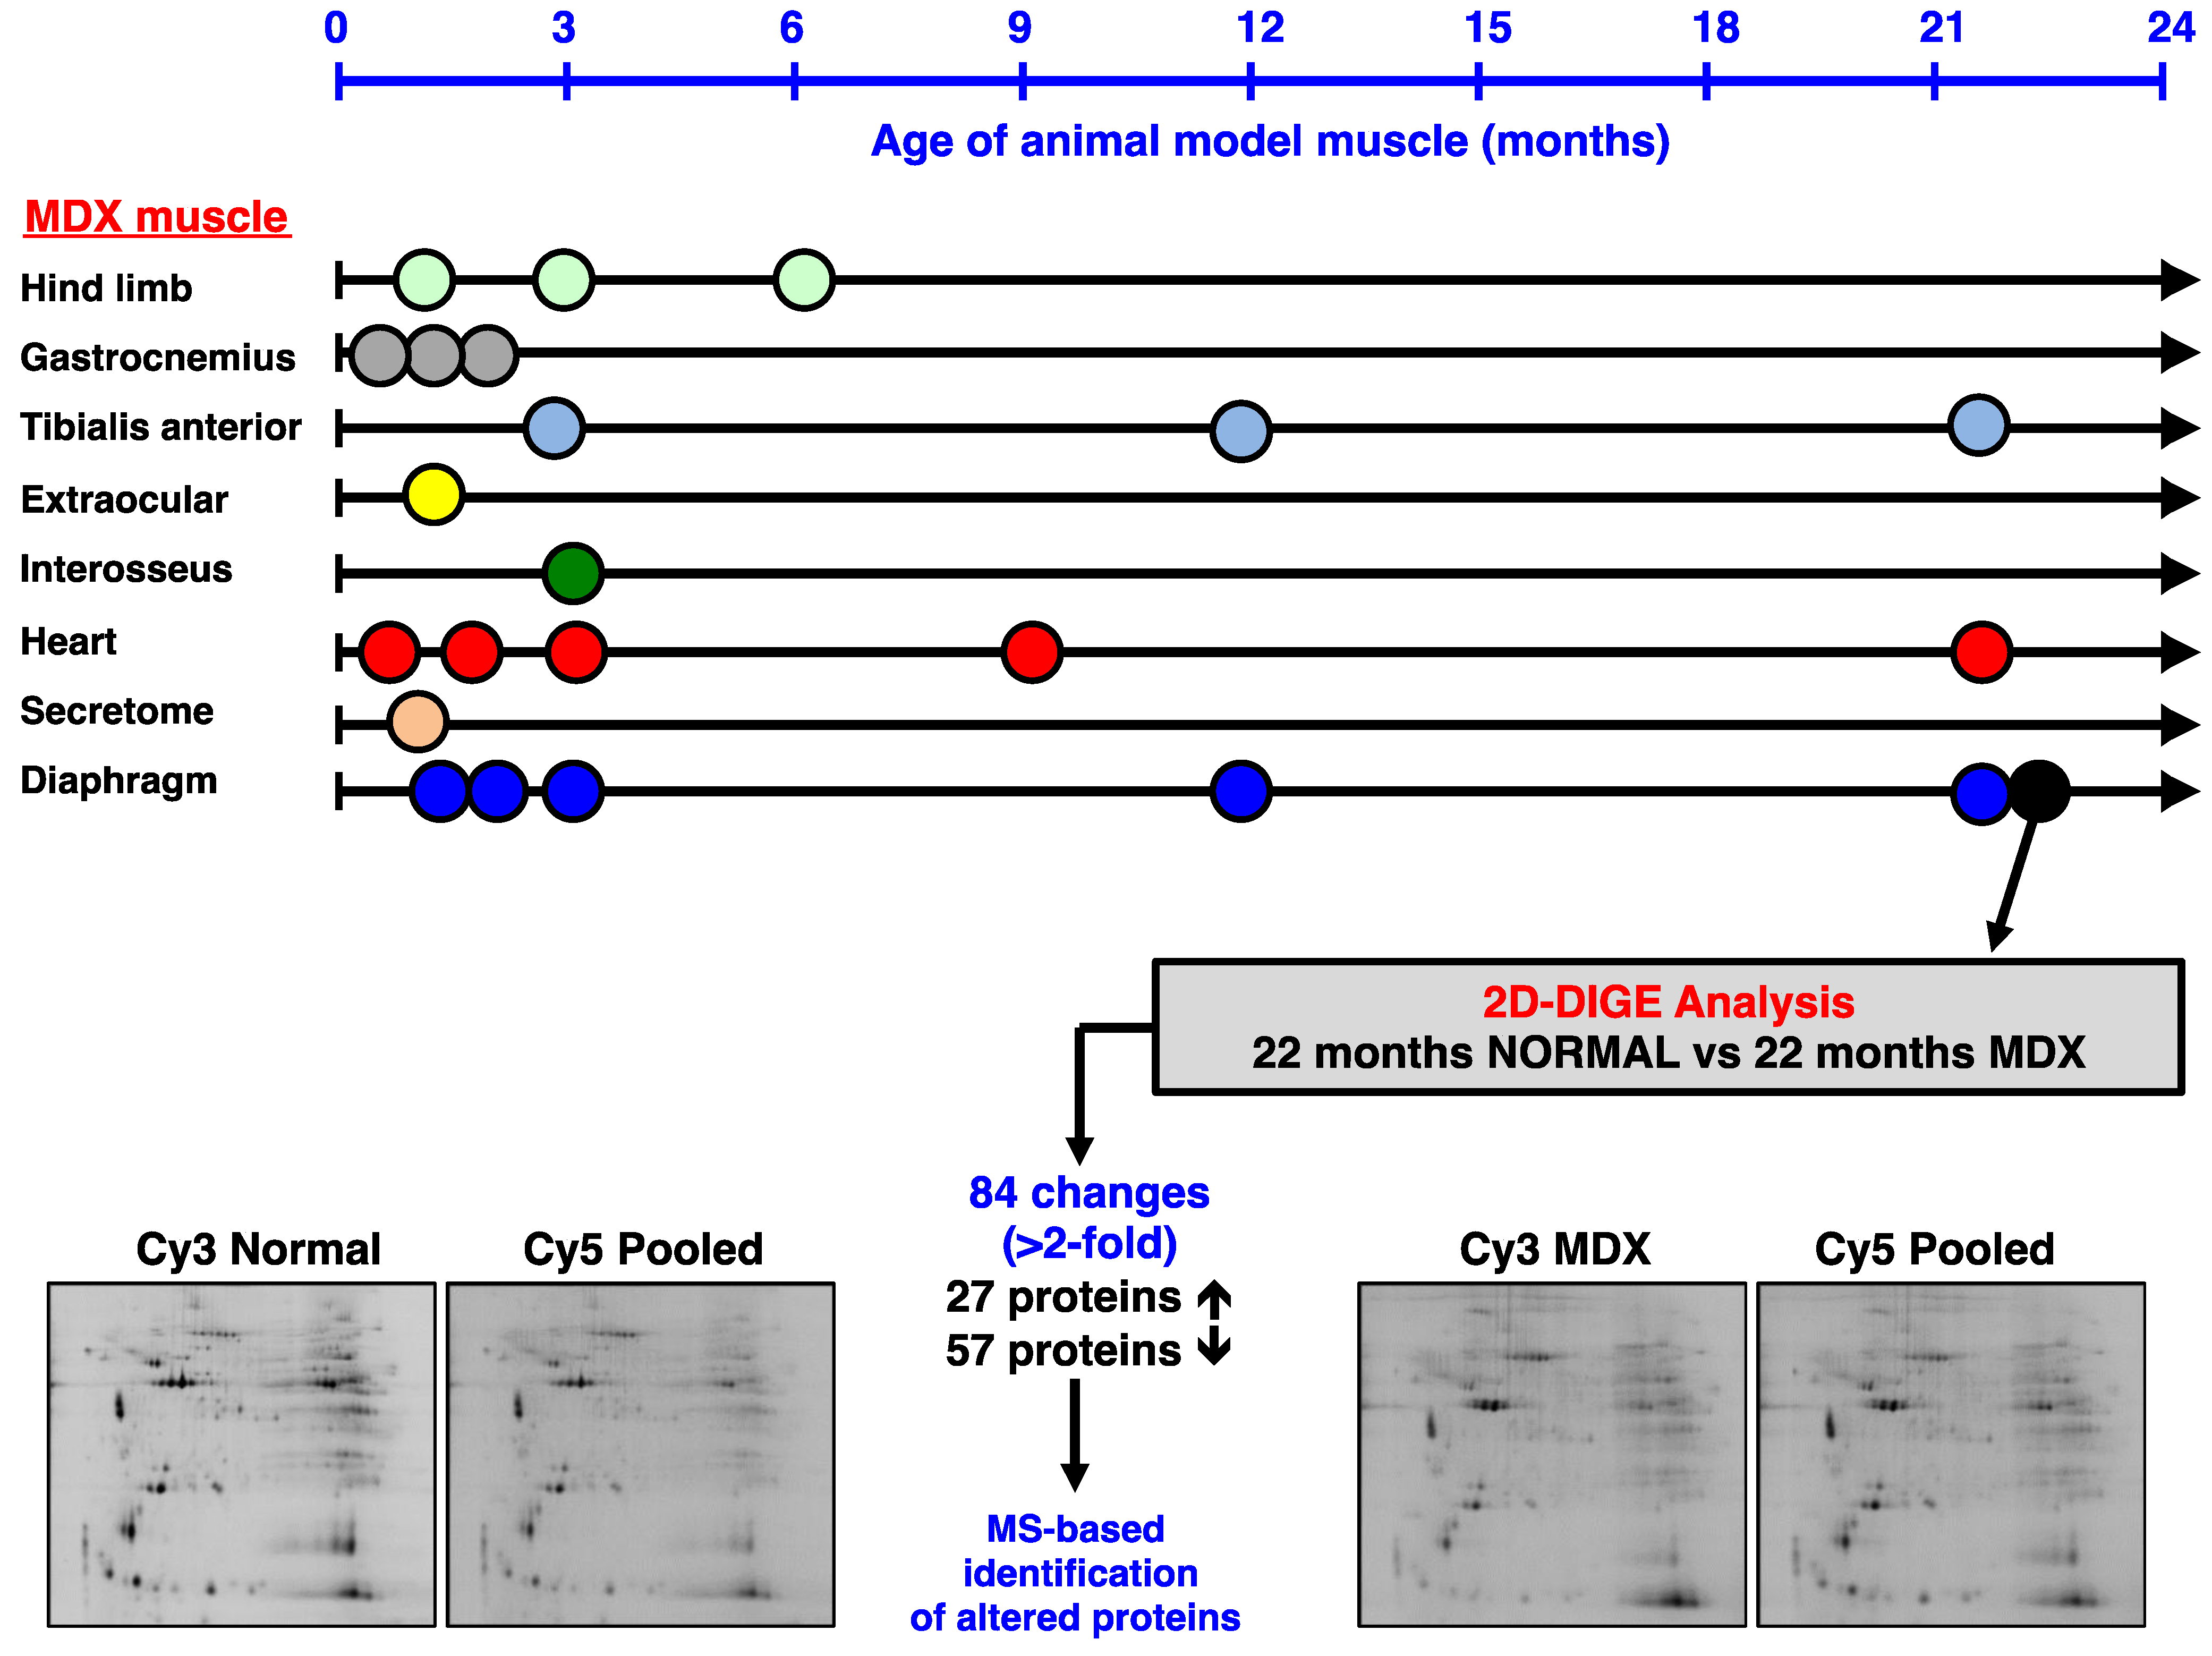
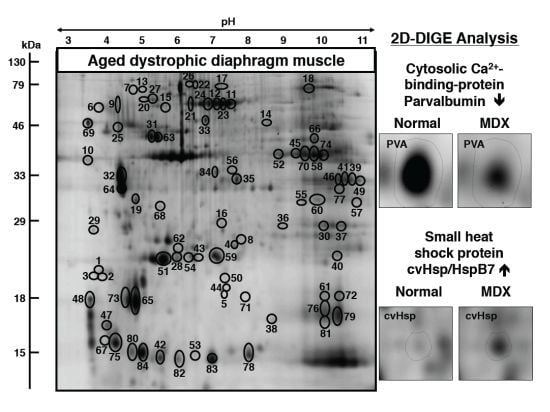
3.2. Fluorescence Two-Dimensional Difference In-Gel Electrophoretic Analysis of the Naturally Aged versus the Aged mdx Diaphragm Muscle

In order to determine the extent of secondary changes in the senescent mdx diaphragm proteome due to deficiency in the membrane cytoskeletal protein dystrophin, the urea-soluble protein repertoire from 22-month old wild type versus age-matched dystrophic diaphragm muscle was investigated. Following fluorescent tagging with the CyDye Cy3 of wild type or mdx samples, as well as fluor labeling of the pooled standard using the CyDye Cy5, a detailed densitometric analysis of two-dimensional gels was performed with a Typhoon Trio variable imager and Progenesis 2D analysis software. Figure 3 gives an overview of this standard image analysis approach used in skeletal muscle proteomics and highlights the opposite changes in the expression of the cytosolic Ca2+-binding protein parvalbumin versus the small heat shock protein HspB7/cvHsp in the dystrophic diaphragm. The proteomic comparison of wild type versus mdx diaphragm muscle identified 84 altered protein species in 22-month old muscle extracts. A 2D-DIGE master gel of the mdx diaphragm muscle is shown in Figure 4. The 2D protein spots with a significant change in abundance are marked by circles and their numbering from 1 to 84 corresponds to the list of identified proteins in Table 1.
Figure 3. Image analysis of fluorescent DIGE gels representing normal versus dystrophic diaphragm muscle: Shown are a 2D-DIGE master gel used for the analysis of aged mdx diaphragm (A), the visualization of the altered expression levels of the cytosolic Ca2+-binding protein parvalbumin (PVA; B, D, E) and the small molecular chaperone cvHsp (C, F, G), the variability of detected alterations between normal and dystrophic samples (H, I) and the graphical presentation of the drastic decrease in parvalbumin (J, K) and the up-regulation of cvHsp (L, M) in dystrophic muscle. In this study, a Typhoon Trio variable mode imager was employed for the visualization of electrophoretically separated and CyDye-labelled diaphragm proteins. Expression changes of proteins between wild type samples and dystrophic mdx samples were determined with the help of Progenesis SameSpots analysis software.
Biology 02 01438 g003
Figure 4. 2D-DIGE master gel of the aged mdx diaphragm muscle: Shown is a 2D master gel that is representative of the findings of the fluorescence two-dimensional difference in-gel electrophoretic analysis of the aged mdx diaphragm. Protein spots with a significant change in expression levels between normal and dystrophic specimens are marked by circles and are numbered 1 to 84. See Table 1 for the mass spectrometric identification of individual diaphragm-associated proteins. The pH-values of the first dimension gel system and molecular mass standards of the second dimension are indicated on the top and on the left of the panels, respectively.
Biology 02 01438 g004

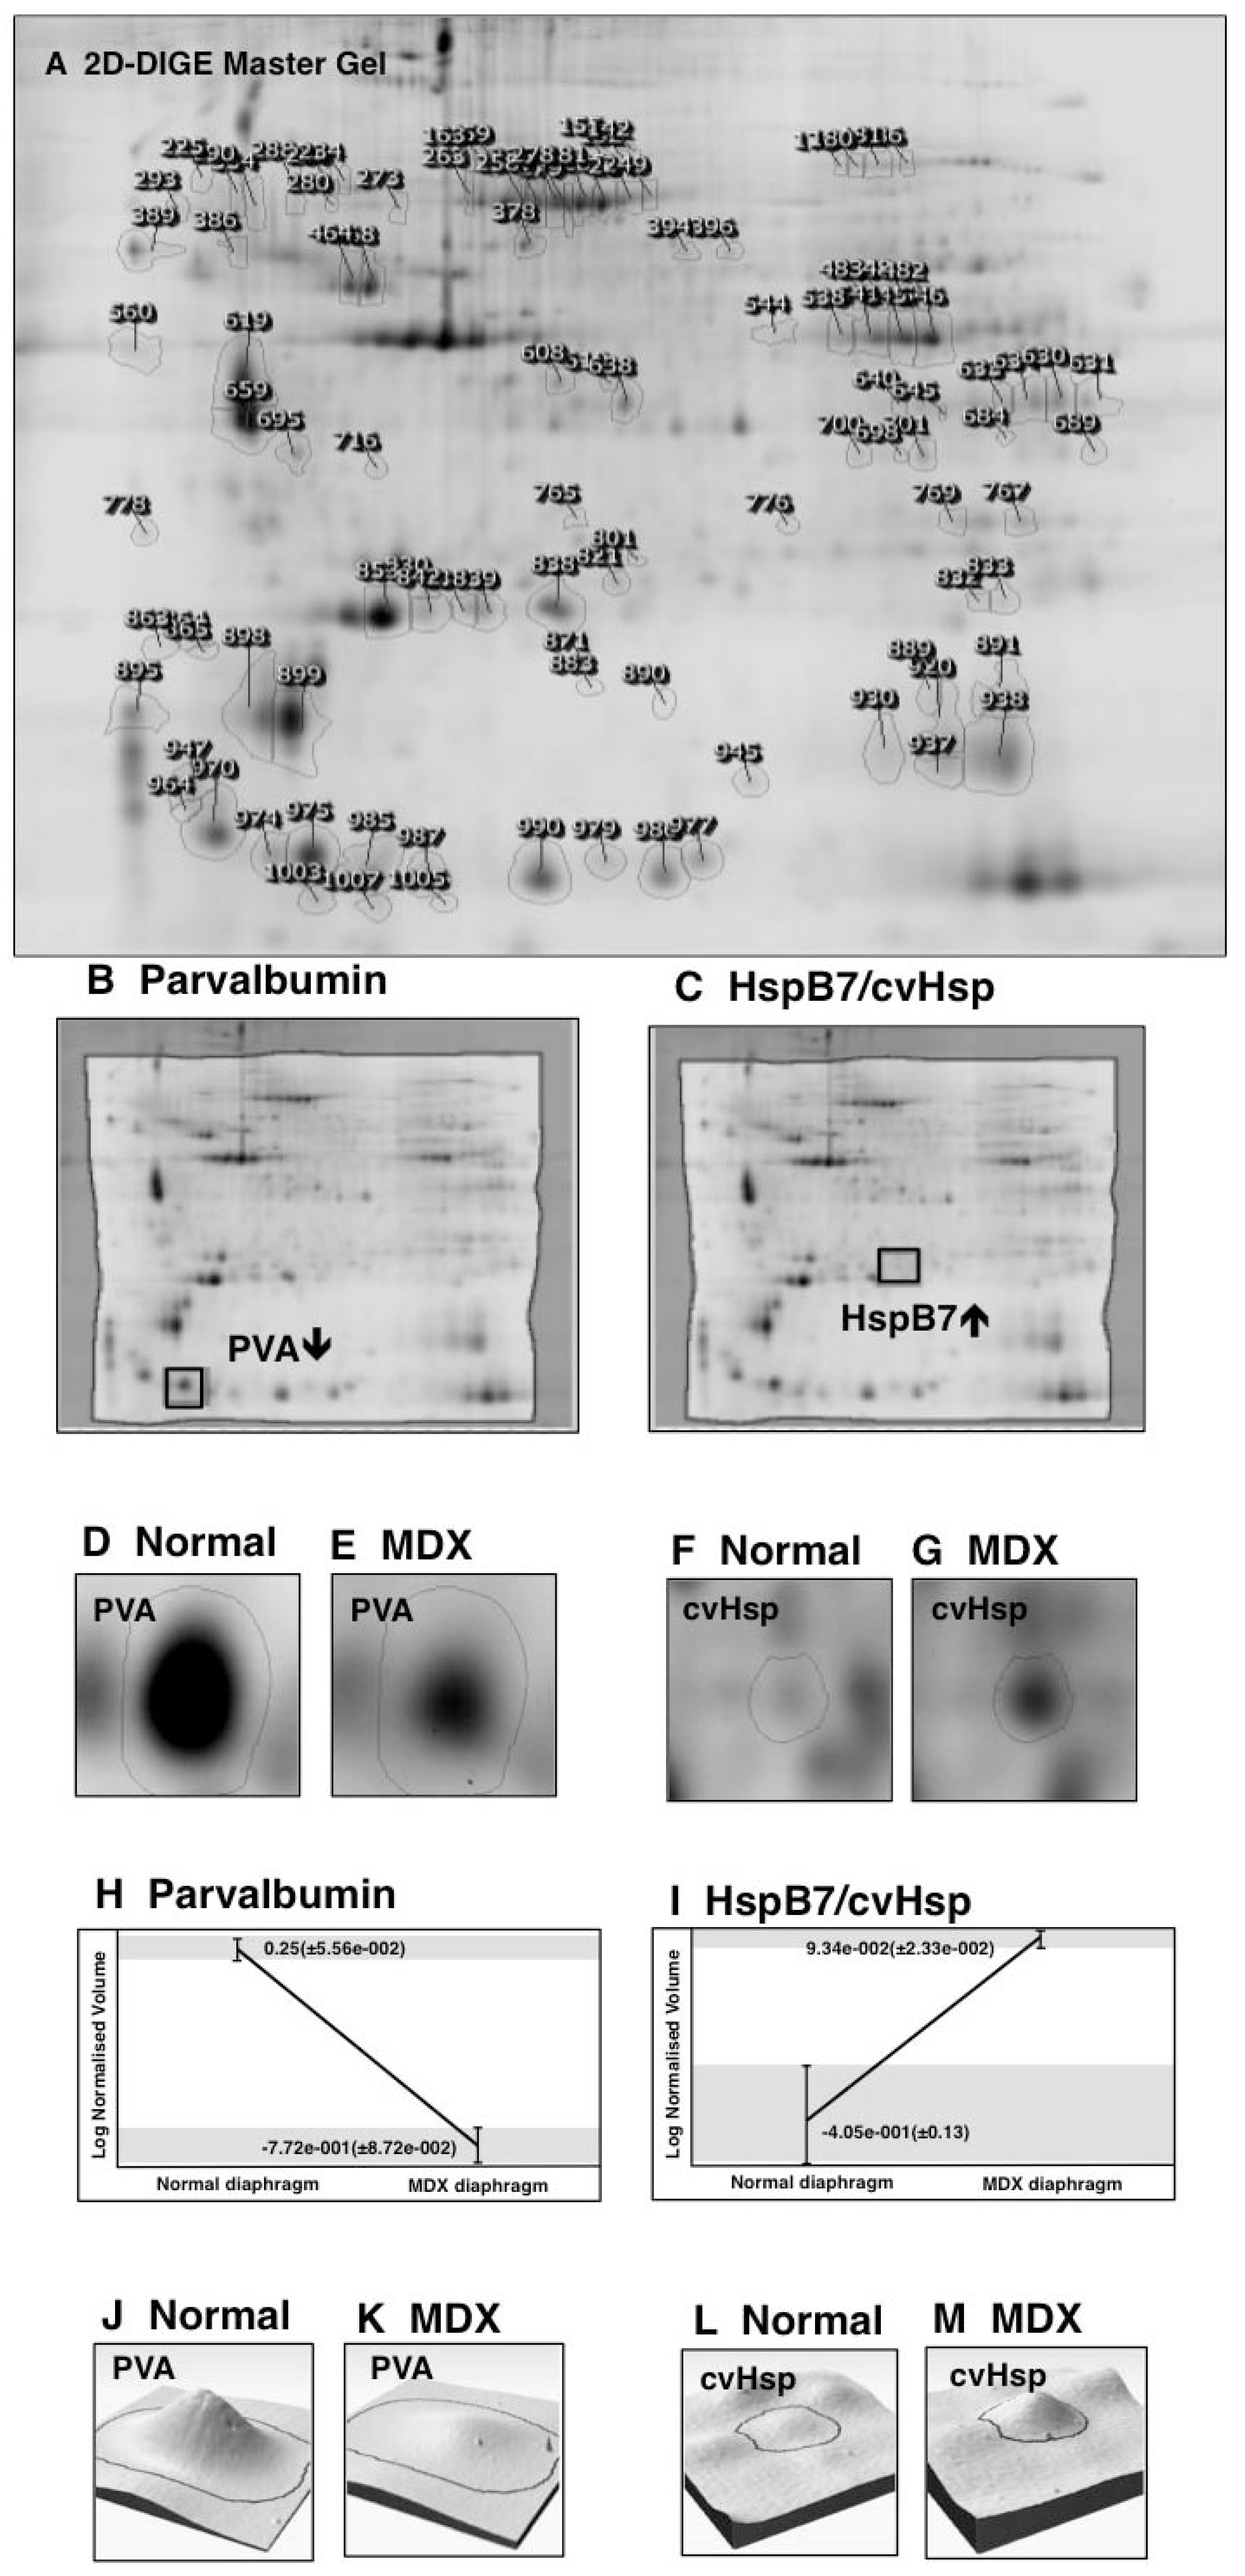
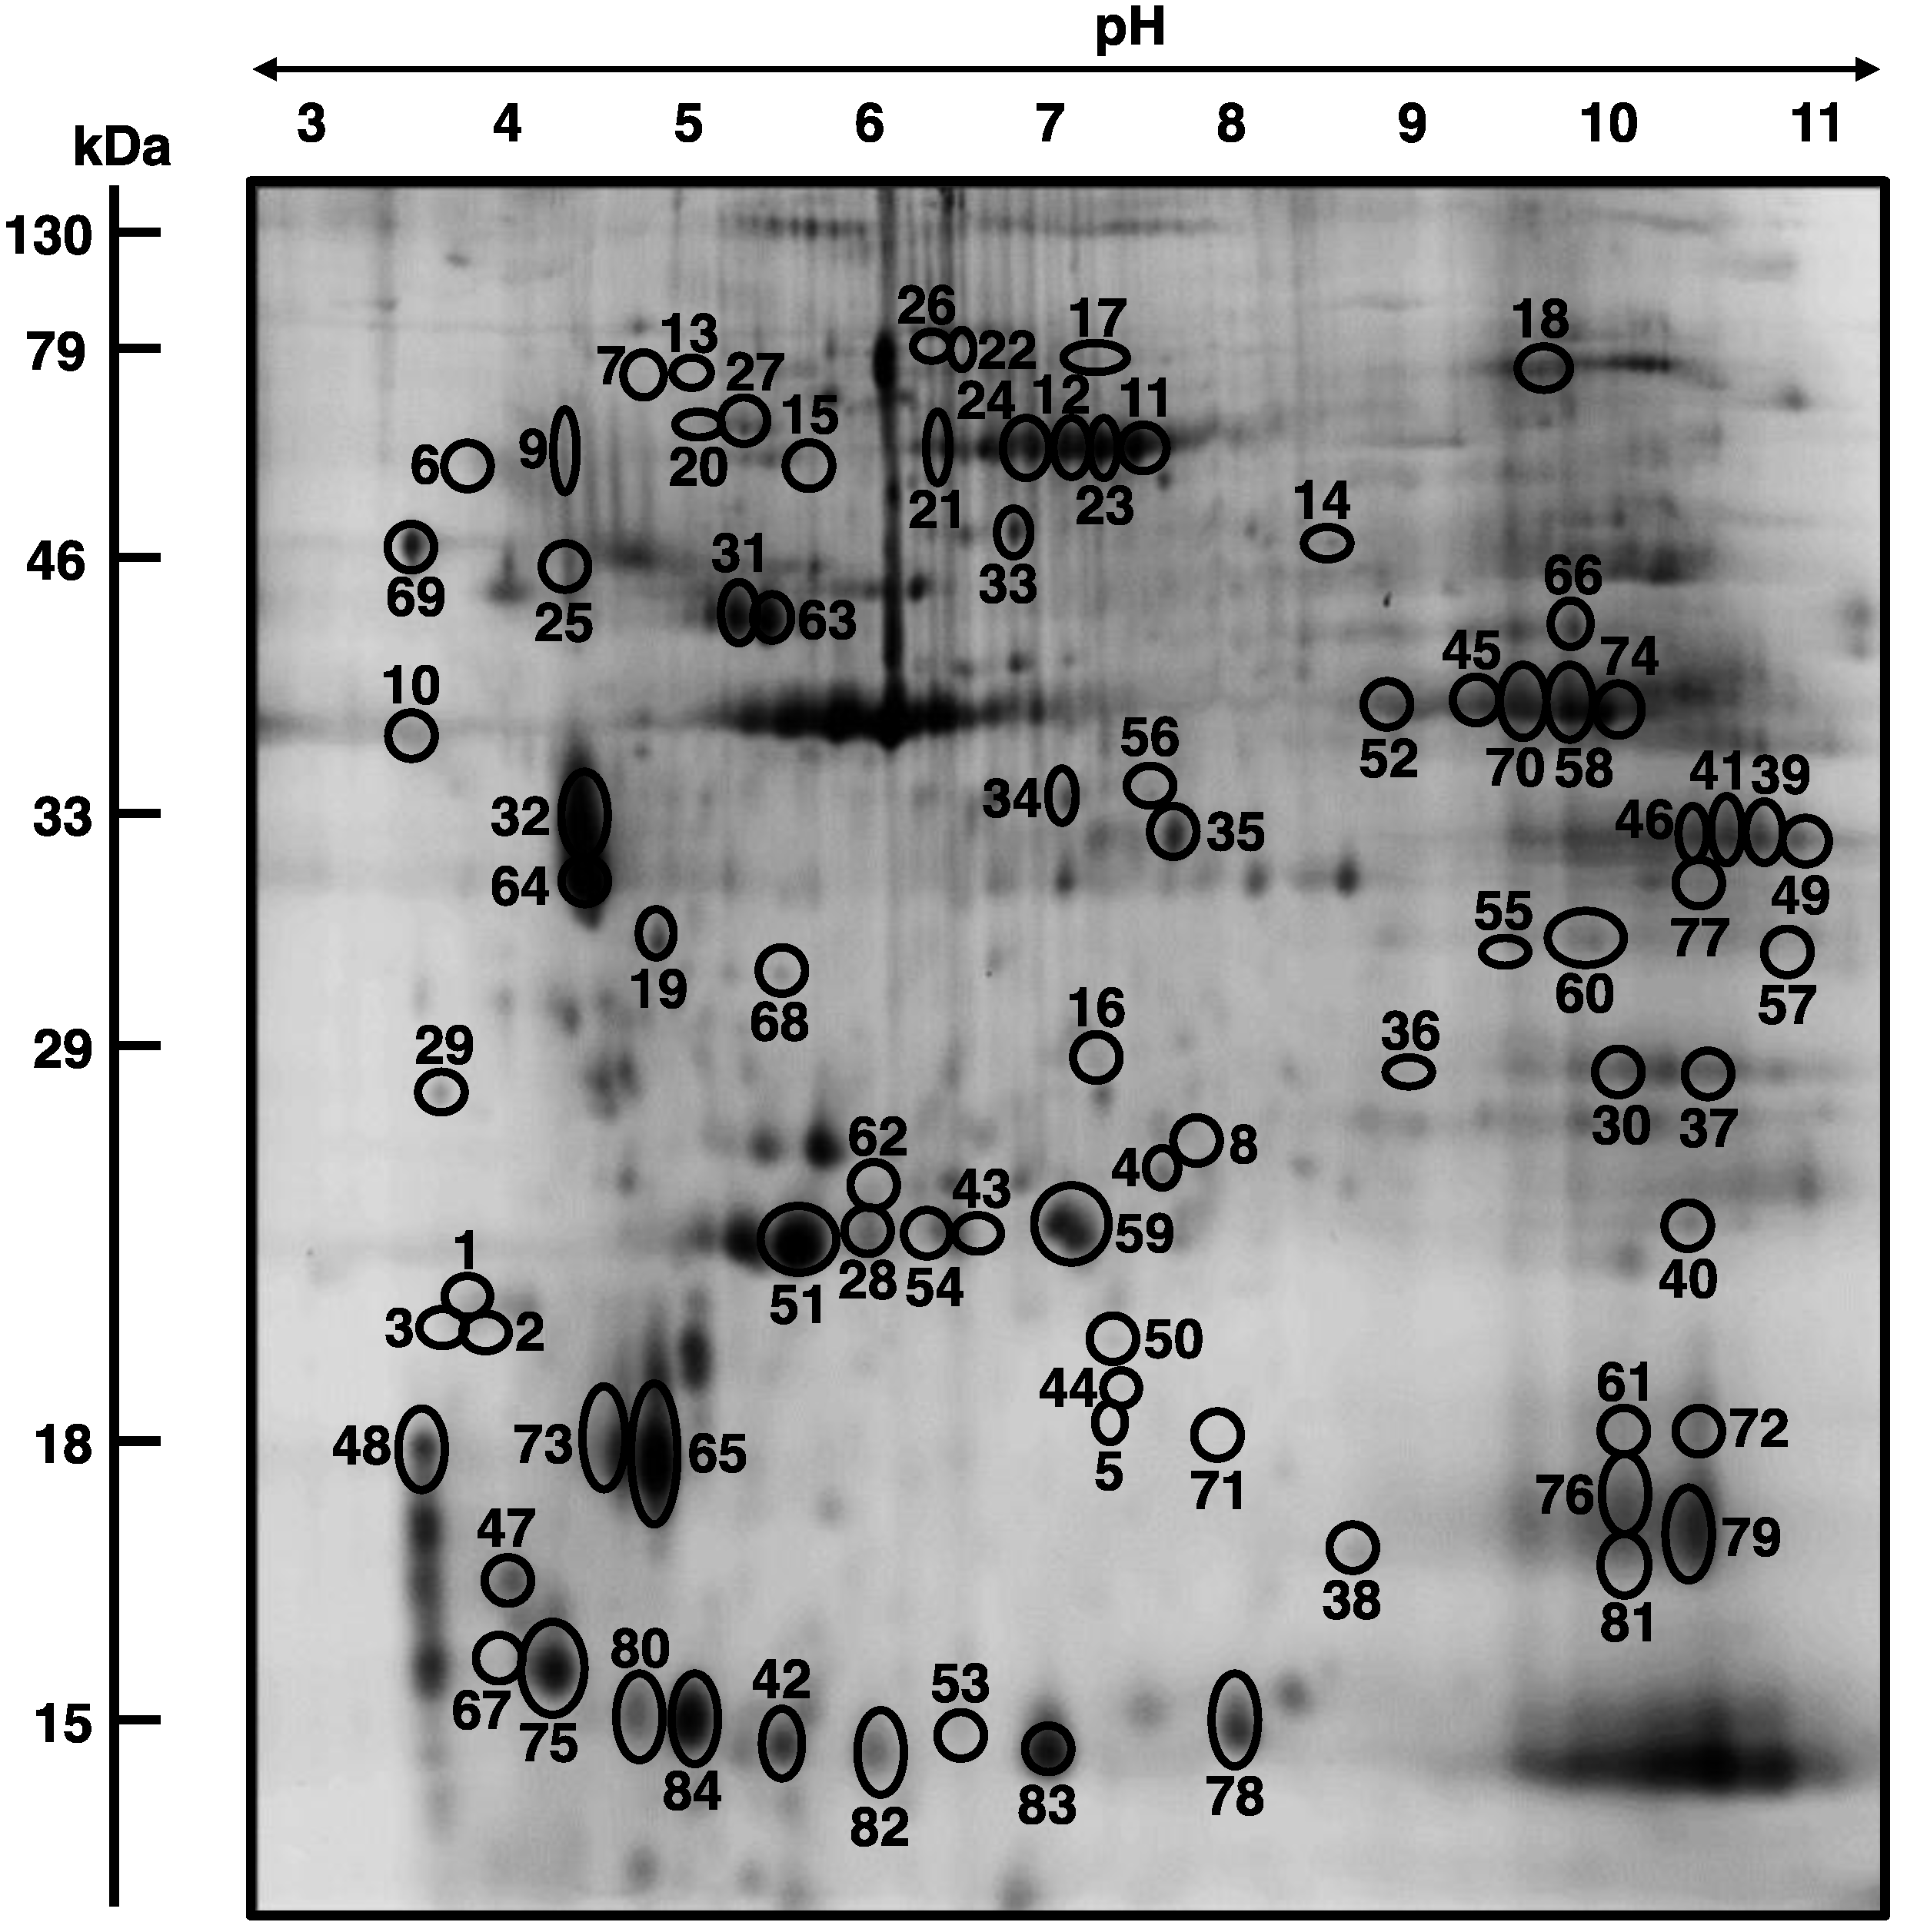
3.3. Mass Spectrometric Identification of Altered Proteins in Aged mdx Diaphragm Muscle

The mass spectrometric identification of the 27 increased and 57 decreased protein species in the dystrophin-deficient and aged diaphragm is listed in Table 1, as well as their accession number, MS/MS score, isoelectric point, molecular mass, number of peptides, percent sequence coverage and fold change. Identified proteins ranged in molecular mass from 11.9 kDa (Parvalbumin) to 87.7 (Nebulin fragment), and isoelectric points ranged from pI 4.07 (Troponin C) to pI 9.19 (Nebulin fragment). Most of the identified muscle-associated proteins belong to the contractile apparatus, the cellular stress response, the extracellular matrix, ion homeostasis and energy metabolism. An increased concentration was shown for dermatopontin (spots 1 to 3), the small heat shock protein HspB7/cvHsp (spot 4), myosin light chain 6B (spot 5), unnamed protein products (spots 7, 17 and 26), beta-actin (spot 10), heat shock protein Hsp70 cognate (spots 11, 21 and 22), mitochondrial stress-70 protein (spots 12 and 24), smooth muscle gamma-actin (spot 13), a fragment of nebulin (spot 14), lumican (spot 15), prohibitin (spot 16), transferrin (spot 18), annexin A5 (spot 19), heat shock protein 8 (spot 23), Fmod protein (spot 25) and 78 kDa glucose-regulated protein (spot 27).
Table 1. List of identified proteins that exhibit a drastic change in abundance in the aged mdx diaphragm as revealed by 2D-DIGE analyses.
Spot No.Protein NameAccession No.MS/MS ScorepIDaNumber of peptidesCoverage (%)Fold change
1DermatopontinNP_062733734.724,5595285.9
2DermatopontinNP_0627331114.724,5597374.4
3DermatopontinNP_0627331004.724,5596263.4
4Heat shock protein HspB7 (beta7, cvHsp)NP_038896875.9518,6815383.3
5Myosin light chain 6B NP_7584631815.4122,85114743.1
6Tropomyosin, beta chain isoform 1NP_0334423194.6632,93322612.9
7Unnamed protein productBAE358182865.7870,77615302.8
8Myosin light chain 1/3, isoform 1f, muscleNP_067260974.9820,6972122.7
9Tropomyosin, beta chain isoform 1NP_0334421074.6632,93311352.7
10Actin, beta (aa 27–375)CAA273961245.7839,4519212.6
11Heat shock protein Hsp70 cognateAAA378691105.3771,02511232.6
12Mitochondrial stress-70 protein BAA04493575.9173,773112.6
13Actin, gamma, smooth muscle AAC52237815.3643,2585162.6
14Nebulin (fragment)AAF59979539.1987,694472.5
15Lumican AAB353611035.8438,733252.4
16Prohibitin NP_0328573505.5729,86015692.4
17Unnamed protein productBAC341451295.7570,7668142.4
18TransferrinAAL345331686.9278,83219242.3
19Annexin A5NP_0338032494.8335,78816452.3
20Alpha-fetoproteinAAA371901125.4748,819262.2
21Heat shock protein Hsp70 cognate AAA378691105.3771,02511232.2
22Heat shock protein Hsp70 cognate AAA37869775.3771,025462.2
23Heat shock protein 8AAH661911105.2871,06011232.2
24Mitochondrial stress-70 protein BAA04493715.9173,773592.1
25Fmod proteinAAH52673925.5646,637242.1
26Unnamed protein product BAC341452545.7570,7668172.1
2778 kDa glucose-regulated protein BAA114621125.0972,5287152.0
28Myosin light chain 1/3, isoform 1f, muscleNP_0672602224.9820,6971563−2.0
29Parvalbumin, alpha NP_0386731565.0211,923657−2.0
30Malate dehydrogenase AAA39509908.9336,052311−2.1
31ATP synthase, beta-subunitAAB86421985.1456,34424−2.1
32Tropomyosin, beta chaingi|118752031804.6632,9331132−2.1
33Alpha-fetoproteinAAA37190955.4748,81925−2.1
34Isocitrate dehydrogenase subunit alphaNP_0838492426.2740,077620−2.1
35L-lactate dehydrogenase B chain NP_032518545.736,839512−2.1
36Actin, alpha, cardiacgi|387090515.2342,04827−2.1
37Coiled-coil-helix-coiled-coil-helix domain-containing protein 3, mitochondrialNP_079612808.5626,550524−2.1
38Cu/Zn superoxide dismutase1513495A1476.0315,926541−2.1
39Malate dehydrogenase mitochondrial NP_0326432568.9336,0531245−2.1
40Peroxiredoxin Prdx1NP_035164978.2622,3941147−2.1
41Malate dehydrogenase mitochondrialNP_0326433438.9336,0531556−2.1
42Cytochrome c oxidase, subunit VaCAA340851256.0816,252848−2.2
43ATP synthase, mitochondrial F0 complexAAH165471485.5218,810547−2.2
44Heat shock protein Hsp beta-6NP_0010124011305.6417,568651−2.2
45Creatine kinase, M-typeNP_0317362766.5843,250927−2.2
46Malate dehydrogenasemitochondrialNP_0326432438.9336,053936−2.2
47Troponin C, skeletal muscleNP_0334202384.0718,156328−2.2
48Troponin C, skeletal muscleNP_0334207744.0718,156853−2.3
49Malate dehydrogenase 2, mitochondrialABD772833657.732,121728−2.3
50MyoglobinNP_038621617.0717,11719−2.3
51Myosin light chain 1/3, isoform 1f, muscleNP_067260934.9820,697417−2.3
52Creatine kinase, M-typeNP_0317362976.5843,2501028−2.3
53Fatty acid-binding protein FABP3NP_0343041576.1114,810648−2.3
54Calcium-binding protein NCS-1-likeXP_003945963486.4912,957117−2.4
55Electron transferring flavoprotein, alphaAAH034324498.6235,3661144−2.4
56Isocitrate dehydrogenase subunit alphaNP_0838491676.2740,077619−2.4
57Malate dehydrogenase 2, mitochondrialABD77283857.732,12128−2.4
58Creatine kinase, M-typeNP_0317364046.5843,2501133−2.4
59ATP synthase, subunit d, mitochondrialNP_0821381685.5218,7961170−2.4
60Electron transfer flavoprotein, subunit alphaNP_6635901958.6235,336839−2.5
61Cofilin-2NP_0317141587.6618,814536−2.5
62Adenylate kinase, isoenzyme AK1NP_0674901045.723,334636−2.5
63ATP synthase, beta-subunitAAB864213015.1456,344616−2.6
64Tropomyosin, beta chaingi|118752031294.6632,9201025−2.6
65Myosin light chain MLC2, skeletal muscleNP_058034934.8219,05928−2.7
66Fumarate hydratase 1AAH060481739.1254,568617−2.8
67Myosin light chain 1/3, isoform 1f, muscleNP_0672602014.9820,6971153−2.9
68Ubiquinone biosynthesis protein COQ9NP_0807281505.635,235521−3.0
69Calsequestrin, skeletal muscleAAC636161433.9345,619822−3.1
70Creatine kinase, M-typeNP_0317365056.5843,2501031−3.1
71MyoglobinNP_0386211247.0717,117648−3.1
72MyoglobinNP_038621597.0717,117111−3.2
73Myosin light chain MLC2, skeletal muscleNP_0580342674.8219,0591568−3.4
74Creatine kinase, M-typeNP_0317362666.5843,2501131−3.5
75Myosin light chain 1/3, isoform 1f, muscleNP_067260874.9820,697212−3.6
76MyoglobinNP_038621917.0717,117221−3.7
77Malate dehydrogenase AAA395091268.9336,052520−3.7
78Fatty acid-binding protein FABP3NP_0343044266.1114,8101177−3.7
79MyoglobinNP_0386211297.0717,117646−4.0
80Parvalbumin, alpha NP_0386732855.0211,923657−4.0
81MyoglobinNP_038621897.0717,117641−4.3
82Fatty acid-binding protein FABP3NP_0343041886.1114,810763−5.3
83Fatty acid-binding protein FABP3NP_0343045326.1114,810971−5.3
84Parvalbumin alpha NP_0386734315.0211,923857−10.5
In contrast, a decreased concentration was established for parvalbumin (spots 29, 80 and 84), various isoforms of malate dehydrogenase (spots 30, 39, 41, 46, 49, 57 and 77), ATP synthase (spots 31, 43, 59 and 63), isocitrate dehydrogenase (spot 35), actin (spot 36), mitochondrial coiled-coil-helix-coiled-coil-helix domain-containing protein 3 (spot 37), Cu/Zn superoxide dismutase (spot 38), peroxiredoxin (spot 40), cytochrome c oxidase (spot 42), heat shock protein Hsp beta-6 (spot 44), creatine kinase (spots 45, 52 and 74), troponin C (spots 47 and 48), myoglobin (spots 50, 71, 72, 76, 79 and 81), fatty acid-binding protein FABP3 (spots 53, 78, 82 and 83), calcium-binding protein NCS-1 (spot 54), electron transferring flavoprotein (spots 55 and 60), isocitrate dehydrogenase (spot 56), cofilin (spot 61), adenylate kinase AK1 (spot 62), myosin light chain MLC2 (spots 65 and 73), fumarate hydratase (spot 66), ubiquinone biosynthesis protein COQ9 (spot 68) and calsequestrin (spot 69).
Proteins with differential expression patterns were identified as myosin light chain 1/3, alpha-fetoprotein and the beta chain of tropomyosin. Individual 2D protein spots representing the muscle isoform 1f of myosin light chain 1/3 were shown to be both increased (spot 8) and decreased (spots 28, 51, 67 and 75). In the case of the beta chain of tropomyosin, both increased (spots 6 and 9) and decreased (spots 32 and 64) concentrations of individual isoforms were determined. The alpha-fetoprotein exhibited increased (spot 20), and decreased (spot 33) levels. Although spots 12, 50, 54 and 72 were only recognized by 1 peptide, they were included in Table 1 based on their MS/MS scores of 57, 61, 48 and 59, respectively. All other proteins were identified by at least 2 peptides. 2D protein spots with a molecular mass and/or isoelectric point that differ substantially from the biochemical properties of its identified protein are probably due to streaking effects based on cross-contamination with abundant proteins, extensive post-translational modifications, proteolytic fragmentation or non-specific protein clustering.

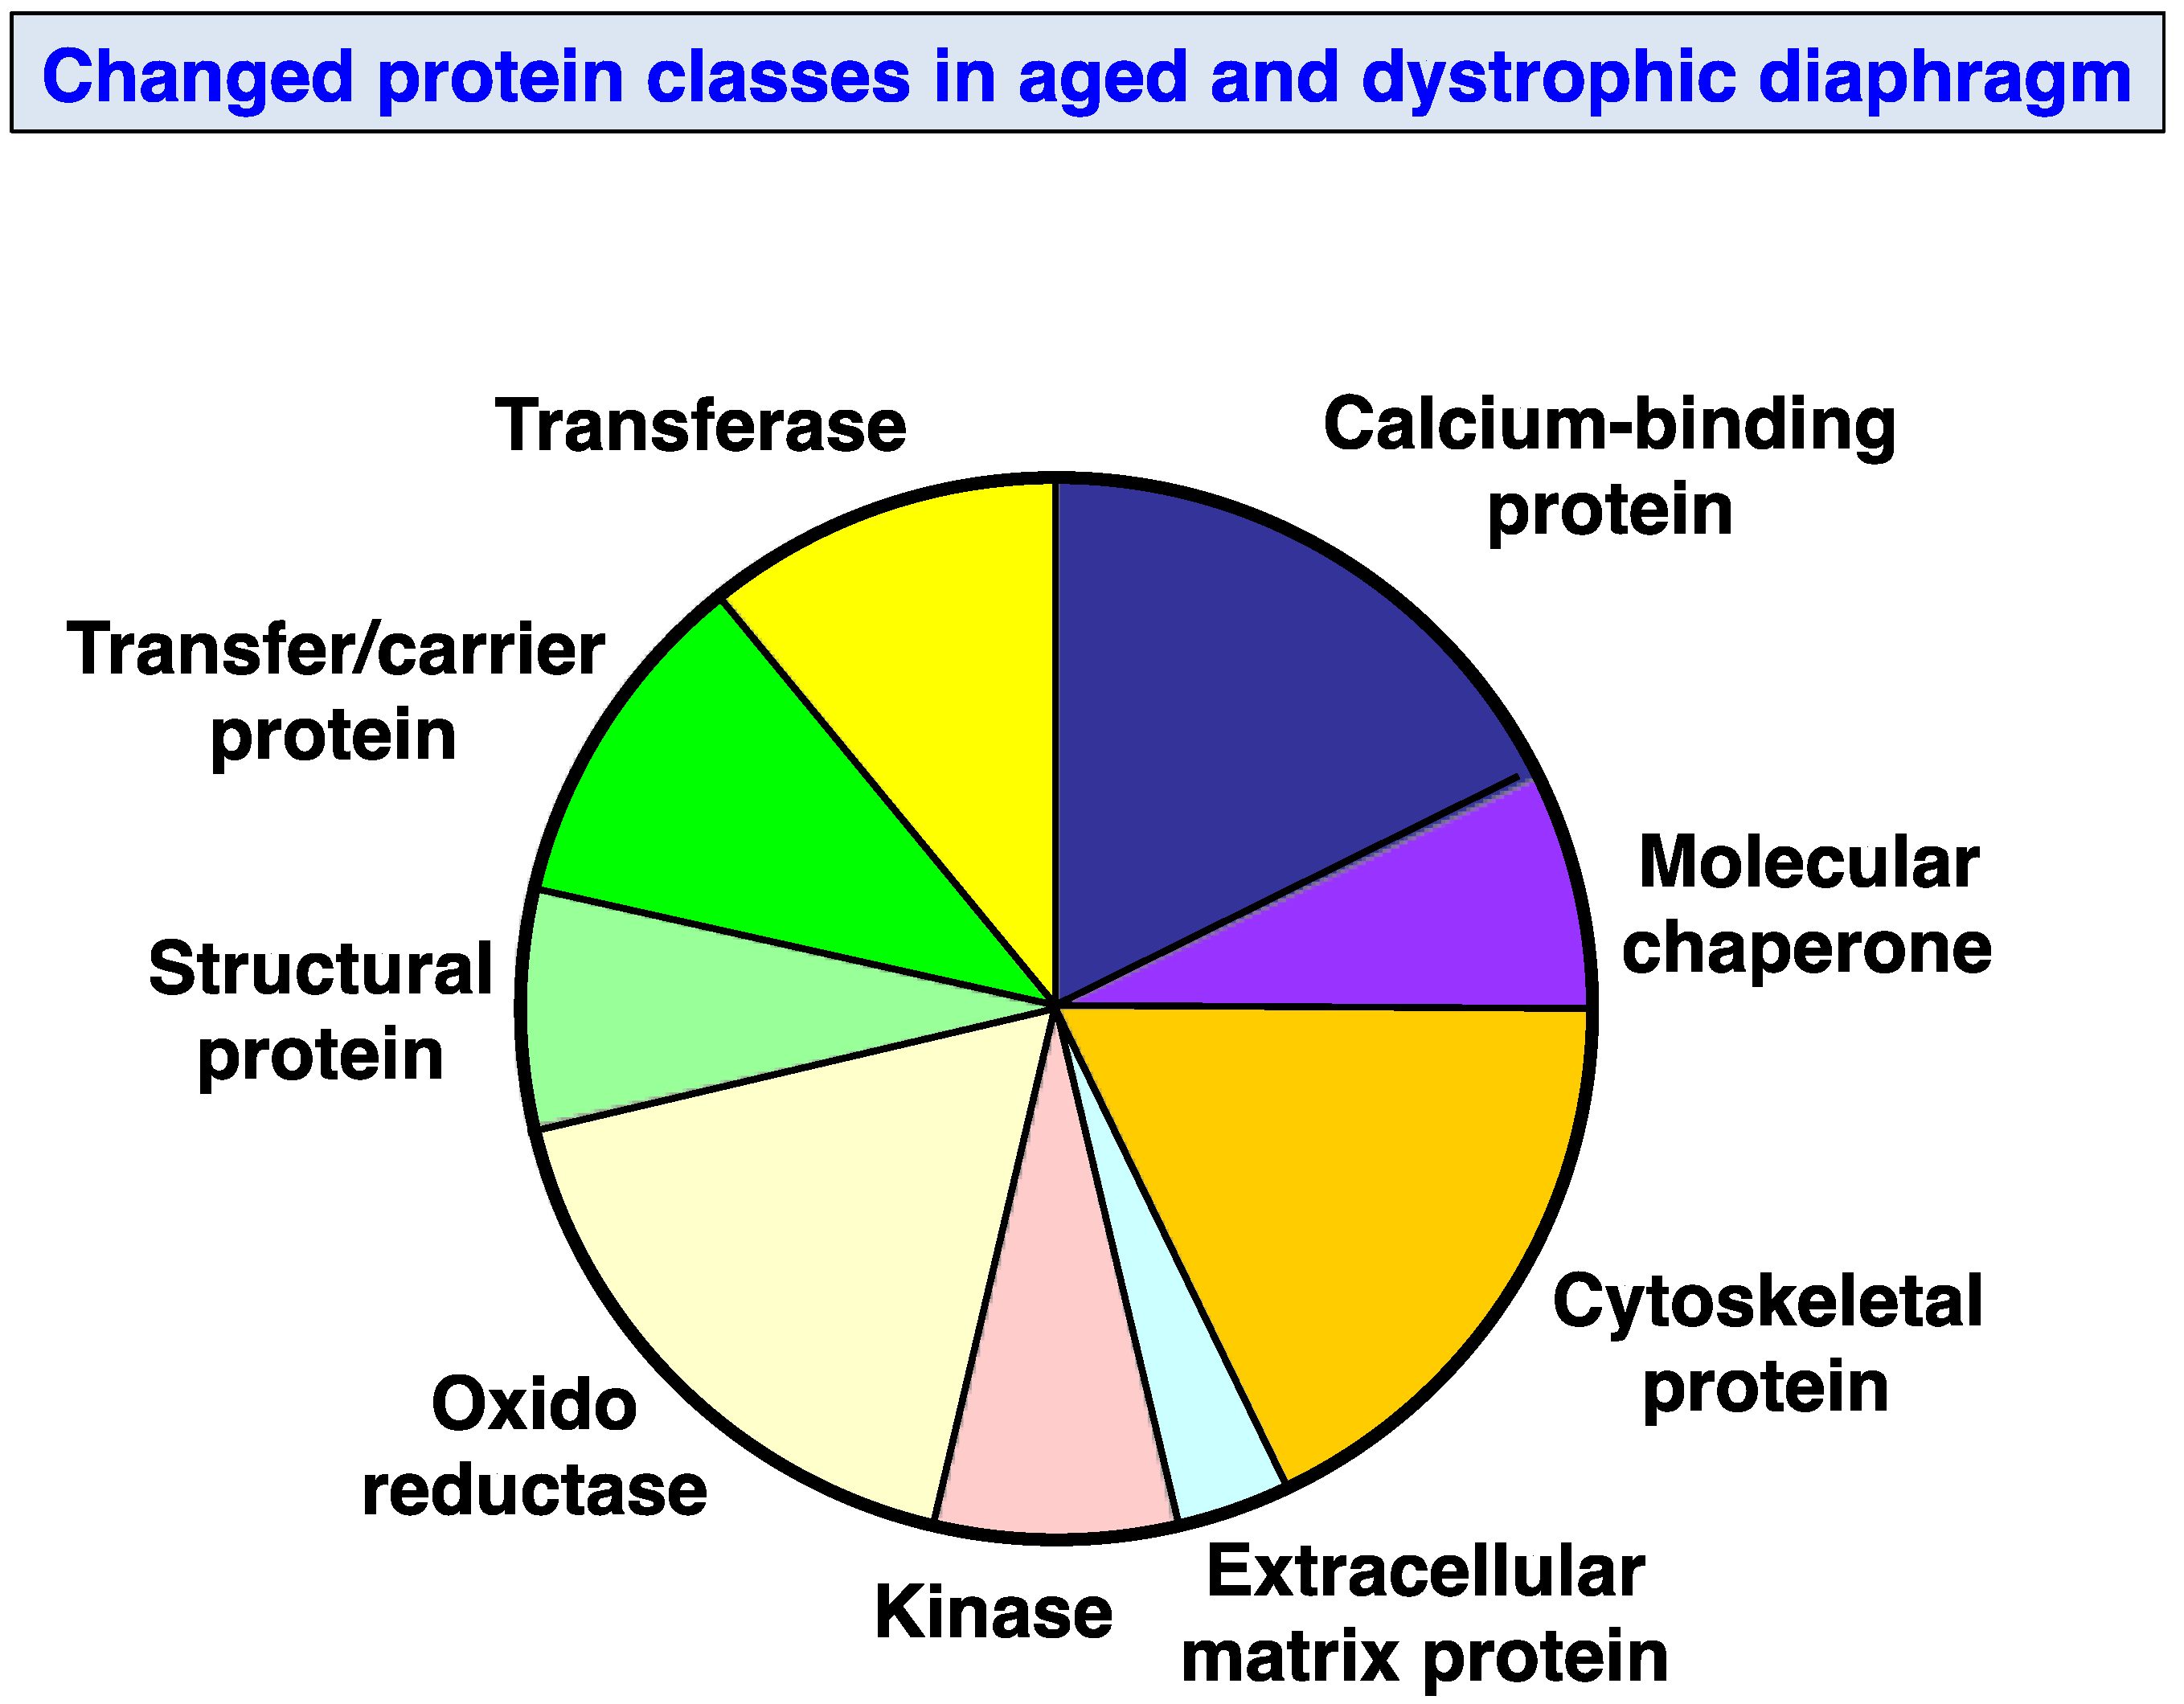
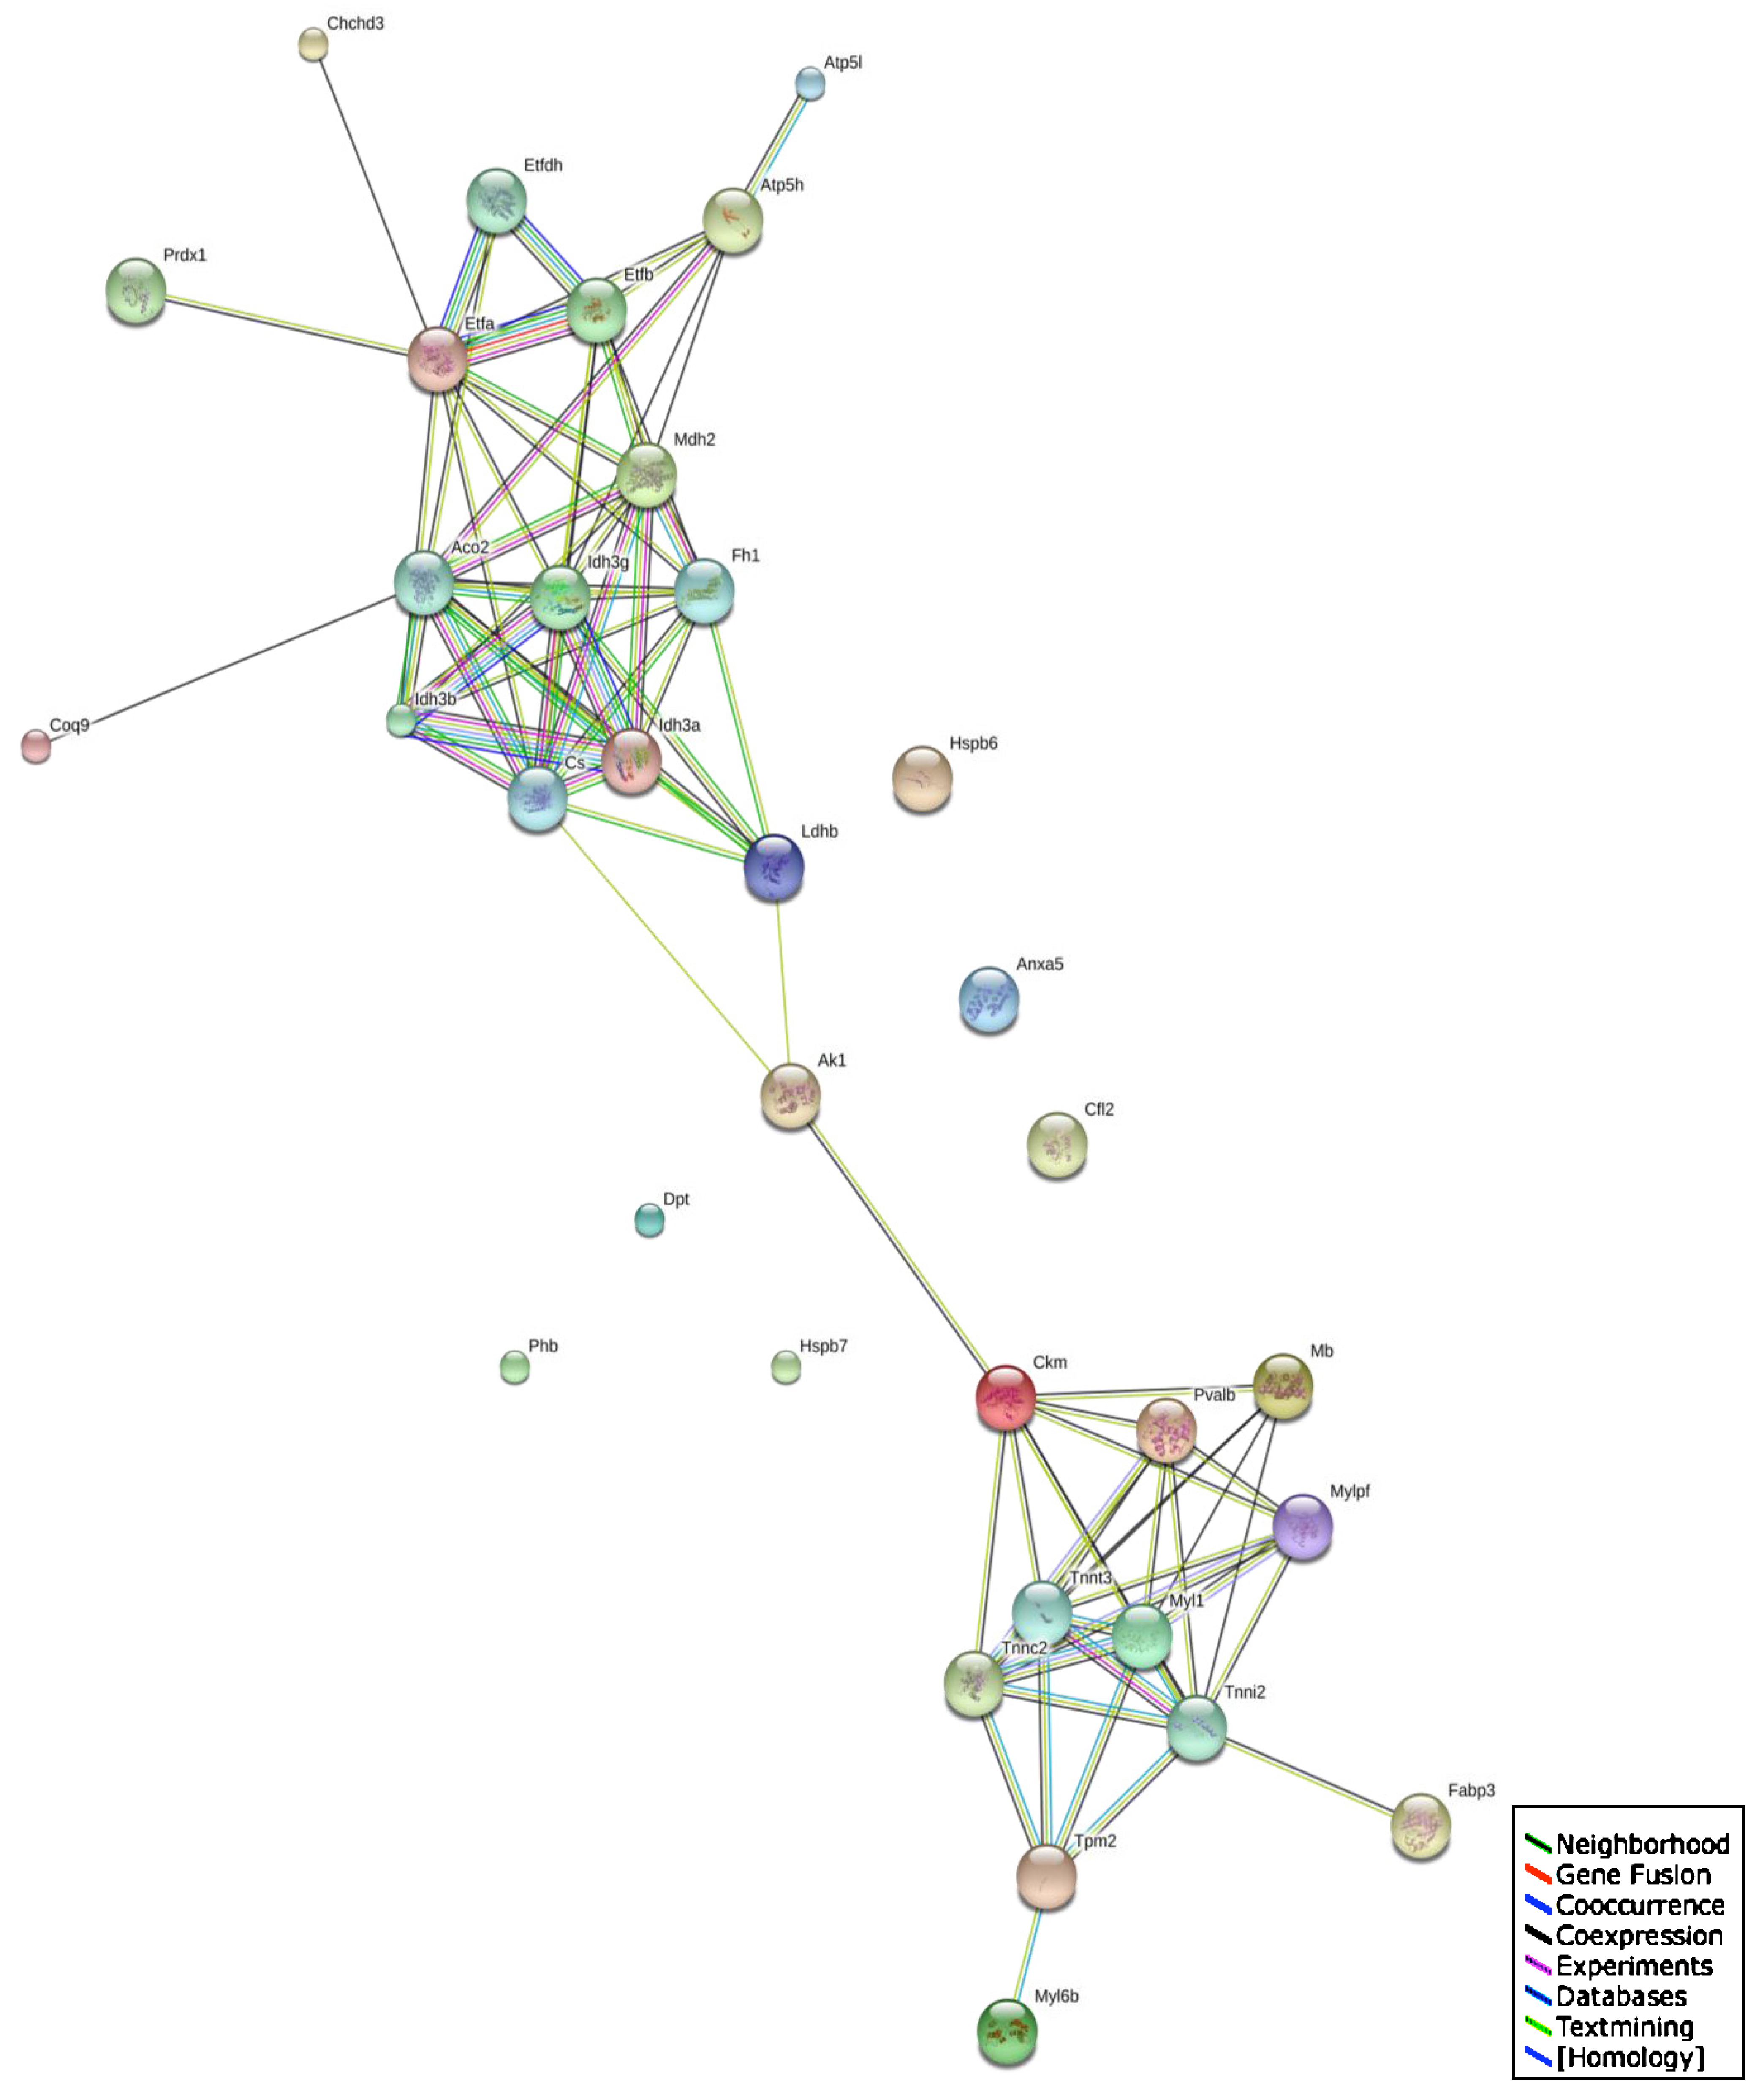
3.4. Changed Protein Classes and Predicted Interaction Patterns of Altered Proteins

Figure 5 provides an overview of the distinct classes of proteins, which have been identified by proteomics to be altered in mdx diaphragm muscle. The application of the PANTHER database of protein families [64,65] resulted in the cataloging of molecular functions of the identified muscle proteins as being involved in ion homeostasis, the cellular stress response, cytoskeletal stabilization, extracellular matrix organization, structural integrity, metabolic transportation and metabolism. Large groups of proteins were represented by calcium-binding proteins, cytoskeletal proteins and oxidoreductases. Frequent changes were also observed in molecular chaperones, kinases, structural proteins, transferases and carrier proteins. Relatively few alterations were shown to occur in extracellular matrix proteins.
The STRING database of direct physical and indirect functional protein interactions [66,67] was employed to evaluate potential protein networks within the proteomic data set generated by this study of the aged mdx diaphragm. This bioinformatic analysis revealed a relatively complex interaction map (Figure 6). Two large clusters were shown to exist that are linked via adenylate kinase and creatine kinase interactions. Since both proteins were demonstrated to be reduced in dystrophin-deficient fibres, this indicates that more severe downstream effects on various proteins may occur within these apparent protein clusters. One of the identified protein networks consists especially of enzymes involved in mitochondrial metabolism, such as ATP synthase, isocitrate dehydrogenase, aconitase and malate dehydrogenase. Another protein cluster contains several major contractile elements, including tropomyosin, troponin and myosins. Important ion handling proteins and metabolite transporters are also proposed to interact with these protein complexes.

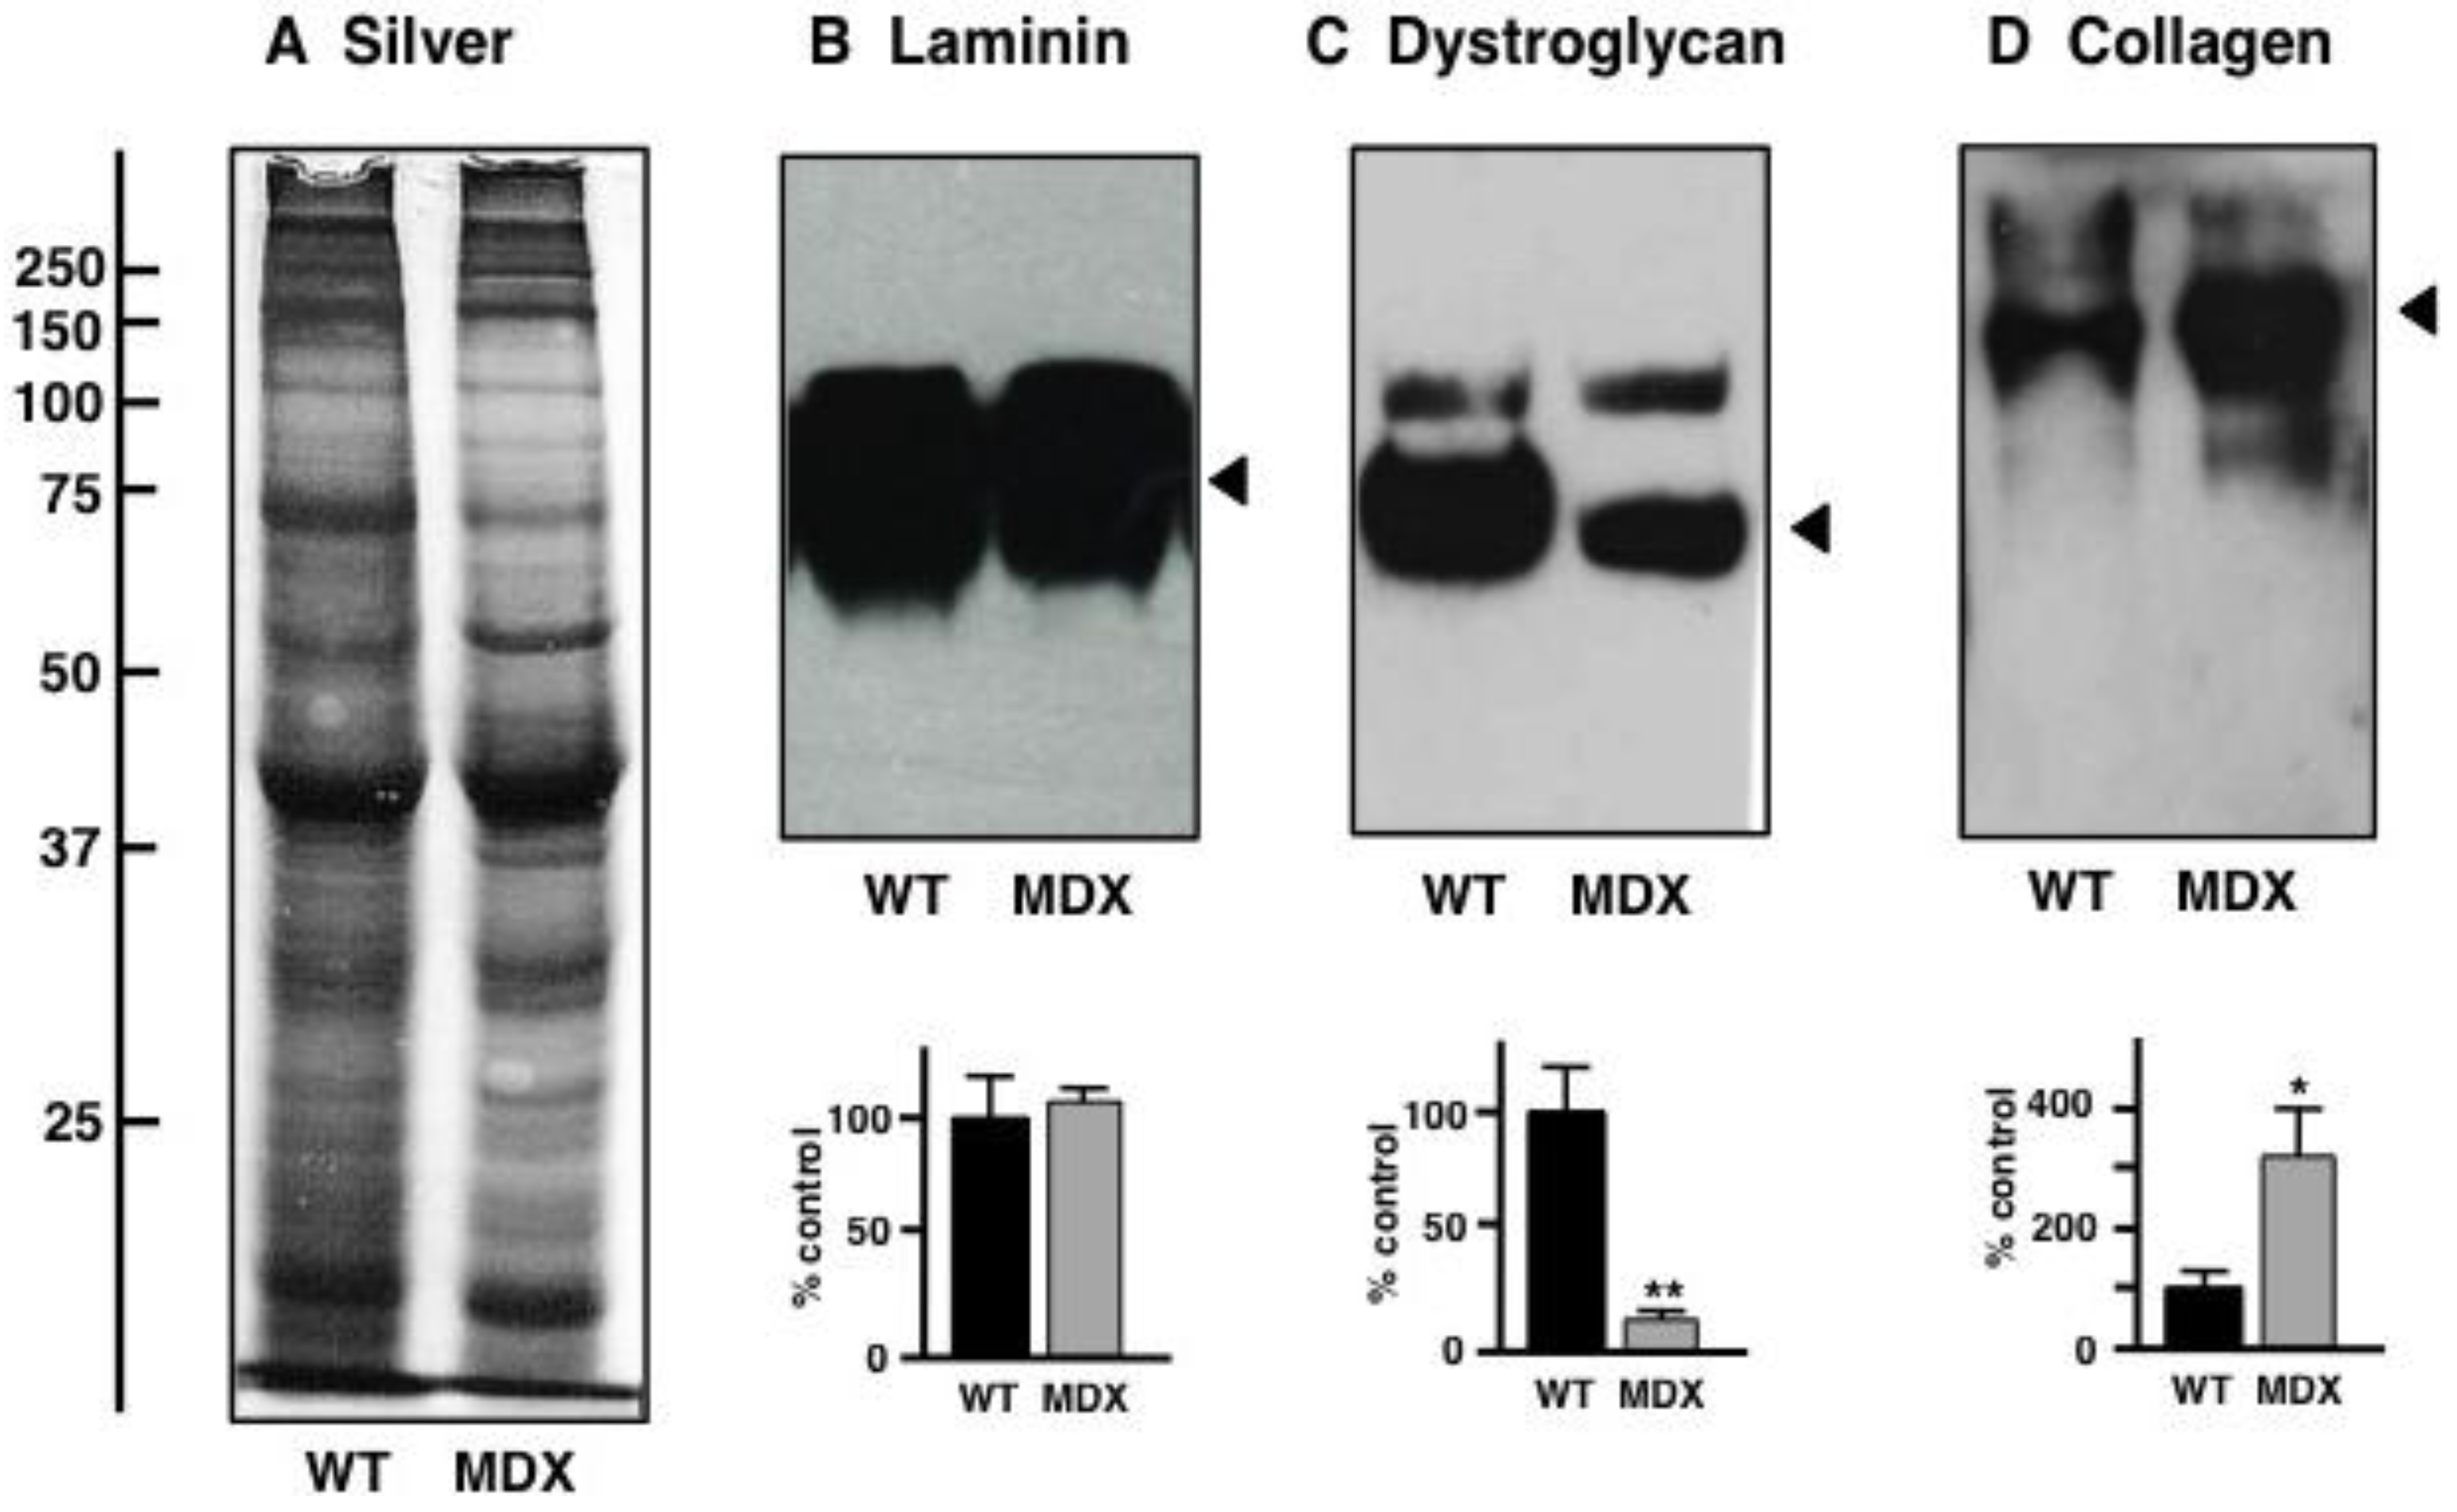
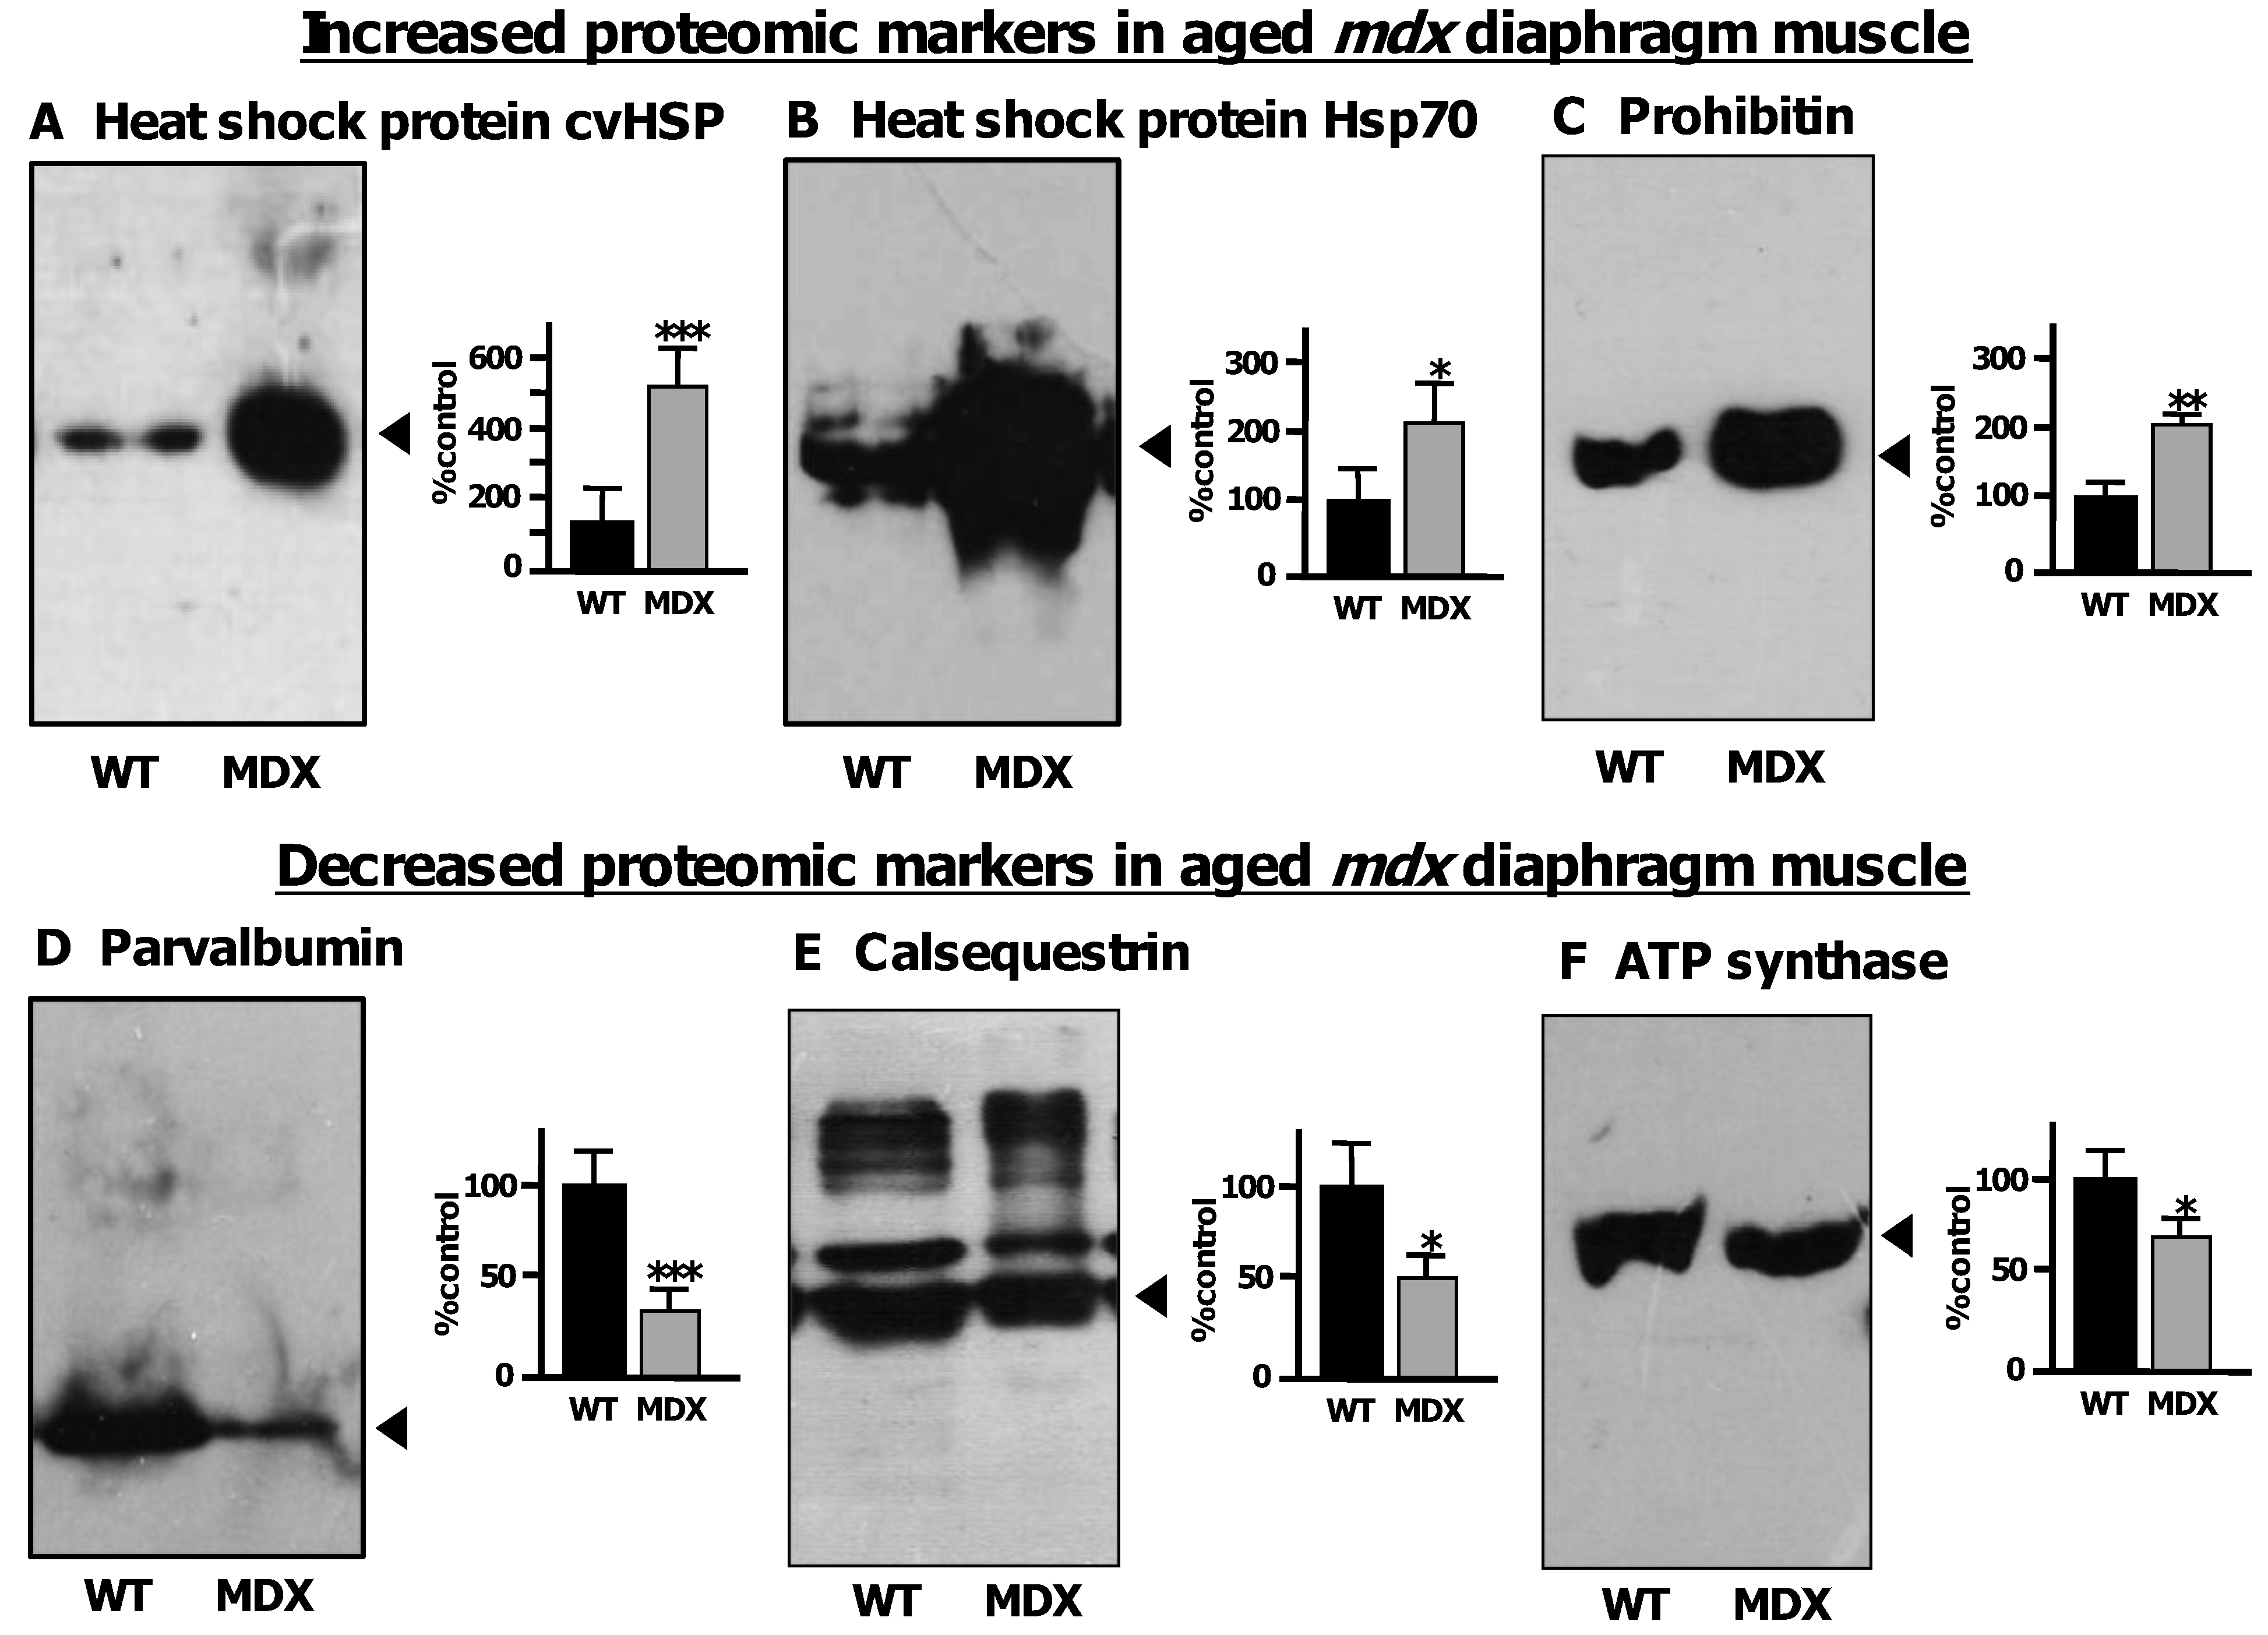
3.5. Immunoblot Analysis of Altered Proteins in Aged mdx Diaphragm Muscle

In order to independently verify the status of potential biomarker candidates with a drastically altered expression in aged mdx diaphragm as revealed by proteomics, comparative immunoblotting was employed. Figure 7A shows a silver-stained 1D gel of non-dystrophic wild type versus dystrophic mdx diaphragm preparations. The gel exhibits relatively comparable overall protein banding patterns in both types of muscle. Immunoblotting of laminin revealed no significant difference in expression levels of this component of the basal lamina (Figure 7B). To confirm the mutant status of the mdx diaphragm specimens used in this study, the concentration of β-dystroglycan was evaluated. Immunoblotting clearly showed a drastic reduction in this dystrophin-associated glycoprotein (Figure 7C). In contrast, the extracellular matrix protein collagen was found to be significantly increased in its expression, which agrees with the senescent and dystrophic status of the aged mdx diaphragm muscle.
Figure 5. Molecular function of altered mdx diaphragm-associated proteins: The bioinformatics software programme PANTHER (database; version 8.1; [64,65]) was applied to identify the clustering of molecular functions of the mass spectrometrically identified proteins with a changed abundance in aged mdx diaphragm as compared to normal muscle (Table 1).
Biology 02 01438 g005
Figure 6. Interaction map of altered mdx diaphragm-associated proteins: The bioinformatics STRING database (version 9.1; [66,67]) was used to generate a protein interaction map with known and predicted protein associations that include direct physical and indirect functional protein linkages of the mass spectrometrically identified proteins with a changed abundance in aged mdx diaphragm as compared to normal muscle (Table 1).
Biology 02 01438 g006
Figure 7. Gel electrophoretic and immunoblot analysis of the aged mdx diaphragm muscle: Shown is a silver-stained gel (A) and representative immunoblots (BD) with expanded views of antibody-decorated bands. Lanes 1 and 2 represent preparations from non-dystrophic wild type (WT) versus dystrophic (MDX) diaphragm muscle, respectively. Immuno-decoration was carried out with primary antibodies to laminin (B), the dystrophin-associated glycoprotein β-dystroglycan (C) and collagen (D). Below the individual immunoblots are shown panels, which give a graphical representation of the immuno-decoration levels in normal versus mdx preparations (Student’s t-test, unpaired; n = 4; * p < 0.05; ** p < 0.01).
Biology 02 01438 g007
Figure 8 shows immunoblot labeling that clearly verified the increase of 3 distinct diaphragm proteins and the concomitant decrease of 3 other diaphragm proteins. An increased concentration in dystrophic muscle was shown for the small heat shock protein cvHsp, the molecular chaperone Hsp70 and the mitochondrial protein prohibitin (Figure 8A–C). In contrast, the cytosolic Ca2+-binding protein parvalbumin, the luminal Ca2+-binding protein calsequestrin and the mitochondrial enzyme ATP synthase were confirmed to be decreased in senescent mdx diaphragm (Figure 8D–F). The immunoblot analysis of calsequestrin with monoclonal antibody VIIID12 to the fast CSQ isoform showed besides the major 60 kDa band of its monomer also several high molecular mass bands that represent previously characterized calsequestrin-like proteins [70].
Figure 8. Immunoblot analysis of the aged mdx diaphragm muscle: Shown are representative immunoblots with expanded views of antibody-decorated bands. Lanes 1 and 2 represent preparations from non-dystrophic wild type (WT) versus dystrophic (MDX) diaphragm muscle, respectively. Immuno-decoration was carried out with primary antibodies to heat shock protein cvHsp (A), heat shock protein Hsp70 (B), prohibitin (C), parvalbumin (D), the luminal Ca2+-binding protein calsequestrin (E) and the mitochondrial enzyme ATP synthase (F). Besides the individual immunoblots are shown panels, which give a graphical representation of the immuno-decoration levels in normal versus mdx preparations (Student’s t-test, unpaired; n = 4; * p < 0.05; ** p < 0.01, *** p < 0.001).
Biology 02 01438 g008

4. Discussion and Conclusions

The comprehensive cataloguing of tissue-specific mRNA profiles, protein populations and metabolite fluxes in normal biosystems is now a major undertaking in the modern biosciences following the successful determination of key mammalian genomes. In addition to the establishment of biomolecular constellations under normal physiological conditions, the high-throughput screening of disease-related alterations in the genome, transcriptome, peptidome, proteome and metabolome promises the systematic identification of novel biomarkers of pathophysiological adaptations and degenerative pathways. Importantly, the differential large-scale analysis of the full complement of genes, mRNAs, peptides, proteins and metabolites present in a defined biological entity, such as body fluids, subcellular fractions, cells, tissues or organisms, is an unbiased technology-driven approach [71,72,73]. Thus, key protein biochemical techniques such as mass spectrometry-based proteomics represent a hypothesis-generating method in discovery mode that aims at the swift establishment of biomarker signatures. In contrast to conventional hypothesis-driven bioresearch that routinely focuses on a select number of protein factors, disease proteomics attempts to evaluate global changes in the entire protein collection of a cellular system [74]. Besides using secreted or leaked proteins as a rich source for biomarker discovery [75], changes in the abundance, oligomerisation, interactions and/or post-translational modifications in tissue-associated proteins are an excellent basis for establishing novel candidate markers [76].
Since single gene disorders that result from a distinct genetic rearrangement or mutations in a unique gene, such as Duchenne muscular dystrophy, have a defined primary genetic marker, these inherited diseases usually exhibit a corresponding and diagnostically accessible faulty protein as an expression marker [42]. This makes this particular type of genetic disorders relatively easy to evaluate on the molecular genetic level, as compared to many complex disorders with potential interplays between genetic susceptibility, life style and environmental factors. However, single gene disorders of the neuromuscular system often show highly complex secondary alterations in their proteome, making it difficult to understand potential hierarchies in degenerative pathways and thus hamper the development of reliable stage-specific diagnostic or prognostic procedures. In this respect, muscle proteomics suggests itself as a highly appropriate screening technique for identifying novel indicators of disease progression [4]. The comparative analysis of the naturally aged diaphragm versus the dystrophic mdx diaphragm presented here illustrates that the fluorescence difference in-gel electrophoresis method, in combination with optimized animal model proteomics, can be extremely helpful for the establishment of new protein markers involved in the molecular pathogenesis of dystrophinopathy. Biomarker discovery studies with rodent models are relatively cost-effective and aging studies can be carried out in a convenient period of time. In addition, more complex animal models of muscular dystrophy have been employed in the search for new markers of dystrophinopathy. This includes the grmd dog model of Duchenne muscular dystrophy [25].
The diagrammatic presentation in Figure 9 summarizes the proteomic findings from the analysis of the senescent mdx mouse model of Duchenne muscular dystrophy. Global alterations in contractile proteins, structural proteins, extracellular proteins, calcium-binding proteins, molecular chaperones, mitochondrial enzymes, glycolytic enzymes and metabolite transporters indicate rearrangements within the actomyosin apparatus, changes in the cytoskeletal network and its indirect linkage to the extracellular matrix, impaired ion handling, an enhanced cellular stress response and considerable metabolic disturbances. Overall, these results imply that protein expression patterns are drastically perturbed in the Dp427-deficient mdx diaphragm and that these pathobiochemical changes are more intense as compared to mdx hind limb muscle [26,47,56]. High levels of dermatopontin and a concomitant increase in collagen, as previously shown by proteomics [55], agree with a progressive accumulation of connective tissue in the dystrophic diaphragm [77]. The degeneration and/or re-modeling of the contractile apparatus, as shown here to include troponins, tropomyosin, actin and myosin light chains, and elevated levels of fibrosis appear to be accompanied by drastic changes in various heat shock proteins. This includes the up-regulation of the muscle-specific molecular chaperone cvHsp and several isoforms of Hsp70, which agrees with the general idea of severe cellular stress in dystrophinopathy [37]. Interestingly, increased levels of a nebulin fragment were observed indicating a potential compensatory mechanism to stabilize the weakened sarcomeric structure by strengthening the nebulin-associated thin filament in dystrophic fibres [10]. The 2-fold increase in transferrin could be due to changes in iron absorption and usage in muscular dystrophy. Since circulating transferrin delivers essential iron to tissue proteins [78], the elevated concentration of this iron transporter indicates disturbed iron homeostasis in degenerating mdx diaphragm muscle.
Figure 9. Proteomic profile of the aged mdx diaphragm muscle: The diagram summarizes the main classes of diaphragm proteins identified by the proteomic profiling of the aged and dystrophin-deficient mdx mouse model of X-linked muscular dystrophy. The severely perturbed protein expression pattern of dystrophic muscle tissue includes extracellular matrix proteins, contractile proteins, structural proteins, molecular chaperones, mitochondrial enzymes, glycolytic enzymes, calcium-binding proteins and metabolite transporters. Thus, the deficiency in dystrophin isoform Dp427 and concomitant reduction in dystrophin-associated glycoproteins in the dystrophic sarcolemma appears to trigger a large range of secondary abnormalities in muscular dystrophy.
Biology 02 01438 g009
Previous studies have shown that skeletal muscles from the mdx mouse exhibit impaired mitochondrial metabolism resulting in decreased intramuscular ATP levels. Mitochondrial abnormalities include the pathophysiological uncoupling of oxidative phosphorylation and a concomitant reduced capacity for maximal ATP synthesis [79] and a disruption of the subsarcolemmal localization of mitochondria that promotes metabolic inefficiency and thus restricts the maximal generation of ATP [80]. In analogy to the findings from a recent proteomic study of the aged mdx heart [48], the senescent mdx diaphragm seems to also show a bioenergetic dysfunction of mitochondria and this suggests that aged mitochondria are unable to meet ATP demand in dystrophic muscle fibres. A decreased concentration was observed for key mitochondrial enzymes, including isocitrate dehydrogenase, malate dehydrogenase, cytochrome c oxidase, electron transferring flavoprotein and ATP synthase. In addition, the proteomic findings of a reduced concentration of the essential and rate-limiting metabolite transporters for the utilization of fatty acids and oxygen, fatty acid binging protein FABP3 and the intracellular oxygen transporter myoglobin, agree with the concept of impaired oxidative metabolism.
Over the last few years, comparative studies with mdx muscle tissue extracts have indicated significant changes in the enzyme adenylate kinase AK1 [37,47,81], the Ca2+-binding protein calsequestrin and its high-molecular-mass isoforms [68,82], the cytosolic Ca2+-binding protein parvalbumin [83], the actin binding protein profilin [26], the oxygen carrier myoglobin [81], the molecular chaperone cvHsp/HspB7 [37,49], different isoforms of annexin [26], the lysosomal-associated membrane protein LAMP1 [27], the enzyme carbonic anhydrase CA3 [56], the fatty acid binding protein FABP3 [26], the mitochondrial enzyme isocitrate dehydrogenase [26,83,84], the extracellular matrix protein dermatopontin [55] and the ion transporter transferrin [48,85]. These proteomic screening studies of the mdx mouse were carried out with a great variety of subtypes of muscle, various tissue extracts or subcellular fractions, diverse protein separation approaches, differing labeling methods and numerous mass spectrometric techniques [26,27,37,47,48,49,55,56,81,82,83,84,85].
The proteomic analysis presented here has confirmed that the concentration of cvHsp, dermatopontin, annexin, profilin and transferrin is drastically increased and that the abundance of calsequestrin, parvalbumin, myoglobin, isocitrate dehydrogenase, and adenylate kinase is severely reduced in the aged mdx diaphragm model of Duchenne muscular dystrophy. This makes these proteins excellent biomarker candidates of dystrophinopathy, which might be helpful in improving diagnostic, prognostic or therapeutic approaches. In conclusion, the proteomic analysis shown here establishes the suitability of the fluorescence difference in-gel electrophoresis method for studying highly complex contractile tissues in a comparative fashion and demonstrates that the aged mdx diaphragm represents a suitable model system to study secondary effects of dystrophin deficiency in skeletal muscle tissue.

Acknowledgments

Research was supported by project grants from Muscular Dystrophy Ireland and Duchenne Ireland, and a Hume scholarship from NUI Maynooth, in addition to equipment grants from the Irish Health Research Board and the Higher Education Authority.

Conflicts of Interest

The authors declare no conflict of interest.

References

  1. Isfort, R.J. Proteomic analysis of striated muscle. J. Chromatogr. B 2002, 771, 155–165. [Google Scholar] [CrossRef]
  2. Ohlendieck, K. Proteomics of skeletal muscle differentiation, neuromuscular disorders and fiber aging. Expert Rev. Proteomics 2010, 7, 283–296. [Google Scholar] [CrossRef]
  3. Gelfi, C.; Vasso, M.; Cerretelli, P. Diversity of human skeletal muscle in health and disease: Contribution of proteomics. J. Proteomics 2011, 74, 774–795. [Google Scholar] [CrossRef]
  4. Ohlendieck, K. Proteomic identification of biomarkers of skeletal muscle disorders. Biomark. Med. 2013, 7, 169–186. [Google Scholar] [CrossRef]
  5. Chevalier, F. Highlights on the capacities of “Gel-based” proteomics. Proteome Sci. 2010, 8, 23. [Google Scholar] [CrossRef]
  6. Rabilloud, T.; Chevallet, M.; Luche, S.; Lelong, C. Two-dimensional gel electrophoresis in proteomics: Past, present and future. J. Proteomics 2010, 73, 2064–2077. [Google Scholar] [CrossRef] [Green Version]
  7. Westermeier, R.; Görg, A. Two-dimensional electrophoresis in proteomics. Methods Biochem. Anal. 2011, 54, 411–439. [Google Scholar] [CrossRef]
  8. Ohlendieck, K. Skeletal muscle proteomics: Current approaches, technical challenges and emerging techniques. Skelet. Muscle 2011, 1, 6. [Google Scholar] [CrossRef]
  9. Parker, K.C.; Walsh, R.J.; Salajegheh, M.; Amato, A.A.; Krastins, B.; Sarracino, D.A.; Greenberg, S.A. Characterization of human skeletal muscle biopsy samples using shotgun proteomics. J. Proteome Res. 2009, 8, 3265–3277. [Google Scholar] [CrossRef]
  10. Holland, A.; Ohlendieck, K. Proteomic profiling of the contractile apparatus from skeletal muscle. Expert Rev. Proteomics 2013, 10, 239–257. [Google Scholar] [CrossRef]
  11. Maughan, D.W.; Henkin, J.A.; Vigoreaux, J.O. Concentrations of glycolytic enzymes and other cytosolic proteins in the diffusible fraction of a vertebrate muscle proteome. Mol. Cell. Proteomics 2005, 4, 1541–1549. [Google Scholar] [CrossRef]
  12. Højlund, K.; Yi, Z.; Hwang, H.; Bowen, B.; Lefort, N.; Flynn, C.R.; Langlais, P.; Weintraub, S.T.; Mandarino, L.J. Characterization of the human skeletal muscle proteome by one-dimensional gel electrophoresis and HPLC-ESI-MS/MS. Mol. Cell. Proteomics 2008, 7, 257–267. [Google Scholar]
  13. Nishimura, R.N.; Sharp, F.R. Heat shock proteins and neuromuscular disease. Muscle Nerve 2005, 32, 693–709. [Google Scholar] [CrossRef]
  14. Choi, Y.S. Reaching for the deep proteome: Recent nano liquid chromatography coupled with tandem mass spectrometry-based studies on the deep proteome. Arch. Pharm. Res. 2012, 35, 1861–1870. [Google Scholar] [CrossRef]
  15. Hamano, K.; Takeya, T.; Iwasaki, N.; Okoshi, N.; Fukubayashi, T.; Kirinoki, M.; Yao, Y.; Hirabayashi, T.; Takita, H. Analysis of dystrophin in muscular diseases by two-dimensional gel electrophoresis using agarose gels in the first dimension. Acta Neurol. Belg. 1996, 96, 102–107. [Google Scholar]
  16. Oh-Ishi, M.; Maeda, T. Disease proteomics of high-molecular-mass proteins by two-dimensional gel electrophoresis with agarose gels in the first dimension (Agarose 2-DE). J. Chromatogr. B 2007, 849, 211–222. [Google Scholar] [CrossRef]
  17. Reisinger, V.; Eichacker, L.A. Isolation of membrane protein complexes by blue native electrophoresis. Methods Mol. Biol. 2008, 424, 423–431. [Google Scholar] [CrossRef]
  18. Wittig, I.; Schägger, H. Native electrophoretic techniques to identify protein-protein interactions. Proteomics 2009, 9, 5214–5223. [Google Scholar] [CrossRef]
  19. Froemming, G.R.; Murray, B.E.; Ohlendieck, K. Self-aggregation of triadin in the sarcoplasmic reticulum of rabbit skeletal muscle. Biochim. Biophys. Acta 1999, 1418, 197–205. [Google Scholar] [CrossRef]
  20. Brennan, J.P.; Wait, R.; Begum, S.; Bell, J.R.; Dunn, M.J.; Eaton, P. Detection and mapping of widespread intermolecular protein disulfide formation during cardiac oxidative stress using proteomics with diagonal electrophoresis. J. Biol. Chem. 2004, 279, 41352–41360. [Google Scholar]
  21. Fraterman, S.; Zeiger, U.; Khurana, T.S.; Rubinstein, N.A.; Wilm, M. Combination of peptide OFFGEL fractionation and label-free quantitation facilitated proteomics profiling of extraocular muscle. Proteomics 2007, 7, 3404–3416. [Google Scholar] [CrossRef]
  22. Gannon, J.; Ohlendieck, K. Subproteomic analysis of basic proteins in aged skeletal muscle following offgel pre-fractionation. Mol. Med. Rep. 2012, 5, 993–1000. [Google Scholar]
  23. Staunton, L.; Ohlendieck, K. Mass spectrometric characterization of the sarcoplasmic reticulum from rabbit skeletal muscle by on-membrane digestion. Protein Pept. Lett. 2012, 19, 252–263. [Google Scholar] [CrossRef]
  24. Ohlendieck, K. On-membrane digestion technology for muscle proteomics. J. Membr. Sep. Technol. 2013, 2, 1–12. [Google Scholar]
  25. Guevel, L.; Lavoie, J.R.; Perez-Iratxeta, C.; Rouger, K.; Dubreil, L.; Feron, M.; Talon, S.; Brand, M.; Megeney, L.A. Quantitative proteomic analysis of dystrophic dog muscle. J. Proteome Res. 2011, 10, 2465–2478. [Google Scholar] [CrossRef]
  26. Rayavarapu, S.; Coley, W.; Cakir, E.; Jahnke, V.; Takeda, S.; Aoki, Y.; Grodish-Dressman, H.; Jaiswal, J.K.; Hoffman, E.P.; Brown, K.J.; et al. Identification of disease specific pathways using in vivo SILAC proteomics in dystrophin deficient mdx mouse. Mol. Cell. Proteomics 2013, 12, 1061–1073. [Google Scholar] [CrossRef]
  27. Duguez, S.; Duddy, W.; Johnston, H.; Lainé, J.; Le Bihan, M.C.; Brown, K.J.; Bigot, A.; Hathout, Y.; Butler-Browne, G.; Partridge, T. Dystrophin deficiency leads to disturbance of LAMP1-vesicle-associated protein secretion. Cell. Mol. Life Sci. 2013, 70, 2159–2174. [Google Scholar] [CrossRef]
  28. Malm, C.; Hadrevi, J.; Bergström, S.A.; Pedrosa-Domellöf, F.; Antti, H.; Svensson, M.; Frängsmyr, L. Evaluation of 2-D DIGE for skeletal muscle: Protocol and repeatability. Scand. J. Clin. Lab. Invest. 2008, 68, 793–800. [Google Scholar] [CrossRef]
  29. Unlü, M.; Morgan, M.E.; Minden, J.S. Difference gel electrophoresis: A single gel method for detecting changes in protein extracts. Electrophoresis 1997, 18, 2071–2077. [Google Scholar] [CrossRef]
  30. Alban, A.; David, S.O.; Bjorkesten, L.; Andersson, C.; Sloge, E.; Lewis, S.; Currie, I. A novel experimental design for comparative two-dimensional gel analysis: Two-dimensional difference gel electrophoresis incorporating a pooled internal standard. Proteomics 2003, 3, 36–44. [Google Scholar] [CrossRef]
  31. Viswanathan, S.; Unlü, M.; Minden, J.S. Two-dimensional difference gel electrophoresis. Nat. Protoc. 2006, 1, 1351–1358. [Google Scholar] [CrossRef]
  32. Minden, J.S. Two-dimensional difference gel electrophoresis. Methods Mol. Biol. 2012, 869, 287–304. [Google Scholar]
  33. Tonge, R.; Shaw, J.; Middleton, B.; Rowlinson, R.; Rayner, S.; Young, J.; Pognan, F.; Hawkins, E.; Currie, I.; Davison, M. Validation and development of fluorescence two-dimensional differential gel electrophoresis proteomics technology. Proteomics 2001, 1, 377–396. [Google Scholar] [CrossRef]
  34. Marouga, R.; David, S.; Hawkins, E. The development of the DIGE system: 2D fluorescence difference gel analysis technology. Anal. Bioanal. Chem. 2005, 382, 669–678. [Google Scholar] [CrossRef]
  35. Karp, N.A.; Kreil, D.P.; Lilley, K.S. Determining a significant change in protein expression with DeCyder during a pair-wise comparison using two-dimensional difference gel electrophoresis. Proteomics 2004, 4, 1421–1432. [Google Scholar] [CrossRef]
  36. Karp, N.A.; Lilley, K.S. Maximising sensitivity for detecting changes in protein expression: Experimental design using minimal CyDyes. Proteomics 2005, 5, 3105–3115. [Google Scholar] [CrossRef]
  37. Doran, P.; Martin, G.; Dowling, P.; Jockusch, H.; Ohlendieck, K. Proteome analysis of the dystrophin-deficient MDX diaphragm reveals a drastic increase in the heat shock protein cvHSP. Proteomics 2006, 6, 4610–4621. [Google Scholar] [CrossRef]
  38. Corzett, T.H.; Fodor, I.K.; Choi, M.W.; Walsworth, V.L.; Chromy, B.A.; Turteltaub, K.W.; McCutchen-Maloney, S.L. Statistical analysis of the experimental variation in the proteomic characterization of human plasma by two-dimensional difference gel electrophoresis. J. Proteome Res. 2006, 5, 2611–2619. [Google Scholar] [CrossRef]
  39. Guenet, J.L. Animal models of human genetic diseases: Do they need to be faithful to be useful? Mol. Genet. Genomics 2011, 286, 1–20. [Google Scholar] [CrossRef]
  40. Vainzof, M.; Ayub-Guerrieri, D.; Onofre, P.C.; Martins, P.C.; Lopes, V.F.; Zilberztajn, D.; Maia, L.S.; Sell, K.; Yamamoto, L.U. Animal models for genetic neuromuscular diseases. J. Mol. Neurosci. 2008, 34, 241–248. [Google Scholar]
  41. Doran, P.; O’Connell, K.; Gannon, J.; Ohlendieck, K. Proteomic profiling of animal models mimicking skeletal muscle disorders. Proteomics Clin. Appl. 2007, 1, 1169–1184. [Google Scholar] [CrossRef]
  42. Koenig, M.; Hoffman, E.P.; Bertelson, C.J.; Monaco, A.P.; Feener, C.; Kunkel, L.M. Complete cloning of the Duchenne muscular dystrophy (DMD) cDNA and preliminary genomic organization of the DMD gene in normal and affected individuals. Cell 1987, 50, 509–517. [Google Scholar]
  43. Nakamura, A.; Takeda, S. Mammalian models of Duchenne Muscular Dystrophy: Pathological characteristics and therapeutic applications. J. Biomed. Biotechnol. 2011, 2011. Article ID 184393. [Google Scholar]
  44. Ng, R.; Banks, G.B.; Hall, J.K.; Muir, L.A.; Ramos, J.N.; Wicki, J.; Odom, G.L.; Konieczny, P.; Seto, J.; Chamberlain, J.R.; et al. Animal models of muscular dystrophy. Prog. Mol. Biol. Transl. Sci. 2012, 105, 83–111. [Google Scholar] [CrossRef]
  45. Banks, G.B.; Chamberlain, J.S. The value of mammalian models for Duchenne muscular dystrophy in developing therapeutic strategies. Curr. Top. Dev. Biol. 2008, 84, 431–453. [Google Scholar] [CrossRef]
  46. Kornegay, J.N.; Bogan, J.R.; Bogan, D.J.; Childers, M.K.; Li, J.; Nghiem, P.; Detwiler, D.A.; Larsen, C.A.; Grange, R.W.; Bhavaraju-Sanka, R.K.; et al. Canine models of Duchenne muscular dystrophy and their use in therapeutic strategies. Mamm. Genome 2012, 23, 85–108. [Google Scholar] [CrossRef]
  47. Ge, Y.; Molloy, M.P.; Chamberlain, J.S.; Andrews, P.C. Proteomic analysis of mdx skeletal muscle: Great reduction of adenylate kinase 1 expression and enzymatic activity. Proteomics 2003, 3, 1895–1903. [Google Scholar] [CrossRef]
  48. Holland, A.; Dowling, P.; Zweyer, M.; Swandulla, D.; Henry, M.; Clynes, M.; Ohlendieck, K. Proteomic profiling of cardiomyopathic tissue from the aged mdx model of Duchenne muscular dystrophy reveals a drastic decrease in laminin, nidogen and annexin. Proteomics 2013, 13, 2312–2323. [Google Scholar] [CrossRef]
  49. Doran, P.; Wilton, S.D.; Fletcher, S.; Ohlendieck, K. Proteomic profiling of antisense-induced exon skipping reveals reversal of pathobiochemical abnormalities in dystrophic mdx diaphragm. Proteomics 2009, 9, 671–685. [Google Scholar] [CrossRef]
  50. Lewis, C.; Carberry, S.; Ohlendieck, K. Proteomic profiling of x-linked muscular dystrophy. J. Muscle Res. Cell Motil. 2009, 30, 267–269. [Google Scholar] [CrossRef]
  51. Lefaucheur, J.P.; Pastoret, C.; Sebille, A. Phenotype of dystrophinopathy in old mdx mice. Anat. Rec. 1995, 242, 70–76. [Google Scholar] [CrossRef]
  52. Head, S.I. Branched fibres in old dystrophic mdx muscle are associated with mechanical weakening of the sarcolemma, abnormal Ca2+ transients and a breakdown of Ca2+ homeostasis during fatigue. Exp. Physiol. 2010, 95, 641–656. [Google Scholar] [CrossRef]
  53. Chamberlain, J.S.; Metzger, J.; Reyes, M.; Townsend, D.; Faulkner, J.A. Dystrophin-deficient mdx mice display a reduced life span and are susceptible to spontaneous rhabdomyosarcoma. FASEB J. 2007, 21, 2195–2204. [Google Scholar] [CrossRef]
  54. Mouisel, E.; Vignaud, A.; Hourde, C.; Butler-Browne, G.; Ferry, A. Muscle weakness and atrophy are associated with decreased regenerative capacity and changes in mTOR signaling in skeletal muscles of venerable (18-24-month-old) dystrophic mdx mice. Muscle Nerve 2010, 41, 809–818. [Google Scholar] [CrossRef]
  55. Carberry, S.; Zweyer, M.; Swandulla, D.; Ohlendieck, K. Proteomics reveals drastic increase of extracellular matrix proteins collagen and dermatopontin in aged mdx diaphragm muscle. Int. J. Mol. Med. 2012, 30, 229–234. [Google Scholar]
  56. Carberry, S.; Zweyer, M.; Swandulla, D.; Ohlendieck, K. Profiling of age-related changes in the tibialis anterior muscle proteome of the mdx mouse model of dystrophinopathy. J. Biomed. Biotechnol. 2012, 2012, 691641. [Google Scholar]
  57. Sicinski, P.; Geng, Y.; Ryder-Cook, A.S.; Barnard, E.A.; Darlison, M.G.; Barnard, P.J. The molecular basis of muscular dystrophy in the mdx mouse: A point mutation. Science 1989, 244, 1578–1580. [Google Scholar]
  58. Stedman, H.H.; Sweeney, H.L.; Shrager, J.B.; Maguire, H.C.; Panettieri, R.A.; Petrof, B.; Narusawa, M.; Leferovich, J.M.; Sladky, J.T.; Kell, A.M. The mdx mouse diaphragm reproduces the degenerative changes of Duchenne muscular dystrophy. Nature 1991, 352, 536–539. [Google Scholar] [CrossRef]
  59. Staunton, L.; Jockusch, H.; Ohlendieck, K. Proteomic analysis of muscle affected by motor neuron degeneration: The wobbler mouse model of amyotrophic lateral sclerosis. Biochem. Biophys.Res. Commun. 2011, 406, 595–600. [Google Scholar] [CrossRef]
  60. O’Connell, K.; Ohlendieck, K. Proteomic DIGE analysis of the mitochondria-enriched fraction from aged rat skeletal muscle. Proteomics 2009, 9, 5509–5524. [Google Scholar] [CrossRef]
  61. Kang, Y.; Techanukul, T.; Mantalaris, A.; Nagy, J.M. Comparison of three commercially available DIGE analysis software packages: Minimal user intervention in gel-based proteomics. J. Proteome Res. 2009, 8, 1077–1084. [Google Scholar]
  62. Carberry, S.; Ohlendieck, K. Gel electrophoresis-based proteomics of senescent tissues. Methods Mol. Biol. 1048, 229–246. [Google Scholar]
  63. Staunton, L.; Jockusch, H.; Wiegand, C.; Albrecht, T.; Ohlendieck, K. Identification of secondary effects of hyperexcitability by proteomic profiling of myotonic mouse muscle. Mol. Biosyst. 2011, 7, 2480–2489. [Google Scholar] [CrossRef]
  64. PANTHER Gene List Analysis. Available online: http://pantherdb.org/ (accessed on 15 November 2013).
  65. Mi, H.; Muruganujan, A.; Thomas, P.D. PANTHER in 2013: Modeling the evolution of gene function, and other gene attributes, in the context of phylogenetic trees. Nucleic Acids Res. 2013, 41, D377–D386. [Google Scholar] [CrossRef]
  66. STRING Functional Protein Association Network. Available online: http://string-db.org/ (accessed on 17 November 2013).
  67. Franceschini, A.; Szklarczyk, D.; Frankild, S.; Kuhn, M.; Simonovic, M.; Roth, A.; Lin, J.; Minguez, P.; Bork, P.; von Mering, C.; et al. STRING v9.1: Protein-protein interaction networks, with increased coverage and integration. Nucleic Acids Res. 2013, 41, D808–D815. [Google Scholar] [CrossRef]
  68. Staunton, L.; Zweyer, M.; Swandulla, D.; Ohlendieck, K. Mass spectrometry-based proteomic analysis of middle-aged vs. aged vastus lateralis reveals increased levels of carbonic anhydrase isoform 3 in senescent human skeletal muscle. Int. J. Mol. Med. 2012, 30, 723–733. [Google Scholar]
  69. Holland, A.; Carberry, S.; Ohlendieck, K. Proteomics of the dystrophin-glycoprotein complex and dystrophinopathy. Curr. Protein Pep. Sci. 2013, in press. [Google Scholar]
  70. Culligan, K.; Banville, N.; Dowling, P.; Ohlendieck, K. Drastic reduction of calsequestrin-like proteins and impaired calcium binding in dystrophic mdx muscle. J. Appl. Physiol. 2002, 92, 435–445. [Google Scholar]
  71. Davey, J.W.; Hohenlohe, P.A.; Etter, P.D.; Boone, J.Q.; Catchen, J.M.; Blaxter, M.L. Genome-wide genetic marker discovery and genotyping using next-generation sequencing. Nat. Rev. Genet. 2011, 12, 499–510. [Google Scholar]
  72. Pontén, F.; Schwenk, J.M.; Asplund, A.; Edqvist, P.H. The Human Protein Atlas as a proteomic resource for biomarker discovery. J. Intern. Med. 2011, 270, 428–446. [Google Scholar] [CrossRef]
  73. Theodoridis, G.A.; Gika, H.G.; Want, E.J.; Wilson, I.D. Liquid chromatography-mass spectrometry based global metabolite profiling: A review. Anal. Chim. Acta 2012, 711, 7–16. [Google Scholar] [CrossRef]
  74. Cox, J.; Mann, M. Quantitative, high-resolution proteomics for data-driven systems biology. Annu. Rev. Biochem. 2011, 80, 273–299. [Google Scholar]
  75. Stastna, M.; van Eyk, J.E. Secreted proteins as a fundamental source for biomarker discovery. Proteomics 2012, 12, 722–735. [Google Scholar] [CrossRef]
  76. Mallick, P.; Kuster, B. Proteomics: A pragmatic perspective. Nat. Biotechnol. 2010, 28, 695–709. [Google Scholar] [CrossRef]
  77. Graham, K.M.; Singh, R.; Millman, G.; Malnassy, G.; Gatti, F.; Bruemmer, K.; Stefanski, C.; Curtis, H.; Sesti, J.; Carlson, C.G. Excessive collagen accumulation in dystrophic (mdx) respiratory musculature is independent of enhanced activation of the NF-kappaB pathway. J. Neurol. Sci. 2010, 294, 43–50. [Google Scholar]
  78. Wang, J.; Pantopoulos, K. Regulation of cellular iron metabolism. Biochem. J. 2011, 434, 365–381. [Google Scholar] [CrossRef]
  79. Kuznetsov, A.V.; Winkler, K.; Wiedemann, F.R.; von Bossanyi, P.; Dietzmann, K.; Kunz, W.S. Impaired mitochondrial oxidative phosphorylation in skeletal muscle of the dystrophin-deficient mdx mouse. Mol. Cell. Biochem. 1998, 183, 87–96. [Google Scholar] [CrossRef]
  80. Percival, J.M.; Siegel, M.P.; Knowels, G.; Marcinek, D.J. Defects in mitochondrial localization and ATP synthesis in the mdx mouse model of Duchenne muscular dystrophy are not alleviated by PDE5 inhibition. Hum. Mol. Genet. 2013, 22, 153–167. [Google Scholar]
  81. Doran, P.; Dowling, P.; Donoghue, P.; Buffini, M.; Ohlendieck, K. Reduced expression of regucalcin in young and aged mdx diaphragm indicates abnormal cytosolic calcium handling in dystrophin-deficient muscle. Biochim. Biophys. Acta 2006, 1764, 773–785. [Google Scholar]
  82. Doran, P.; Dowling, P.; Lohan, J.; McDonnell, K.; Poetsch, S.; Ohlendieck, K. Subproteomics analysis of Ca2+-binding proteins demonstrates decreased calsequestrin expression in dystrophic mouse skeletal muscle. Eur. J. Biochem. 2004, 271, 3943–3952. [Google Scholar]
  83. Carberry, S.; Brinkmeier, H.; Zhang, Y.; Winkler, C.K.; Ohlendieck, K. Comparative proteomic profiling of soleus, extensor digitorum longus, flexor digitorum brevis and interosseus muscle from the mdx mouse model of Duchenne muscular dystrophy. Int. J. Mol. Med. 2013, 32, 544–556. [Google Scholar]
  84. Gardan-Salmon, D.; Dixon, J.M.; Lonergan, S.M.; Selsby, J.T. Proteomic assessment of the acute phase of dystrophin deficiency in mdx mice. Eur. J. Appl. Physiol. 2011, 111, 2763–2773. [Google Scholar] [CrossRef]
  85. Carberry, S.; Zweyer, M.; Swandulla, D.; Ohlendieck, K. Comparative proteomic analysis of the contractile protein-depleted fraction from normal versus dystrophic skeletal muscle. Anal. Biochem. 2013. [Google Scholar] [CrossRef]

