Changes in RNA Splicing in Developing Soybean (Glycine max) Embryos


Abstract
:1. Introduction
2. Experimental Section
2.1. RNA-Sequencing-Based Transcriptomics
2.2. AS and Clustering Analyses
2.3. Quantitative Real-Time PCR (qPCR) Validation of Gene and Isoform Transcriptional Changes
3. Results and Discussion
3.1. Global Assessment of AS in Developing Soybean Embryos

| Number of genes | 13,973 | 1,270 | 102 | 20 | 2 | 1 |
|---|---|---|---|---|---|---|
| Number of transcripts/isoforms | 1 | 2 | 3 | 4 | 5 | 6 |

| One transcript changed and at least one other did not change | Single transcript | At least two isoforms changed | ||
|---|---|---|---|---|
| Genes | 10,311 | 3,662 | 1,395 | |
| Codes | Corresponding isoforms that showed differential expression | |||
| = | Known transcript | 8,466 | 3,647 | 1,421 |
| j | Novel transcript | 1,525 | 12 | 1,313 |
| i | Intron retention | 3 | 1 | 0 |
| o | Partial overlap with known reference transcript | 183 | 2 | 68 |
| x | Antisense exon | 128 | 0 | 116 |
| s | Antisense intron | 6 | 0 | 24 |
| Total | 10,311 | 3,662 | 2,942 | |
3.2. Differential Expression of Related Isoforms Involved in CCNM and Maturation during Soybean Embryo Development
3.2.1. Central Carbon and Nitrogen Metabolism
| Process | Isoforms | Annotation |
|---|---|---|
| Photosynthesis | Glyma05g24660.N2; Glyma18g03220.3; Glyma02g47560.2; Glyma20g35530.1 | Light-harvesting complexes |
| Glyma07g21150.N2; Glyma11g08230.1; Glyma05g03730.1; Glyma12g32680.1 | Electron carriers | |
| Glyma15g40450.1 | O2-evolving complex | |
| Respiration | Glyma10g08480.1 | Kinesin-like protein 1 |
| Glyma08g00880.N4 | NADPH/respiratory burst oxidase protein D | |
| Amino acid metabolism | Glyma19g27500.1; Glyma11g38130.1; Glyma18g06840.N6; Glyma06g13280.N3; Glyma14g32500.1; Glyma19g28770.1 | Asp- and Glu-family enzymes |
| Glyma15g05630.1 | Ser decarboxylase | |
| Glyma10g35580.N13; Glyma12g07720.N10 | Aromatic amino acid enzymes | |
| Glyma04g42190.1; Glyma07g30500.N8; Glyma19g29880.N2 | Branched-chain amino acid enzymes | |
| Glyma13g24580.N25; Glyma02g42800.1; Glyma09g37270.N2 | Amino acid transporters | |
| Lipid metabolism | Glyma05g24650.N3; Glyma17g07480.N2; Glyma05g36910.1; Glyma12g13020.1; Glyma07g18370.N4; Glyma06g17640.1; Glyma17g03070.N3 | Acyl-CoA-related enzymes |
| Glyma18g06950.1; Glyma14g37350.N3 | Fatty acid desaturases |
 ) were differentially expressed. Alternative 5' splicing yielded these novel isoforms. (B) Proteins resulting from these three transcripts with the respective positions of NAD-binding domains (pfam03446) and 6-phosphogluconate dehydrogenase (6PGD) C-terminal domains (pfam00393). Domain-related information was obtained from NCBI [97]. Numbers in blue represent amino acid residues in the individual proteins. (C) Overlaid expression profiles of Glyma19g05120.2, N3, and N4, obtained from SplineCluster. Numbers shown in parenthesis represent the isoform clusters. Representative developing soybean embryos are shown for each time point along with a temporal representation of processes occurring during embryo development.
) were differentially expressed. Alternative 5' splicing yielded these novel isoforms. (B) Proteins resulting from these three transcripts with the respective positions of NAD-binding domains (pfam03446) and 6-phosphogluconate dehydrogenase (6PGD) C-terminal domains (pfam00393). Domain-related information was obtained from NCBI [97]. Numbers in blue represent amino acid residues in the individual proteins. (C) Overlaid expression profiles of Glyma19g05120.2, N3, and N4, obtained from SplineCluster. Numbers shown in parenthesis represent the isoform clusters. Representative developing soybean embryos are shown for each time point along with a temporal representation of processes occurring during embryo development.
) were differentially expressed. Alternative 5' splicing yielded these novel isoforms. (B) Proteins resulting from these three transcripts with the respective positions of NAD-binding domains (pfam03446) and 6-phosphogluconate dehydrogenase (6PGD) C-terminal domains (pfam00393). Domain-related information was obtained from NCBI [97]. Numbers in blue represent amino acid residues in the individual proteins. (C) Overlaid expression profiles of Glyma19g05120.2, N3, and N4, obtained from SplineCluster. Numbers shown in parenthesis represent the isoform clusters. Representative developing soybean embryos are shown for each time point along with a temporal representation of processes occurring during embryo development.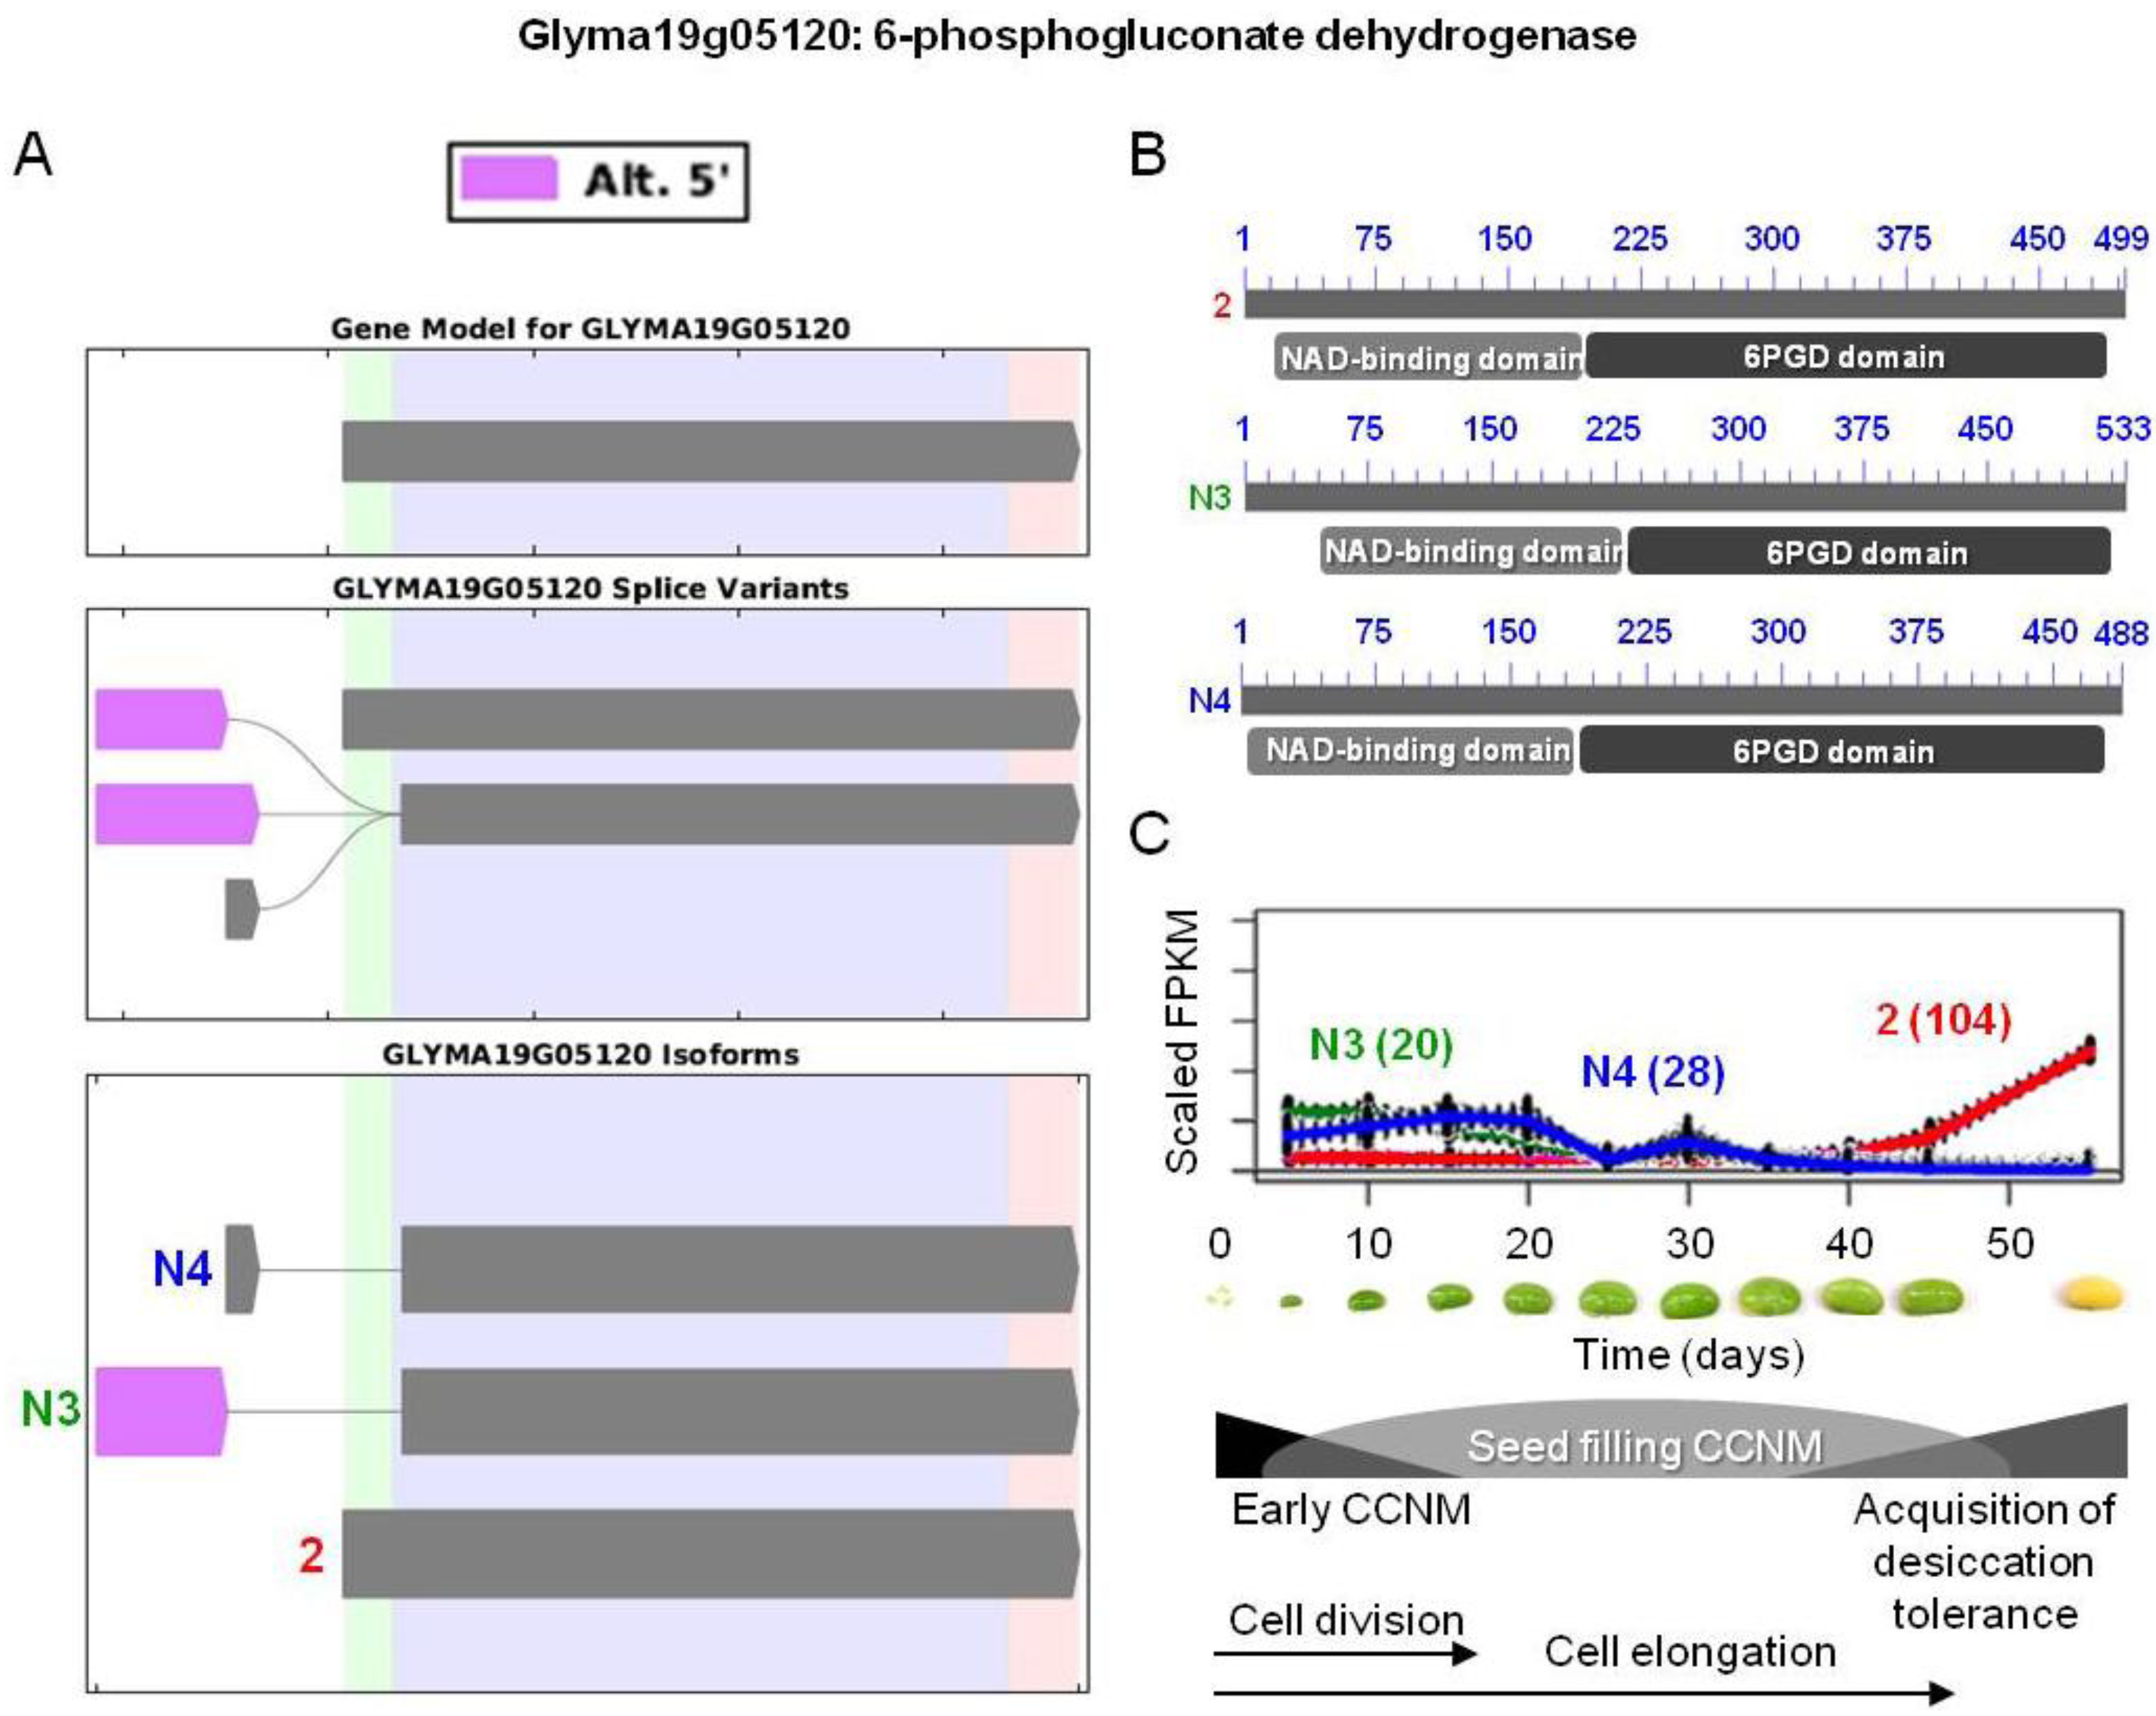
 and
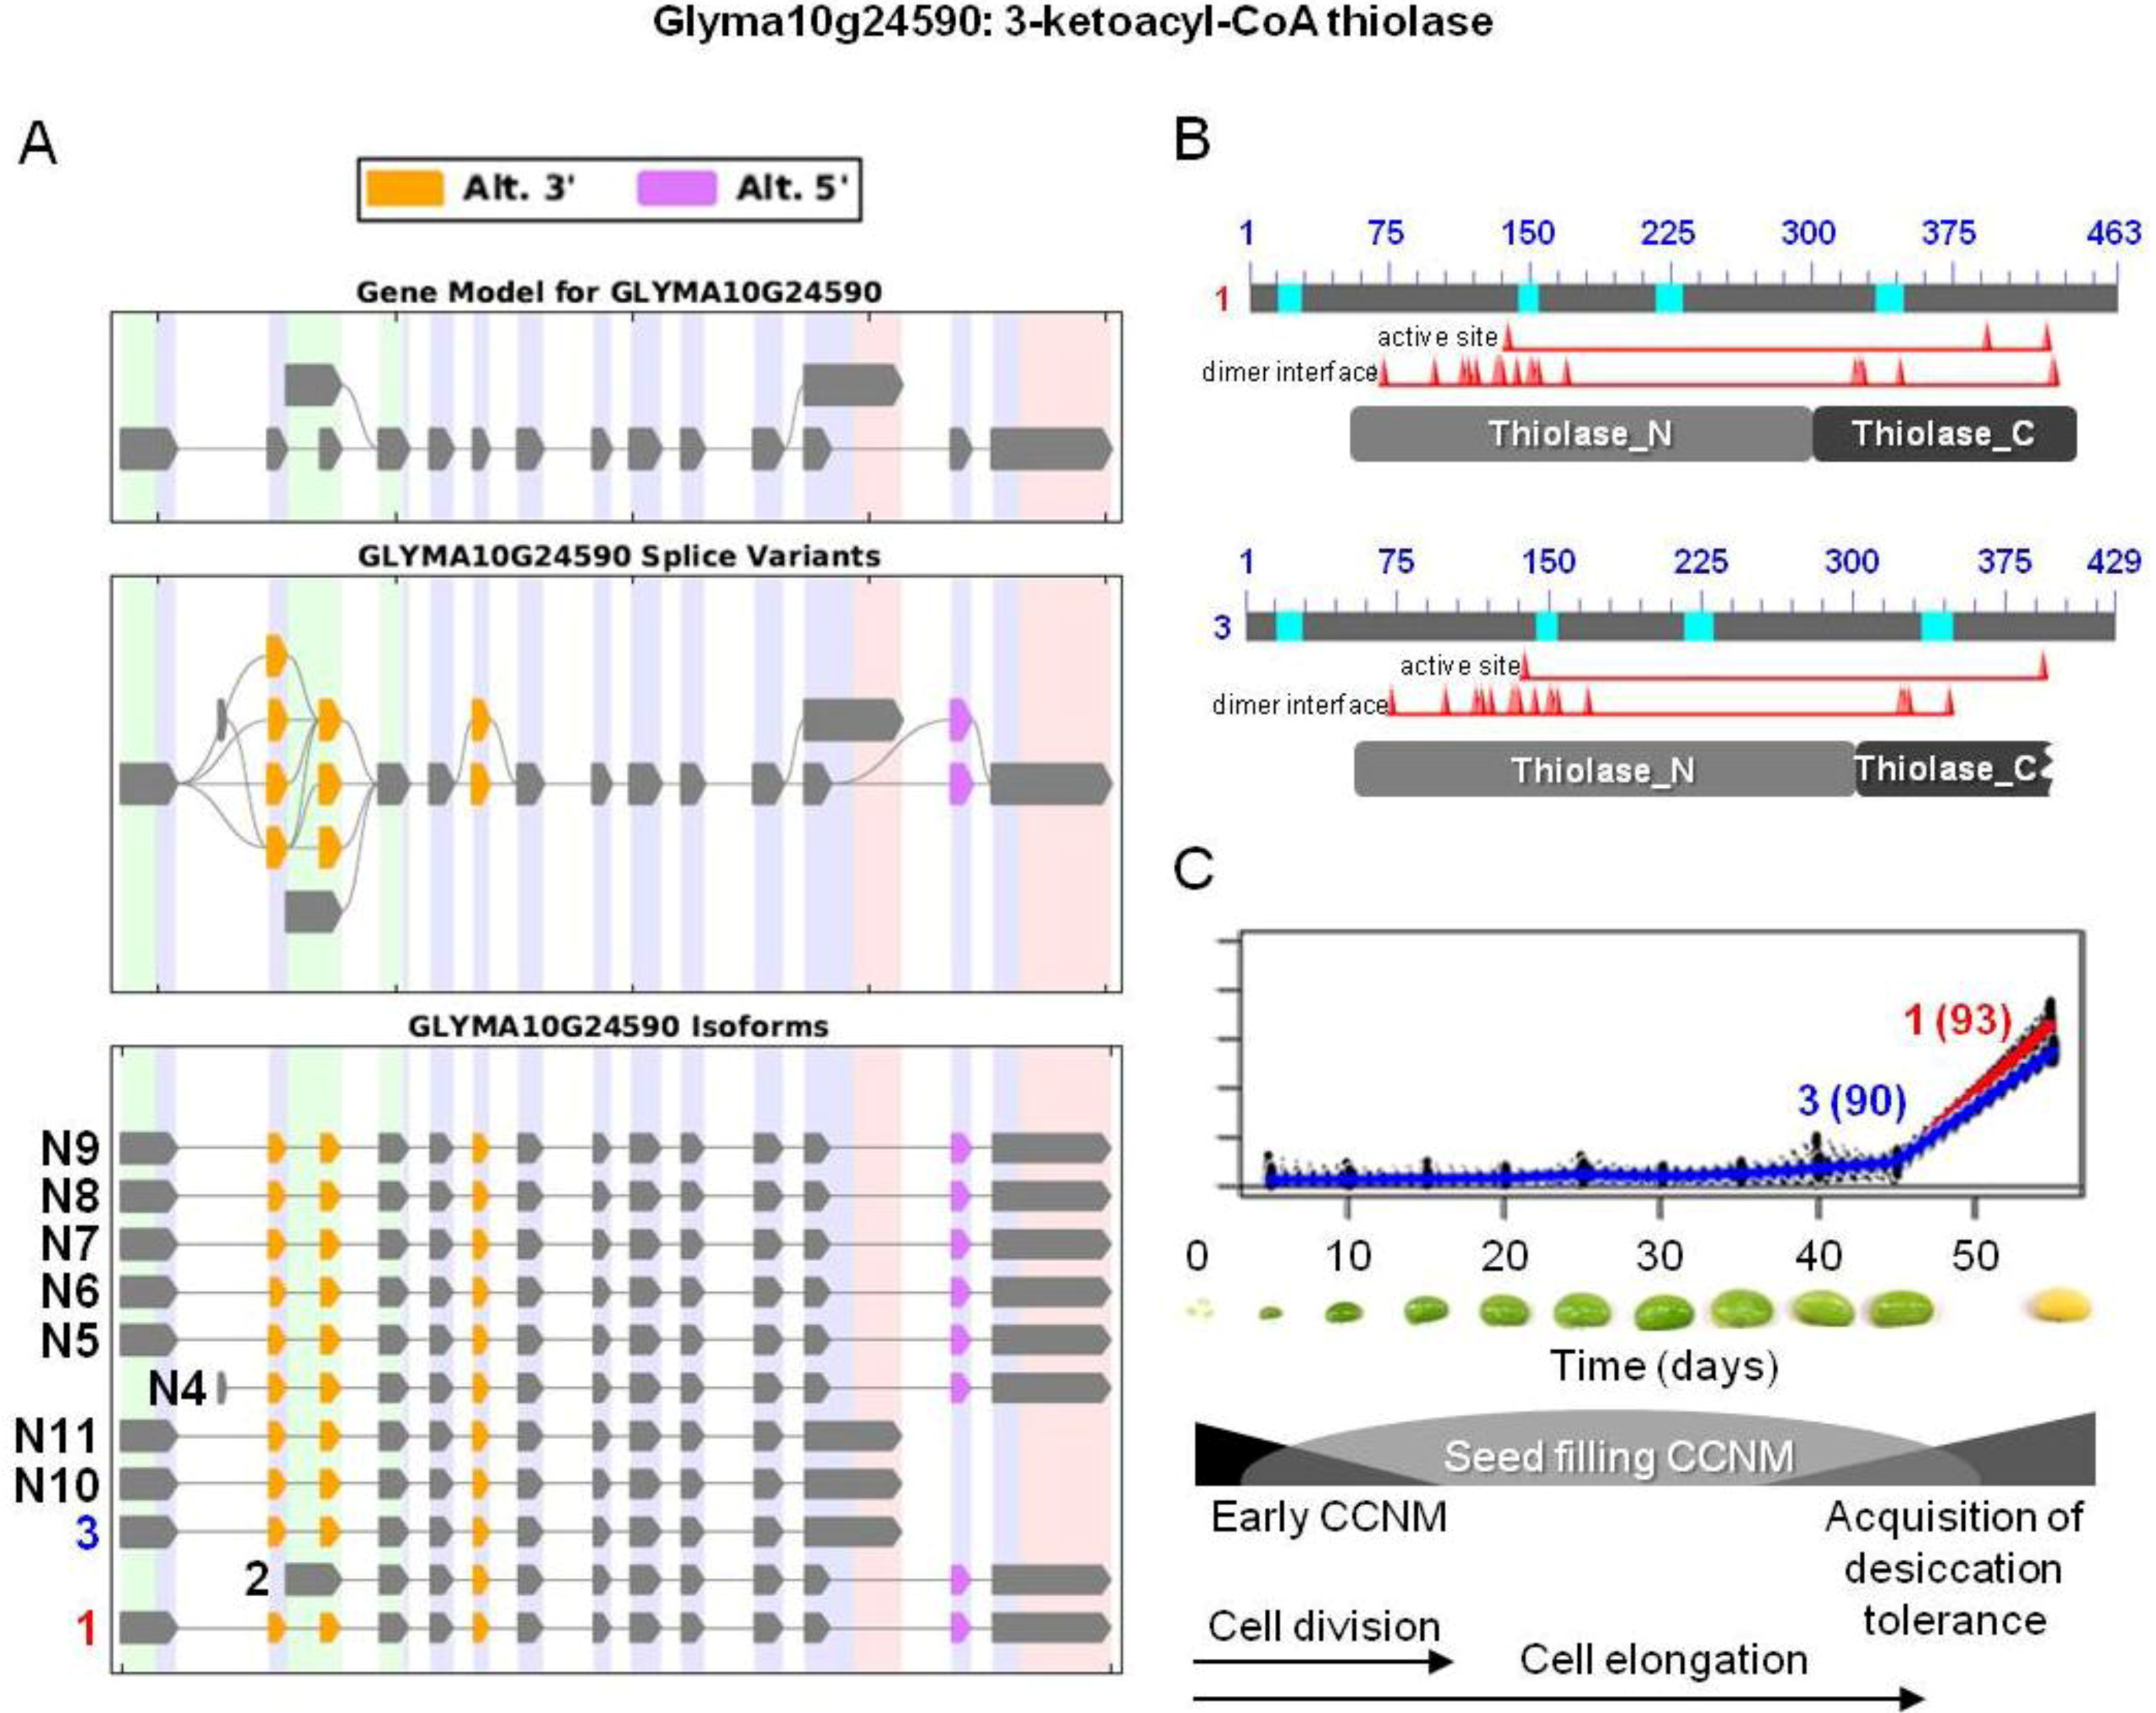
and  were the only two transcripts displaying differential expression. (B) Proteins resulting from two isoforms of interest with the respective positions of active and dimer interface sites in the N- and C-terminal thiolase domains (pfam00108 and pfam02803, respectively), showing the positions of individual amino acid residues (red triangles). Bright blue sections of the protein show the sequences that were not included in domain analysis due to an amino acid composition-related bias. (C) Overlaid expression profiles of Glyma10g24590.1 and 3 obtained from SplineCluster.
and were the only two transcripts displaying differential expression. (B) Proteins resulting from two isoforms of interest with the respective positions of active and dimer interface sites in the N- and C-terminal thiolase domains (pfam00108 and pfam02803, respectively), showing the positions of individual amino acid residues (red triangles). Bright blue sections of the protein show the sequences that were not included in domain analysis due to an amino acid composition-related bias. (C) Overlaid expression profiles of Glyma10g24590.1 and 3 obtained from SplineCluster.
were the only two transcripts displaying differential expression. (B) Proteins resulting from two isoforms of interest with the respective positions of active and dimer interface sites in the N- and C-terminal thiolase domains (pfam00108 and pfam02803, respectively), showing the positions of individual amino acid residues (red triangles). Bright blue sections of the protein show the sequences that were not included in domain analysis due to an amino acid composition-related bias. (C) Overlaid expression profiles of Glyma10g24590.1 and 3 obtained from SplineCluster.
and were the only two transcripts displaying differential expression. (B) Proteins resulting from two isoforms of interest with the respective positions of active and dimer interface sites in the N- and C-terminal thiolase domains (pfam00108 and pfam02803, respectively), showing the positions of individual amino acid residues (red triangles). Bright blue sections of the protein show the sequences that were not included in domain analysis due to an amino acid composition-related bias. (C) Overlaid expression profiles of Glyma10g24590.1 and 3 obtained from SplineCluster.
3.2.2. AS of Splicing-Associated Transcripts, Acquisition of Dormancy and Desiccation Tolerance, ABA, and Other Phytohormone-Related Events
 . The stop sign in N7 indicates a premature stop codon. (B) Proteins resulting from the two isoforms of interest, showing the respective positions of the p450 domains (pfam00067). Isoform N7 contains a truncated p450 domain. (C) Overlaid transcriptional profiles of Glyma10g24590.1 and N7 obtained from SplineCluster.
. The stop sign in N7 indicates a premature stop codon. (B) Proteins resulting from the two isoforms of interest, showing the respective positions of the p450 domains (pfam00067). Isoform N7 contains a truncated p450 domain. (C) Overlaid transcriptional profiles of Glyma10g24590.1 and N7 obtained from SplineCluster.
. The stop sign in N7 indicates a premature stop codon. (B) Proteins resulting from the two isoforms of interest, showing the respective positions of the p450 domains (pfam00067). Isoform N7 contains a truncated p450 domain. (C) Overlaid transcriptional profiles of Glyma10g24590.1 and N7 obtained from SplineCluster.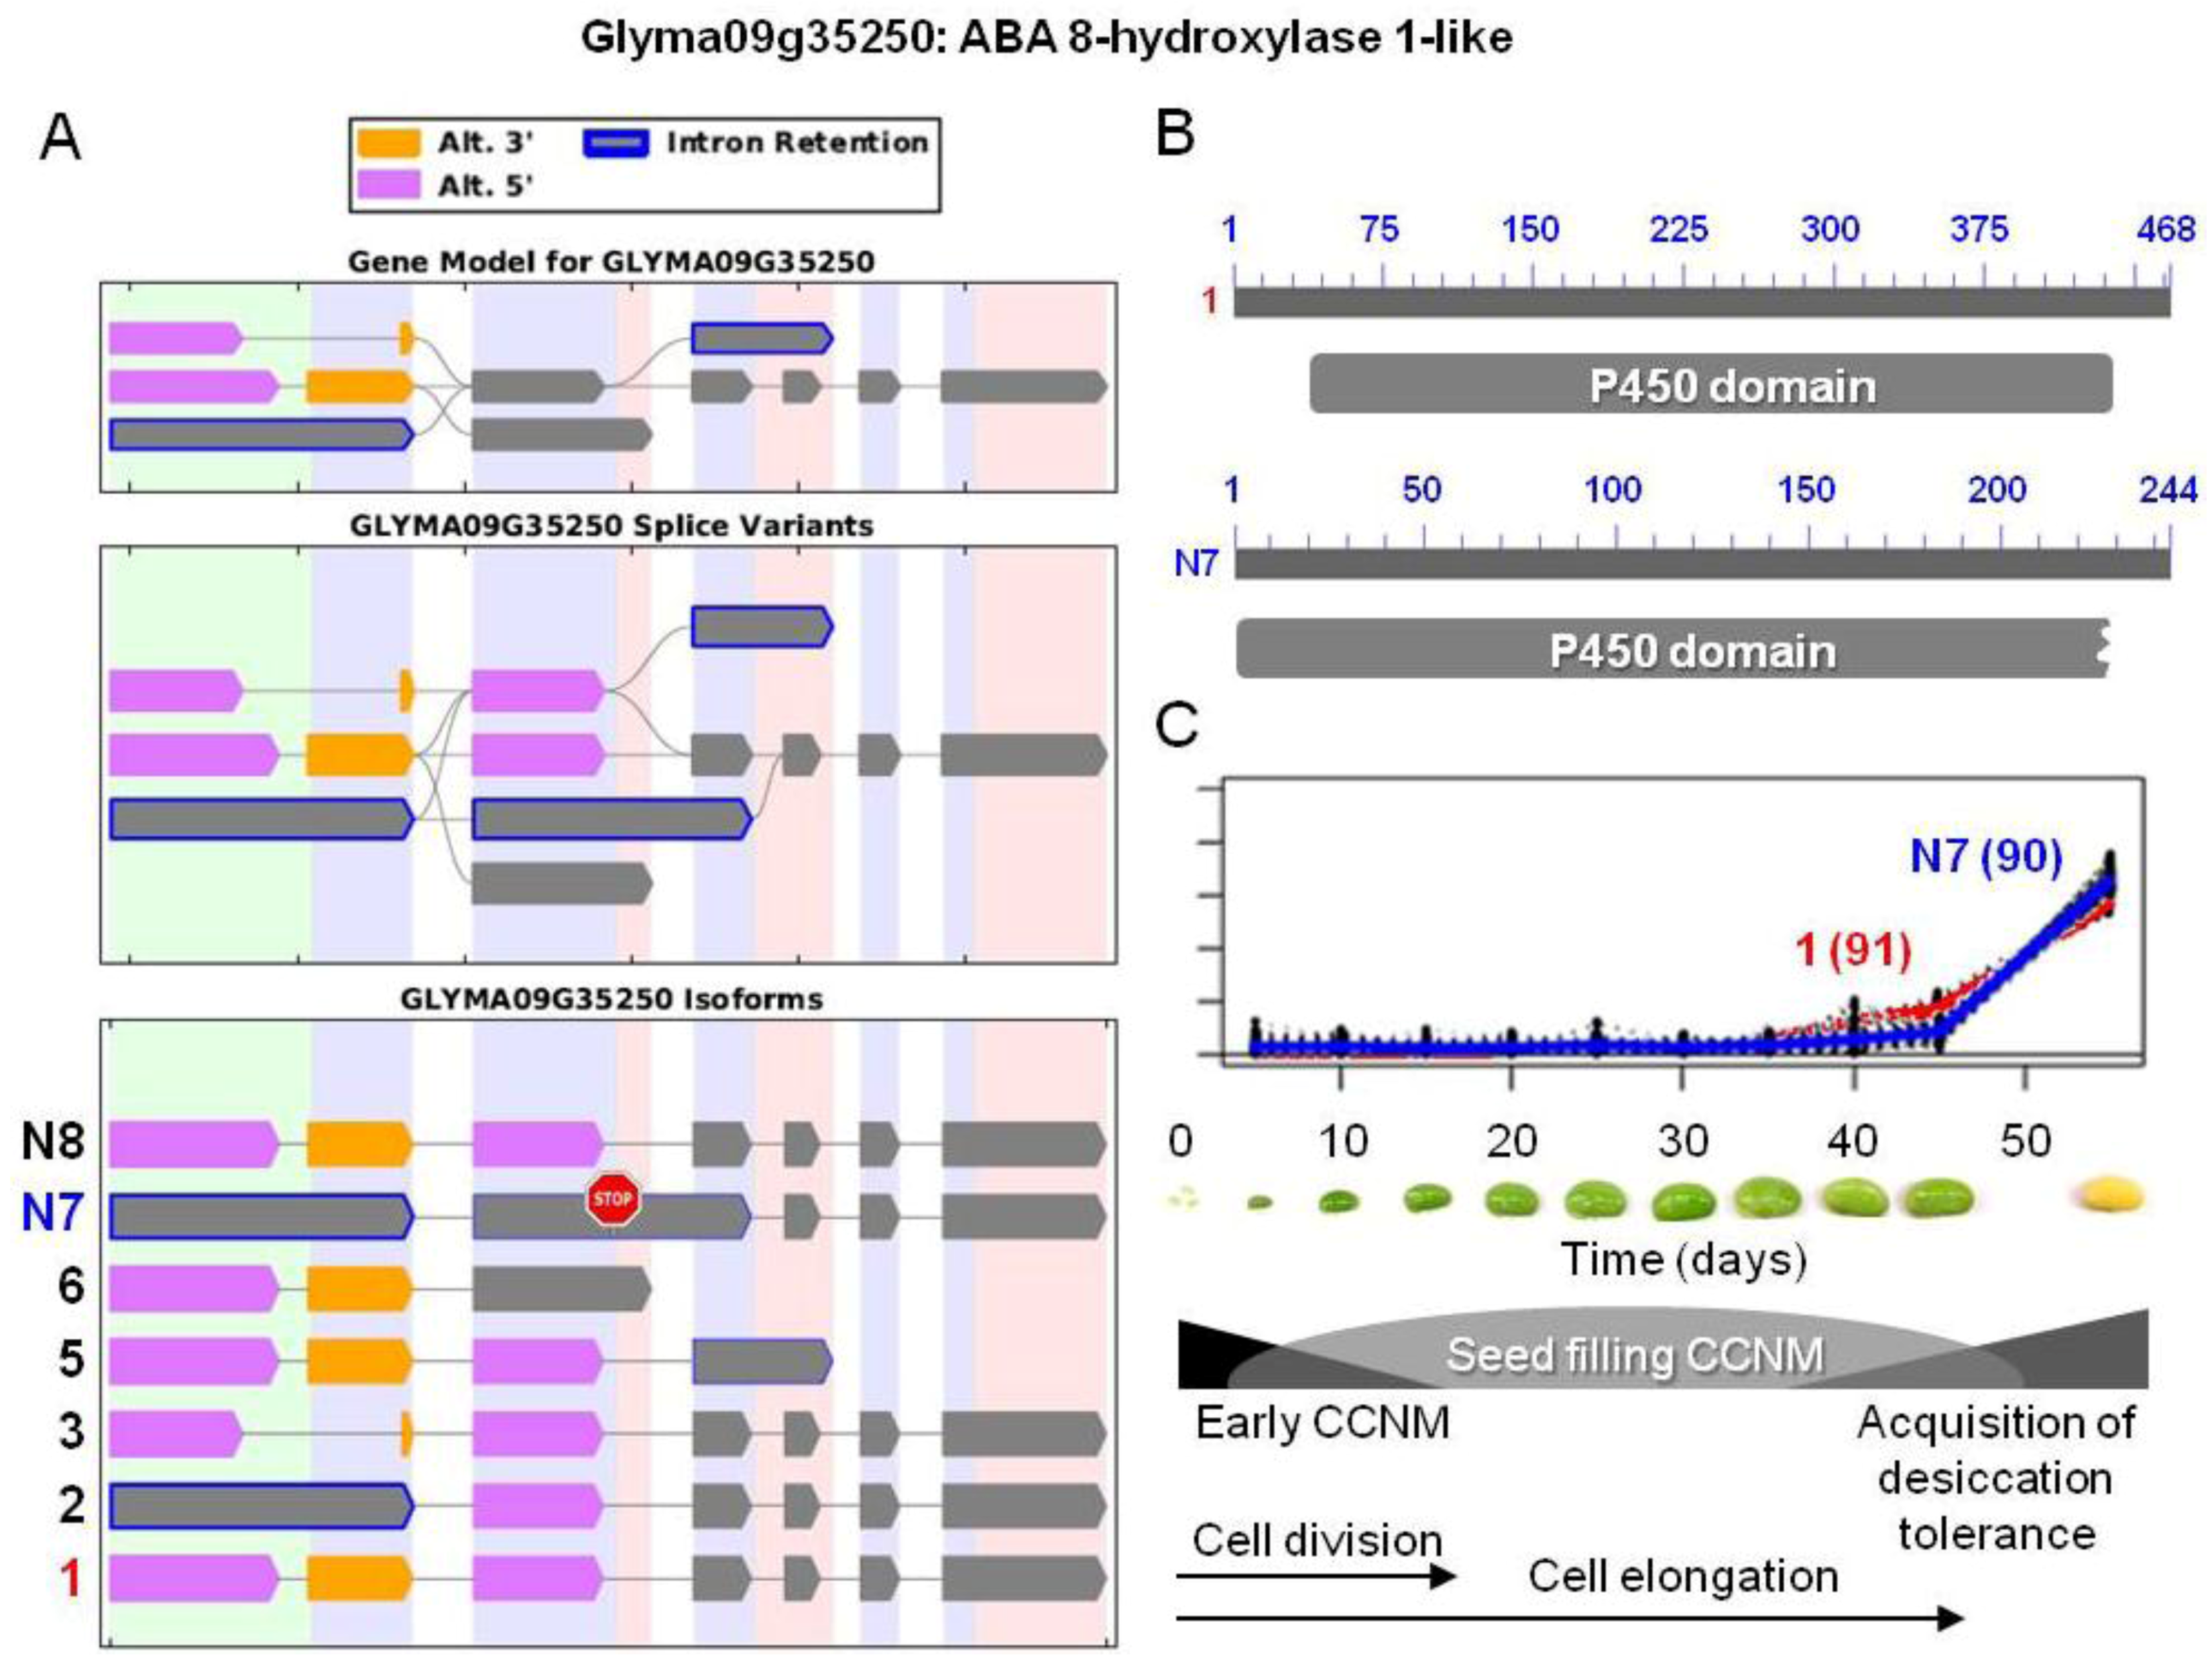
4. Conclusions
Supplementary Files
Acknowledgments
Conflicts of Interest
References
- Eastmond, P.J.; Graham, I.A. Re-examining the role of the glyoxylate cycle in oilseeds. Trends Plant Sci. 2001, 6, 72–78. [Google Scholar] [CrossRef]
- Graham, I.A. Seed storage oil mobilization. Annu. Rev. Plant Biol. 2008, 59, 115–142. [Google Scholar] [CrossRef]
- Penfield, S.; Graham, S.; Graham, I.A. Storage reserve mobilization in germinating oilseeds: Arabidopsis as a model system. Biochem. Soc. Trans. 2005, 33, 380–383. [Google Scholar] [CrossRef]
- Allen, D.K.; Ohlrogge, J.B.; Shachar-Hill, Y. The role of light in soybean seed filling metabolism. Plant J. 2009, 58, 220–234. [Google Scholar] [CrossRef]
- Allen, D.K.; Shachar-Hill, Y.; Ohlrogge, J.B. Compartment-specific labeling information in C-13 metabolic flux analysis of plants. Phytochemistry 2007, 68, 2197–2210. [Google Scholar] [CrossRef]
- Bates, P.D.; Durrett, T.P.; Ohlrogge, J.B.; Pollard, M. Analysis of acyl fluxes through multiple pathways of triacylglycerol synthesis in developing soybean embryos. Plant Physiol. 2009, 150, 55–72. [Google Scholar] [CrossRef]
- Borisjuk, L.; Nguyen, T.H.; Neuberger, T.; Rutten, T.; Tschiersch, H.; Claus, B.; Feussner, I.; Webb, A.G.; Jakob, P.; Weber, H.; et al. Gradients of lipid storage, photosynthesis and plastid differentiation in developing soybean seeds. New Phytol. 2005, 167, 761–776. [Google Scholar] [CrossRef]
- Iyer, V.V.; Sriram, G.; Fulton, D.B.; Zhou, R.; Westgate, M.E.; Shanks, J.V. Metabolic flux maps comparing the effect of temperature on protein and oil biosynthesis in developing soybean cotyledons. Plant Cell Environ. 2008, 31, 506–517. [Google Scholar] [CrossRef]
- Sriram, G.; Fulton, D.B.; Iyer, V.V.; Peterson, J.M.; Zhou, R.; Westgate, M.E.; Spalding, M.H.; Shanks, J.V. Quantification of compartmented metabolic fluxes in developing soybean embryos by employing biosynthetically directed fractional 13C labeling, two-dimensional [13C, 1H] nuclear magnetic resonance, and comprehensive isotopomer balancing. Plant Physiol. 2004, 136, 3043–3057. [Google Scholar] [CrossRef]
- Angelovici, R.; Galili, G.; Fernie, A.R.; Fait, A. Seed desiccation: A bridge between maturation and germination. Trends Plant Sci. 2010, 15, 211–218. [Google Scholar] [CrossRef]
- Blochl, A.; Grenier-de March, G.; Sourdioux, M.; Peterbauer, T.; Richter, A. Induction of raffinose oligosaccharide biosynthesis by abscisic acid in somatic embryos of alfalfa (Medicago sativa L.). Plant Sci. 2005, 168, 1075–1082. [Google Scholar] [CrossRef]
- Finkelstein, R.; Reeves, W.; Ariizumi, T.; Steber, C. Molecular aspects of seed dormancy. Annu. Rev. Plant Biol. 2008, 59, 387–415. [Google Scholar] [CrossRef]
- Gutierrez, L.; van Wuytswinkel, O.; Castelain, M.; Bellini, C. Combined networks regulating seed maturation. Trends Plant Sci. 2007, 12, 294–300. [Google Scholar]
- Barbazuk, W.B.; Fu, Y.; McGinnis, K.M. Genome-wide analyses of alternative splicing in plants: Opportunities and challenges. Genome Res. 2008, 18, 1381–1392. [Google Scholar]
- Marden, J.H. Quantitative and evolutionary biology of alternative splicing: How changing the mix of alternative transcripts affects phenotypic plasticity and reaction norms. Heredity 2008, 100, 111–120. [Google Scholar] [CrossRef]
- Severing, E.I.; van Dijk, A.D.J.; Morabito, G.; Busscher-Lange, J.; Immink, R.G.H.; van Ham, R. Predicting the impact of alternative splicing on plant MADS domain protein function. PLoS One 2012, 7, e30524. [Google Scholar]
- Syed, N.H.; Kalyna, M.; Marquez, Y.; Barta, A.; Brown, J.W.S. Alternative splicing in plants - coming of age. Trends Plant Sci. 2012, 17, 616–623. [Google Scholar] [CrossRef]
- Filichkin, S.A.; Priest, H.D.; Givan, S.A.; Shen, R.K.; Bryant, D.W.; Fox, S.E.; Wong, W.K.; Mockler, T.C. Genome-wide mapping of alternative splicing in Arabidopsis thaliana. Genome Res. 2010, 20, 45–58. [Google Scholar] [CrossRef]
- Wang, B.B.; Brendel, V. Molecular characterization and phylogeny of U2AF35 homologs in plants. Plant Physiol. 2006, 140, 624–636. [Google Scholar] [CrossRef]
- James, A.B.; Syed, N.H.; Bordage, S.; Marshall, J.; Nimmo, G.A.; Jenkins, G.I.; Herzyk, P.; Brown, J.W.S.; Nimmo, H.G. Alternative splicing mediates responses of the Arabidopsis circadian clock to temperature changes. Plant Cell 2012, 24, 961–981. [Google Scholar] [CrossRef]
- Kalyna, M.; Simpson, C.G.; Syed, N.H.; Lewandowska, D.; Marquez, Y.; Kusenda, B.; Marshall, J.; Fuller, J.; Cardle, L.; McNicol, J.; et al. Alternative splicing and nonsense-mediated decay modulate expression of important regulatory genes in Arabidopsis. Nucleic Acids Res. 2012, 40, 2454–2469. [Google Scholar] [CrossRef]
- Palusa, S.G.; Reddy, A.S.N. Extensive coupling of alternative splicing of pre-mRNAs of serine/arginine (SR) genes with nonsense-mediated decay. New Phytol. 2010, 185, 83–89. [Google Scholar] [CrossRef]
- Akhunov, E.D.; Sehgal, S.; Liang, H.Q.; Wang, S.C.; Akhunova, A.R.; Kaur, G.; Li, W.L.; Forrest, K.L.; See, D.; Simkova, H.; et al. Comparative analysis of syntenic genes in grass genomes reveals accelerated rates of gene structure and coding sequence evolution in polyploid wheat. Plant Physiol. 2013, 161, 252–265. [Google Scholar] [CrossRef]
- Zhang, G.J.; Guo, G.W.; Hu, X.D.; Zhang, Y.; Li, Q.Y.; Li, R.Q.; Zhuang, R.H.; Lu, Z.K.; He, Z.Q.; Fang, X.D.; et al. Deep RNA sequencing at single base-pair resolution reveals high complexity of the rice transcriptome. Genome Res. 2010, 20, 646–654. [Google Scholar] [CrossRef]
- Jones, M.A.; Williams, B.A.; McNicol, J.; Simpson, C.G.; Brown, J.W.S.; Harmer, S.L. Mutation of Arabidopsis SPLICEOSOMAL TIMEKEEPER LOCUS1 causes circadian clock defects. Plant Cell 2012, 24, 4066–4082. [Google Scholar] [CrossRef]
- Lightfoot, D.J.; Malone, K.M.; Timmis, J.N.; Orford, S.J. Evidence for alternative splicing of MADS-box transcripts in developing cotton fibre cells. Mol. Genet. Genomics 2008, 279, 75–85. [Google Scholar] [CrossRef]
- Martin-Trillo, M.; Grandio, E.G.; Serra, F.; Marcel, F.; Rodriguez-Buey, M.L.; Schmitz, G.; Theres, K.; Bendahmane, A.; Dopazo, H.; Cubas, P. Role of tomato BRANCHED1-like genes in the control of shoot branching. Plant J. 2011, 67, 701–714. [Google Scholar] [CrossRef]
- Matsumura, H.; Kitajima, H.; Akada, S.; Abe, J.; Minaka, N.; Takahashi, R. Molecular cloning and linkage mapping of cryptochrome multigene family in soybean. Plant Genome 2009, 2, 271–281. [Google Scholar] [CrossRef]
- Rosloski, S.M.; Singh, A.; Jali, S.S.; Balasubramanian, S.; Weigel, D.; Grbic, V. Functional analysis of splice variant expression of MADS AFFECTING FLOWERING 2 of Arabidopsis thaliana. Plant Mol. Biol. 2013, 81, 57–69. [Google Scholar] [CrossRef]
- Sanchez, S.E.; Petrillo, E.; Beckwith, E.J.; Zhang, X.; Rugnone, M.L.; Hernando, C.E.; Cuevas, J.C.; Herz, M.A.G.; Depetris-Chauvin, A.; Simpson, C.G.; et al. A methyl transferase links the circadian clock to the regulation of alternative splicing. Nature 2010, 468, 112–116. [Google Scholar] [CrossRef]
- He, Z.S.; Xie, R.; Zou, H.S.; Wang, Y.Z.; Zhu, H.B.; Yu, G.Q. Structure and alternative splicing of a heat shock transcription factor gene, MsHSF1, in Medicago sativa. Biochem. Biophys. Res. Comm. 2007, 364, 1056–1061. [Google Scholar] [CrossRef]
- Hirayama, T.; Shinozaki, K. Research on plant abiotic stress responses in the post-genome era: Past, present and future. Plant J. 2010, 61, 1041–1052. [Google Scholar] [CrossRef]
- Jia, F.; Rock, C.D. MIR846 and MIR842 comprise a cistronic MIRNA pair that is regulated by abscisic acid by alternative splicing in roots of Arabidopsis. Plant Mol. Biol. 2013, 81, 447–460. [Google Scholar] [CrossRef]
- Mastrangelo, A.M.; Marone, D.; Laido, G.; de Leonardis, A.M.; de Vita, P. Alternative splicing: Enhancing ability to cope with stress via transcriptome plasticity. Plant Sci. 2012, 185, 40–49. [Google Scholar]
- Matsukura, S.; Mizoi, J.; Yoshida, T.; Todaka, D.; Ito, Y.; Maruyama, K.; Shinozaki, K.; Yamaguchi-Shinozaki, K. Comprehensive analysis of rice DREB2-type genes that encode transcription factors involved in the expression of abiotic stress-responsive genes. Mol. Genet. Genomics 2010, 283, 185–196. [Google Scholar] [CrossRef]
- Mazzucotelli, E.; Mastrangelo, A.A.; Crosatti, C.; Guerra, D.; Stanca, A.M.; Cattivelli, L. Abiotic stress response in plants: When post-transcriptional and post-translational regulations control transcription. Plant Sci. 2008, 174, 420–431. [Google Scholar] [CrossRef]
- Staiger, D.; Korneli, C.; Lummer, M.; Navarro, L. Emerging role for RNA-based regulation in plant immunity. New Phytol. 2013, 197, 394–404. [Google Scholar] [CrossRef]
- DeRidder, B.P.; Shybut, M.E.; Dyle, M.C.; Kremling, K.A.G.; Shapiro, M.B. Changes at the 3'-untranslated region stabilize Rubisco activase transcript levels during heat stress in Arabidopsis. Planta 2012, 236, 463–476. [Google Scholar] [CrossRef]
- Brummell, D.A.; Chen, R.K.Y.; Harris, J.C.; Zhang, H.B.; Hamiaux, C.; Kralicek, A.V.; McKenzie, M.J. Induction of vacuolar invertase inhibitor mRNA in potato tubers contributes to cold-induced sweetening resistance and includes spliced hybrid mRNA variants. J. Exp. Bot. 2011, 62, 3519–3534. [Google Scholar]
- Hasse, D.; Mikkat, S.; Hagemann, M.; Bauwe, H. Alternative splicing produces an H-protein with better substrate properties for the P-protein of glycine decarboxylase. FEBS J. 2009, 276, 6985–6991. [Google Scholar] [CrossRef]
- Dixon, D.P.; Hawkins, T.; Hussey, P.J.; Edwards, R. Enzyme activities and subcellular localization of members of the Arabidopsis glutathione transferase superfamily. J. Exp. Bot. 2009, 60, 1207–1218. [Google Scholar] [CrossRef]
- Kriechbaumer, V.; Wang, P.W.; Hawes, C.; Abell, B.M. Alternative splicing of the auxin biosynthesis gene YUCCA4 determines its subcellular compartmentation. Plant J. 2012, 70, 292–302. [Google Scholar] [CrossRef]
- Lamberto, I.; Percudani, R.; Gatti, R.; Folli, C.; Petrucco, S. Conserved alternative splicing of Arabidopsis transthyretin-like determines protein localization and S-allantoin synthesis in peroxisomes. Plant Cell 2010, 22, 1564–1574. [Google Scholar] [CrossRef]
- Puyaubert, J.; Denis, L.; Alban, C. Dual targeting of Arabidopsis holocarboxylase synthetase1: A small upstream open reading frame regulates translation initiation and protein targeting. Plant Physiol. 2008, 146, 478–491. [Google Scholar] [CrossRef]
- Wiszniewski, A.A.; Smith, S.M.; Bussell, J.D. Conservation of two lineages of peroxisomal (Type I) 3-ketoacyl-CoA thiolases in land plants, specialization of the genes in Brassicaceae, and characterization of their expression in I. J. Exp. Bot. 2012, 63, 6093–6103. [Google Scholar] [CrossRef]
- Roman, A.; Andreu, V.; Hernandez, M.L.; Lagunas, B.; Picorel, R.; Martinez-Rivas, J.M.; Alfonso, M. Contribution of the different omega-3 fatty acid desaturase genes to the cold response in soybean. J. Exp. Bot. 2012, 63, 4973–4982. [Google Scholar] [CrossRef]
- Fouquet, R.; Martin, F.; Fajardo, D.S.; Gault, C.M.; Gomez, E.; Tseung, C.W.; Policht, T.; Hueros, G.; Settles, A.M. Maize rough endosperm3 encodes an RNA splicing factor required for endosperm cell differentiation and has a nonautonomous effect on embryo development. Plant Cell 2011, 23, 4280–4297. [Google Scholar] [CrossRef]
- Sugliani, M.; Brambilla, V.; Clerkx, E.J.M.; Koornneef, M.; Soppe, W.J.J. The conserved splicing factor SUA controls alternative splicing of the developmental regulator ABI3 in Arabidopsis. Plant Cell 2010, 22, 1936–1946. [Google Scholar] [CrossRef]
- Penfield, S.; Josse, E.M.; Halliday, K.J. A role for an alternative splice variant of PIF6 in the control of Arabidopsis primary seed dormancy. Plant Mol. Biol. 2010, 73, 89–95. [Google Scholar] [CrossRef]
- Gechev, T.S.; Dinakar, C.; Benina, M.; Toneva, V.; Bartels, D. Molecular mechanisms of desiccation tolerance in resurrection plants. Cell. Mol. Life Sci. 2012, 69, 3175–3186. [Google Scholar] [CrossRef]
- Buitink, J.; Leger, J.J.; Guisle, I.; Vu, B.L.; Wuilleme, S.; Lamirault, G.; Le Bars, A.; Le Meur, N.; Becker, A.; Kuster, H.; et al. Transcriptome profiling uncovers metabolic and regulatory processes occurring during the transition from desiccation-sensitive to desiccation-tolerant stages in Medicago truncatula seeds. Plant J. 2006, 47, 735–750. [Google Scholar] [CrossRef]
- Grene, R.; Vasquez-Robinet, C.; Bohnert, H.J. Molecular Biology and Physiological Genomics of Dehydration Stress. In Plant Desiccation Tolerance; Luttge, U., Beck, E., Bartels, D., Eds.; Springer: New York, NY, USA, 2011; Volume 215, pp. 255–287. [Google Scholar]
- Collakova, E.; Aghamirzaie, D.; Fang, Y.; Klumas, C.; Tabataba, F.; Kakumanu, A.; Myers, E.; Heath, L.; Grene, R. Metabolic and transcriptional reprogramming in developing soybean (Glycine max) embryos. Metabolites 2013, 3, 347–372. [Google Scholar]
- Schmutz, J.; Cannon, S.B.; Schlueter, J.; Ma, J.; Mitros, T.; Nelson, W.; Hyten, D.L.; Song, Q.; Thelen, J.J.; Cheng, J.; et al. Genome sequence of the palaeopolyploid soybean. Nature 2010, 463, 178–183. [Google Scholar] [CrossRef]
- Phytozome v9.1: Glycine Max v1.1. Available online: http://www.phytozome.net/soybean.php/ (accessed on 15 May 2013).
- Goodstein, D.M.; Shu, S.Q.; Howson, R.; Neupane, R.; Hayes, R.D.; Fazo, J.; Mitros, T.; Dirks, W.; Hellsten, U.; Putnam, N.; et al. Phytozome: A comparative platform for green plant genomics. Nucleic Acids Res. 2012, 40, D1178–D1186. [Google Scholar] [CrossRef]
- Trapnell, C.; Pachter, L.; Salzberg, S.L. TopHat: Discovering splice junctions with RNA-Seq. Bioinformatics 2009, 25, 1105–1111. [Google Scholar] [CrossRef]
- Trapnell, C.; Williams, B.A.; Pertea, G.; Mortazavi, A.; Kwan, G.; van Baren, M.J.; Salzberg, S.L.; Wold, B.J.; Pachter, L. Transcript assembly and quantification by RNA-Seq reveals unannotated transcripts and isoform switching during cell differentiation. Nat. Biotechnol. 2010, 28, 511–515. [Google Scholar] [CrossRef]
- Roberts, A.; Pimentel, H.; Trapnell, C.; Pachter, L. Identification of novel transcripts in annotated genomes using RNA-Seq. Bioinformatics 2011, 27, 2325–2329. [Google Scholar] [CrossRef]
- Trapnell, C.; Hendrickson, D.G.; Sauvageau, M.; Goff, L.; Rinn, J.L.; Pachter, L. Differential analysis of gene regulation at transcript resolution with RNA-seq. Nat. Biotechnol. 2012, 31, 46–53. [Google Scholar]
- Rogers, M.F.; Thomas, J.; Reddy, A.S.; Ben-Hur, A. SpliceGrapher: Detecting patterns of alternative splicing from RNA-Seq data in the context of gene models and EST data. Genome Biol. 2012, 13, R4. [Google Scholar] [CrossRef]
- Anders, S.; Reyes, A.; Huber, W. Detecting differential usage of exons from RNA-seq data. Genome Res. 2012, 22, 2008–2017. [Google Scholar] [CrossRef]
- Cufflinks: Transcript Assembly, Differential Expression, and Differential Regulation for RNA-Seq. Available online: http://cufflinks.cbcb.umd.edu/manual.html#class_codes/ (accessed on 25 May 2013).
- Heard, N.A.; Holmes, C.C.; Stephens, D.A.; Hand, D.J.; Dimopoulos, G. Bayesian coclustering of Anopheles gene expression time series: Study of immune defense response to multiple experimental challenges. Proc. Natl. Acad. Sci. USA 2005, 102, 16939–16944. [Google Scholar]
- Bauer, S.; Grossmann, S.; Vingron, M.; Robinson, P.N. Ontologizer 2.0—A multifunctional tool for GO term enrichment analysis and data exploration. Bioinformatics 2008, 24, 1650–1651. [Google Scholar] [CrossRef]
- Ashburner, M.; Ball, C.A.; Blake, J.A.; Botstein, D.; Butler, H.; Cherry, J.M.; Davis, A.P.; Dolinski, K.; Dwight, S.S.; Eppig, J.T.; et al. Gene ontology: Tool for the unification of biology. The Gene Ontology Consortium. Nat. Genet. 2000, 25, 25–29. [Google Scholar] [CrossRef]
- Livak, K.J.; Schmittgen, T.D. Analysis of relative gene expression data using real-time quantitative PCR and the 2−DDCT method. Methods 2001, 25, 402–408. [Google Scholar]
- Schmid, M.; Davison, T.S.; Henz, S.R.; Pape, U.J.; Demar, M.; Vingron, M.; Scholkopf, B.; Weigel, D.; Lohmann, J.U. A gene expression map of Arabidopsis thaliana development. Nat. Genet. 2005, 37, 501–506. [Google Scholar] [CrossRef]
- Grant, D.; Nelson, R.T.; Cannon, S.B.; Shoemaker, R.C. SoyBase, the USDA-ARS soybean genetics and genomics database. Nucleic Acids Res. 2010, 38, D843–D846. [Google Scholar] [CrossRef]
- TAIR10. Available online: http://www.arabidopsis.org/portals/genAnnotation/gene_structural_annotation/annotation_data.jsp/ (accessed on 30 October 2013).
- SoyBase. Available online: http://soybase.org/ (accessed on 15 May 2013).
- Shu, K.; Zhang, H.; Wang, S.; Chen, M.; Wu, Y.; Tang, S.; Liu, C.; Feng, Y.; Cao, X.; Xie, Q. ABI4 regulates primary seed dormancy by regulating the biogenesis of abscisic acid and gibberellins in Arabidopsis. PLoS Genet. 2013, 9, e1003577. [Google Scholar] [CrossRef]
- Liu, X.; Zhang, H.; Zhao, Y.; Feng, Z.; Li, Q.; Yang, H.Q.; Luan, S.; Li, J.; He, Z.H. Auxin controls seed dormancy through stimulation of abscisic acid signaling by inducing ARF-mediated ABI3 activation in Arabidopsis. Proc. Natl. Acad. Sci. USA 2013, 110, 15485–15490. [Google Scholar]
- Duque, P. A role for SR proteins in plant stress responses. Plant Signal. Behav. 2011, 6, 49–54. [Google Scholar] [CrossRef]
- Collakova, E.; Yen, J.Y.; Senger, R.S. Are we ready for genome-scale modeling in plants? Plant Sci. 2012, 191–192, 53–70. [Google Scholar] [CrossRef]
- Dal’Molin, C.G.; Quek, L.E.; Palfreyman, R.W.; Brumbley, S.M.; Nielsen, L.K. AraGEM, a genome-scale reconstruction of the primary metabolic network in Arabidopsis. Plant Physiol. 2010, 152, 579–589. [Google Scholar]
- Dal’Molin, C.G.; Quek, L.E.; Palfreyman, R.W.; Brumbley, S.M.; Nielsen, L.K. C4GEM, a genome-scale metabolic model to study C4 plant metabolism. Plant Physiol. 2010, 154, 1871–1885. [Google Scholar] [CrossRef]
- Saha, R.; Suthers, P.F.; Maranas, C.D. Zea mays iRS1563: A comprehensive genome-scale metabolic reconstruction of maize metabolism. PLoS One 2011, 6, e21784. [Google Scholar]
- Baud, S.; Boutin, J.P.; Miquel, M.; Lepiniec, L.; Rochat, C. An integrated overview of seed development in Arabidopsis thaliana ecotype WS. Plant Physiol. Biochem. 2002, 40, 151–160. [Google Scholar] [CrossRef]
- Chia, T.Y.; Pike, M.J.; Rawsthorne, S. Storage oil breakdown during embryo development of Brassica napus (L.). J. Exp. Bot. 2005, 56, 1285–1296. [Google Scholar] [CrossRef]
- Bogamuwa, S.; Jang, J.C. The Arabidopsis tandem CCCH zinc finger proteins AtTZF4, 5 and 6 are involved in light-, abscisic acid- and gibberellic acid- mediated regulation of seed germination. Plant Cell Environ. 2013, 36, 1507–1519. [Google Scholar] [CrossRef]
- Davies, E.; Stankovic, B.; Vian, A.; Wood, A.J. Where has all the message gone? Plant Sci. 2012, 185, 23–32. [Google Scholar]
- Nakabayashi, K.; Okamoto, M.; Koshiba, T.; Kamiya, Y.; Nambara, E. Genome-wide profiling of stored mRNA in Arabidopsis thaliana seed germination: Epigenetic and genetic regulation of transcription in seed. Plant J. 2005, 41, 697–709. [Google Scholar] [CrossRef]
- Xu, J.; Chua, N.H. Arabidopsis decapping 5 is required for mRNA decapping, P-body formation, and translational repression during postembryonic development. Plant Cell 2009, 21, 3270–3279. [Google Scholar] [CrossRef]
- Rajjou, L.; Duval, M.; Gallardo, K.; Catusse, J.; Bally, J.; Job, C.; Job, D. Seed germination and vigor. Annu. Rev. Plant Biol. 2012, 63, 507–533. [Google Scholar] [CrossRef]
- Chipman, D.M.; Shaanan, B. The ACT domain family. Curr. Opin. Struct. Biol. 2001, 11, 694–700. [Google Scholar] [CrossRef]
- Liberles, J.S.; Thorolfson, M.; Martinez, A. Allosteric mechanisms in ACT domain containing enzymes involved in amino acid metabolism. Amino Acids 2005, 28, 1–12. [Google Scholar] [CrossRef]
- Grant, G.A. The ACT domain: A small molecule binding domain and its role as a common regulatory element. J. Biol. Chem. 2006, 281, 33825–33829. [Google Scholar] [CrossRef]
- Sung, T.Y.; Chung, T.Y.; Hsu, C.P.; Hsieh, M.H. The ACR11 encodes a novel type of chloroplastic ACT domain repeat protein that is coordinately expressed with GLN2 in Arabidopsis. BMC Plant Biol. 2011, 11, 118–128. [Google Scholar] [CrossRef]
- Hsieh, M.H.; Goodman, H.M. Molecular characterization of a novel gene family encoding ACT domain repeat proteins in Arabidopsis. Plant Physiol. 2002, 130, 1797–1806. [Google Scholar] [CrossRef]
- Delmas, F.; Sankaranarayanan, S.; Deb, S.; Widdup, E.; Bournonville, C.; Bollier, N.; Northey, J.G.; McCourt, P.; Samuel, M.A. ABI3 controls embryo degreening through Mendel’s I locus. Proc. Natl. Acad. Sci. USA 2013, 110, E3888–E3894. [Google Scholar] [CrossRef]
- Nakajima, S.; Ito, H.; Tanaka, R.; Tanaka, A. Chlorophyll b reductase plays an essential role in maturation and storability of Arabidopsis seeds. Plant Physiol. 2012, 160, 261–273. [Google Scholar] [CrossRef]
- Munier-Jolain, N.G.; Munier-Jolain, N.M.; Roche, R.; Ney, B.; Duthion, C. Seed growth rate in grain legumes—I. Effect of photoassimilate availability on seed growth rate. J. Exp. Bot. 1998, 49, 1963–1969. [Google Scholar]
- Strijbis, K.; van den Burg, J.; Visser, W.F.; van den Berg, M.; Distel, B. Alternative splicing directs dual localization of Candida albicans 6-phosphogluconate dehydrogenase to cytosol and peroxisomes. FEMS Yeast Res. 2012, 12, 61–68. [Google Scholar] [CrossRef]
- Schwender, J.; Goffman, F.; Ohlrogge, J.B.; Shachar-Hill, Y. Rubisco without the Calvin cycle improves the carbon efficiency of developing green seeds. Nature 2004, 432, 779–782. [Google Scholar] [CrossRef]
- Corpas, F.J.; Barroso, J.B.; Sandalio, L.M.; Distefano, S.; Palma, J.M.; Lupianez, J.A.; Del Rio, L.A. A dehydrogenase-mediated recycling system of NADPH in plant peroxisomes. Biochem. J. 1998, 330, 777–784. [Google Scholar]
- NCBI: The National Center for Biotechnology Information. Available online: http://www.ncbi.nlm.nih.gov/ (accessed on 23 September 2013).
- Li-Beisson, Y.; Shorrosh, B.; Beisson, F.; Andersson, M.X.; Arondel, V.; Bates, P.D.; Baud, S.; Bird, D.; Debono, A.; Durrett, T.P.; et al. Acyl-lipid metabolism. Arabidopsis Book 2013, 11, e0161. [Google Scholar] [CrossRef]
- Kunz, H.H.; Scharnewski, M.; Feussner, K.; Feussner, I.; Flugge, U.I.; Fulda, M.; Gierth, M. The ABC transporter PXA1 and peroxisomal beta-oxidation are vital for metabolism in mature leaves of Arabidopsis during extended darkness. Plant Cell 2009, 21, 2733–2749. [Google Scholar] [CrossRef]
- Yang, Z.; Ohlrogge, J.B. Turnover of fatty acids during natural senescence of Arabidopsis, Brachypodium, and switchgrass and in Arabidopsis beta-oxidation mutants. Plant Physiol. 2009, 150, 1981–1989. [Google Scholar] [CrossRef]
- Jiang, T.; Zhang, X.F.; Wang, X.F.; Zhang, D.P. Arabidopsis 3-ketoacyl-CoA thiolase-2 (KAT2), an enzyme of fatty acid beta-oxidation, is involved in ABA signal transduction. Plant Cell Physiol. 2011, 52, 528–538. [Google Scholar] [CrossRef]
- Li, W.F.; Lin, W.D.; Ray, P.; Lan, P.; Schmidt, W. Genome-wide detection of condition-sensitive alternative splicing in Arabidopsis roots. Plant Physiol. 2013, 162, 1750–1763. [Google Scholar] [CrossRef]
- Palusa, S.G.; Ali, G.S.; Reddy, A.S. Alternative splicing of pre-mRNAs of Arabidopsis serine/arginine-rich proteins: Regulation by hormones and stresses. Plant J. 2007, 49, 1091–1107. [Google Scholar] [CrossRef]
- Verdier, J.; Lalanne, D.; Pelletier, S.; Torres-Jerez, I.; Righetti, K.; Bandyopadhyay, K.; Leprince, O.; Chatelain, E.; Ly Vu, B.; Gouzy, J.; et al. A regulatory network-based approach dissects late maturation processes related to the acquisition of desiccation tolerance and longevity of Medicago truncatula seeds. Plant Physiol. 2013, 163, 757–774. [Google Scholar] [CrossRef]
- Lorkovic, Z.J.; Lopato, S.; Pexa, M.; Lehner, R.; Barta, A. Interactions of Arabidopsis RS domain containing cyclophilins with SR proteins and U1 and U11 small nuclear ribonucleoprotein-specific proteins suggest their involvement in pre-mRNA splicing. J. Biol. Chem. 2004, 279, 33890–22898. [Google Scholar]
- Lucidchart. Available online: https://www.lucidchart.com/ (accessed on 10 September 2013).
- Kapazoglou, A.; Engineer, C.; Drosou, V.; Kalloniati, C.; Tani, E.; Tsaballa, A.; Kouri, E.D.; Ganopoulos, I.; Flemetakis, E.; Tsaftaris, A.S. The study of two barley type I-like MADS-box genes as potential targets of epigenetic regulation during seed development. BMC Plant Biol. 2012, 12, 166. [Google Scholar] [CrossRef]
- Arc, E.; Sechet, J.; Corbineau, F.; Rajjou, L.; Marion-Poll, A. ABA crosstalk with ethylene and nitric oxide in seed dormancy and germination. Front. Plant Sci. 2013, 4, 63. [Google Scholar]
- Chauhan, H.; Khurana, N.; Agarwal, P.; Khurana, P. Heat shock factors in rice (Oryza sativa L.): Genome-wide expression analysis during reproductive development and abiotic stress. Mol. Genet. Genomics 2011, 286, 171–187. [Google Scholar] [CrossRef]
© 2013 by the authors; licensee MDPI, Basel, Switzerland. This article is an open access article distributed under the terms and conditions of the Creative Commons Attribution license (http://creativecommons.org/licenses/by/3.0/).
Share and Cite
Aghamirzaie, D.; Nabiyouni, M.; Fang, Y.; Klumas, C.; Heath, L.S.; Grene, R.; Collakova, E. Changes in RNA Splicing in Developing Soybean (Glycine max) Embryos. Biology 2013, 2, 1311-1337. https://doi.org/10.3390/biology2041311
Aghamirzaie D, Nabiyouni M, Fang Y, Klumas C, Heath LS, Grene R, Collakova E. Changes in RNA Splicing in Developing Soybean (Glycine max) Embryos. Biology. 2013; 2(4):1311-1337. https://doi.org/10.3390/biology2041311
Chicago/Turabian StyleAghamirzaie, Delasa, Mahdi Nabiyouni, Yihui Fang, Curtis Klumas, Lenwood S. Heath, Ruth Grene, and Eva Collakova. 2013. "Changes in RNA Splicing in Developing Soybean (Glycine max) Embryos" Biology 2, no. 4: 1311-1337. https://doi.org/10.3390/biology2041311
APA StyleAghamirzaie, D., Nabiyouni, M., Fang, Y., Klumas, C., Heath, L. S., Grene, R., & Collakova, E. (2013). Changes in RNA Splicing in Developing Soybean (Glycine max) Embryos. Biology, 2(4), 1311-1337. https://doi.org/10.3390/biology2041311