Chitosan as a Coupling Agent for Phosphate Glass Fibre/Polycaprolactone Composites
by
 , ,
, ,
Chao Tan
1,2 ,
,
Chris Rudd
2,3,
Andrew Parsons
3,
Nusrat Sharmin
2,
Junxiao Zhang
2,
Wanru Chen
1,2 and
Ifty Ahmed
4,* 1
International Doctoral Innovation Centre, University of Nottingham Ningbo China, Ningbo 315100, China
2
Ningbo Nottingham New Materials Institute, University of Nottingham Ningbo China, Ningbo 315100, China
3
Composites Research Group, Healthcare Technologies, Faculty of Engineering, University of Nottingham, Nottingham NG7 2RD, UK
4
Advanced Materials Research Group, Healthcare Technologies, Faculty of Engineering, University of Nottingham, Nottingham NG7 2RD, UK
*
Author to whom correspondence should be addressed.
Fibers 2018, 6(4), 97; https://doi.org/10.3390/fib6040097
Submission received: 5 November 2018
/
Revised: 28 November 2018
/
Accepted: 30 November 2018
/
Published: 10 December 2018
(This article belongs to the Special Issue Glass Fibers 2018)
Abstract
:This study shows that chitosan (CS) could be highly useful as a coupling agent in phosphate glass fibre/polycaprolactone (PGF/PCL) composites, as it improved the interfacial shear strength by up to 78%. PGFs of the composition 45P2O5–5B2O3–5Na2O–24CaO–10MgO–11Fe2O3 were dip-coated with CS (with a degree of deacetylation >80%) dissolved in acetic acid solution (2% v/v). Different CS concentrations (3–9 g L−1) and coating processes were investigated. Tensile and fragmentation tests were conducted to obtain the mechanical properties of the single fibres and interfacial properties of the PGF/PCL composites, respectively. It was observed that post-cleaning, the treated fibres had their tensile strength reduced by around 20%; however, the CS-coated fibres experienced strength increases of up to 1.1–11.5%. TGA and SEM analyses were used to confirm the presence of CS on the fibre surface. FTIR, Raman, and X-ray photoelectron spectroscopy (XPS) analyses further confirmed the presence of CS and indicated the protonation of CS amine groups. Moreover, the nitrogen spectrum of XPS demonstrated a minimum threshold of CS coating required to provide an improved interface.
1. Introduction
Much work so far has focused on phosphate glass fibre (PGF)-reinforced polymers as a substitute for metal implants in bone tissue engineering, in order to achieve sufficient mechanical properties, biodegradability, and biocompatibility [1,2]. Moreover, fibre-reinforced composites present high stiffness and strength per weight when compared with other structural materials, along with adequate toughness. The reinforcement of resins with short or long fibres has multiple applications in various biomedical fields, especially in medicine [3] and dentistry [4]. However, the application of polymer composites, such as PGF/PCL, is limited by the rapid loss of their strength profiles after exposure to an aqueous physiological environment, which has been suggested to be due to loss of their interfacial properties [5]. Recently, coupling agents have been explored to enhance the interfacial properties of fibre/polymer composites [6,7]. Chitosan (CS) has a number of properties that make it a suitable candidate as an interface agent for PGF/PCL composites.
Chitosan is the second most abundant natural polysaccharide next to cellulose and can be produced from discarded crab and shrimp shells [8]. It is the N-deacetylated derivative of chitin with a typical degree of deacetylation of over 0.5, and it is a semicrystalline polymer in the solid state [9]. In dilute acidic solutions (below pH 6), CS is readily soluble due to the protonation of the amine groups, which makes CS a water-soluble cationic polyelectrolyte [9]. The amino functional groups of CS can participate in chemical reactions such as acetylation, chelation of metals, reactions with aldehydes, ketone alkylation, grafting, and so forth, and the hydroxyl groups also facilitate reactions such as o-acetylation, hydrogen bonding with polar atoms, and grafting, among others [10]. These reactive functional groups make CS outstanding in the biocomposite field, with applications such as in blends with other polymers [11], organic coupling agents [12], nanocomposites [13], and reinforced collagen structures [14].
CS has generated enormous interest in biomedical applications due to its biodegradability and biocompatibility [8,9]. For example, Copper et al. [15] investigated the fabrication and application of CS–PCL fibres for nerve tissue regeneration. They reported a good polymer compatibility between CS and PCL and achieved better cellular compatibility compared to PCL products. Zhang et al. [16] produced CS scaffolds for bone tissue engineering and used phosphate calcium invert glasses as the reinforcing filler. They found that the CS scaffolds with the calcium phosphate glass fillers had a smoother surface and smaller pores with roughly circular shape. Therefore, they inferred that not only the physical incorporation of the secondary phases occurs, but ionic complexes may also form between the fillers and the CS, due to its high surface charge. These examples revealed a good interaction between CS and both biopolymers and phosphate glasses, which suggested the potential of CS as a coupling agent to improve the interface of PGF-reinforced polymer composites, such as might be used for orthopaedic implants [17]. To the authors’ best knowledge, no study has yet been published exploring the application of CS as a coupling agent.
Therefore, this study investigated the feasibility of CS as a coupling agent for PGF/PCL composites. It was hypothesised that CS would have a good connection with PGF via hydrogen, P–O–C, and/or N–P bonding [18,19]. Dilute acetic acid was used as a solvent for CS, which may also impact the mechanical properties of PGFs [20]. However, this impact could be controlled in terms of coating time and solution concentration. Mechanical properties of the coated and uncoated fibres were ascertained using a single-fibre tensile test (SFTT). The interfacial shear strength (IFSS) was analysed using a single-fibre fragmentation test. Thermogravimetric analysis (TGA) was used for the detection and quantification of the CS coating on the fibres. Morphologic examination was performed via SEM. FTIR, Raman, and X-ray photoelectron spectroscopy (XPS) analyses were conducted in order to investigate the chemical interaction between the CS and PGFs. Finally, the CS-modified PGF/PCL composites would be developed into composite bone plates for orthopaedic applications. The PGFs can completely degrade in the aqueous solution, as can the polymer matrix. Cell culture analysis and mechanical property studies have already been done and published [1,2].
2. Materials and Methods
2.1. Phosphate Glass and Fibre Preparation
2.2. Coating Application
A 2% v/v acetic acid solution was prepared by mixing glacial acetic acid (purity >99.7%, Fisher Scientific, Hampton, NH, USA) into Ultrapure Milli-Q water (Merck KGaA, Darmstadt, Germany) [23]. The CS coating solution was then prepared by dissolving 0.3–0.9 g of CS powder (low molecular weight (Mw), the degree of deacetylation (DD) > 80%, Sigma Aldrich, St. Louis, MO, USA) in 100 mL of the acetic acid solution, stirring in hermetically sealed glassware to prevent evaporation of acetic acid, until a transparent, viscous solution was obtained. PGFs were dip-coated in the coating solution and subsequently dried in an oven overnight at 50 °C, before proceeding with tensile testing and single-fibre composite (SFC) preparation.
Five groups were prepared for comparison. Three of them (PCP-3, -6, and -9; PCP means PGF–chitosan–PCL) were treated using the same coating process with different CS concentrations. PCP-3R was post-cleaned after coating, i.e., the coated PGFs were immersed in 100 mL 2% v/v acetic acid solution and lightly shaken to remove excess CS on the fibre surface. Uncoated PGFs (PCP-0) were also placed in the oven and prepared as a control. Full details of the coating applications are shown in Table 1.
2.3. Single-Fibre Composite (SFC) Preparation
PCL films were prepared by compression moulding from granulated PCL (Mw 65,000, Esun, Shenzhen, China), which was dried in an oven at 50 °C for 24 h before processing. Eight grams of the dried PCL was placed between two steel plates with polytetrafluoroethylene (PTFE) as a release film. Then, the steel plates were moved into a hydraulic press (ZhengGong, Zhengzhou, China), preheated at 120 °C for 5 min, hot-pressed under 23 bar at 120 °C for 40 s, and cold-pressed under 23 bar at room temperature for 2 min. The resulting PCL films (thickness of 0.15–0.20 mm) were cut into dimensions of 75 mm × 25 mm.
SFCs were prepared via a similar compression moulding process. A single fibre was axially aligned between two prepared PCL films in the mound and fixed at both ends using heat-resistant adhesive tape. Then, the mould was preheated at 120 °C for 10 min, hot-pressed under 14 bar at 120 °C for 10 min, and cold-pressed under 14 bar at room temperature for 2 min. The resulting SFC was cut into a dog-bone specimen of total dimensions 63 mm × 10 mm × 0.25 mm using a dog-bone cutter (Keruite, Kunshan, China), with the gauge section being 25 mm × 5 mm.
2.4. Single Fibre Tensile Test (SFTT)
SFTTs were conducted in accordance with ISO 11566 [24]. Thirty individual filaments were mounted onto plastic tabs for each sample type. The filaments were bonded to the tabs using a UV-cured acrylic adhesive (Dymax, Wiesbaden, Germany). The gauge length was 25 mm.
Measurements of fibre diameter were conducted using an FDAS 770 fibre micrometre (Diastron, Andover, UK), configured with an LSM 6200 laser scan micrometre (Mitutoyo, Kanagawa, Japan). Before measurements, the micrometre was calibrated with a glass fibre of known diameter, determined by a Sigma/VP SEM with ×1000 magnification (Zeiss, Jena, Germany), and the error on each diameter measurement was taken to be ±0.3 μm. The value of diameter was obtained from the average of three measurements of the fibre. The SFTT was performed using a LEX 820 tensile tester (Diastron, Andover, UK) at room temperature with a load cell capacity of 1 N and a crosshead speed of 1 mm min−1 [25]. The Weibull distribution is an accepted statistical tool with which to characterise the failure of brittle fibres [25]. The normalising stress and Weibull modulus are referred to as the scale and shape parameters, respectively. The normalising stress describes the most probable stress at which a brittle fibre of the gauge length will fail [26]. Minitab 17 (Minitab Inc., State College, PA, USA) was used to calculate Weibull parameters from the tensile strength data.
2.5. Single-Fibre Fragmentation Test (SFFT)
The interfacial shear strength (IFSS) was measured from SFCs by using the SFFT method. Dog-bone specimens were axially loaded in an E45 tensile testing machine (MTS, Eden Prairie, MN, USA) with a load cell of 1 kN and a crosshead speed of 1 mm min−1 until the strain increased independently of the axial stress [25].
The PCL samples prepared were not transparent enough to see the fibre fragments using a microscope after the tensile tests. Hence, the samples were sandwiched between two glass slides and heated at 70 °C for 2–5 min on a hot plate to melt the PCL so that it became transparent. Then, the number of fibre fragments within the gauge length was tallied under an NE 930 optical microscope (Nexcope, Ningbo, China).
The IFSS values were calculated using the Kelly–Tyson equation [25]:
where τ is the IFSS, d is the fibre diameter, and σf is the single-fibre tensile strength at the critical fragment length lc, determined by:
where m and σ0 are the Weibull shape and scale parameter, respectively, for the fibre strength at gauge length l0. N is the number of fibre fragments and lf is the average fragment length, obtained using optical microscopy.
2.6. Statistical Analysis
Statistical analysis was performed using version 22 of SPSS (IBM, New York, NY, USA). The significance of difference between different samples was analysed using a Student’s unpaired t-test, assuming equal variance and determining two-tailed p values [21]. Comparison of the significance of change in one factor with CS concentration was performed by using one-way analysis of variance (ANOVA), calculated with the Bonferroni post-test [22]. The Kolmogorov–Smirnov (K–S) test was used to assess whether the samples follow a Gaussian distribution. The threshold value chosen for statistical significance was the 0.05 level.
2.7. SEM
Fibres were fixed on the sample stage by using conductive adhesive tape and were then coated with gold using an EM SCD 500 high-vacuum sputter coater (Leica, Welzlar, Germany). The stage with sample was placed into a Sigma/VP SEM (Zeiss, Jena, Germany). The micrographs were taken at an accelerating voltage of 3 kV using SE (secondary electron) mode.
2.8. Thermogravimetric Analysis (TGA)
TGA was performed using an SDT Q600 thermogravimetric analyser (TA Instruments, New Castle, DE, USA). The CS powder and coated/uncoated fibres were heated from room temperature to 500 °C, below the glass transition temperature (Tg) of the PGF, being around 520 °C [21]. A heating rate of 20 °C min−1 in flowing nitrogen gas of 50 mL min−1 was used for the experiment.
2.9. FTIR and Microscope FTIR
Infrared spectroscopy was performed on the CS powder and chopped fibres using a Vertex 70 FTIR spectrometer (Bruker, Ettlingen, Germany), while a Cary 660 FTIR Spectrometer coupled with a Cary 620 FTIR Microscope (Agilent Technologies, CA, USA) was used for precise analysis of the excess coating on the fibre bundle.
All the samples were scanned in the region of 4000 to 400 cm−1 with a scan resolution of 4 cm−1 for 32 scans using the Attenuated Total Reflectance (ATR) system, and analysed by using Opus software version 7.0 (Bruker, Ettlingen, Germany). Spectra were background-corrected.
2.10. Raman
Raman spectra in the range of 100–3500 cm−1 were taken at room temperature using an inVia-Reflex Raman spectrometer coupled with an inVia Raman Microscope (Renishaw, Gloucestershire, UK) and equipped with a 785 nm laser diode. The spectra of CS powder and chopped fibres were obtained and then analysed by using WIRE software (Version 2.0, Renishaw, Gloucestershire, UK).
2.11. XPS
An Axis Ultra (Kratos, Manchester, UK) with a monochromated AlKα X-ray source (1486.6 eV) was operated at 8 mA emission current and 12 kV anode potential. For the XPS measurement, a fibre bundle was mounted on the sample stage using a conductive adhesive tape at both ends, while the CS powder was adhered on the stage by using conductive tape. Drift of the electron binding energy of the peaks caused by surface charging was calibrated by using the C1s peak of the C–C bond at 284.5 eV.
3. Results
3.1. Mechanical Properties
As shown in Figure 1, the tensile modulus of PCP-0, -3R, -3, -6, and -9 were 72 ± 3, 73 ± 3, 72 ± 3, 69 ± 3, and 71 ± 6 GPa, respectively. No significant change was found for the modulus between the uncoated and coated fibres. Tensile strength of the fibres are shown in Figure 1 and Table 2. Table 2 also represents the fibre diameters and Weibull parameters. It was observed that the tensile strength of PCP-3R was reduced by 20.2% (p < 0.001) compared to the control (PCP-0), while there was no significant difference between the tensile strength of PCP-3 and PCP-0. Moreover, the tensile strength of PCP-6 and -9 were 1.1% and 11.5% higher than the control, respectively. Thus, the tensile strength of coated fibres was observed to have a positive correlation with the CS concentration. Statistical analysis further demonstrated the significance of this increase (p < 0.05).
It was observed from Table 2 that the trend of the mean tensile strength was consistent with that of the normalising strength. The Weibull modulus of the fibres ranged between 5.3 and 6.7. The fibre diameters were around 25 µm, and no significant change in diameter was observed between coated and pristine fibres.
3.2. IFSS Analysis
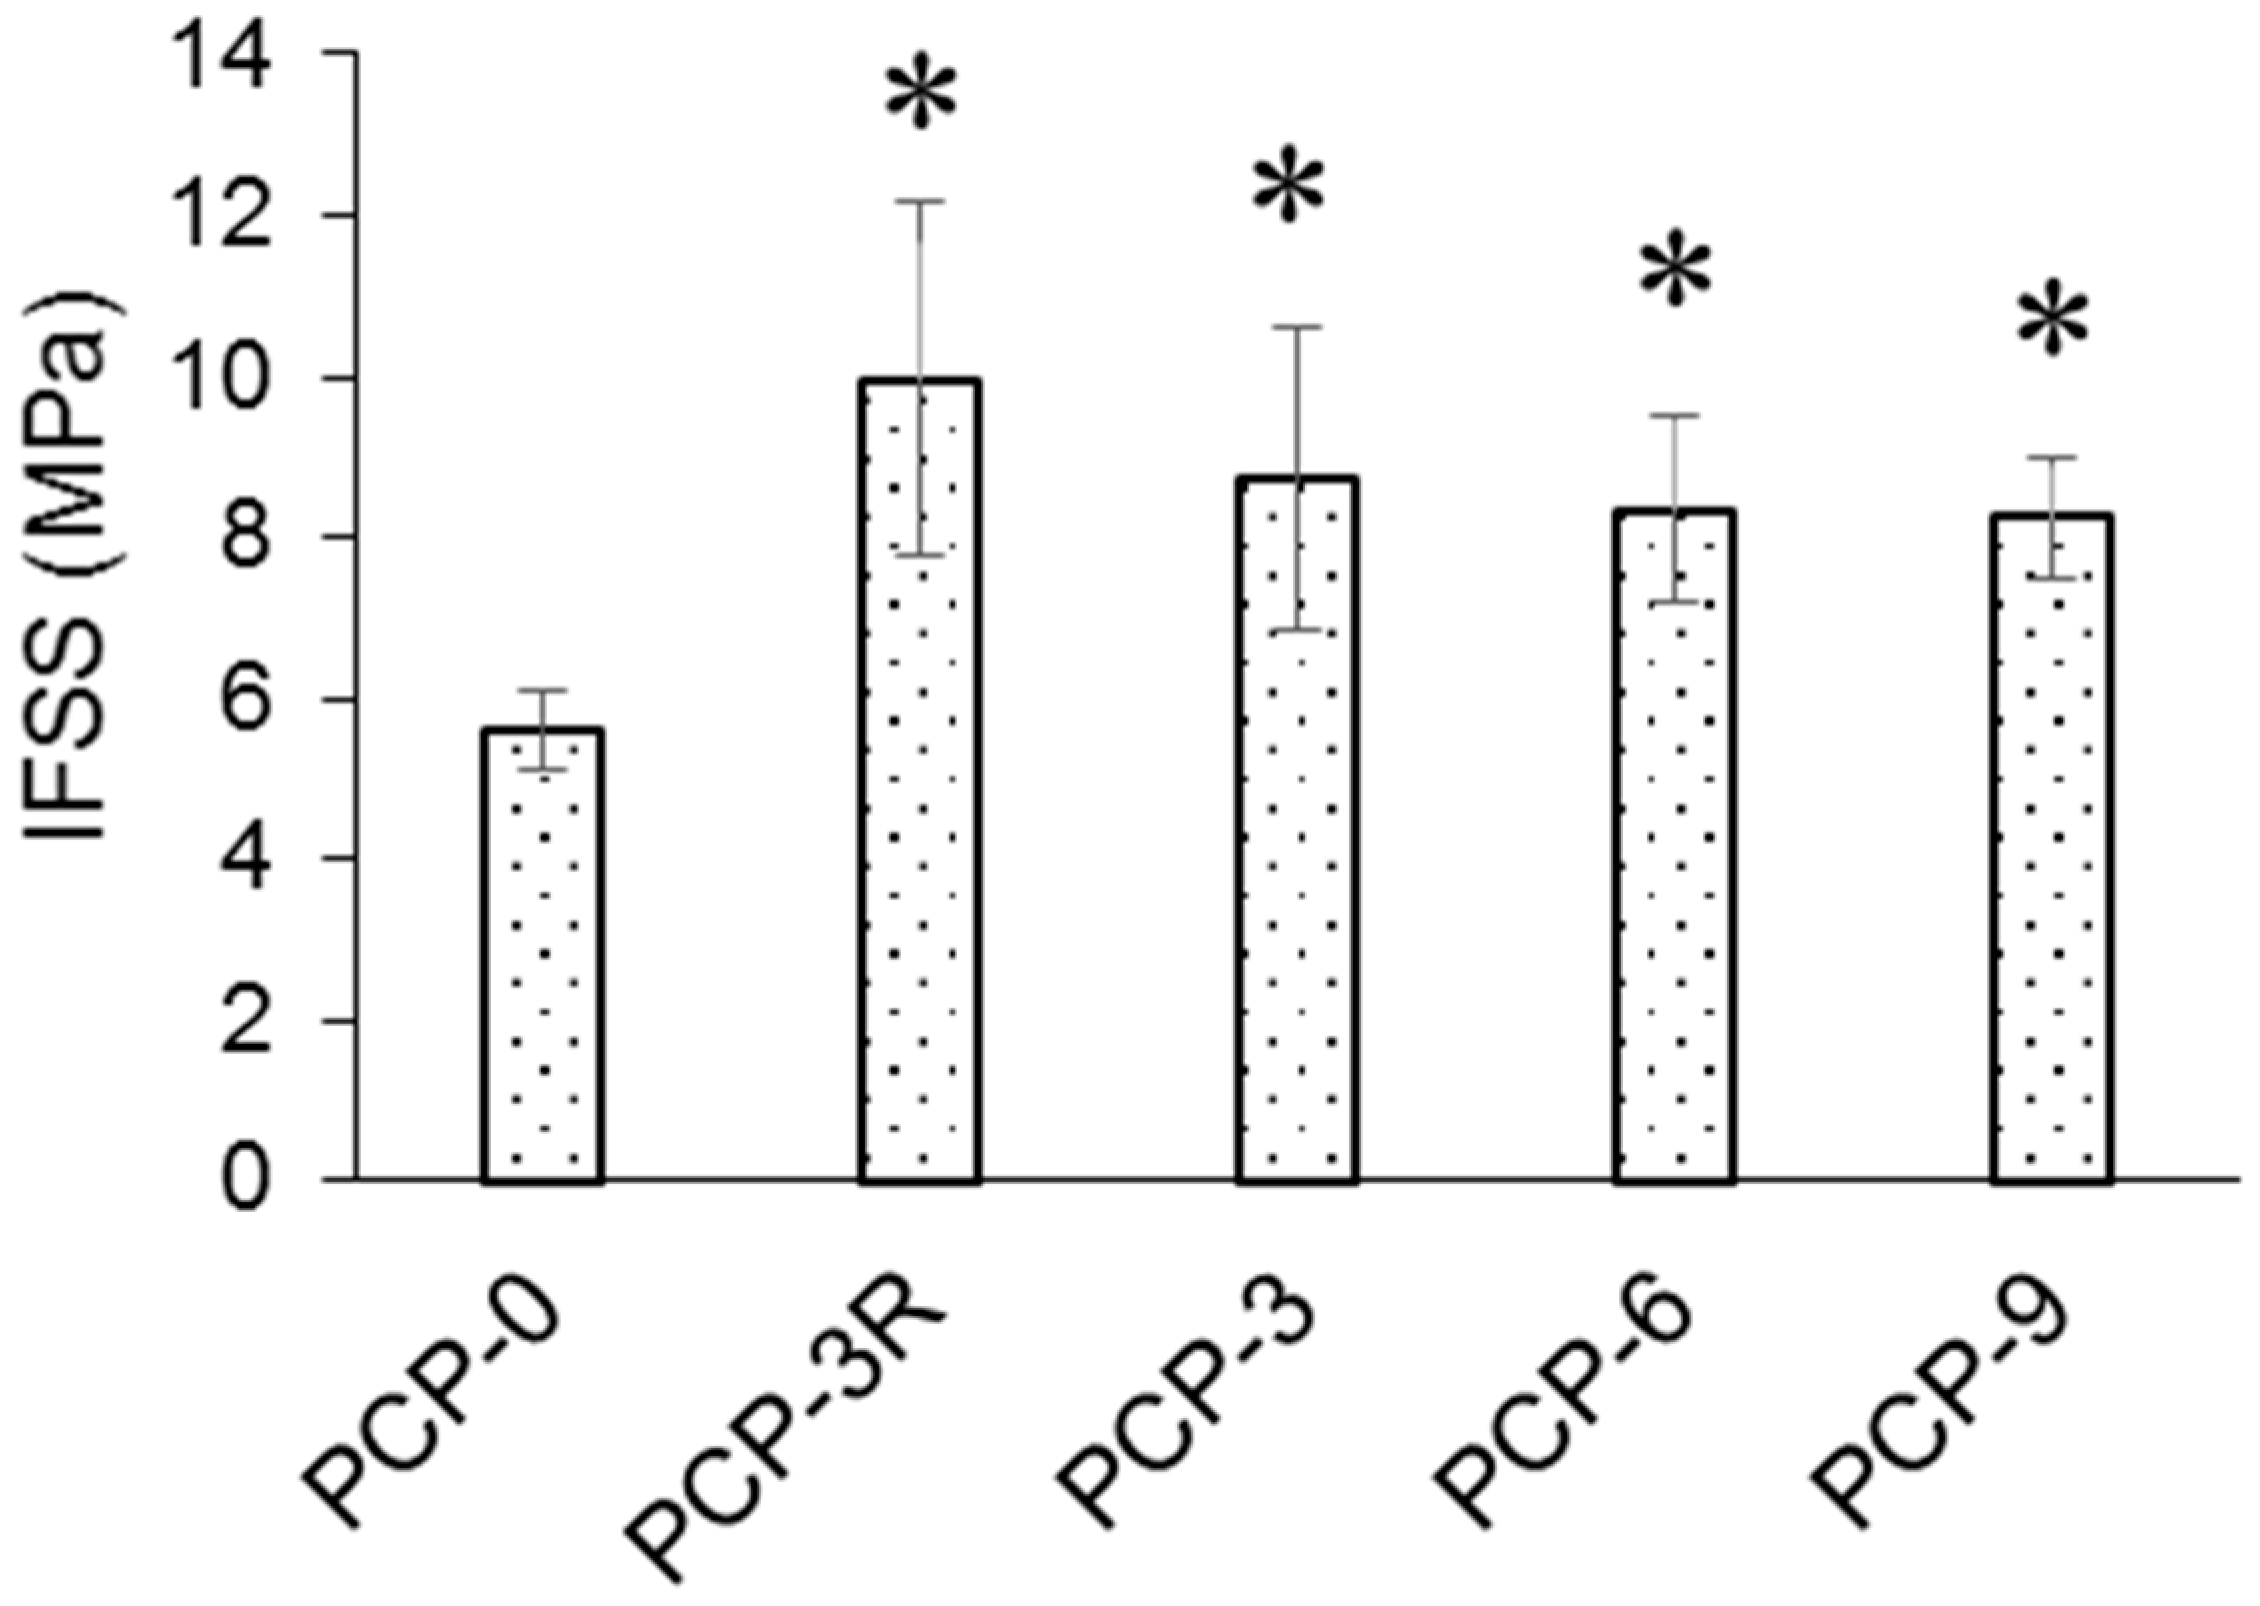
As shown in Figure 2, the interfacial shear strength (IFSS) of PCP-3R (9.97 ± 2.21 MPa) increased by 78% (p < 0.001) compared to the control, PCP-0 (5.59 ± 0.50 MPa). In contrast, the IFSS of PCP-3 (8.72 ± 1.88 MPa) increased by 56% (p < 0.001) compared to PCP-0. Moreover, no statistical significance was found for the difference in IFSS between PCP-3, -6, and -9.
3.3. SEM Analysis
SEM was used to investigate the morphology of the fibres after the application of CS and also to compare the surface of the coated and uncoated fibres. As shown in Figure 3a, the surface of the uncoated PGF (PCP-0) was smooth, whilst some CS attachment was observed on the surface of all the coated fibres (see Figure 3b–e). Moreover, the attachment of CS on PCP-3, -6, and -9 (see Figure 3c–e) appears as a “seam” (for an example, see the white arrow depicted in image Figure 3e). The difference in surface condition between PCP-3R and -3 (see Figure 3b,c) represented the effect of post-cleaning and removing of the excess CS attached to the fibres. In addition, no cracks or pits were observed in any of the samples tested.
As shown in Figure 3c, excess attachment of CS was observed as a seam on the PCP-3 fibre, and otherwise, the coating on the fibre surface seemed to be uniform. The blistering and skinning appearances indicated by white arrows in Figure 3f were generated under a prolonged exposure to the electron beam and suggested the presence of a CS coating. The white arrow in Figure 3g indicates the connection between two filaments, which was suggested to be formed by the presence of excess CS on the fibre surface.
3.4. TGA
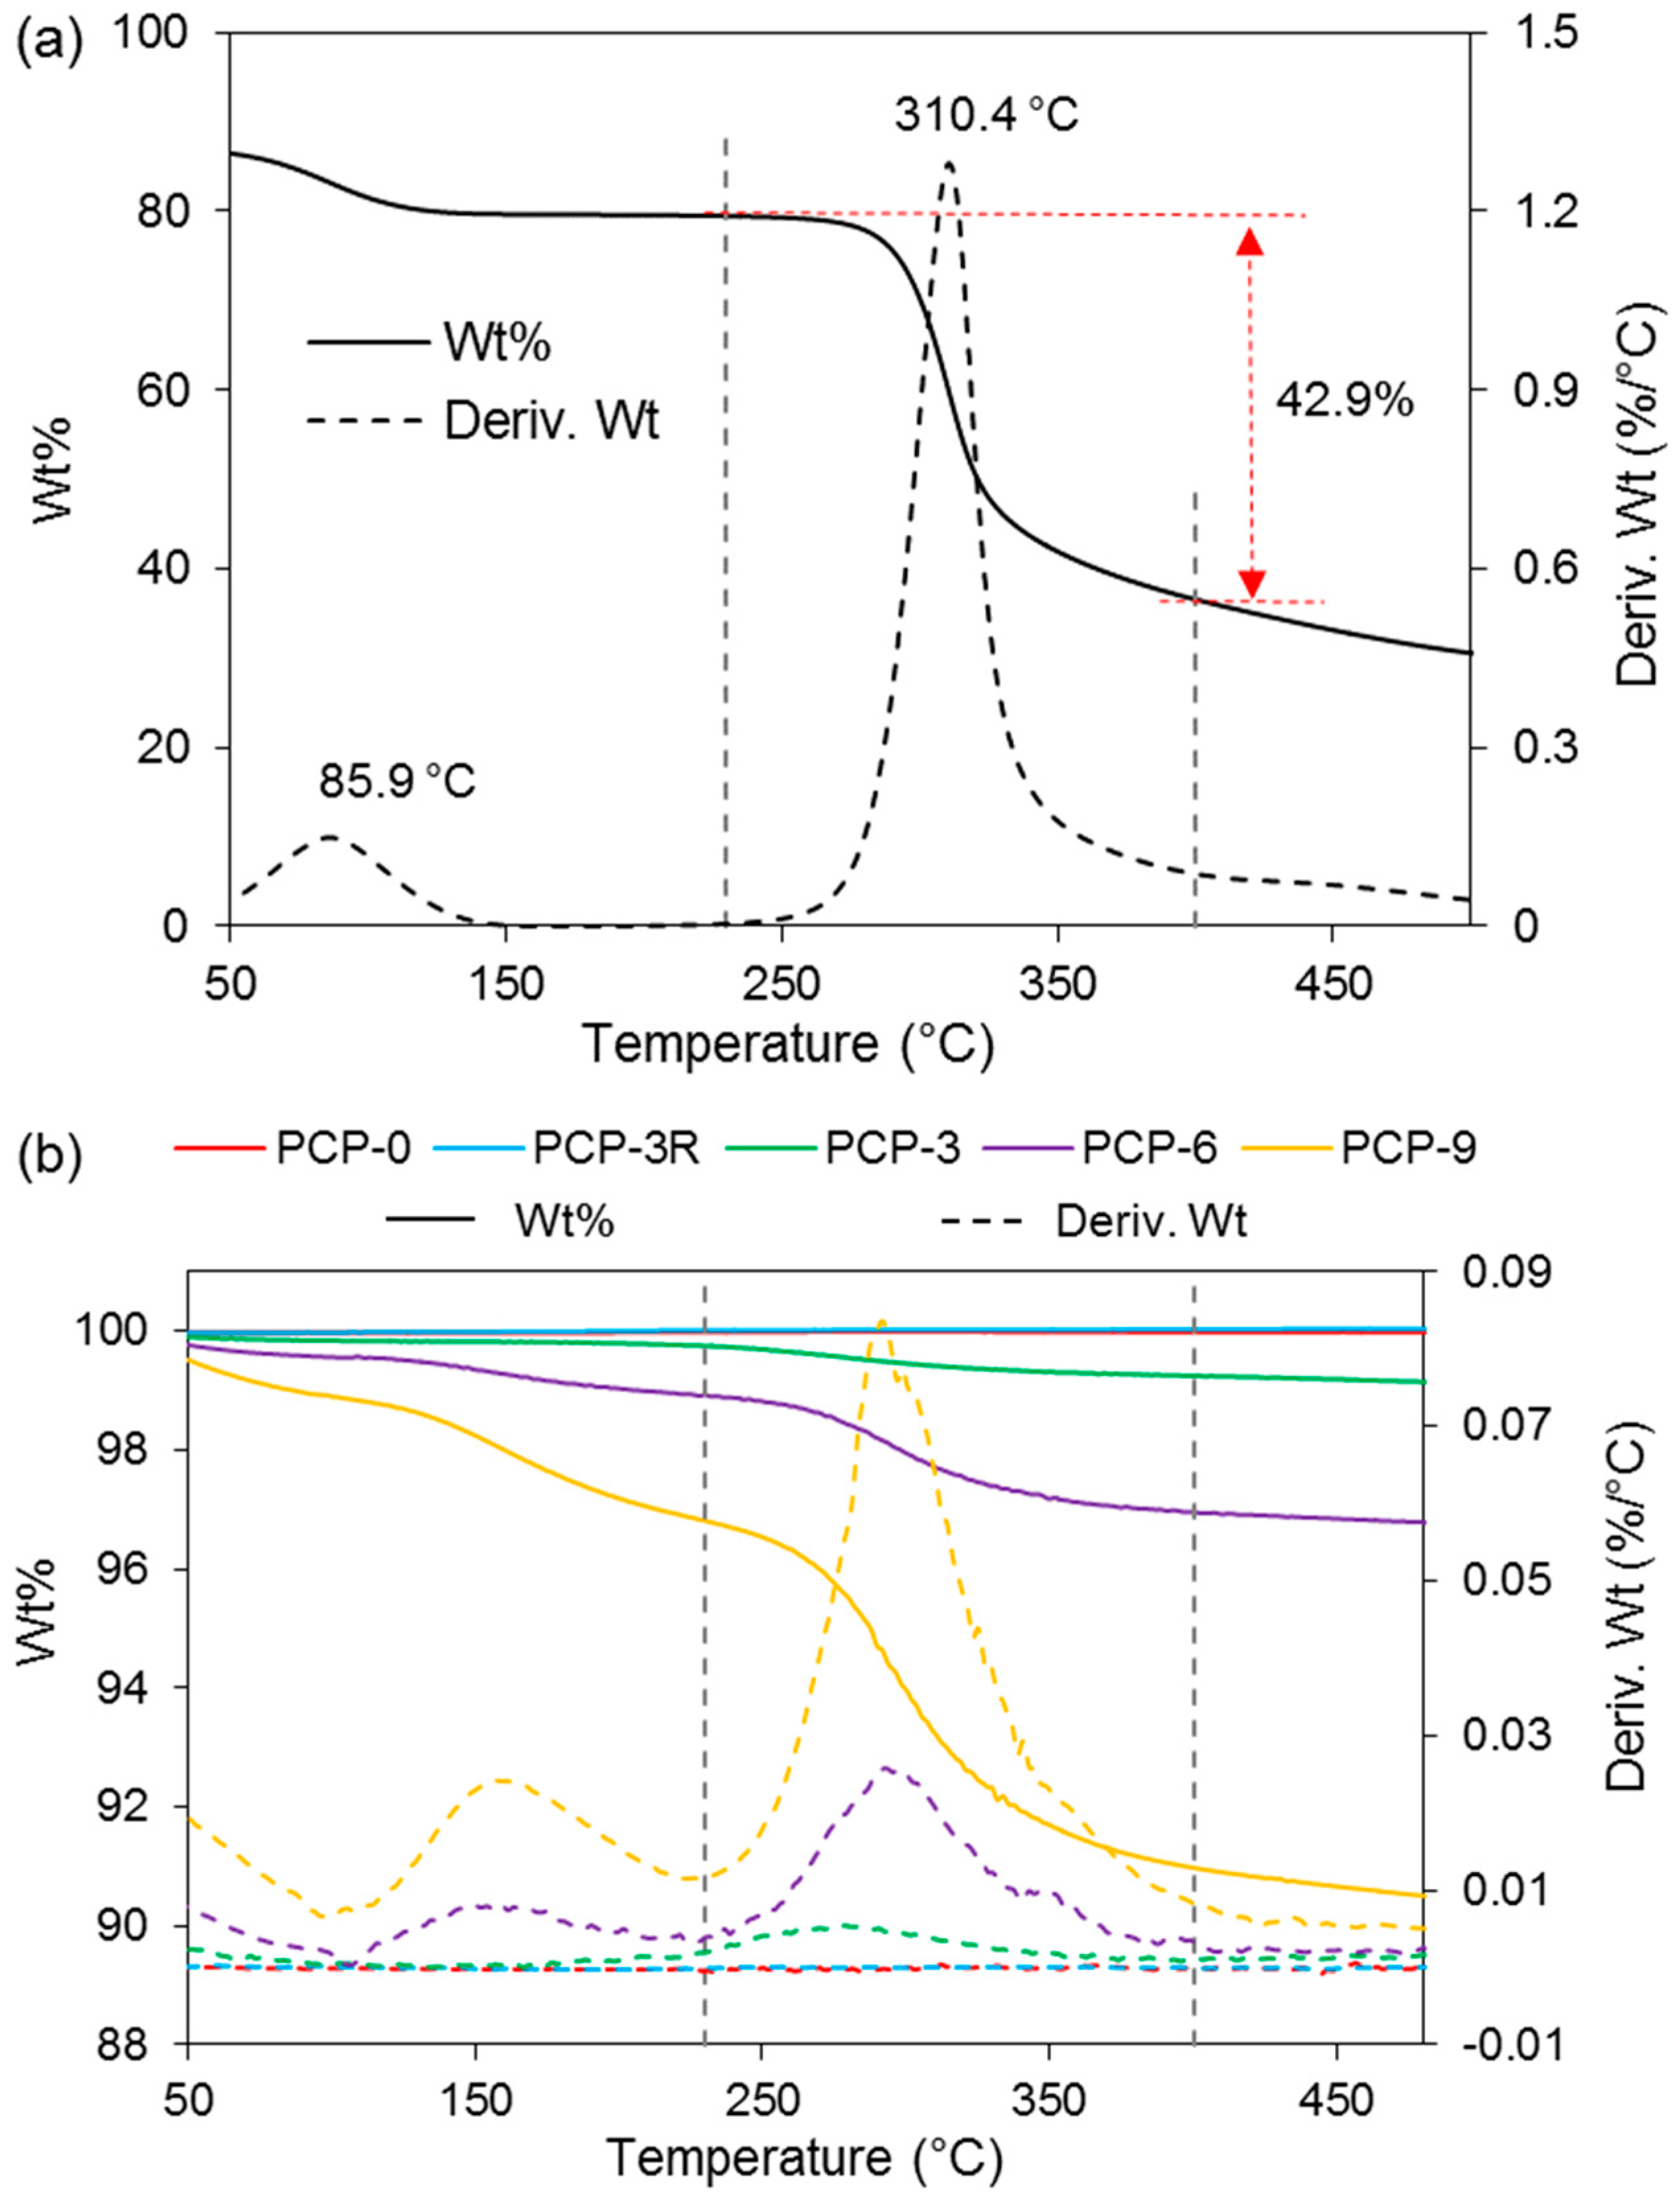
Figure 4 represents the change in weight percentage of CS powders and glass fibres as a function of temperature. A derivative of the weight percentage curve (Wt%/°C versus °C) is also presented for a further analysis of decomposition temperature. Figure 4a shows the TGA results of the CS powders, where two apparent peaks were observed on the derived Wt curve of CS at 86 and 310 °C, respectively. The weight loss in the temperature between 230 and 400 °C was observed to be 43%, which was caused by the decomposition of CS [27]. Figure 4b exhibits TGA traces of the coated and uncoated fibres. A peak at ~300 °C was observed on the derived Wt curves of PCP-3, -6, and -9. One more peak was found at ~160 °C for PCP-6 and -9. In addition, an obvious weight loss was found for PCP-3, -6, and -9 below 100 °C. Table 3 shows the corresponding peaks of derived Wt curves for CS powders and glass fibres. The weight loss behaviour was observed to be composed of three stages. Table 3 also shows the weight loss of CS powders and glass fibres heated from 230 to 400 °C. A greater weight loss was observed with increasing CS concentration (from PCP-3 to PCP-6 and -9), and a reduced weight loss was found after the post-cleaning (from PCP-3 to PCP-3R).
3.5. FTIR Analysis
3.5.1. Microscope-FTIR
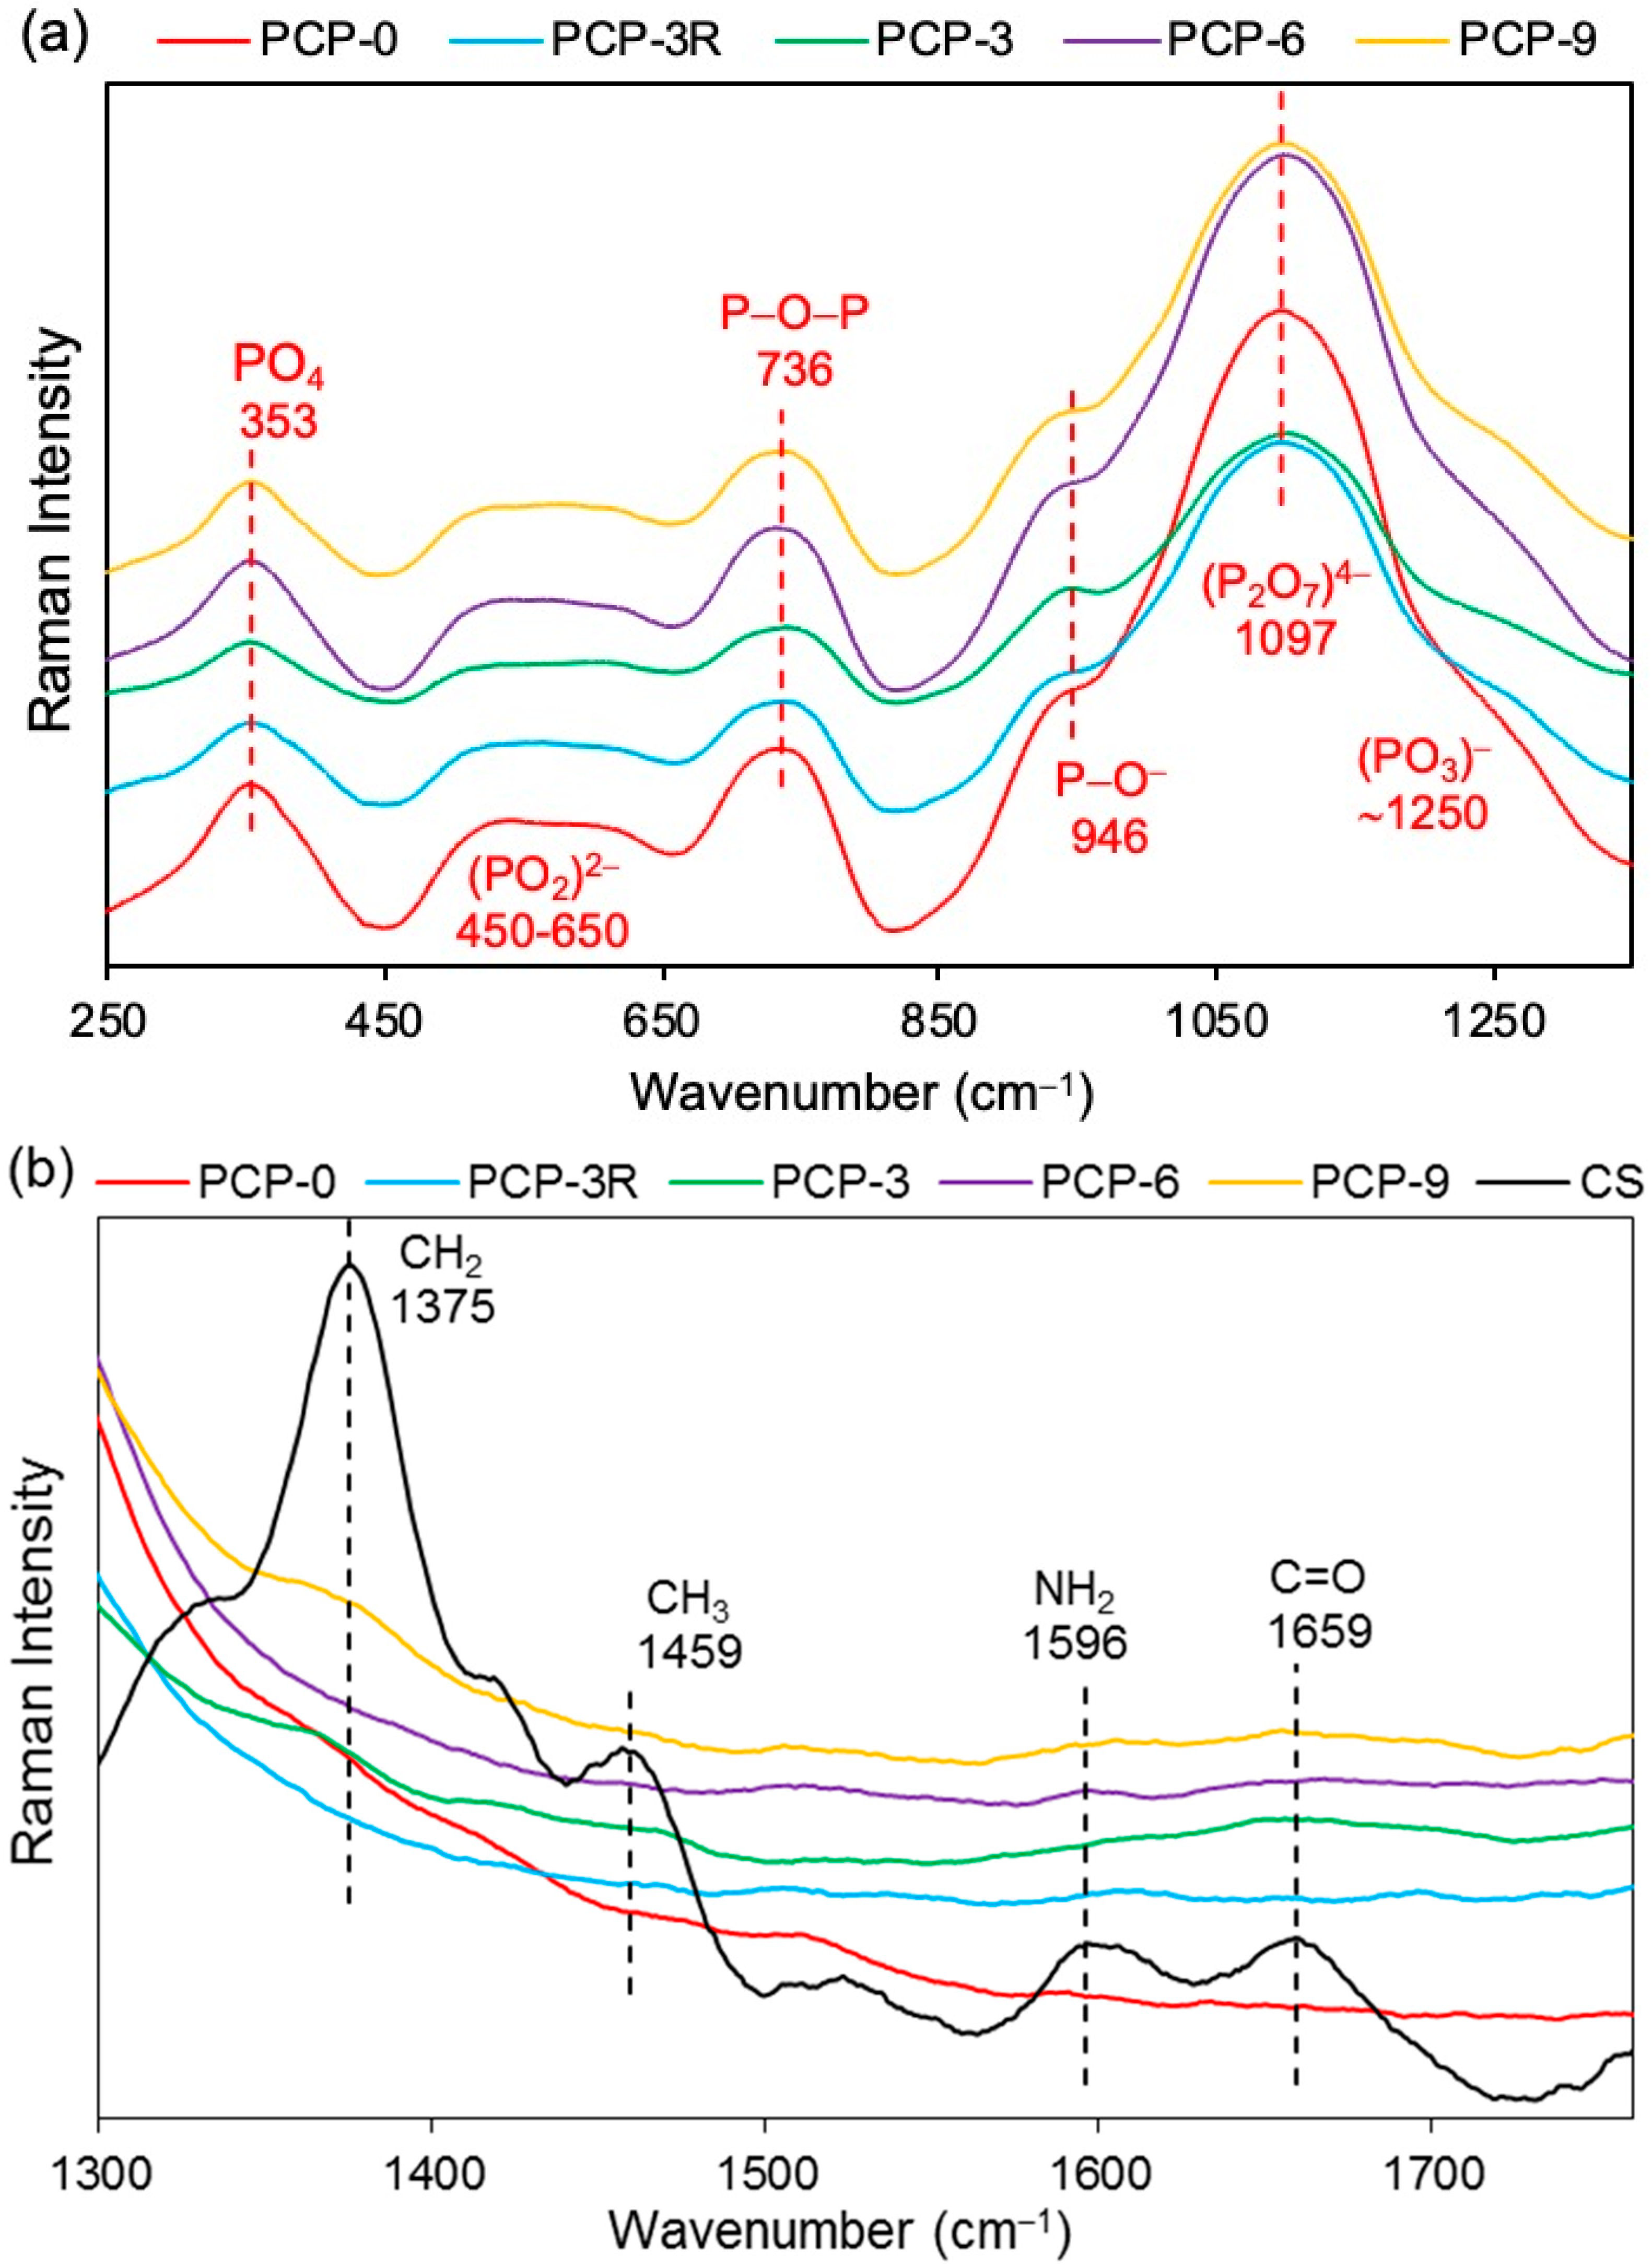
IR analysis was performed on the “seam” (CS-S) of the coated fibres to characterise the excess coating on the fibre (see the seam in Figure 3e. The comparison between CS-P and CS-S in Figure 5 found a decrease in band absorption intensity around 1027 and 3358 cm−1 in the spectra of CS-S. The band around 561 cm−1 observed in CS-P disappeared in CS-S. Moreover, the bands of CS-P at 1151, 1648, 3291, and 3358 cm−1 were also observed in the spectrum of CS-S. The bands at 1027, 1063, 1315, 1375, 2873, and 2917 cm−1 were found to shift to higher wavenumbers for CS-S as compared to CS-P, while the band observed at 1419 cm−1 shifted to a lower wavenumber. The band at 1589 cm−1 disappeared for CS-S and a new band was found at 1560 cm−1. Peak assignments are provided in Table 4.
3.5.2. ATR-FTIR
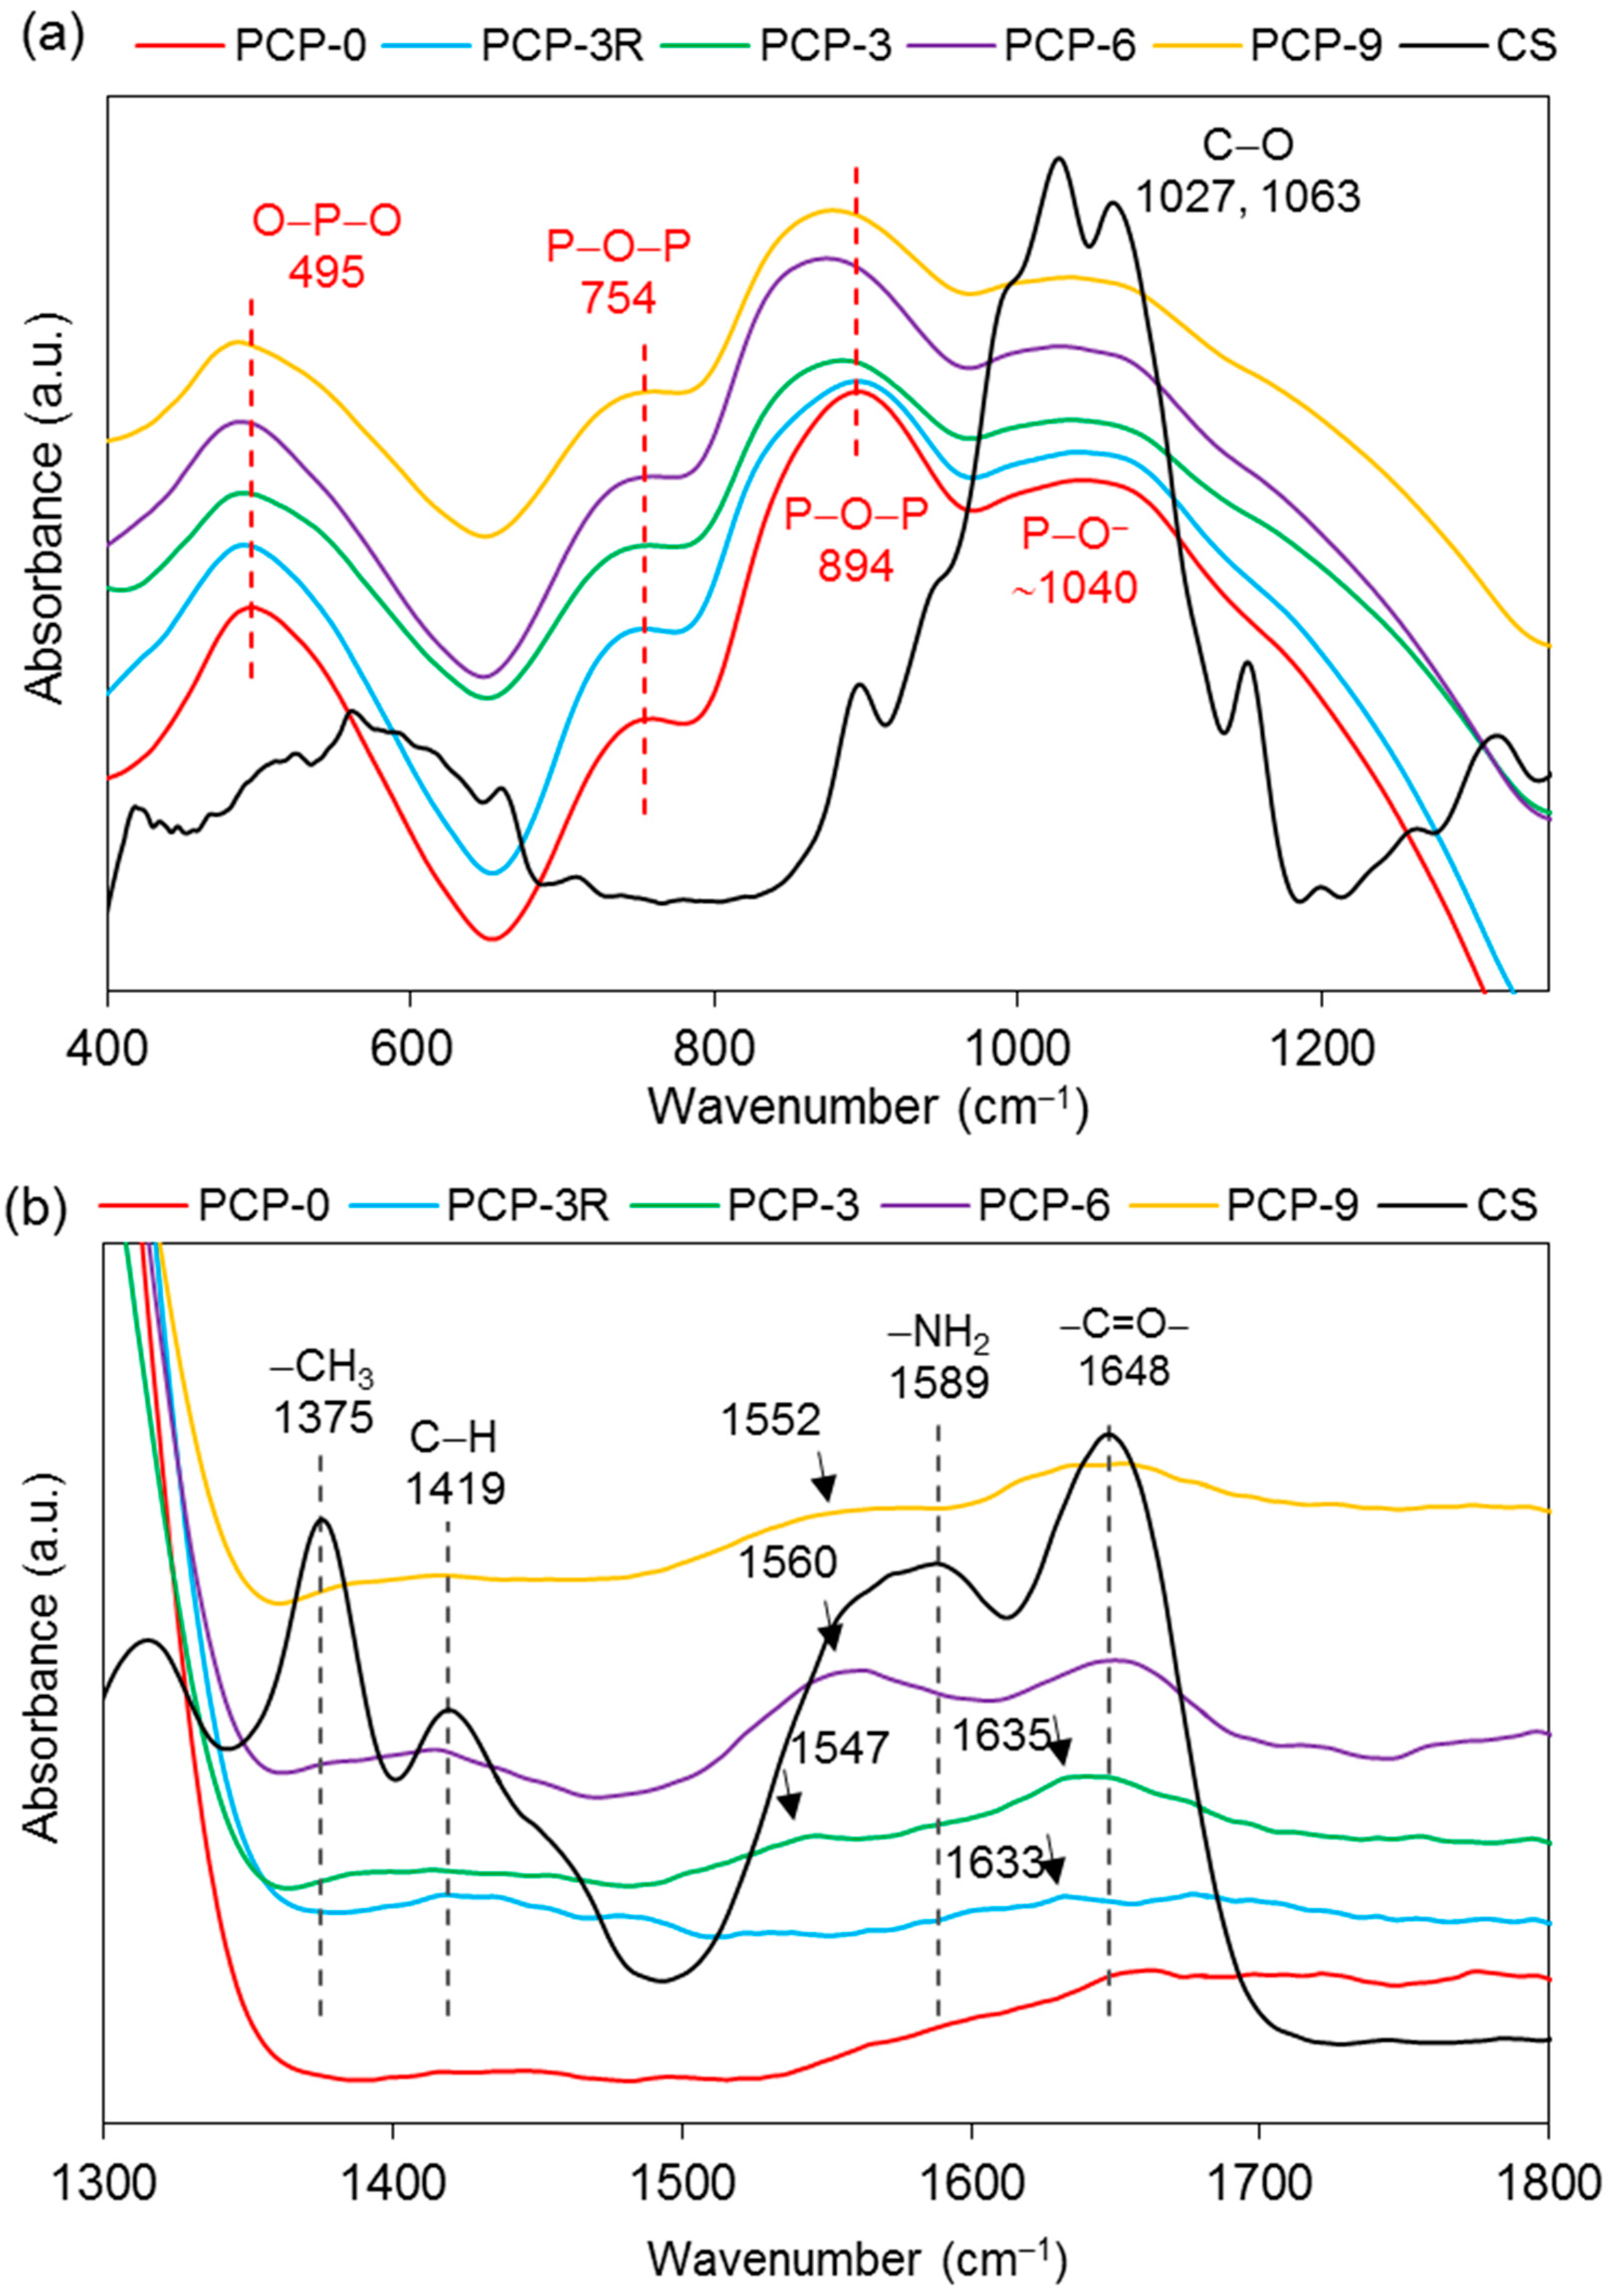
IR analyses were also performed on the coated fibres to investigate the chemical interaction between the CS coating and the PGF surface. The bands of uncoated PGFs (PCP-0) were taken as the control and the bands of pure CS powders were used as references. The band assignments are listed in Table 4.
Figure 6a shows that the main bands of PCP-0 were observed at 495, 754, 894, and ~1040 cm−1. Shifts towards lower wavenumbers were observed for the bands at 495 and 754 cm−1 for all the coated fibres. It was also obvious that the bands at 894 cm−1 shifted to a lower wavenumber in PCP-3, -6, and -9, while no evident change was found on the band at 1040 cm−1.
As shown in Figure 6b, the absorption bands of CS at ~1648 cm−1 were found only in PCP-3, -6, and -9, and a new band was also found at ~1633 cm−1. The band at 1589 cm−1 disappeared in the spectra of all the coated fibres, while a new band appeared at 1547, 1560, and 1552 cm−1 for PCP-3, -6, and -9, respectively.
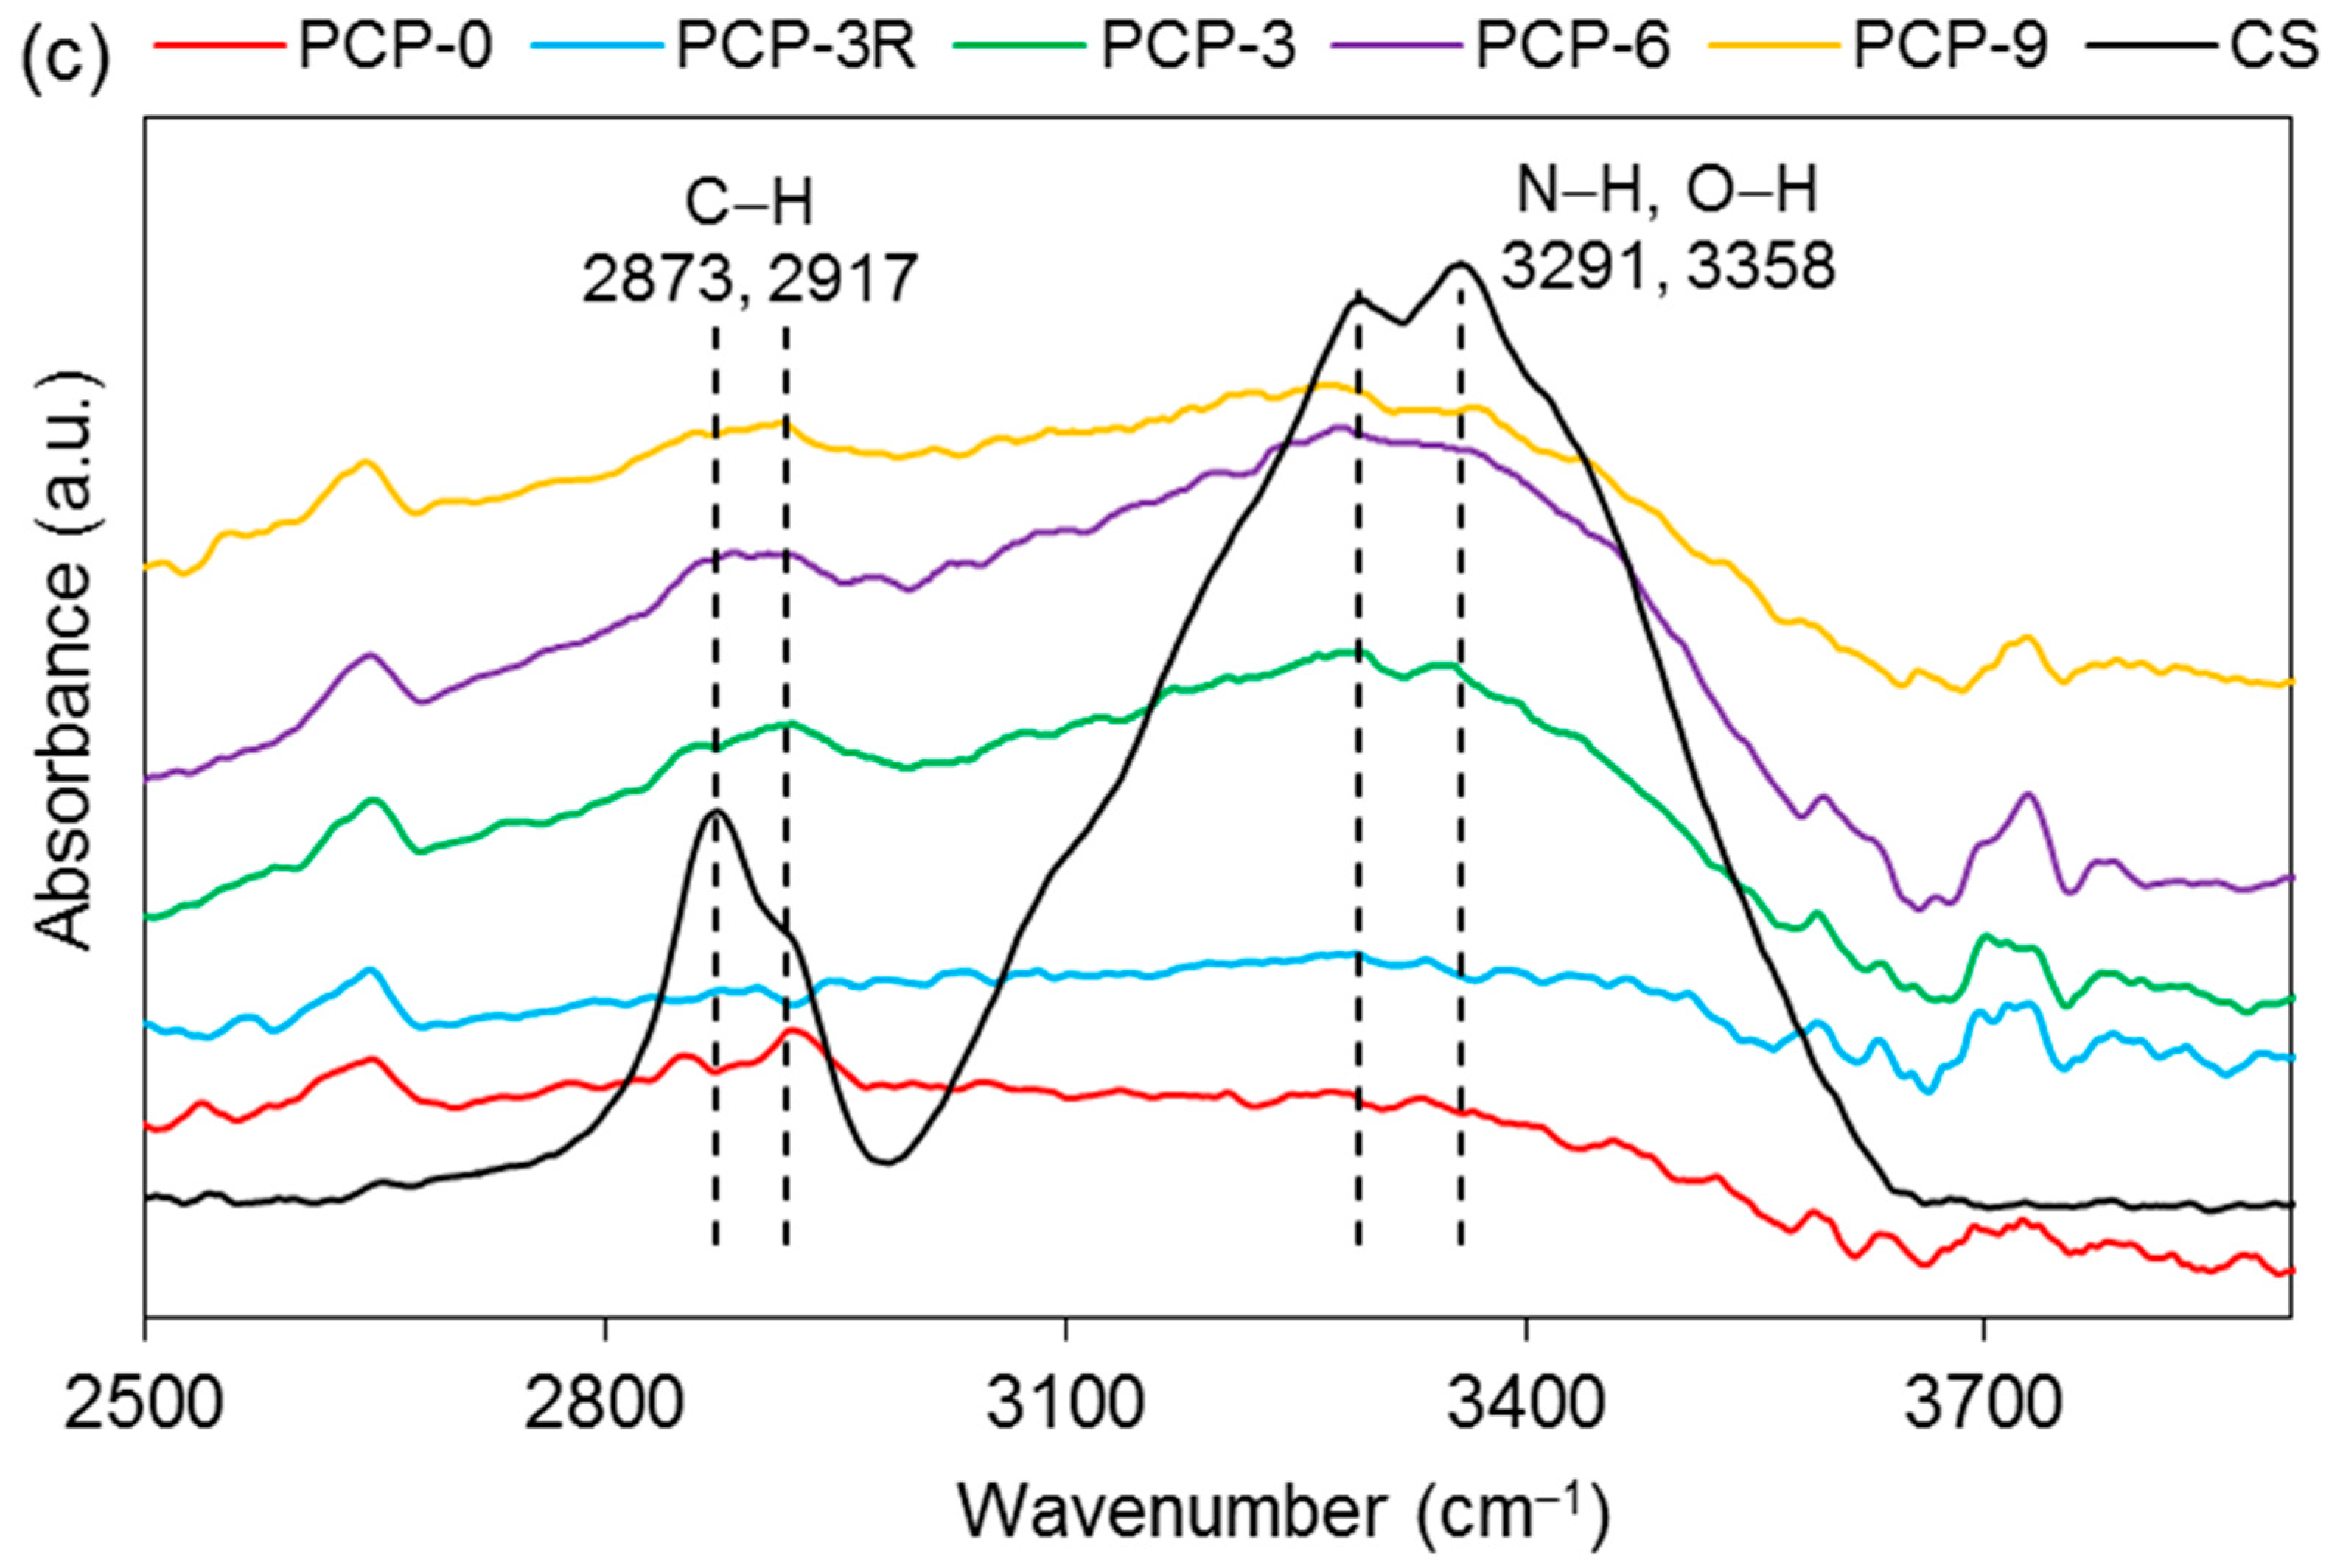
Absorption bands at 2873, 2917, 3291, and 3358 cm−1 were observed in PCP-3, -6, and -9, and a significant decrease in absorption intensity was observed at 3291 and 3358 cm−1 for the coated fibres as compared to CS (see Figure 6c).
3.6. Raman Analysis
Raman analyses was performed on the coated/uncoated fibres and the CS powder. The bands in the spectra of PGFs were observed in the range of 300–1400 cm−1. As shown in Figure 7a, the bands located at 353, 736, 946, and 1097 cm−1 were unchanged for the coated fibres compared to PCP-0. The intensity of the bands at 946, 1097, and ~1250 cm−1 were observed to decrease for PCP-3R, -3, -6, and -9, especially the band at 1097 cm−1. The broad band observed at 450–650 cm−1 was considered to be an overlapping of peaks, which were difficult to distinguish. The band assignments are listed in Table 4.
As shown in Figure 7b, four bands were observed at 1375, 1459, 1596, and 1659 cm−1 in CS. The bands at 1596 and 1659 cm−1 were also observed for PCP-6 and -9 with much lower intensities compared to CS. However, only the band at 1659 cm−1 was observed for PCP-3, while neither of the two bands at 1596 and 1659 cm−1 were found in PCP-0 and -3R.
Figure 7c shows the bands of CS at 2734, 2889, 2933, and 3305 cm−1. A decrease in the band intensity of 2889 and 2933 cm−1 were observed in PCP-3, -6, and -9. The bands at 2734 and 3305 cm−1 were observed to disappear in the spectra of all the coated fibres.
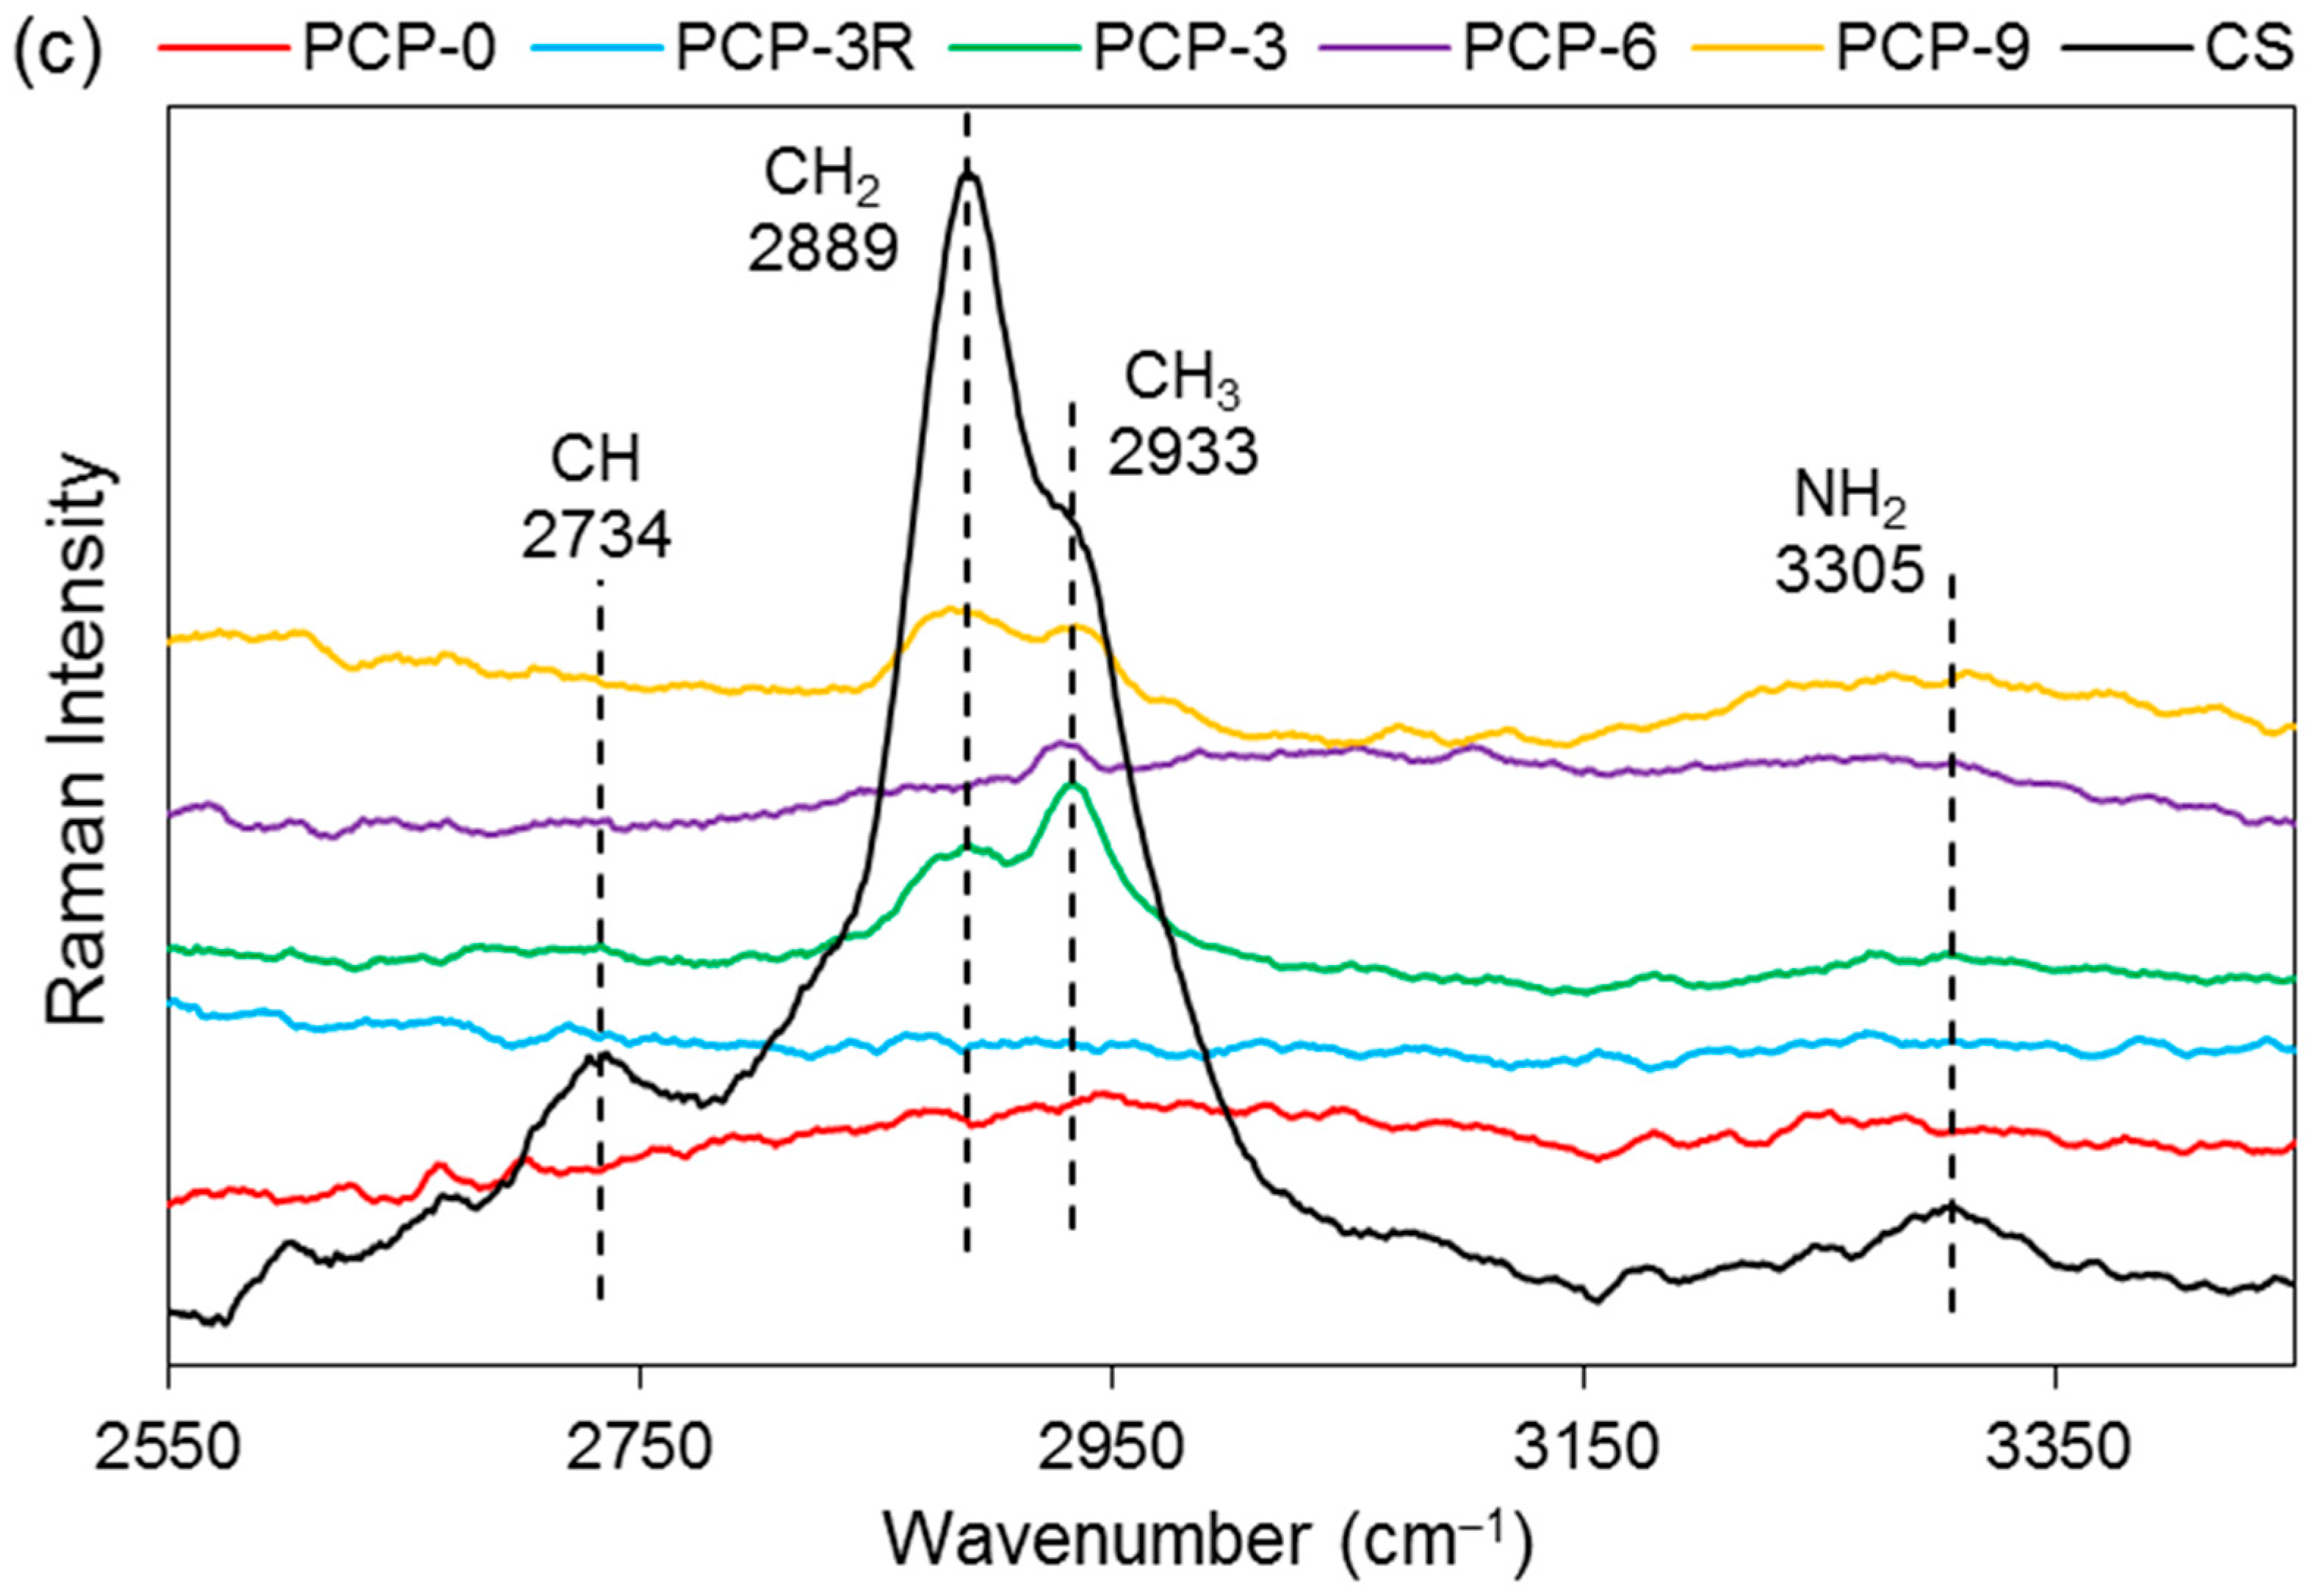
3.7. XPS Analysis
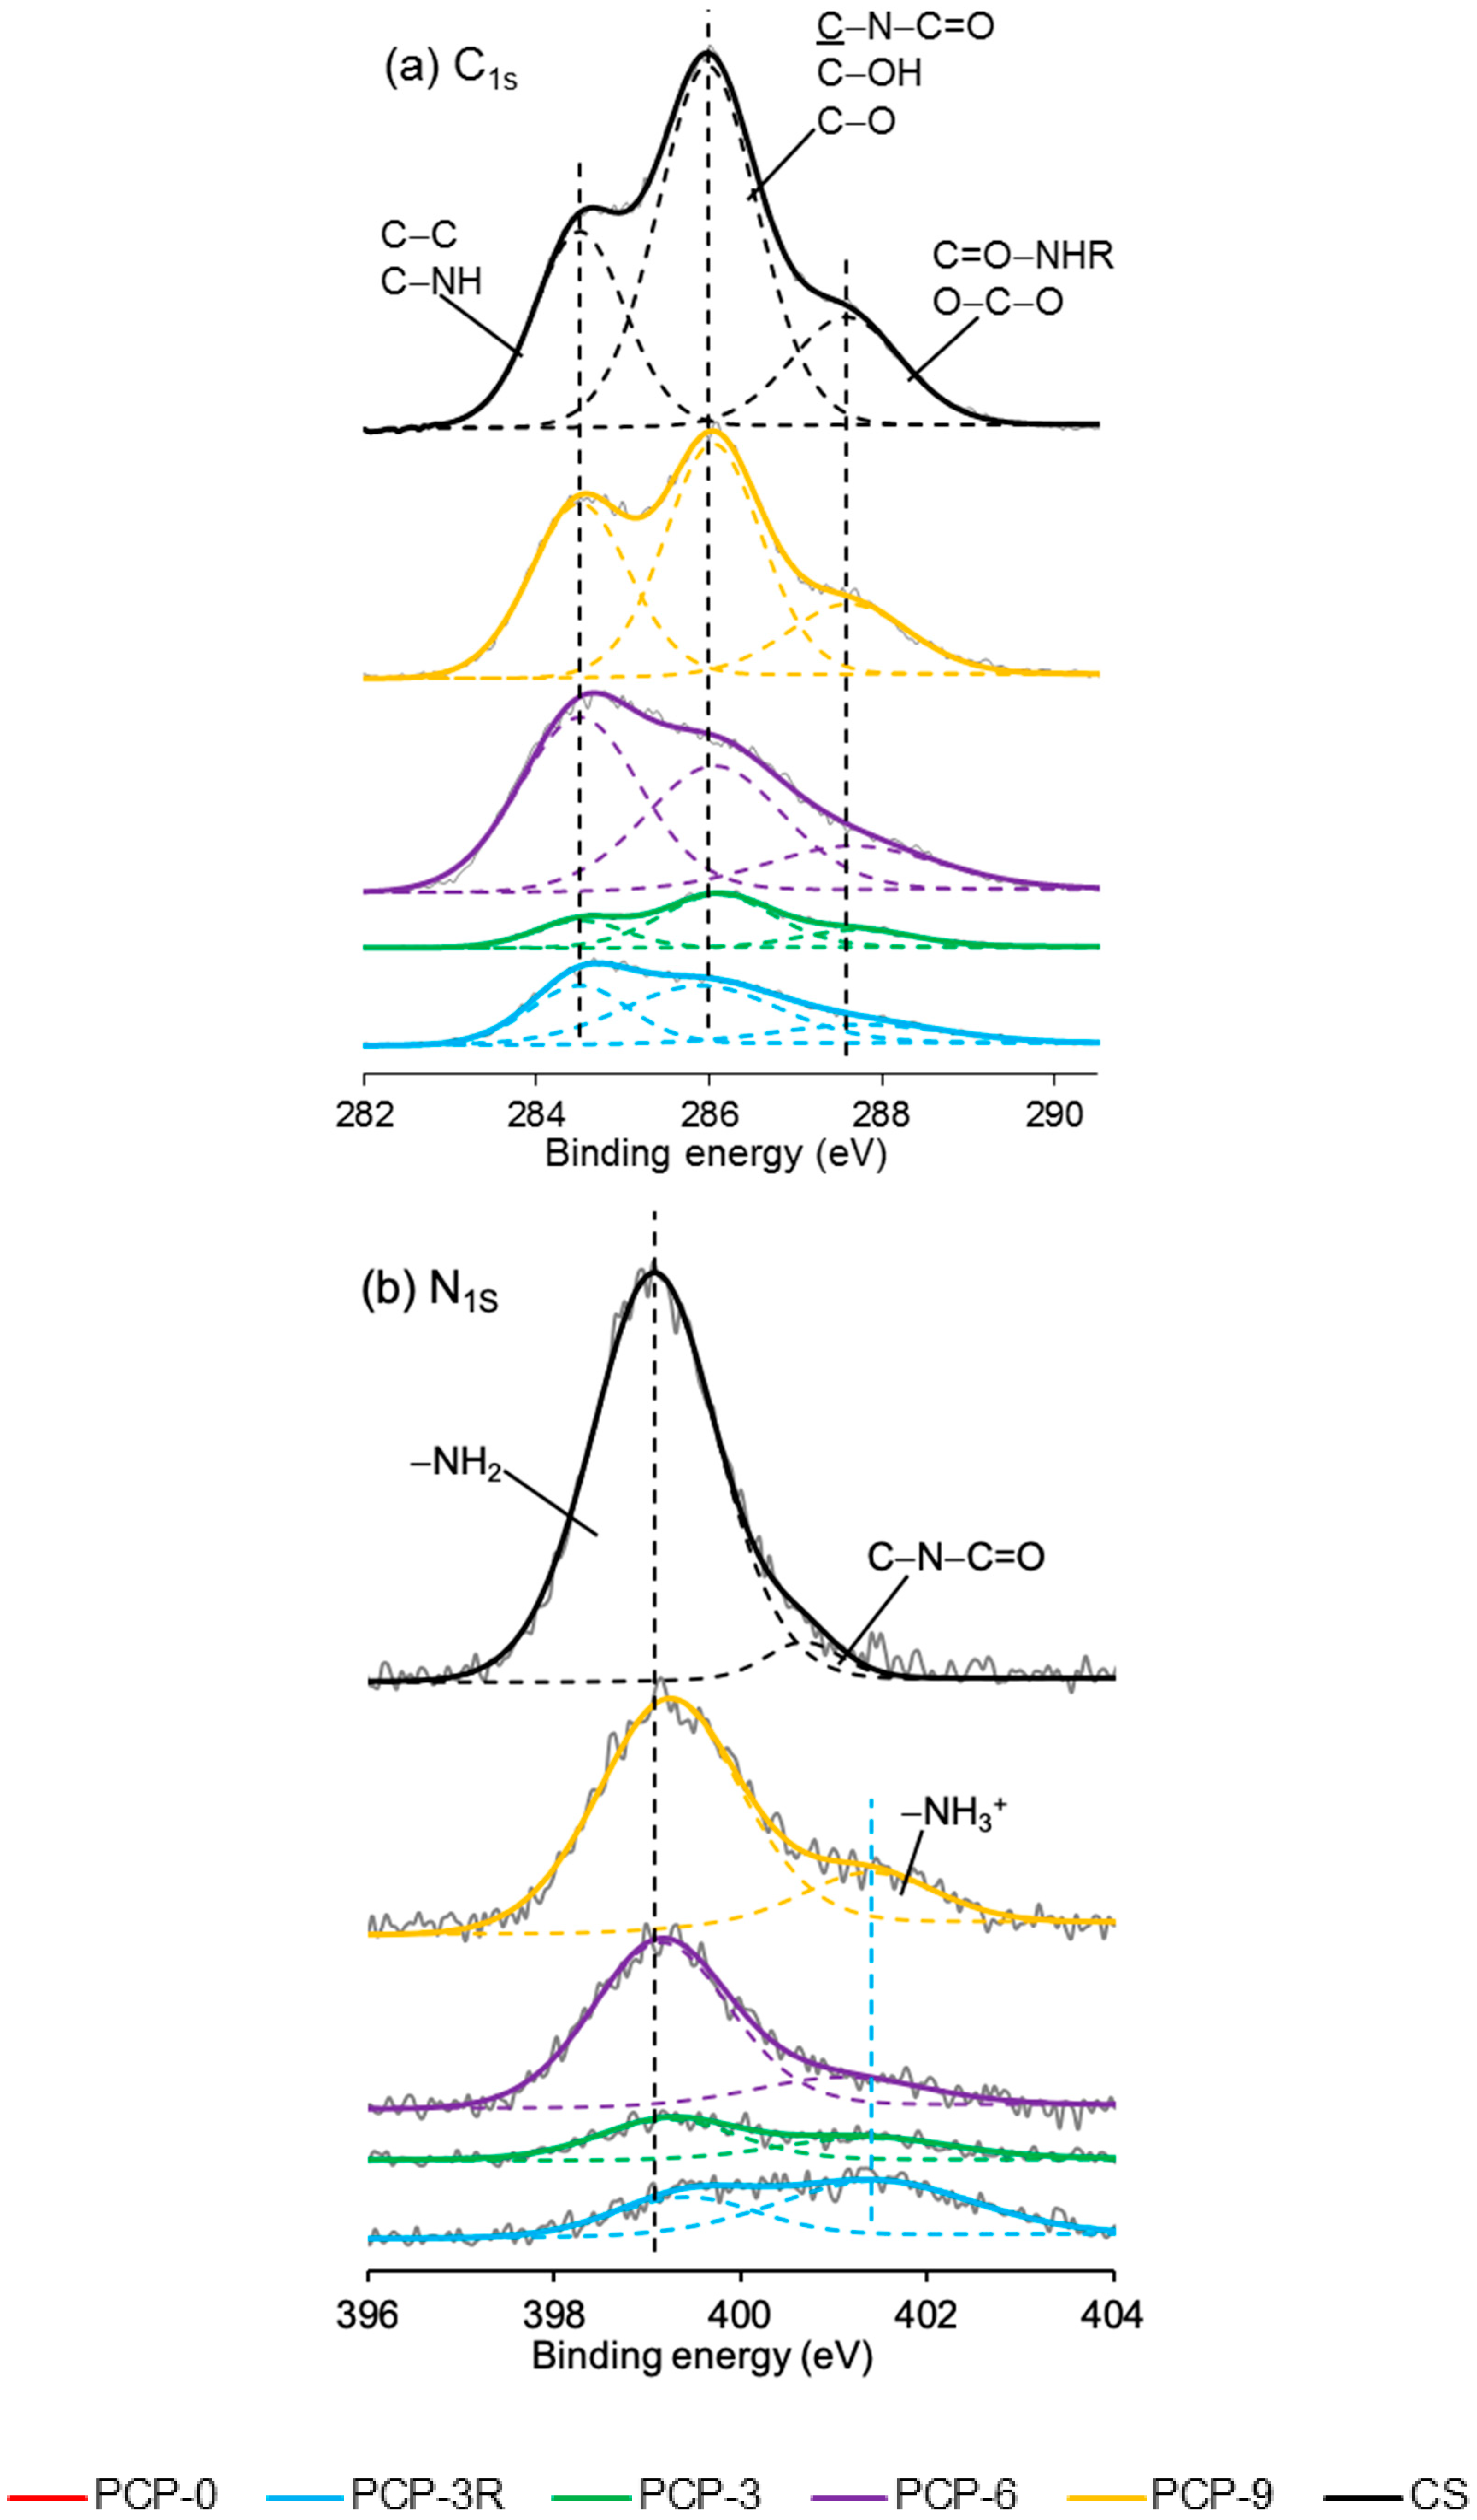
High-resolution XPS spectroscopy was performed on the coated/uncoated fibres and the CS powder. Narrow scans of C1s, O1s, N1s, and P2p are exhibited in Figure 8. In the C1s scan of CS, the carbon peak was deconvoluted into three signals at 284.5, 286.0, and 287.6 eV binding energy. Similar peaks were also observed in the spectrum of PCP-3R, -3, -6, and -9.
The nitrogen peak in the spectrum of CS was deconvoluted into two signals, involving the main peak at 399.1 eV and a much smaller peak at 400.7 eV binding energy. Their atomic ratios were 95 and 5%, respectively. The peak at 399.2 ± 0.1 eV was also found in the spectrum of PCP-3R, -3, -6, and -9, whilst a new peak appeared at 401.3 ± 0.1 eV binding energy. Moreover, the atomic ratio of the peak at 401.3 ± 0.1 eV was observed to increase from 40% to 65% as the PCP-3 samples were treated by the post-cleaning process. On the contrary, the atomic ratio of the 401.3 ± 0.1 eV-peak decreased to 17% as the CS concentration increased from PCP-3 to PCP-6. However, the atomic ratio remained constant when the CS concentration increased from PCP-6 to PCP-9. The details of the binding energy and atomic ratio of nitrogen are shown in Table 5.
In the O1s spectroscopy, the spectrum of CS required three peaks for the curve fit, including the main peak at 532.3 eV taking 86% of the oxygen atomic ratio and two much smaller peaks at 530.9 and 533.7 eV. The O1s peak of PCP-0 showed two deconvoluted peaks at 530.8 and 532.4 eV binding energy. Due to the absorption peaks over similar ranges of binding energy, it was difficult to differentiate the peaks between PCP-0 and CS in the spectrum of coated fibres. However, as shown in Figure 8c, it was obvious that the signal of CS gradually dominated the peak from PCP-3R to PCP-9.
The P2p peak of PCP-0 was deconvoluted into two peaks at 133.3 and 134.4 eV binding energy. Their atomic ratio was 67:33. Similar peaks were also observed in the spectrum of the coated fibres.
4. Discussion
4.1. Mechanical Properties
The impact on fibre strength caused by the acetic acid solution used for dip-coating and post-cleaning was investigated by a comparison of PCP-0 with PCP-3 and -3R (see Figure 1). There was no significant difference between the tensile strength of PCP-3 and PCP-0, while a significant decrease of 20.2% (p < 0.001) in tensile strength was observed for PCP-3R as compared to PCP-0. The degradation of PGF in solution is highly pH-dependent and greatly accelerated at low pH [46]. Potentially, the additional exposure to acid in the post-cleaning process caused additional glass degradation and could have created additional surface flaws, affecting the fibre strength [46].
The mechanical properties of PCP-3, -6, and -9 fibres were compared to investigate the influence of varying CS concentration. As shown in Figure 1, a linear increase in tensile strength was shown to be statistically significant (p < 0.05) with respect to the CS concentration. The CS did not contribute significantly to the fibre modulus, due to there being only a thin coating and having a much lower modulus than the glass. However, Gao et al. [47] stated that the CS coating could make contributions to the mechanical properties by reducing the flaw formation and crack growth at the glass fibre surface. Firstly, the CS coating layer could protect the fibre surface from abrasion during sample preparation for tensile testing, as well as moisture/alkali contact and reaction at a crack tip (stress corrosion). Secondly, the protonation of amine groups in CS molecules could decrease the Na+/H+ exchange at the fibre surface, and then the positively charged amine groups could absorb the free hydroxyl ions around the fibre surface. Thirdly, the coated CS could have filled any surface flaws present, and in turn, blunt the crack tips. Finally, shrinkage of the CS during drying could have created compressive stresses on the fibre surface, which may have prevented crack initiation/propagation [47].
4.2. Interfacial Properties
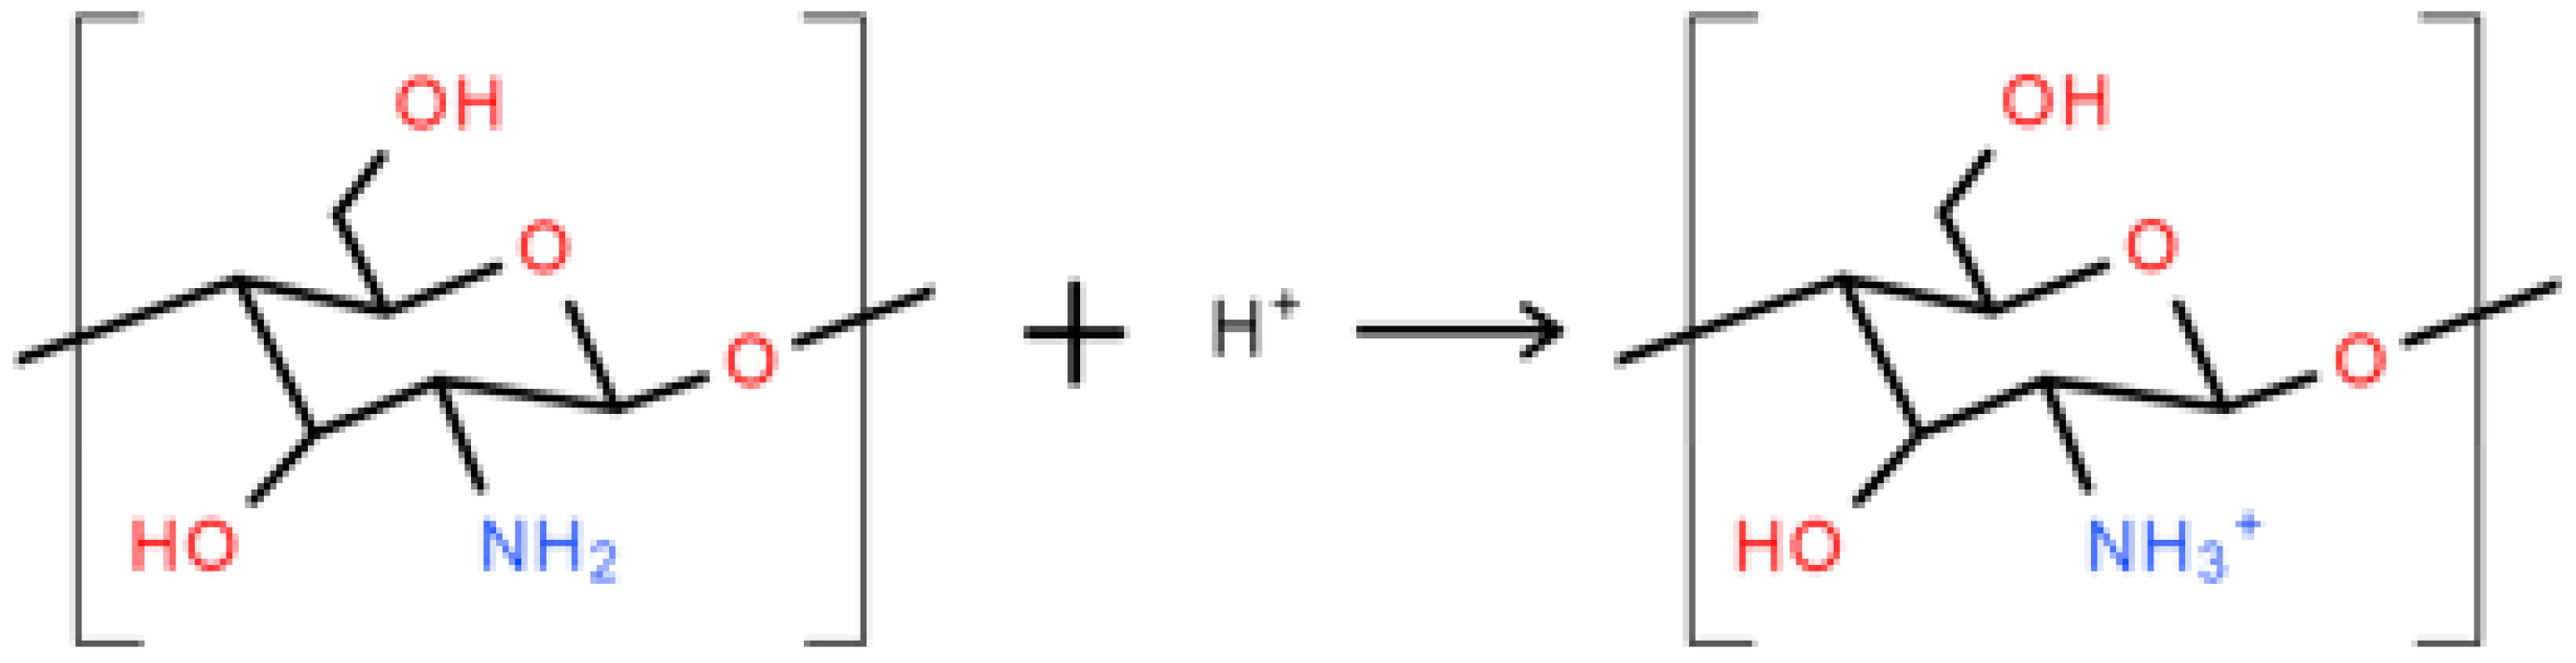
As shown in Figure 2, IFSS between the PCL matrix and the PGF significantly increased (p < 0.001) for PCP-3, which was suggested to be due to the formation of hydrogen bonds between the hydroxyl groups present at the PGF surface and the amino and hydrogen groups in CS [18]. The phosphate glass immersed in aqueous solution will generate O− groups at the glass surface due to the rapid release of sodium ions, whilst the CS in low-pH aqueous solution could have generated NH3+ groups (see Figure 9) [46]. Strong hydrogen bonds of 20–40 kcal/mol could be formed between the charged donor and acceptor groups that are nearly as strong as covalent bonds [48]. Kohl et al. [49] reported that glass fibres with native surface hydroxyl groups could have strong hydrogen-bonding interactions (high surface energy) with polar functional groups of the polymers in glass fibre-reinforced composites.
The protonation could have also enabled CS to possess pH-dependent electrostatic interactions with the phosphate groups on the PGFs in a manner similar to amino silane [50]. Huang et al. [51] added glycerol–phosphate to the CS–acetic acid solution and found that the interaction between the NH3+ and P–OH groups was caused by electrostatic attraction. Chenite et al. [52] summarised that the combination of CS and polyol–phosphate salts could have formed hydrogen bonding, electrostatic interactions, and hydrophobic interactions in acetic acid solution. Amaral et al. [53] investigated the phosphorylation of CS using XPS and assigned the signal at 401.4 eV in the N1s peak to the amino groups in ammonium form. They proposed that the phosphate groups and the protonated amine groups were likely to form salt linkages with inter- or intrachain ionic bonds.
Zhang et al. [16] reinforced a CS scaffold with P2O5–CaO invert glass and suggested that the chemical attraction between CS and the glass may take place due to the high surface charge density of CS. They inferred that not only that the physical incorporation of the glass powders into the CS matrix occurred, but that the chemical complexation between CS and the glass may also occur due to the high surface charge density of CS and its ability to form ionic complexes.
A further increase in IFSS was observed after the post-cleaning treatment, which was employed to remove any excess CS coating on the fibre surface and consequently improved the load transmission between the matrix and fibres (see Figure 2) [54]. However, no evidence of an increase in fibre roughness was observed at the resolution of SEM microscopy after post-cleaning.
The IFSS value reduced from 8.72 to 8.34 MPa when the CS concentration was increased from PCP-3 to PCP-6, whilst it reduced to 8.24 MPa when the CS concentration was increased to PCP-9. This linear reduction may also relate to poorer load transmission from the matrix to the reinforcing fibres caused by the thicker coating. As shown in Figure 2, the effect of CS concentration on the IFSS was relatively small, but cumulative.
Bhattarai et al. [55] investigated CS–PCL polyblend nanofibres in comparison to PCL products. They reported an enhancement in mechanical properties and cellular behaviour without the creation of chemical crosslinking between the CS and the PCL. Copper et al. [15] also achieved better mechanical properties and cellular compatibility from CS-PCL fibres compared to the PCL products alone.
Furthermore, the different profiles of Figure 1 and Figure 2 reveal that the fibre strength increased, but the IFSS decreased with increasing CS concentration. Therefore, an optimal solution can be expected between PCP-3R and -3 to balance the mechanical and interfacial properties during the application of the CS coupling agent.
4.3. SEM Analysis
As shown in Figure 3, the surface of the uncoated fibre (PCP-0) was smooth, while excess attachment was observed on the surface of all the coated fibres (PCP-3R, -3, -6, and -9), which evidenced the presence of a CS coating on the fibres. The difference between Figure 3b,c indicated removal of excess coating by post-cleaning. In addition, no visible cracks or pits were observed on the surface of all the fibres after dipping or post-cleaning treatments.
The blistering and skinning indicated by white arrows in Figure 3f were observed at the fibre surface after a prolonged exposure to the electron beam. This phenomenon was suggested to be associated with the heating on the fibre surface caused by electronic scanning, indicating a heat-sensitive coating layer on the fibre. This was interpreted as further evidence of a polymeric CS layer on the fibres. Furthermore, the connection between two filaments presented in in Figure 3g showed the potential of CS to act as a binder or film former as well as a coupling agent.
4.4. TGA
Zawadzki et al. [27] conducted TGA of CS from room temperature to 600 °C under a nitrogen atmosphere, and suggested that the TGA behaviour of solid CS can be divided into three stages: (1) the removal of water below 100 °C, in which the water was physically adsorbed and/or weakly hydrogen-bonded to CS molecules; (2) the release of strongly hydrogen-bonded water starting above 100 °C and reaching the maximum rate at ~168 °C; and (3) the predominant weight loss by 43% at 230–400 °C caused by the depolymerisation of CS chains, the decomposition of pyranose rings via dehydration and deamination, and finally, a ring-opening reaction. The quantities of weight loss provided in Table 3 indicated the presence of a coating layer on the fibres. The thermal behaviours traced in Figure 4 showed a good agreement with reference [27], further proving the coating layer to be CS.
An increase in weight loss of CS was also shown in Table 3, indicating a thicker CS coating layer with higher CS concentration, which was suggested to be due to the aggregation behaviour of CS polymer chains. The rapid release of alkali (Na+) in the coating solution introduced negative charge at the fibre surface, which attracted NH3+ groups of CS, further leading to an uneven charge distribution of the CS chains caused by asymmetric electron dispersion. Then, the CS coating on the fibre surface was increased by charge attraction and stabilised via intermolecular hydrogen-bonding [27]. Several articles [10,56] have reported that CS can form an entangled network in an acidic aqueous medium by crosslinking with itself and that the crosslinking involves two structural units that may be from the same or from different CS polymer chains.
In addition, the post-cleaning process may have disrupted the intermolecular hydrogen bonds and consequently removed any excess CS, leaving only the firmly bonded CS on the fibre surface [25].
4.5. FTIR and Raman Analyses
As shown in Figure 5, the absorption bands at 3291 and 3358 cm–1 were assigned to the stretching vibrations of O–H and N–H, respectively. The intensity of these two bands on CS–S was observed to reduce as compared to CS–P, which was suggested to be due to the formation of intermolecular hydrogen bonds in the excess CS coating [11]. The band of NH2 at 1589 cm–1 was replaced by a new band of NH3+ at 1560 cm–1 on CS–S, suggesting the formation of hydrogen bonds to balance the change of charges in the excess CS [27]. The bands at 561 and 1063 cm–1 could be identified as crystallisation-sensitive bands of CS, and the changes of these bands in wavenumber and intensity that occurred on CS–S implied that an intermolecular interaction between different polymer chains disturbed the crystallisation of CS [34]. The absence of a characteristic band at ~1730 cm−1 on CS–S implied that there was no residual COOH group on the fibres after coating application [57].
The band at 495 cm−1 shown in Figure 6a was assigned to the asymmetric bending vibration of O–P–O in Q1 units, and a slight shift to a lower wavenumber occurred for the coated fibres, which might be attributed to the interaction between the pyrophosphate units and the coating [28]. The bands at 754 and 894 cm−1 were assigned to the symmetric and asymmetric stretching of P–O–P bridging bonds in Q2 units, respectively [30]. The latter band was observed to decrease in intensity and shift to a lower wavenumber for the coated fibres, which was suggested to be due to the reduction in Q2 units, indicating a depolymerisation of metaphosphate units in acid solution. The Raman spectra in Figure 7a also showed a reduction in intensity of the band at 1097 cm−1 (the asymmetric stretching vibration of (P2O7)4− in Q1 units [38]) and the shoulder at ~1250 cm−1 (the asymmetric stretching vibration of (PO3)− in Q2 units [39]) for the coated fibres, indicating a decrease in concentration of pyro- and metaphosphate units.
As shown in Figure 6b, the replacement of the band of NH2 at 1589 cm–1 by the new bands appearing at 1547, 1560, and 1552 cm–1 on PCP-3, -6, and -9, respectively, was attributed to the protonation of the amine groups in CS [33]. Lawrie et al. [58] reported that partial protonation of NH2 groups in CS could cause the appearance of a new band at ~1530 cm−1 due to one of the NH3+ vibrational modes. The difference of the band locations between the literature and this study might be due to the interaction between the charged amine groups and the phosphate units. The Raman spectra in Figure 7b,c show that the bands of the bending (1596 cm−1) and stretching (3305 cm−1) vibrations of NH2 disappeared for the coated fibres, and this was attributed to the protonation of amine groups, which correlated well with the IR results [41].
Bhumkar et al. [59] investigated the crosslinking of CS with sodium tripolyphosphate in acidic aqueous solution via FTIR. They reported that in the IR spectra of crosslinked CS, the band at 1655 cm–1 disappeared and two new bands appeared at 1554 and 1645 cm–1, due to the linkage between the phosphoric and ammonium ions. Therefore, the appearance of the bands at ~1547 and ~1635 cm−1 and the intensity reduction of the band at 1648 cm−1 for the coated fibres suggested interaction of the NH3+ groups with the fibre surface (see Figure 6b). Moreover, it was also suggested that the formation of hydrogen bonding contributed to the interaction between the charged CS and PGFs. Sayyar et al. [60] characterised graphene-filled CS composites using FTIR. They found that the bands corresponding to the N–H bending of the amino group (1573 cm−1), C=O stretching of the amide group (1658 cm−1), and N–H stretching of the amino group (3464 cm−1) in CS shifted to a lower wavenumber in composite films, indicating likely hydrogen-bonding interactions between CS and lactic acid and reduced graphene oxide.
4.6. XPS Analysis
The C1s peaks of CS shown in Figure 8a have a good agreement with the literature [61]. The peak at 284.5 eV was assigned to C–C or C–NH2; 286.0 eV was assigned to C–O, C–OH, or C–NHC=O; and 287.6 eV was assigned to O–C–O or C=O–NHR chemical bonds. The detection of these signals for the coated fibres indicated the presence of CS on the fibre surface. The minor difference between the spectra of the CS powder and the coated fibres was suggested to be due to contamination carbon on the fibres.
The N1s peak of CS could be resolved into two peaks at 399.1 and 400.7 eV, assigned to the nitrogen of the amino and amide groups, respectively [62]. The atom % of the amino peak was 95%, agreeing well with the degree of deacetylation (DD > 80%) quoted by the supplier. As shown in Figure 8b, the peak of NH2 was also found for the coated fibres, whilst a new peak of NH3+ appeared at 401.3 ± 0.1 eV binding energy, indicating the partial protonation of the amino groups [62]. Lawrie et al. [58] performed XPS on CS powders from Sigma with a reported 85% degree of deacetylation. They identified the N1s peak as one main signal at 399.4 eV with another weaker signal at 400.5 eV, corresponding to the amino and amide, respectively. They subsequently characterised the acid-treated CS film and detected one more signal at 401.4 eV, attributing to the protonated amine.
As shown in Table 5, the atomic percentage of the NH3+ in PCP-3 increased from 40% to 65% after the post-cleaning, supporting the assertion that the post-cleaning process removed excess unreacted CS adsorbed to fibre surface by weak hydrogen bonds. In contrast, the atom % decreased to 17% in PCP-6 with increasing CS concentration, indicating an increasing layer of excess CS. The atomic % was observed to remain constant in PCP-9 as compared to PCP-6, indicating that there was a threshold of concentration of CS interacting with the PGF surface. The changes in the atomic % of NH3+ were also observed to be consistent with the IFSS profile shown in Figure 2, which revealed the efficiency of the CS coating.
The O1s spectrum of CS was resolved into one main peak at 532.3 eV and two weak peaks at 530.9 and 533.7 eV. The peak at 532.3 eV was assigned to C–O–C, O–H, or bound water and the two weak peaks were assigned to C=O in the amide group and O–C–O in the pyranose ring, respectively [61]. The O1s spectrum of PGF was deconvoluted into two peaks at 530.6 and 531.8 eV binding energy, corresponding to the nonbridging and bridging phosphate oxygens, respectively [25]. Although it was difficult to differentiate the subpeaks from the overlapped binding energy range, the signal of CS was seen to dominate the overlapping peak gradually from PCP-3R to PCP-9, which indicated the increase in CS on the fibres, fitting well with the TGA results.
The P2p peak of PGF was composed of the P2p3/2/P2p1/2 doublet, and was fitted with an energy difference of 1.1 eV and an approximate atomic ratio of 2:1. The peak of P2p3/2 at 133.3 eV was attributed to the pentavalent tetracoordinated phosphorus (pyrophosphate and orthophosphate) surrounded by a different chemical environment (phosphate-like structure), and the peak of P2p1/2 at 134.4 eV was attributed to the metaphosphate [63]. The peaks at similar binding energy were also observed for the coated fibres.
In summary: (1) The presence of CS coating on the fibre surface was confirmed via TGA, FTIR, Raman, and XPS analyses. (2) SEM and TGA indicated the formation of a thicker CS coating layer when using the solution of higher CS concentration. (3) The results of tensile tests indicated that the CS coating protected the fibres from losing strength in the acid solution. (4) The results from single-fibre fragmentation tests indicated that CS coupling agents improved the IFSS of the composites, due to the interaction between the protonated amine groups of CS and the hydrogen groups in the fibre surface, as correlated via the analyses of FTIR, Raman, and XPS.
5. Conclusions
CS showed its potential to improve the interface of PGF/PCL composites, in which the protonation of amine groups plays a central role in the interaction between CS and PGF. The nitrogen spectrum of XPS revealed a threshold of efficient CS coating for interfacial improvement. The post-cleaning process could remove the excess CS on the fibre surface and consequently increase the efficiency of the coupling agent.
The coated CS layer showed a significant effect on the fibre surface protection, resulting in a maintenance of mechanical strength after dipping in the acetic acid solution. In addition, TGA and SEM indicated an increase in coating thickness with higher CS concentration in the coating solution. However, a thicker CS layer could also have led to poorer load transmission between the fibre and matrix. Therefore, a balance of the mechanical and interfacial properties would be considered during the application of CS as a coupling agent. This balance is suggested to be achieved by adjusting the CS concentration and the post-cleaning duration.
Author Contributions
C.T. and I.A. conceived the original idea. C.T. carried out the experiment. J.Z. fabricated the PCL film and single fibre composite samples. W.C. supported on the XPS experiment and discussion. C.T. wrote the manuscript with support from I.A., A.P. and N.S. A.P. helped supervise the project. C.R. and I.A. supervised the project.
Funding
The authors kindly acknowledge the financial support from the Ningbo Education Bureau, Ningbo Science and Technology Bureau, China’s MOST, and The University of Nottingham. Additionally, the authors also would like to acknowledge financial support from the Ningbo S&T bureau Ningbo International Collaboration Project (project code 2017D10012) and the Ningbo 3315 Innovation team Scheme “Composites Development and Manufacturing for Sustainable Environment”.
Acknowledgments
The authors would like to acknowledge all the technical staff of the ITRC and Wolfson Building in UK campus and the SEB in Ningbo campus of Nottingham University, for their guidance and technical assistance.
Conflicts of Interest
The authors declare no conflicts of interest.
References
- Ahmed, I.; Jones, I.A.; Parsons, A.J.; Bernard, J.; Farmer, J.; Scotchford, C.A.; Walker, G.S.; Rudd, C.D. Composites for bone repair: Phosphate glass fibre reinforced PLA with varying fibre architecture. J. Mater. Sci. Mater. Med. 2011, 22, 1825–1834. [Google Scholar] [CrossRef]
- Parsons, A.J.; Ahmed, I.; Haque, P.; Fitzpatrick, B.; Niazi, M.I.K.; Walker, G.S.; Rudd, C.D. Phosphate glass fibre composites for bone repair. J. Bionic Eng. 2009, 6, 318–323. [Google Scholar] [CrossRef]
- Bas, O.; De-Juan-Pardo, E.M.; Meinert, C.; D’Angella, D.; Baldwin, J.G.; Bray, L.J.; Wellard, R.M.; Kollmannsberger, S.; Rank, E.; Werner, C. Biofabricated soft network composites for cartilage tissue engineering. Biofabrication 2017, 9, 25014. [Google Scholar] [CrossRef] [PubMed] [Green Version]
- Scribante, A.; Vallittu, P.K.; Özcan, M. Fiber-Reinforced Composites for Dental Applications. Biomed. Res. Int. 2018, 2018. [Google Scholar] [CrossRef] [PubMed]
- Hasan, M.S.; Ahmed, I.; Parsons, A.J.; Walker, G.S.; Scotchford, C.A. The influence of coupling agents on mechanical property retention and long-term cytocompatibility of phosphate glass fibre reinforced PLA composites. J. Mech. Behav. Biomed. Mater. 2013, 28, 1–14. [Google Scholar] [CrossRef] [PubMed]
- Mohammadi, M.S.; Ahmed, I.; Muja, N.; Rudd, C.D.; Bureau, M.N.; Nazhat, S.N. Effect of phosphate-based glass fibre surface properties on thermally produced poly(lactic acid) matrix composites. J. Mater. Sci. Mater. Med. 2011, 22, 2659–2672. [Google Scholar] [CrossRef] [PubMed]
- Haque, P.; Barker, I.A.; Parsons, A.; Thurecht, K.J.; Ahmed, I.; Walker, G.S.; Rudd, C.D.; Irvine, D.J. Influence of compatibilizing agent molecular structure on the mechanical properties of phosphate glass fiber-reinforced PLA composites. J. Polym. Sci. Polym. Chem. 2010, 48, 3082–3094. [Google Scholar] [CrossRef]
- Lee, D.W.; Lim, H.; Chong, H.N.; Shim, W.S. Advances in chitosan material and its hybrid derivatives: A review. Open Biomater. J. 2009, 1, 10–29. [Google Scholar] [CrossRef]
- Rinaudo, M. Chitin and chitosan: Properties and applications. Prog. Polym. Sci. 2006, 31, 603–632. [Google Scholar] [CrossRef]
- Pillai, C.K.S.; Paul, W.; Sharma, C.P. Chitin and chitosan polymers: Chemistry, solubility and fiber formation. Prog. Polym. Sci. 2009, 34, 641–678. [Google Scholar] [CrossRef]
- Ramya, R.; Sudha, P.N.; Mahalakshmi, J. Preparation and characterization of chitosan binary blend. Int. J. Sci. Res. Publ. 2012, 2, 1–9. [Google Scholar]
- Xu, K.; Li, K.; Zhong, T.; Guan, L.; Xie, C.; Li, S. Effects of chitosan as biopolymer coupling agent on the thermal and rheological properties of polyvinyl chloride/wood flour composites. Compos. Part B Eng. 2014, 58, 392–399. [Google Scholar] [CrossRef]
- Cai, X.; Tong, H.; Shen, X.; Chen, W.; Yan, J.; Hu, J. Preparation and characterization of homogeneous chitosan-polylactic acid/hydroxyapatite nanocomposite for bone tissue engineering and evaluation of its mechanical properties. Acta Biomater. 2009, 5, 2693–2703. [Google Scholar] [CrossRef] [PubMed]
- Min, D.H.; Kim, M.J.; Yun, J.H.; Kim, C.S.; Lee, Y.K.; Choi, S.H.; Kim, K.N.; Kim, C.K. Effect of calcium phosphate glass scaffold with chitosan membrane on the healing of alveolar bone in 1 wall intrabony defect in the beagle dogs. Key Eng. Mater. 2005, 284–286, 851–854. [Google Scholar] [CrossRef]
- Cooper, A.; Bhattarai, N.; Zhang, M. Fabrication and cellular compatibility of aligned chitosan—PCL fibers for nerve tissue regeneration. Carbohydr. Polym. 2011, 85, 149–156. [Google Scholar] [CrossRef]
- Zhang, Y.; Zhang, M. Microstructural and mechanical characterization of chitosan scaffolds reinforced by calcium phosphates. J. Non-Cryst. Solids 2001, 282, 159–164. [Google Scholar] [CrossRef]
- Felfel, R.M.; Ahmed, I.; Parsons, A.J.; Harper, L.T.; Rudd, C.D. Initial mechanical properties of phosphate-glass fibre-reinforced rods for use as resorbable intramedullary nails. J. Mater. Sci. 2012, 47, 4884–4894. [Google Scholar] [CrossRef]
- Pacaphol, K.; Aht-Ong, D. The influences of silanes on interfacial adhesion and surface properties of nanocellulose film coating on glass and aluminum substrates. Surf. Coat. Technol. 2017, 320, 70–81. [Google Scholar] [CrossRef]
- Gunanathan, C.; Ben-David, Y.; Milstein, D. Direct synthesis of amides from alcohols and amines with liberation of H2. Science 2007, 317, 790–792. [Google Scholar] [CrossRef]
- El-Hefian, E.A.; Nasef, M.M.; Yahaya, A.H. The preparation and characterization of chitosan/poly (vinyl alcohol) blended films. J. Chem. 2010, 7, 1212–1219. [Google Scholar] [CrossRef]
- Tan, C.; Ahmed, I.; Parsons, A.J.; Sharmin, N.; Zhu, C.; Liu, J.; Rudd, C.D.; Liu, X. Structural, thermal and dissolution properties of MgO- and CaO-containing borophosphate glasses: Effect of Fe2O3 addition. J. Mater. Sci. 2017, 52, 7489–7502. [Google Scholar] [CrossRef]
- Tan, C.; Ahmed, I.; Parsons, A.J.; Zhu, C.; Betanzos, F.B.; Rudd, C.D.; Liu, X. Effects of Fe2O3 addition and annealing on the mechanical and dissolution properties of MgO- and CaO-containing phosphate glass fibres for bio-applications. Biomed. Glasses 2018, 4, 57–71. [Google Scholar] [CrossRef]
- Jin, R.M.; Sultana, N.; Baba, S.; Hamdan, S.; Ismail, A.F. Porous PCL/chitosan and nHA/PCL/chitosan scaffolds for tissue engineering applications: Fabrication and evaluation. J. Nanomater. 2015, 2015, 1–8. [Google Scholar] [CrossRef]
- Ahmed, I.; Parsons, A.J.; Palmer, G.; Knowles, J.C.; Walker, G.S.; Rudd, C.D. Weight loss, ion release and initial mechanical properties of a binary calcium phosphate glass fibre/PCL composite. Acta Biomater. 2008, 4, 1307–1314. [Google Scholar] [CrossRef] [PubMed]
- Haque, P.; Parsons, A.J.; Barker, I.A.; Ahmed, I.; Irvine, D.J.; Walker, G.S.; Rudd, C.D. Interfacial properties of phosphate glass fibres/PLA composites: Effect of the end functionalities of oligomeric PLA coupling agents. Compos. Sci. Technol. 2010, 70, 1854–1860. [Google Scholar] [CrossRef] [Green Version]
- Sharmin, N.; Rudd, C.D.; Parsons, A.J.; Ahmed, I. Structure, viscosity and fibre drawing properties of phosphate-based glasses: Effect of boron and iron oxide addition. J. Mater. Sci. 2016, 51, 7523–7535. [Google Scholar] [CrossRef]
- Zawadzki, J.; Kaczmarek, H. Thermal treatment of chitosan in various conditions. Carbohydr. Polym. 2010, 80, 394–400. [Google Scholar] [CrossRef]
- Lu, M.; Wang, F.; Liao, Q.; Chen, K.; Qin, J.; Pan, S. FTIR spectra and thermal properties of TiO2-doped iron phosphate glasses. J. Mol. Struct. 2015, 1081, 187–192. [Google Scholar] [CrossRef]
- Qian, B.; Yang, S.; Liang, X.; Lai, Y.; Gao, L.; Yin, G. Structural and thermal properties of La2O3-Fe2O3-P2O5 glasses. J. Mol. Struct. 2012, 1011, 153–157. [Google Scholar] [CrossRef]
- Ciceo-Lucacel, R.; Radu, T.; Ponta, O.; Simon, V. Novel selenium containing boro-phosphate glasses: Preparation and structural study. Mater. Sci. Eng. C Mater. Biol. Appl. 2014, 39, 61–66. [Google Scholar] [CrossRef]
- Sharmin, N.; Hasan, M.S.; Rudd, C.D.; Boyd, D.; Werner-Zwanziger, U.; Ahmed, I.; Parsons, A.J. Effect of boron oxide addition on the viscosity-temperature behaviour and structure of phosphate-based glasses. J. Biomed. Mater. Res. B 2016, 105, 754–777. [Google Scholar] [CrossRef] [PubMed]
- Kweon, H.; Um, I.C.; Park, Y.H. Structural and thermal characteristics of Antheraea pernyi silk fibroin/chitosan blend film. Polymer 2001, 42, 6651–6656. [Google Scholar] [CrossRef]
- Pawlak, A.; Mucha, M. Thermogravimetric and FTIR studies of chitosan blends. Thermochim. Acta 2003, 396, 153–166. [Google Scholar] [CrossRef]
- Zheng, H.; Du, Y.; Yu, J.; Huang, R.; Zhang, L. Preparation and Characterization of Chitosan/Poly(vinyl alcohol) Blend Fibers. J. Appl. Polym. Sci. 2001, 80, 2558–2565. [Google Scholar] [CrossRef]
- Mohammadi, Z.; Mesgar, A.S.; Rasouli-Disfani, F. Reinforcement of freeze-dried chitosan scaffolds with multiphasic calcium phosphate short fibers. J. Mech. Behav. Biomed. Mater. 2016, 61, 590–599. [Google Scholar] [CrossRef] [PubMed]
- Lai, Y.M.; Liang, X.F.; Yang, S.Y.; Wang, J.X.; Cao, L.H.; Dai, B. Raman and FTIR spectra of iron phosphate glasses containing cerium. J. Mol. Struct. 2011, 992, 84–88. [Google Scholar] [CrossRef]
- Saranti, A.; Koutselas, I.; Karakassides, M.A. Bioactive glasses in the system CaO-B2O3-P2O5: Preparation, structural study and in vitro evaluation. J. Non-Cryst. Solids 2006, 352, 390–398. [Google Scholar] [CrossRef]
- Ma, L.; Brow, R.K.; Choudhury, A. Structural study of Na2O-FeO-Fe2O3-P2O5 glasses by Raman and Mössbauer spectroscopy. J. Non-Cryst. Solids 2014, 402, 64–73. [Google Scholar] [CrossRef]
- Joseph, K.; Premila, M.; Amarendra, G.; Kutty, K.V.G.; Sundar, C.S.; Rao, P.R.V. Structure of cesium loaded iron phosphate glasses: An infrared and Raman spectroscopy study. J. Nucl. Mater. 2012, 420, 49–53. [Google Scholar] [CrossRef]
- Mikhailov, G.P.; Tuchkov, S.V.; Lazarev, V.V.; Kulish, E.I. Complexation of chitosan with acetic acid according to Fourier transform Raman spectroscopy data. Russ. J. Phys. Chem. A 2014, 88, 936–941. [Google Scholar] [CrossRef]
- Ren, X.D.; Liu, Q.S.; Feng, H.; Yin, X.Y. The Characterization of Chitosan Nanoparticles by Raman Spectroscopy. Appl. Mech. Mater. 2014, 665, 367–370. [Google Scholar] [CrossRef]
- Reinas, A.E.; Hoscheid, J.; Outuki, P.M.; Cardoso, M.L.C. Preparation and characterization of microcapsules of Pterodon pubescens Benth. by using natural polymers. Braz. J. Pharm. Sci. 2014, 50, 919–930. [Google Scholar] [CrossRef] [Green Version]
- Retamal, M.J.; Cisternas, M.A.; Gutierrez-Maldonado, S.E.; Perez-Acle, T.; Seifert, B.; Busch, M.; Huber, P.; Volkmann, U.G. Towards bio-silicon interfaces: Formation of an ultra-thin self-hydrated artificial membrane composed of dipalmitoylphosphatidylcholine (DPPC) and chitosan deposited in high vacuum from the gas-phase. J. Chem. Phys. 2014, 141, 104201. [Google Scholar] [CrossRef] [PubMed] [Green Version]
- Zajac, A.; Hanuza, J.; Wandas, M.; Dyminska, L. Determination of N-acetylation degree in chitosan using Raman spectroscopy. Spectrochim. Acta A Mol. Biomol. Spectrosc. 2015, 134, 114–120. [Google Scholar] [CrossRef] [PubMed]
- Orrego, C.E.; Salgado, N.; Valencia, J.S.; Giraldo, G.I.; Giraldo, O.H.; Cardona, C.A. Novel chitosan membranes as support for lipases immobilization: Characterization aspects. Carbohydr. Polym. 2010, 79, 9–16. [Google Scholar] [CrossRef]
- Bunker, B.C.; Casey, W.H. The Aqueous Chemistry of Oxides; Oxford University Press: Oxford, UK, 2016. [Google Scholar]
- Gao, S.-L.; Zhang, J.; Liu, J.-W.; Zhuang, R.-C.; Plonka, R.; Mäder, E. Healing Microcracks and Early Warning Composite Fractures. In Proceedings of the 6th Colloquium on Textile Reinforced Structures (CTRS6), Berlin, Germany, 19–20 September 2011. [Google Scholar]
- Perrin, C.L. The Logic behind a Physical-Organic Chemist’s Research Topics. J. Org. Chem. 2017, 82, 819–838. [Google Scholar] [CrossRef]
- Kohl, J.G.; Malicky, D.M.; Jones, A.M. Adhesion of epoxy (pseudobarnacles) to glass that has been treated with hydrophobic carbosilane-based coatings. Prog. Org. Coat. 2017, 107, 1–4. [Google Scholar] [CrossRef]
- Shah, B.L.; Matuana, L.M.; Heiden, P.A. Novel coupling agents for PVC/wood-flour composites. J. Vinyl Addit. Technol 2005, 11, 160–165. [Google Scholar] [CrossRef]
- Huang, C.L.; Chen, Y.B.; Lo, Y.L.; Lin, Y.H. Development of chitosan/beta-glycerophosphate/glycerol hydrogel as a thermosensitive coupling agent. Carbohydr. Polym. 2016, 147, 409–414. [Google Scholar] [CrossRef]
- Chenite, A.; Chaput, C.; Wang, D.; Combes, C.; Buschmann, M.D.; Hoemann, C.D.; Leroux, J.C.; Atkinson, B.L.; Binette, F.; Selmani, A. Novel injectable neutral solutions of chitosan form biodegradable gels in situ. Biomaterials 2000, 21, 2155–2161. [Google Scholar] [CrossRef]
- Amaral, I.F.; Granja, P.L.; Barbosa, M.A. Chemical modification of chitosan by phosphorylation: An XPS, FT-IR and SEM study. J. Biomater. Sci. Polym. Ed. 2005, 16, 1575–1593. [Google Scholar] [CrossRef] [PubMed]
- Hasan, M.S.; Ahmed, I.; Parsons, A.J.; Rudd, C.D.; Walker, G.S.; Scotchford, C.A. Investigating the use of coupling agents to improve the interfacial properties between a resorbable phosphate glass and polylactic acid matrix. J. Biomater. Appl. 2013, 28, 354–366. [Google Scholar] [CrossRef] [PubMed]
- Bhattarai, N.; Li, Z.; Gunn, J.; Leung, M.; Cooper, A.; Edmondson, D.; Veiseh, O.; Chen, M.; Zhang, Y.; Ellenbogen, R.G.; et al. Natural-synthetic polyblend nanofibers for biomedical applications. Adv. Mater. 2009, 21, 2792–2797. [Google Scholar] [CrossRef]
- Berger, J.; Reist, M.; Mayer, J.M.; Felt, O.; Peppas, N.A.; Gurny, R. Structure and interactions in covalently and ionically crosslinked chitosan hydrogels for biomedical applications. Eur. J. Pharm. Biopharm. 2004, 57, 19–34. [Google Scholar] [CrossRef]
- Tanigawa, J.; Miyoshi, N.; Sakurai, K. Characterization of chitosan/citrate and chitosan/acetate films and applications for wound healing. J. Appl. Polym. Sci. 2008, 110, 608–615. [Google Scholar] [CrossRef]
- Lawrie, G.; Keen, I.; Drew, B.; Chandler-Temple, A.; Rintoul, L.; Fredericks, P.; Grøndahl, L. Interactions between Alginate and Chitosan Biopolymers Characterized Using FTIR and XPS. Biomacromolecules 2007, 8, 2533–2541. [Google Scholar] [CrossRef] [PubMed]
- Bhumkar, D.R.; Pokharkar, V.B. Studies on Effect of pH on Cross-linking of Chitosan with Sodium Tripolyphosphate: A Technical Note. AAPS PharmSciTech 2006, 7, E138–E143. [Google Scholar] [CrossRef]
- Sayyar, S.; Murray, E.; Thompson, B.C.; Chung, J.; Officer, D.L.; Gambhir, S.; Spinks, G.M.; Wallace, G.G. Processable conducting graphene/chitosan hydrogels for tissue engineering. J. Mater. Chem. B 2015, 3, 481–490. [Google Scholar] [CrossRef] [Green Version]
- Yap, W.F.; Yunus, W.M.M.; Talib, Z.A.; Yusof, N.A. X-ray photoelectron spectroscopy and atomic force microscopy studies on crosslinked chitosan thin film. Int. J. Phys. Sci. 2011, 6, 2744–2749. [Google Scholar]
- Nikolenko, Y.M.; Kuryavyi, V.G.; Sheveleva, I.V.; Zemskova, L.A.; Sergienko, V.I. Atomic force microscopy and X-ray photoelectron spectroscopy study of chitosan-carbon fiber materials. Inorg. Mater. 2010, 46, 221–225. [Google Scholar] [CrossRef]
- Majjane, A.; Chahine, A.; Et-tabirou, M.; Echchahed, B.; Do, T.-O.; Breen, P.M. X-ray photoelectron spectroscopy (XPS) and FTIR studies of vanadium barium phosphate glasses. Mater. Chem. Phys. 2014, 143, 779–787. [Google Scholar] [CrossRef]
Figure 1.
Mechanical properties (tensile strength and modulus) of coated/uncoated fibres (n = 30). The statistical significance of the paired t-test is indicated (*) at the p < 0.05 level.
Figure 1.
Mechanical properties (tensile strength and modulus) of coated/uncoated fibres (n = 30). The statistical significance of the paired t-test is indicated (*) at the p < 0.05 level.
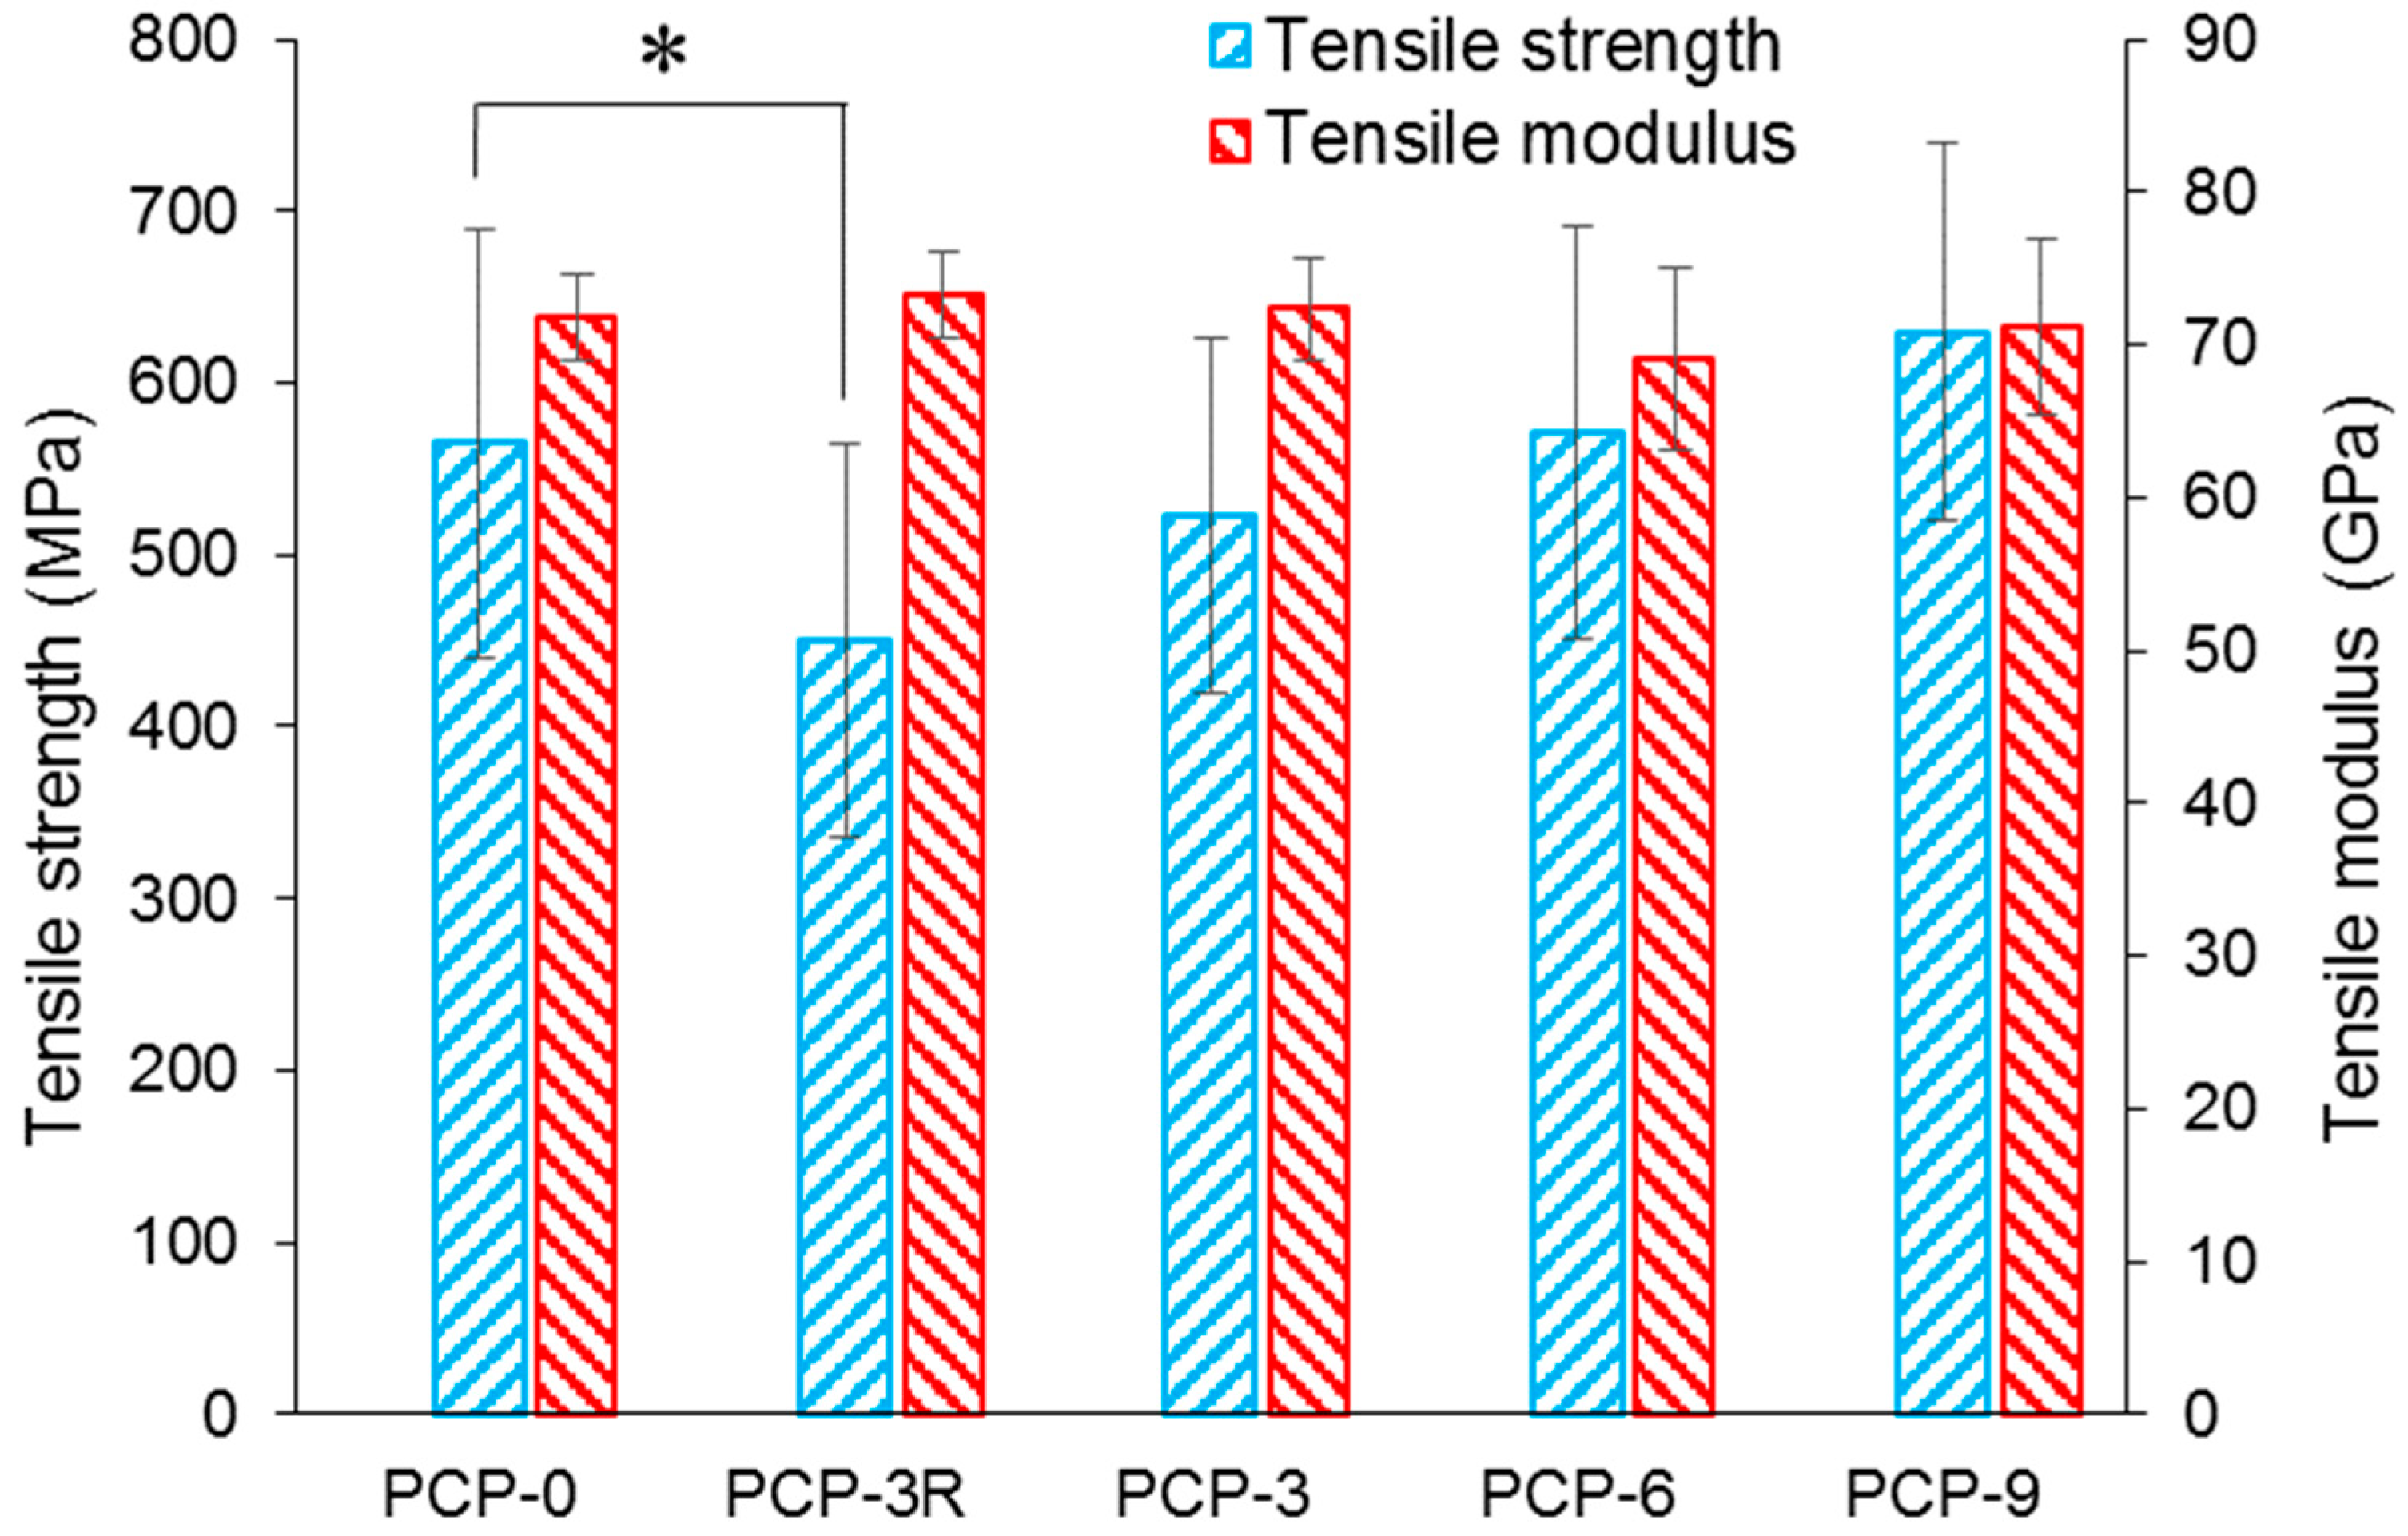
Figure 2.
Interfacial shear strength (IFSS) obtained from fragmentation tests (n = 10). The statistical significance of the paired t-test at p < 0.05 was illustrated (*) compared to PCP-0.
Figure 2.
Interfacial shear strength (IFSS) obtained from fragmentation tests (n = 10). The statistical significance of the paired t-test at p < 0.05 was illustrated (*) compared to PCP-0.
Figure 3.
SEM images of coated/uncoated phosphate glass fibres (PGFs). Subfigures (a–e) show PCP-0, -3R, -3, -6, and -9, respectively; the scale-length of a = 10 µm, the magnification (Mag) of a = 500×, and (a–e) share the same factors. (f) shows blistering of the PCP-3 fibre surface heated by the electron beam; the scale-length of f = 2 µm and the Mag of f = 2000×. (g) shows two combined PCP-3 filaments; the scale-length of g = 10 µm and the Mag of g = 1200×. The cracked base shows the conductive tape.
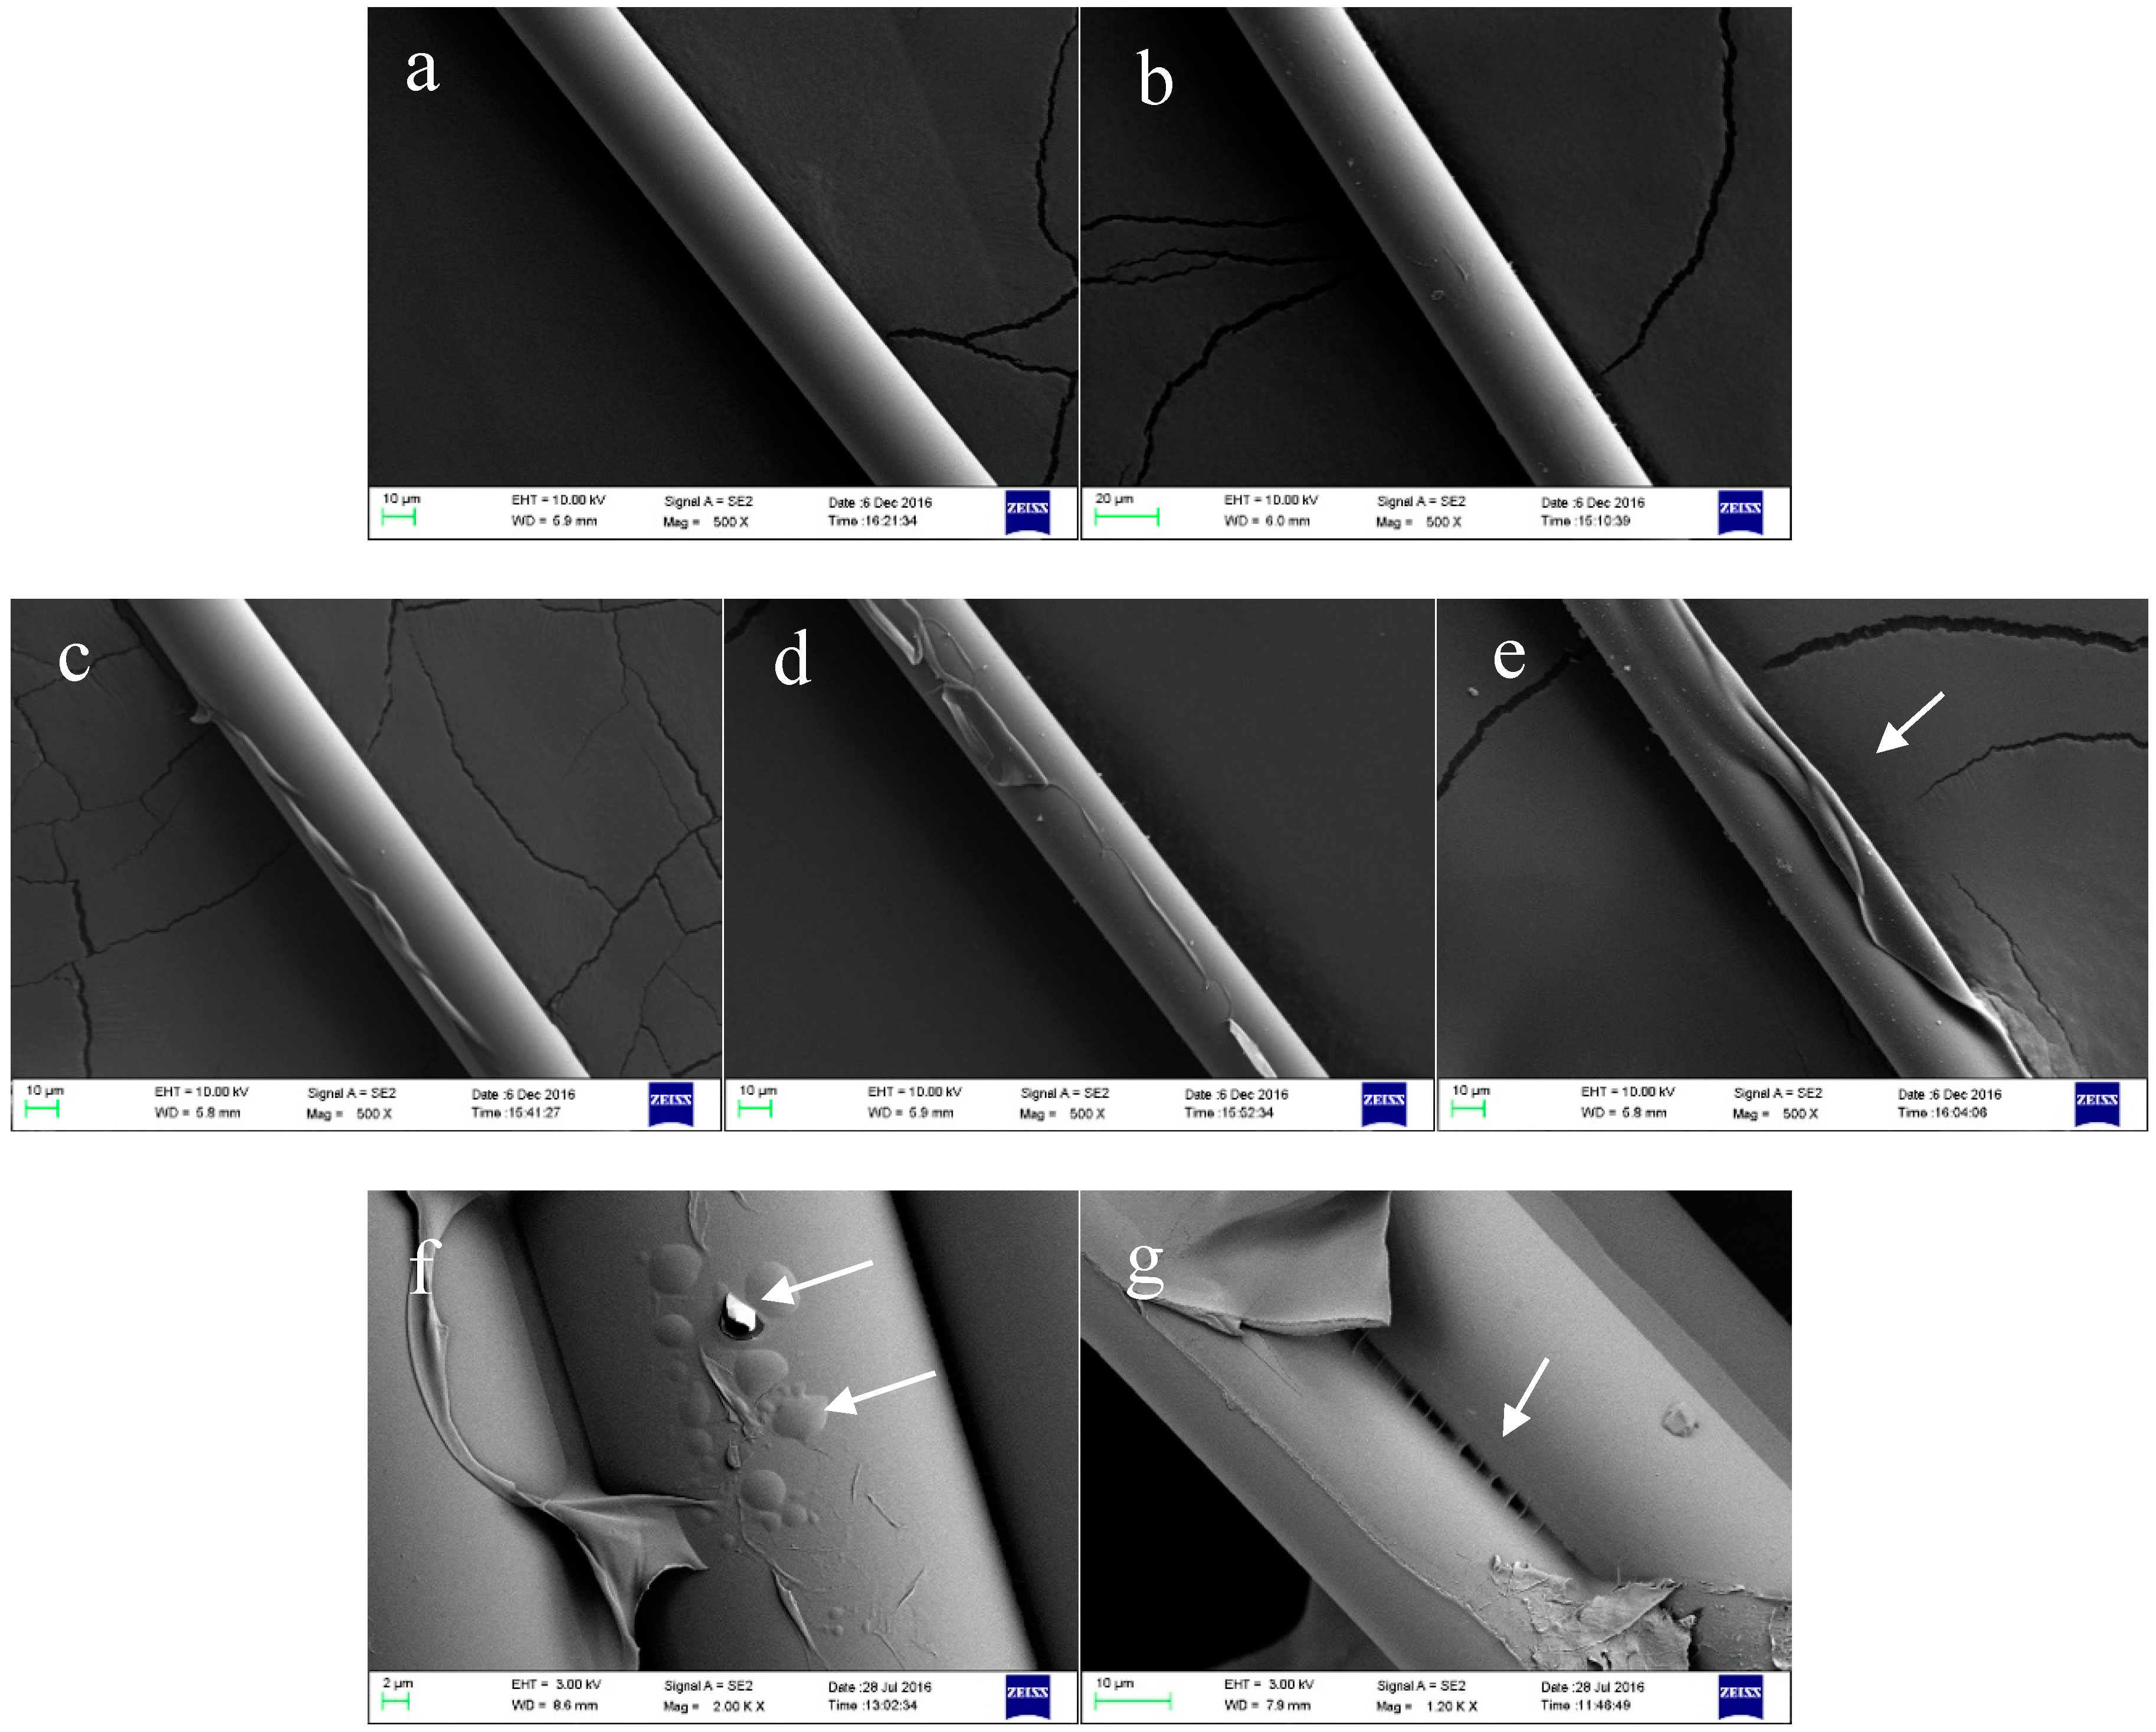
Figure 4.
Weight percentage and derivative of weight percentage (Deriv. Wt) for (a) CS powder and (b) coated/uncoated PGFs. The main weight loss was observed between 230 and 400 °C. The red dashed line and arrow in (a) were added for eyes guide.
Figure 4.
Weight percentage and derivative of weight percentage (Deriv. Wt) for (a) CS powder and (b) coated/uncoated PGFs. The main weight loss was observed between 230 and 400 °C. The red dashed line and arrow in (a) were added for eyes guide.

Figure 5.
FTIR spectra of the CS powder used for coating (CS-P) and the “seam” on the PGFs (CS-S).
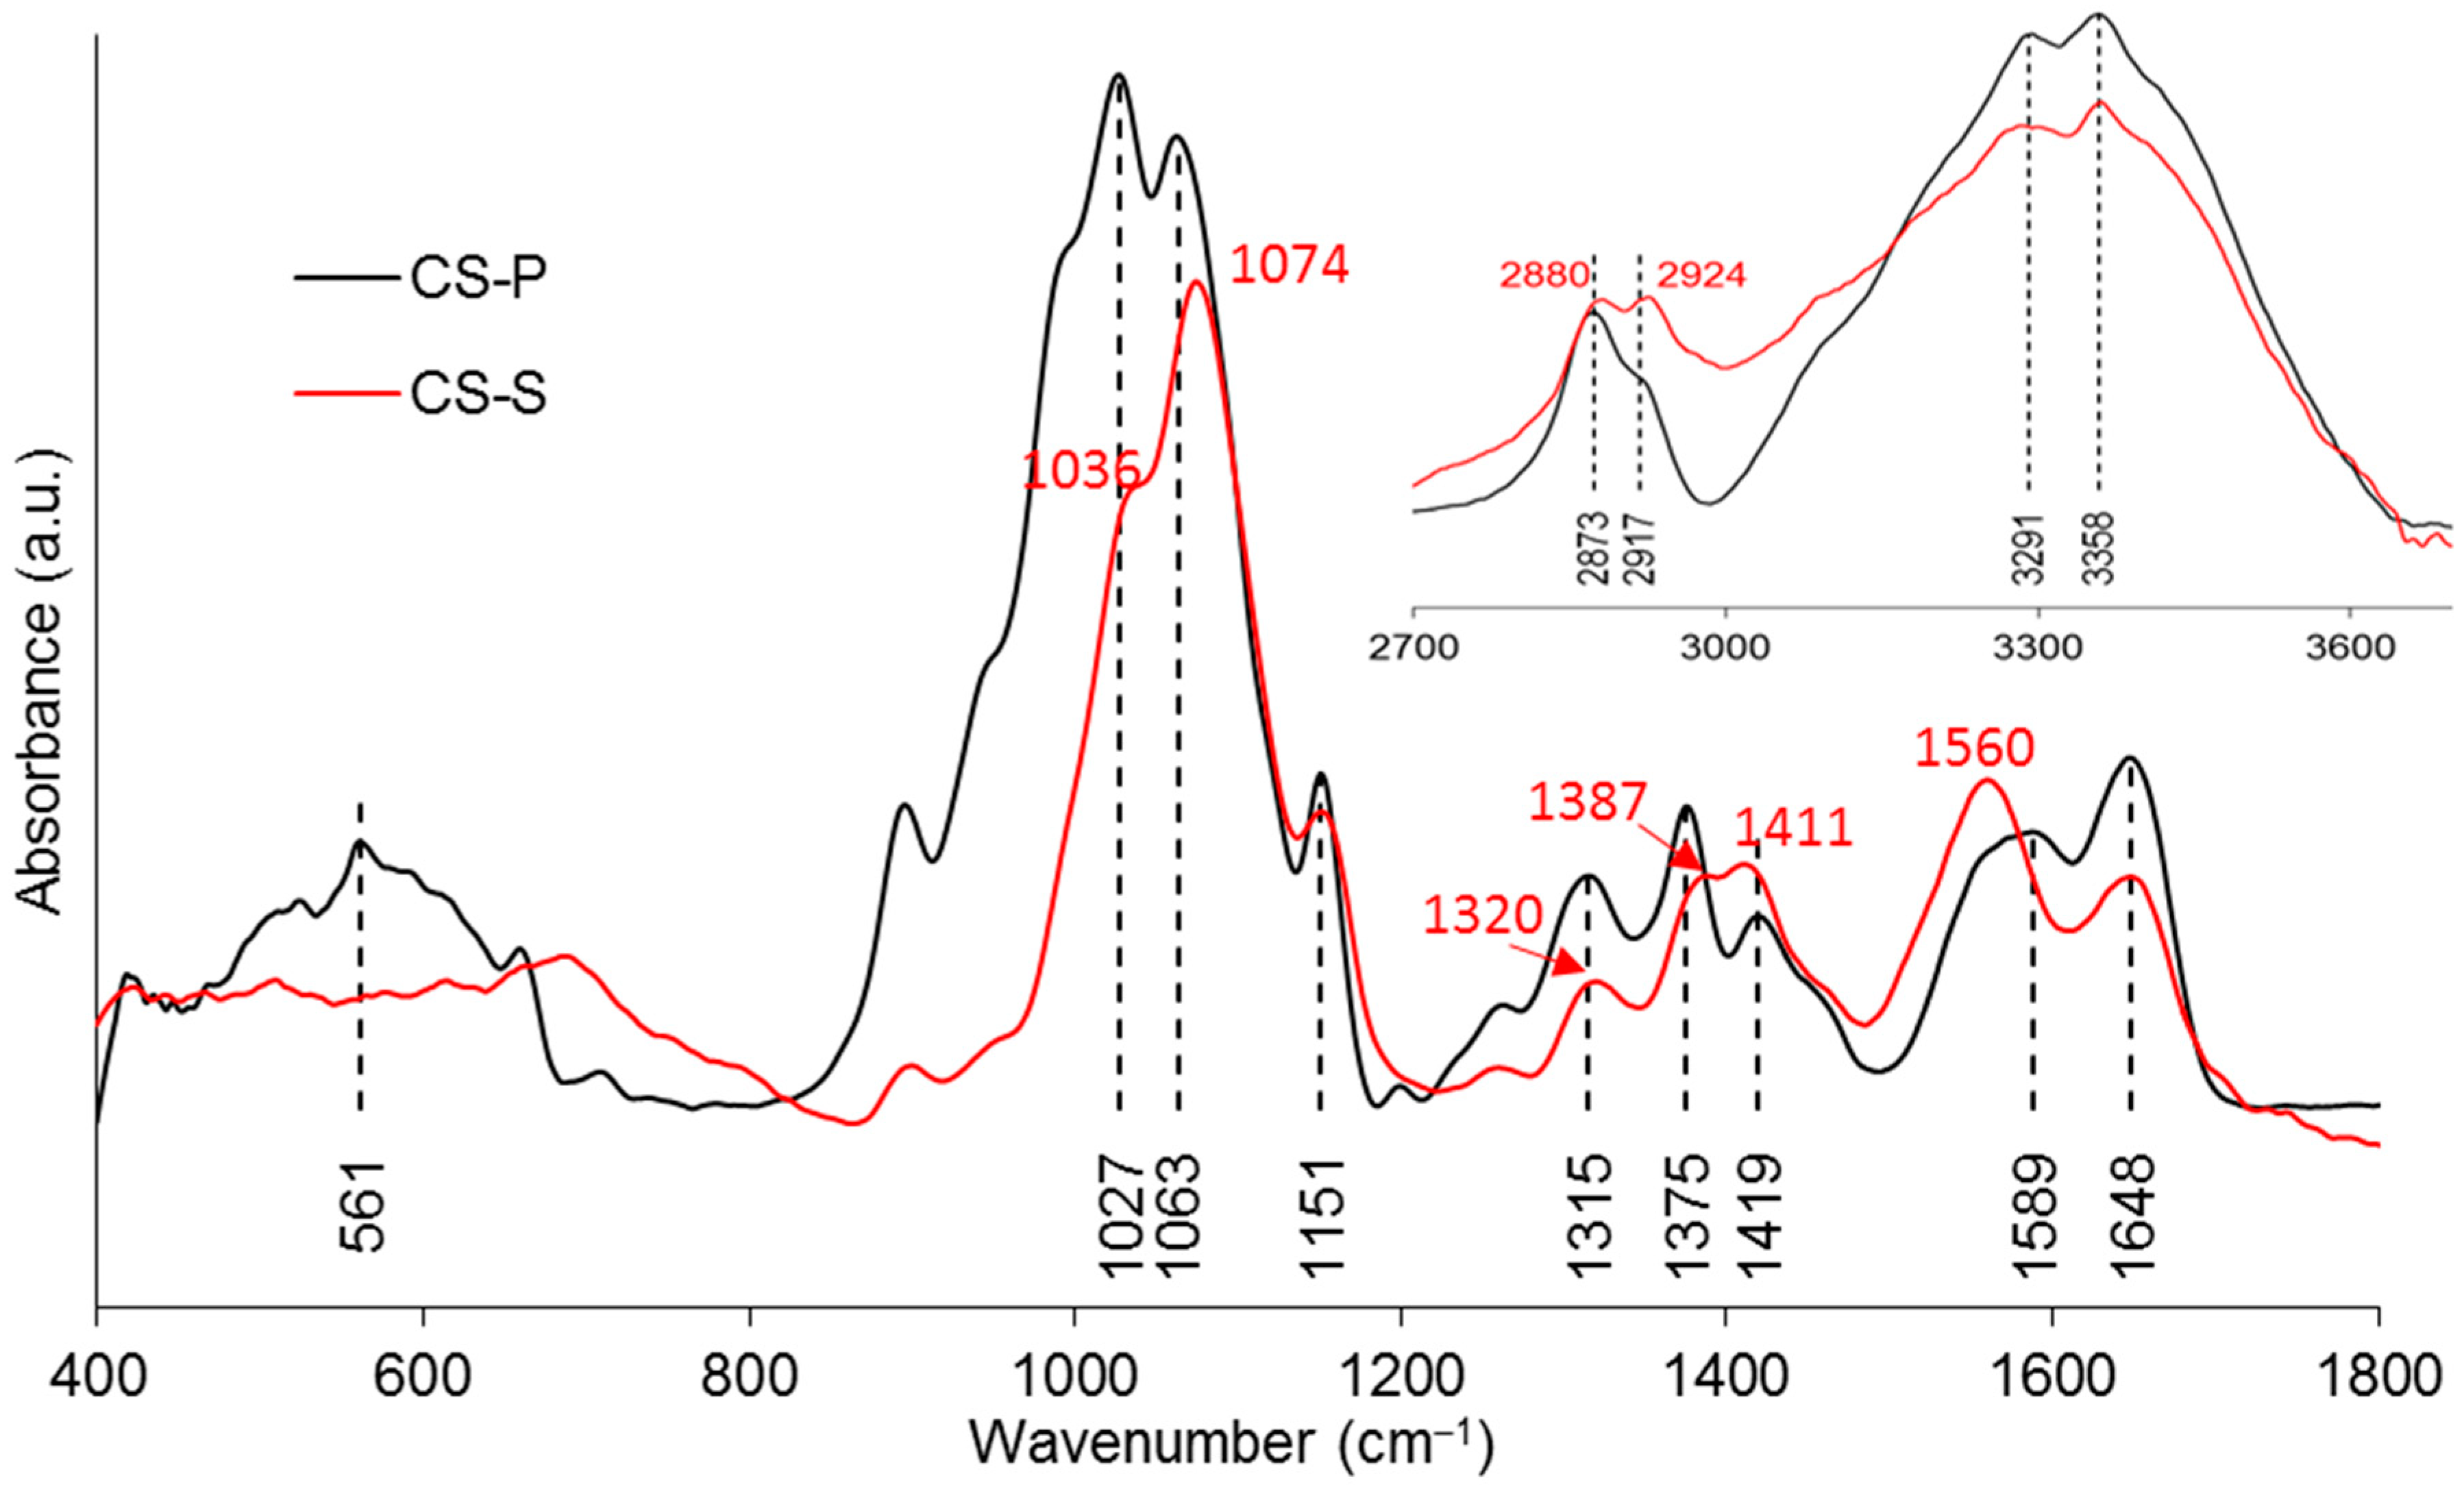
Figure 6.
FTIR spectra of the coated/uncoated fibres and the pure CS powder at the band range of (a) 400–1300 cm−1, (b) 1300–1800 cm−1 and (c) 2500–3800 cm−1.
Figure 6.
FTIR spectra of the coated/uncoated fibres and the pure CS powder at the band range of (a) 400–1300 cm−1, (b) 1300–1800 cm−1 and (c) 2500–3800 cm−1.

Figure 7.
Raman spectra of the coated/uncoated fibres and the pure CS powder at the band range of (a) 250–1300 cm−1, (b) 1300–1750 cm−1 and (c) 2550–3400 cm−1.
Figure 7.
Raman spectra of the coated/uncoated fibres and the pure CS powder at the band range of (a) 250–1300 cm−1, (b) 1300–1750 cm−1 and (c) 2550–3400 cm−1.


Figure 8.
X-ray photoelectron spectroscopy (XPS) spectra of (a) C1s, (b) N1s, (c) O1s, and (d) P2p narrow scans of coated/uncoated fibres and pure CS powders.
Figure 8.
X-ray photoelectron spectroscopy (XPS) spectra of (a) C1s, (b) N1s, (c) O1s, and (d) P2p narrow scans of coated/uncoated fibres and pure CS powders.


Figure 9.
Schematic illustration of the protonation of amine groups in low-pH aqueous solution.

Table 1.
Details of coating applications. The sample codes were also used for the corresponding single-fibre composites (SFCs).
Table 1.
Details of coating applications. The sample codes were also used for the corresponding single-fibre composites (SFCs).
| Sample Codes | PCP-0 | PCP-3R | PCP-3 | PCP-6 | PCP-9 | |
|---|---|---|---|---|---|---|
| Acetic acid solution | mL | - | 100 | 100 | 100 | 100 |
| CS | g | - | 0.3 | 0.3 | 0.6 | 0.9 |
| Dip-coating at RT | min | - | 30 | 30 | 30 | 30 |
| Drying at RT | hour | - | 2 | 2 | 2 | 2 |
| Post-cleaning | min | - | 30 | - | - | - |
| Drying at 50 °C | hour | 24 | 24 | 24 | 24 | 24 |
* PCP means PGF–chitosan–PCL; R in “PCP-3R” means “removing excess chitosan”; CS means chitosan; RT means room temperature around 25 °C.
Table 2.
Diameters and Weibull parameters of coated/uncoated fibres (n = 30). The tensile strength values are also included for the ease of comparison.
Table 2.
Diameters and Weibull parameters of coated/uncoated fibres (n = 30). The tensile strength values are also included for the ease of comparison.
| Sample Codes | Diameter (µm) | Tensile Strength (MPa) | Normalising Strength (MPa) | Weibull Modulus |
|---|---|---|---|---|
| PCP-0 | 26 ± 4 | 565 ± 124 | 613 | 5.5 |
| PCP-3R | 24 ± 3 | 451 ± 114 | 495 | 5.5 |
| PCP-3 | 25 ± 2 | 522 ± 104 | 565 | 5.3 |
| PCP-6 | 26 ± 3 | 571 ± 120 | 619 | 5.3 |
| PCP-9 | 25 ± 2 | 630 ± 111 | 675 | 6.7 |
Table 3.
Peaks of the Deriv. Wt (the derivative of weight percentage) curves and weight loss in the temperature region of 230–400 °C (n = 3).
Table 3.
Peaks of the Deriv. Wt (the derivative of weight percentage) curves and weight loss in the temperature region of 230–400 °C (n = 3).
| Sample Codes | PCP-0 | PCP-3R | PCP-3 | PCP-6 | PCP-9 | CS |
|---|---|---|---|---|---|---|
| Peaks on Deriv. Wt (°C) | - | - | <100 | <100 | <100 | 86 ± 0 |
| - | - | - | 159 ± 8 | 159 ± 2 | - | |
| - | - | 279 ± 1 | 293 ± 3 | 291 ± 4 | 308 ± 3 | |
| Wt loss at 230–400 °C (%) | 0 ± 0 | 0.02 ± 0.01 | 0.50 ± 0.01 | 1.98 ± 0.05 | 5.8 ± 0.2 | 43 ± 2 |
Table 4.
FTIR and Raman band assignments for pure PGF and CS.
| Wavenumber (cm−1) | Assignments | Ref. |
|---|---|---|
| FTIR–PGF | ||
| 495 | δas(O–P–O) in Q1 species | [28,29] |
| 754, 894 | υs and υas(P–O–P) of the bridging oxygen in Q2 species | [29,30] |
| ~1040 | υs and υas(P–O−) in Q1 species | [29,30] |
| ~1200 | υas(PO2)− of the nonbridging oxygen in Q2 species | [28,31] |
| FTIR–CS | ||
| 1027, 1063 | υ(C–O) in the pyranose ring | [11,32] |
| 1151 | υas(C–O–C) in the glycosidic linkage | [11,32] |
| 1315 | υ(CH2) | [33] |
| 1375 | symmetric deformation mode of CH3 | [11,34] |
| 1419 | δ(C–H) | [33,35] |
| 1589 | δ(NH2) | [32,33] |
| 1648 | υ(–C=O–) in the amide group | [11,35] |
| 2873, 2917 | υ(C–H) | [11,33] |
| 3291, 3358 | υs(N–H) and υs(O–H) | [11,33] |
| Raman–PGF | ||
| 353 | δ(PO4) of phosphate polyhedra | [36,37] |
| 450–650 | δs and δas(PO2)2− in Q0 species | [38,39] |
| 736 | υs(P–O–P) of the bridging oxygen in Q1 species | [37,38] |
| 946 | υas(P–O−) of the nonbridging oxygen in Q0 species | [37,39] |
| 1097 | υas(P2O7)4− in Q1 species | [39] |
| ~1250 | υas(PO3)− of the non-bridging oxygen in Q2 species | [36,38] |
| Raman–CS | ||
| 898 | υs(C–O–C) in the pyranose ring | [40,41] |
| 1106 | υ(C–O–C) in the glycosidic linkage and υ(C–C) | [42,43] |
| 1266 | υ(CH) | [41] |
| 1375 | δ(CH2) | [41,44] |
| 1459 | δas(CH3) | [40,41] |
| 1596 | δ(NH2) | [41,44] |
| 1659 | υ(C=O) in the amide group | [44,45] |
| 2734, 2889, 2933 | υ(CH), υ(CH2), and υ(CH3) | [41,44] |
| 3305 | υ(NH2) | [40,41] |
| δs (δas) = symmetric (asymmetric) bending vibration | ||
| υs (υas) = symmetric (asymmetric) stretching vibration | ||
Table 5.
Binding energy and atomic ratio of N1s peaks in XPS spectra.
| Sample codes | Binding Energy (eV) | Atomic Ratio |
|---|---|---|
| PCP-0 | - | - |
| PCP-3R | 399.4; 401.5 | 35.2:64.8 |
| PCP-3 | 399.2; 401.3 | 59.8:40.2 |
| PCP-6 | 399.1; 401.1 | 83.2:16.8 |
| PCP-9 | 399.2; 401.4 | 82.9:17.1 |
| CS | 399.1; 400.7 | 94.8:5.2 |
© 2018 by the authors. Licensee MDPI, Basel, Switzerland. This article is an open access article distributed under the terms and conditions of the Creative Commons Attribution (CC BY) license (http://creativecommons.org/licenses/by/4.0/).
Share and Cite
MDPI and ACS Style
Tan, C.; Rudd, C.; Parsons, A.; Sharmin, N.; Zhang, J.; Chen, W.; Ahmed, I. Chitosan as a Coupling Agent for Phosphate Glass Fibre/Polycaprolactone Composites. Fibers 2018, 6, 97. https://doi.org/10.3390/fib6040097
AMA Style
Tan C, Rudd C, Parsons A, Sharmin N, Zhang J, Chen W, Ahmed I. Chitosan as a Coupling Agent for Phosphate Glass Fibre/Polycaprolactone Composites. Fibers. 2018; 6(4):97. https://doi.org/10.3390/fib6040097
Chicago/Turabian StyleTan, Chao, Chris Rudd, Andrew Parsons, Nusrat Sharmin, Junxiao Zhang, Wanru Chen, and Ifty Ahmed. 2018. "Chitosan as a Coupling Agent for Phosphate Glass Fibre/Polycaprolactone Composites" Fibers 6, no. 4: 97. https://doi.org/10.3390/fib6040097
Note that from the first issue of 2016, this journal uses article numbers instead of page numbers. See further details here.