Integrity of Carbon-Fibre Epoxy Composites through a Nanomechanical Mapping Protocol towards Quality Assurance


Research Unit of Advanced, Composite, Nano-Materials and Nanotechnology (R-Nano Lab), Material Science and Engineering Department, School of Chemical Engineering, National Technical University of Athens, GR-15780 Zographou, Greece
*
Author to whom correspondence should be addressed.
Fibers 2018, 6(4), 78; https://doi.org/10.3390/fib6040078
Submission received: 3 July 2018
/
Revised: 25 September 2018
/
Accepted: 2 October 2018
/
Published: 11 October 2018
(This article belongs to the Special Issue Smart Reinforced Composites Using Carbon and Carbon-Based Nanomaterials)
Abstract
:The purpose of this study is to assess the integrity of carbon-fibre reinforced plastics (CFRP) comprising of commercial and surface modified CFs through nanomechanical mapping protocol, towards the feasibility of nanoindentation tool as a quality assurance means in a composite manufacturing process. Carbon fibre surface modification was selected for enhancement of the wetting properties of carbon fibres in order to improve the adhesion force between the fibre and the polymer matrix. In all cases, epoxy resin was used as a matrix for the manufacturing of composite samples. Plastic deformation/elastic recovery were recorded (together with viscoelasticity and adhesion-discontinuities and fluctuations during measurement), while elastic modulus values are also mapped. Moreover, the resistance to applied load is assessed and compared for all cases.
1. Introduction
Recently carbon fibres (CFs) has been placed among reinforcement filler candidates with potential, whereas epoxy-based matrices (e.g., thermoplastic polymers) are basically addressed for the manufacturing of composites, meeting a plethora of application target needs, i.e., from automotive to aeronautics, health, and structural/building constructions and processes. Carbon fibre composites reveal increased enhanced mechanical performance, significantly high strength and modulus, increased resistance to creep deformation and stiffness [1,2], to name a few; yet, as fibre-matrix strong chemical bonding is rather scarce, under stress loading [3], the CF composite exhibit decreased mechanical properties, e.g., poor interlaminar shear strength (ILSS) and toughness, as stress propagates from one filament to others, occurring through the matrix resin [3]; consequently, pull-out effect occurs, confronted through various approaches of treating the surface in order to incorporate active groups onto fibres surface, resulting in enhancement of CF-matrix. However, if the bond strength is high brittle behaviour occurs, whereas if this incorporation is feeble it leads to failure [3,4].
Various surface treatments have been investigated [5,6]; its impact assessment consists of sizing and heat treatment assessment on physicochemical properties as well as electrolysis of anodic oxidation. Chemically treating the surface is also of major importance for the development of CF-matrix interface enhancement and tailoring its properties [7,8].
Totally novel approaches for instrument design and experimental protocols based on a combination of expertise and innovation help to meet current instrumentation requirements for quality assurance, needed accuracy and measurement speed for e.g., additive manufacturing (AM) operations [9]. Nanoindentation technique is now considered as a credible and rapid assessment for the mapping of localized surface mechanical integrity [10,11]; via this, a diamond indenter of specific design and geometrical dimensions is driven into a specimen surface, while the applied force and the displacement values are correlated simultaneously and loop-controlled through actuators and sensors [12]. The hardness (as contact pressure, in the means of resistance to applied load) and the elastic modulus of the material being probed are calculated from the initial part of the unloading curve, on the assumption of elastic behaviour using the theory of contact mechanics [13]. Information on the elastic recovery and plastic deformation [14] is also provided, fracture [15], sensitivity of strain-rate and strain-hardening, residual stresses effect [16], and size effects in plasticity locally [17]. As nanoindentation is being recently utilised for assessing the in situ properties of fibrous composite constituents [18,19], issues such as effects of sample preparation, neighbouring constituents, residual stress, pile-up, time-dependent deformation and hydrostatic stress on the important nanoindentation parameters and properties need to be carefully considered [20]. However, since manufacturing and industrial applications needs for quick in-line and real-time testing emerge, the feasibility of nanomechanical assessment and rapid mechanical response mapping over large areas in composites and hybrids arises [12,21,22].
2. Experimental
2.1. Materials
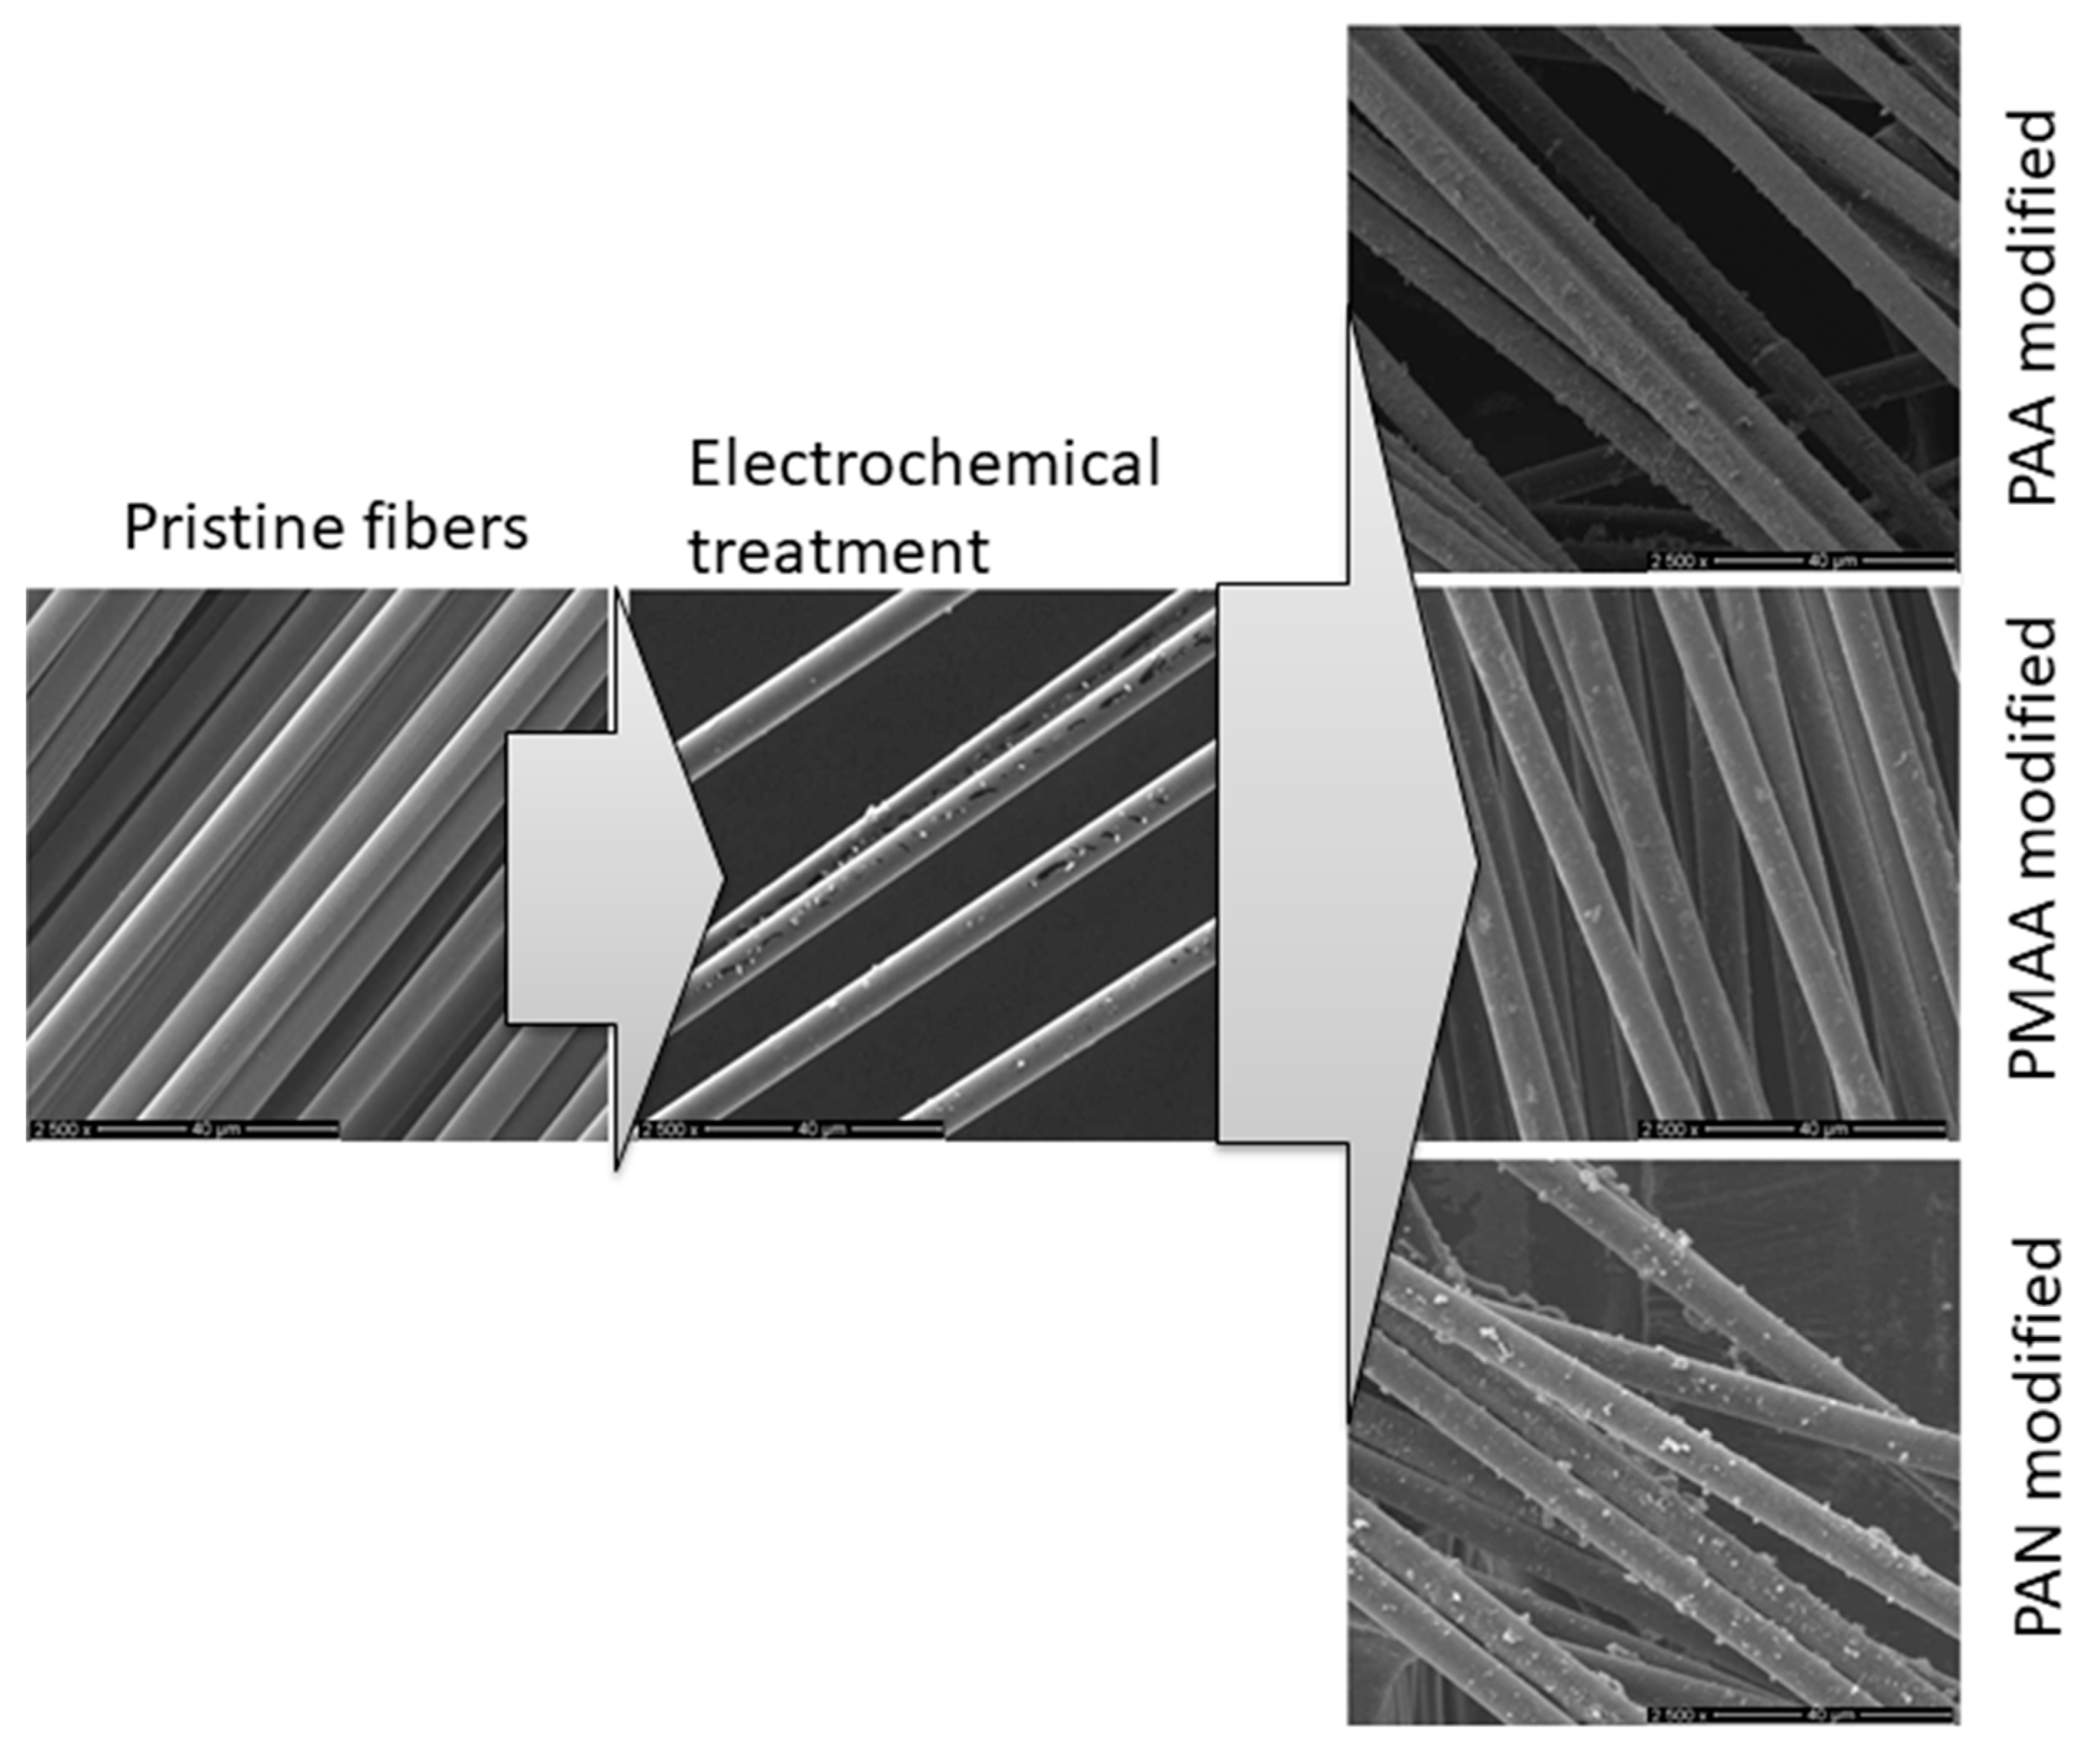
Carbon fibres were purchased from Toray Industries Inc. (Tokyo, Japan). Epoxy resin Araldite GY 257 (Jubail Chemical Industries, JANA, Kingdom of Saudi Arabia), 2,2′-diaminodiethylamine (HΥ 943, Sigma-Aldrich, St. Louis, MO, USA) and N,N-methylenebis(acrylamide) (Acros Organics, Morris Plains, NJ, USA) were utilised as received. Double distillation occurred to acrylic acid (Acros Organics, Morris Plains, NJ, USA), methacrylic acid (Acros Organics, Morris Plains, NJ, USA), acrylonitrile (Acros Organics, Morris Plains, NJ, USA), and N-vinylpyrrolidone (Acros Organics, Morris Plains, NJ, USA), under reduced pressure prior to use. The surface of commercial carbon fibres was functionalized through cyclic voltammetry in aqueous electrolyte solutions of H2SO4, in the presence of acrylic acid, methacrylic acid, acrylonitrile, and N-vinylpyrrolidone monomers, resulting in four types of electropolymerized CF samples, namely with acrylic acid (PAA), methacrylic acid (PMAA), acrylonitrile (PAN), and N-vinylpyrrolidone (PVP). The specifications of the obtained CFs and epoxy resin are reported in the authors’ previous work [1].
2.2. Characterisation Methods
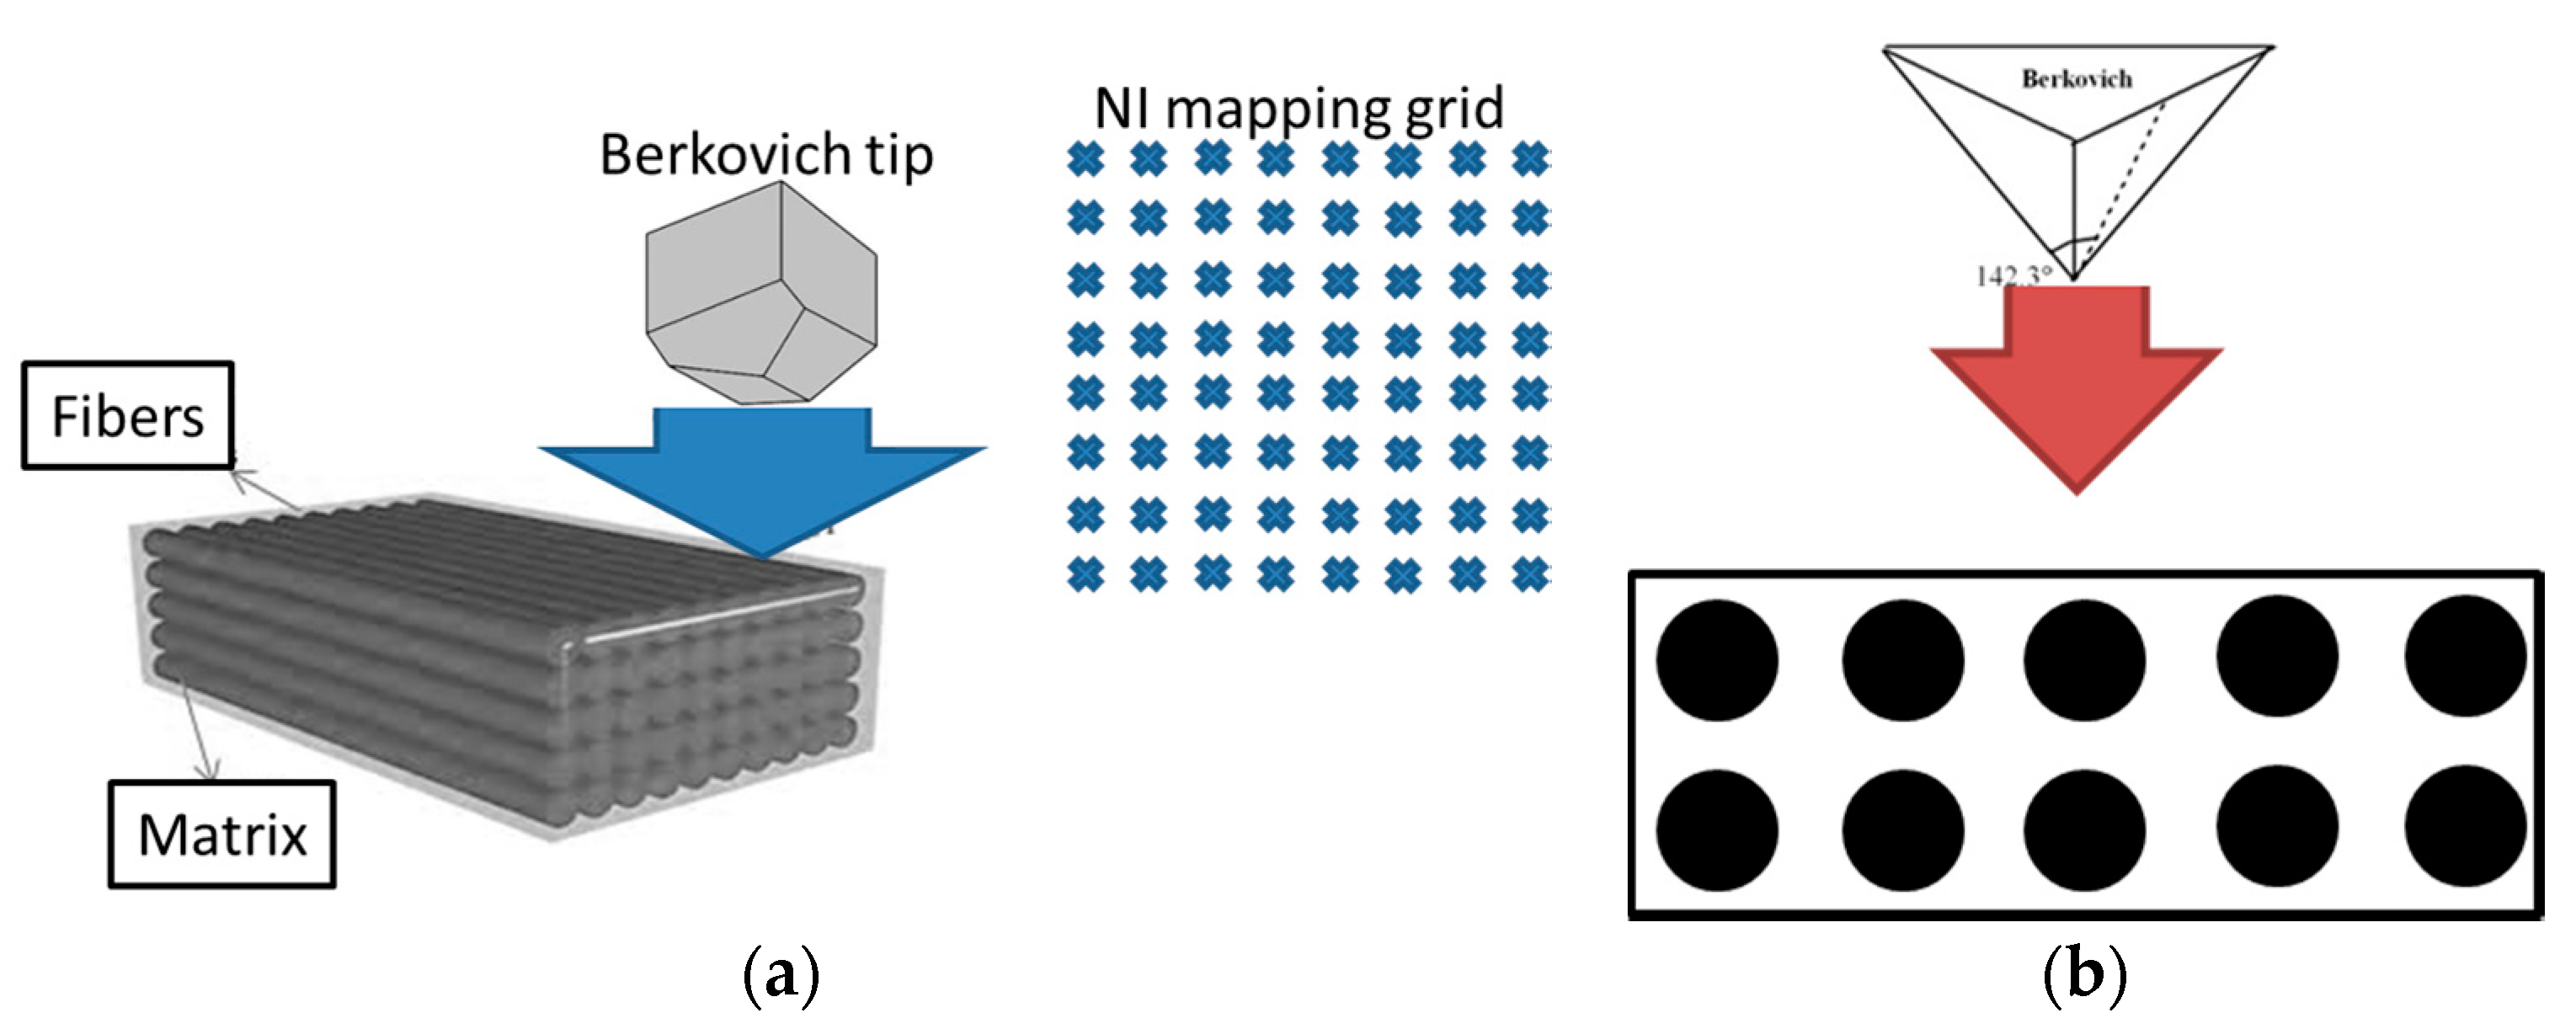
Indentation data provide significant information under localised compressive loading; for carbon nanotube forest use, e.g., as super-compressive cushions, electrical contacts and switches, or thermal conduits, knowing the applied displacements is necessary to identify the extent of the buckling region which acts to provide energy absorption [13]. The nanoindentation tests were performed using a Hysitron (Minneapolis, MN, USA) TriboLab® Nanomechanical Test Instrument equipped with a Berkovich diamond indenter (average radius 100 nm) which allows the application of loads from 1 to 30,000 μN and records the displacement as a function of applied loads with a high load resolution (1 nN) and a high displacement resolution (0.04 nm). Details about the instrument and the experimental setup have been presented elsewhere [23]. Prior to indentation, the area function of the indenter tip was calibrated in a fused silica and in a soft PS-6 sheet (Er = 0.007 GPa (7 MPa)) for shallow depths, standard materials for this purpose. All nanoindentation tests were conducted in a clean area environment with 45% humidity and 23 °C ambient temperature with displacement feedback control closed loop [23]. Samples of ~55% volume fraction were carefully prepared so as to have ~1.2 μm from the upper fibres to the sample surface; indenter was selected to probe at 200 nm of displacement (below 10% of empirical rule-of-thumb, [24,25]), in order for the obtained values to represent the system matrix fibre in each case. In this way, the indentation occurs at epoxy surface (matrix) (Figure 1), while the affection of the fibres (and thus their interface) underneath is revealed through variation in resistance to applied load and load-unload curve form [26].
2.3. Surface Treatment, Composite Manufacturing and Assessment
All electropolymerization experiments were performed at room temperature, in one-compartment electrochemical cell of 150 mL volume consisting of CF as a working electrode (≈1.0 cm2 of exposed area), a saturated silver chloride electrode (Ag/AgCl, KCl(sat)) as a reference and a platinum foil as a counter electrode. Details about the process can be found elsewhere [1]. Carbon fibre bundles (pristine and modified) were placed inside dumb bell type sacrificial templates and then the epoxy resin solution was added to each template (dimensions according to ASTM D638-14). The synthetic process for the epoxy resin solution was followed according to our previous work [27]. The wt% material concentration of the epoxy solution is tabulated in Table 1.
In the authors’ previous work [1], Raman and FTIR (Fourier transformed infrared) spectroscopic techniques have revealed the characteristic bands of commercial sizing and polymer surface modification; moreover all the modified fibres demonstrated higher values of ratio ID/IG compared to the value of pristine fibres, indicating an increase of the defects of the graphitic lattices due to the grafting of the corresponding polymers (ratio ID/IG is an important factor to evaluate the fibre microstructure heterogeneity and increases when a reduction of the crystallite sizes exists) [1]; scanning electron microscopy (SEM) images are presented in Figure 1. Through tensile testing, all polymer-modified carbon fibre composites exhibited increased ultimate tensile strength compared to the pristine, with the PAA-modified specimen revealing higher elongation, probably due to higher polymer weight gain compared to the other specimens.
3. Results and Discussion
Load-depth response measurements of the carbon-fibre reinforced plastics (CFRPs) were performed [13]. In Figure 2, the schematic protocol is depicted; the indenter probes the material in a square mapping grid [21,23] of 64 indents (selected area of 45 × 45 μm2, 5 μm distances between indents).
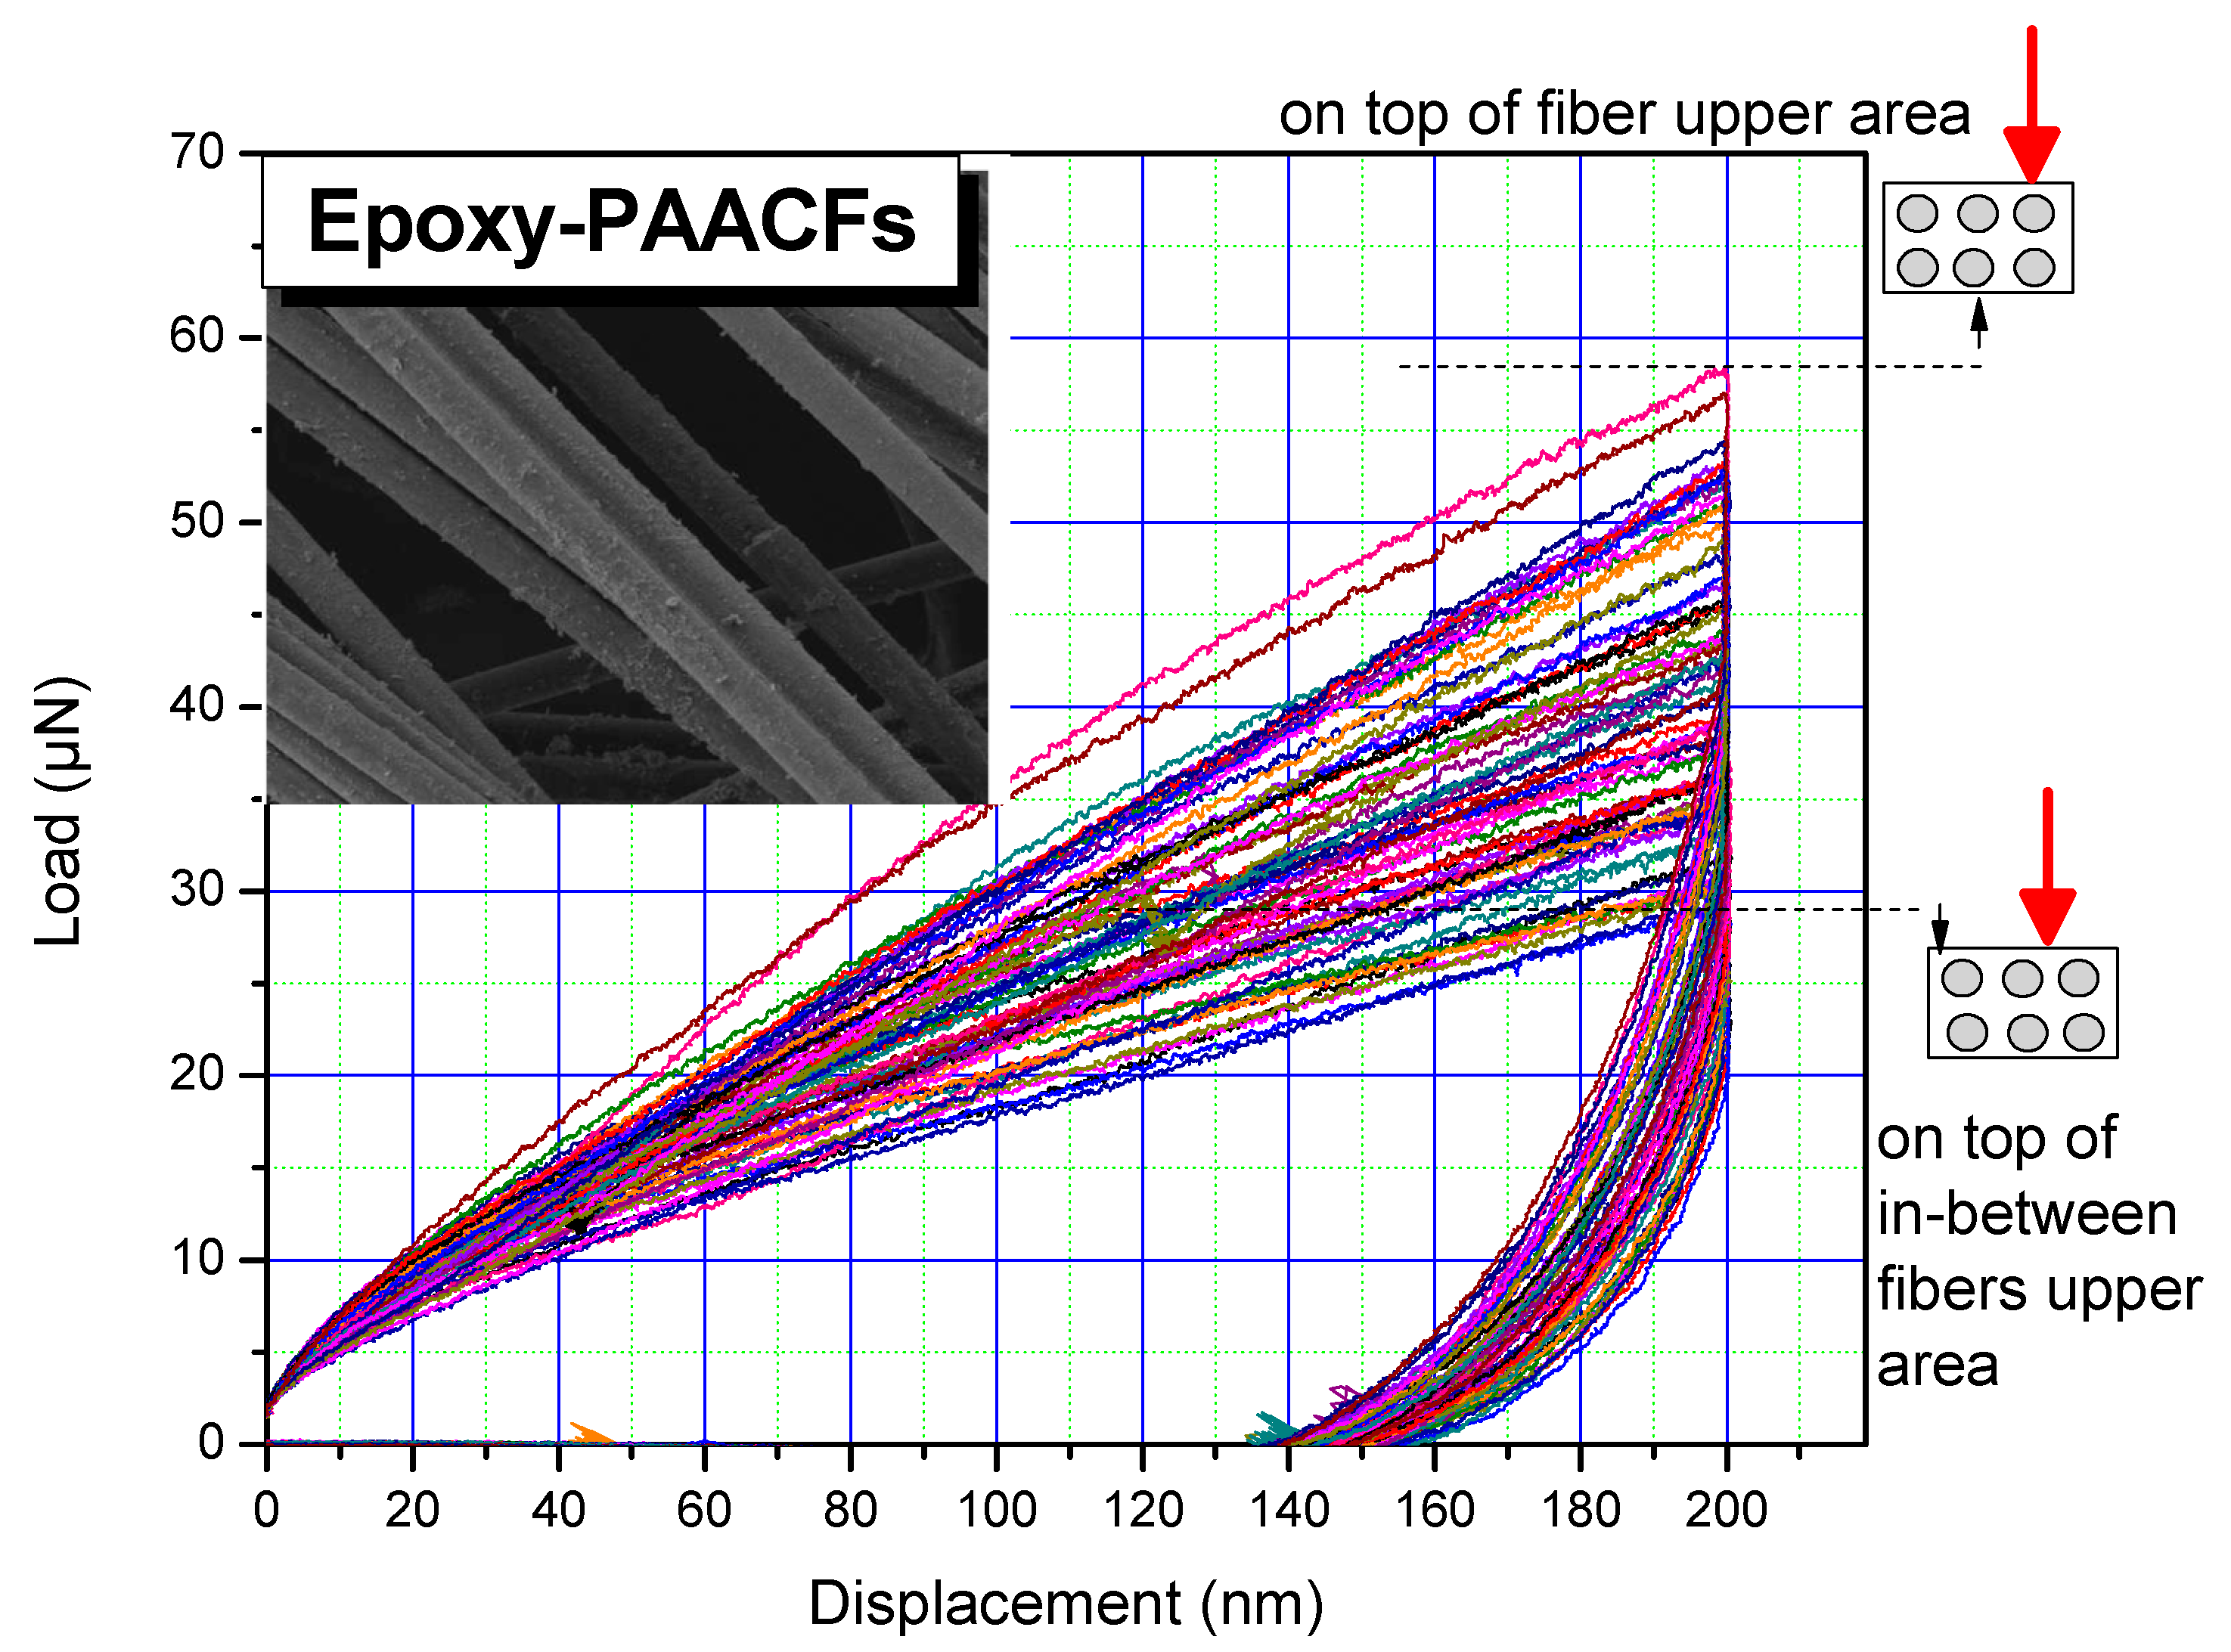
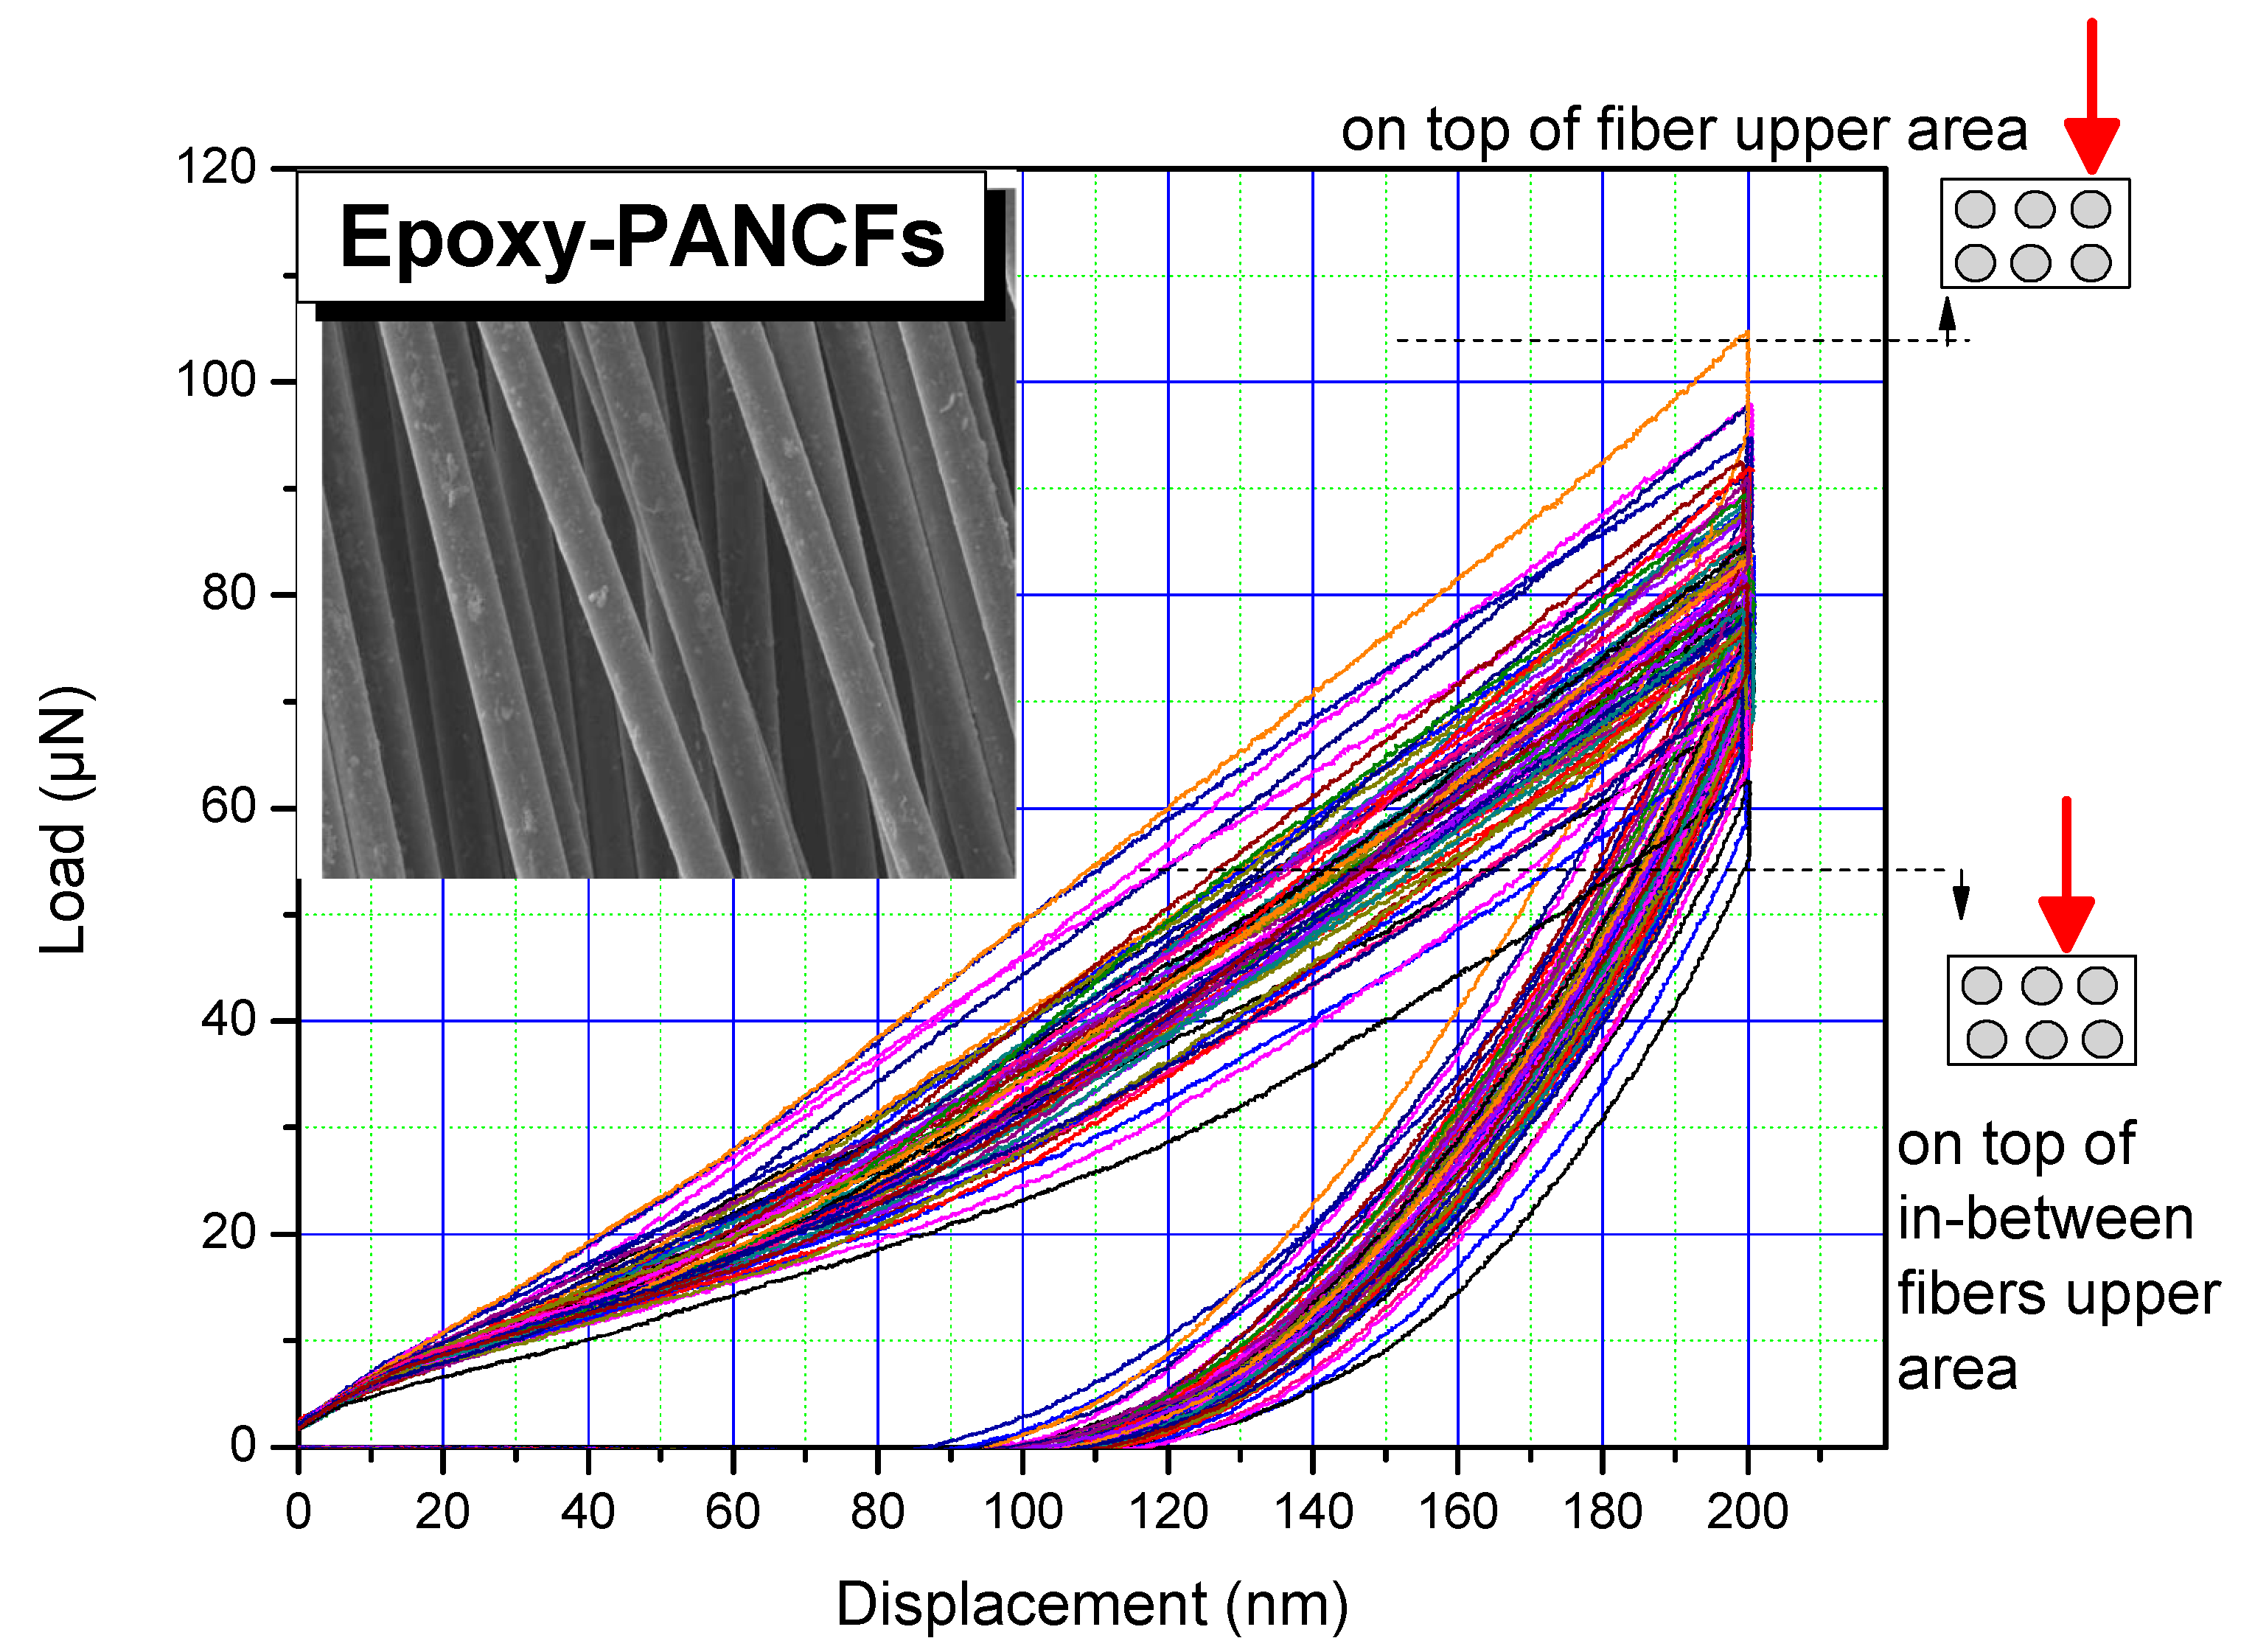
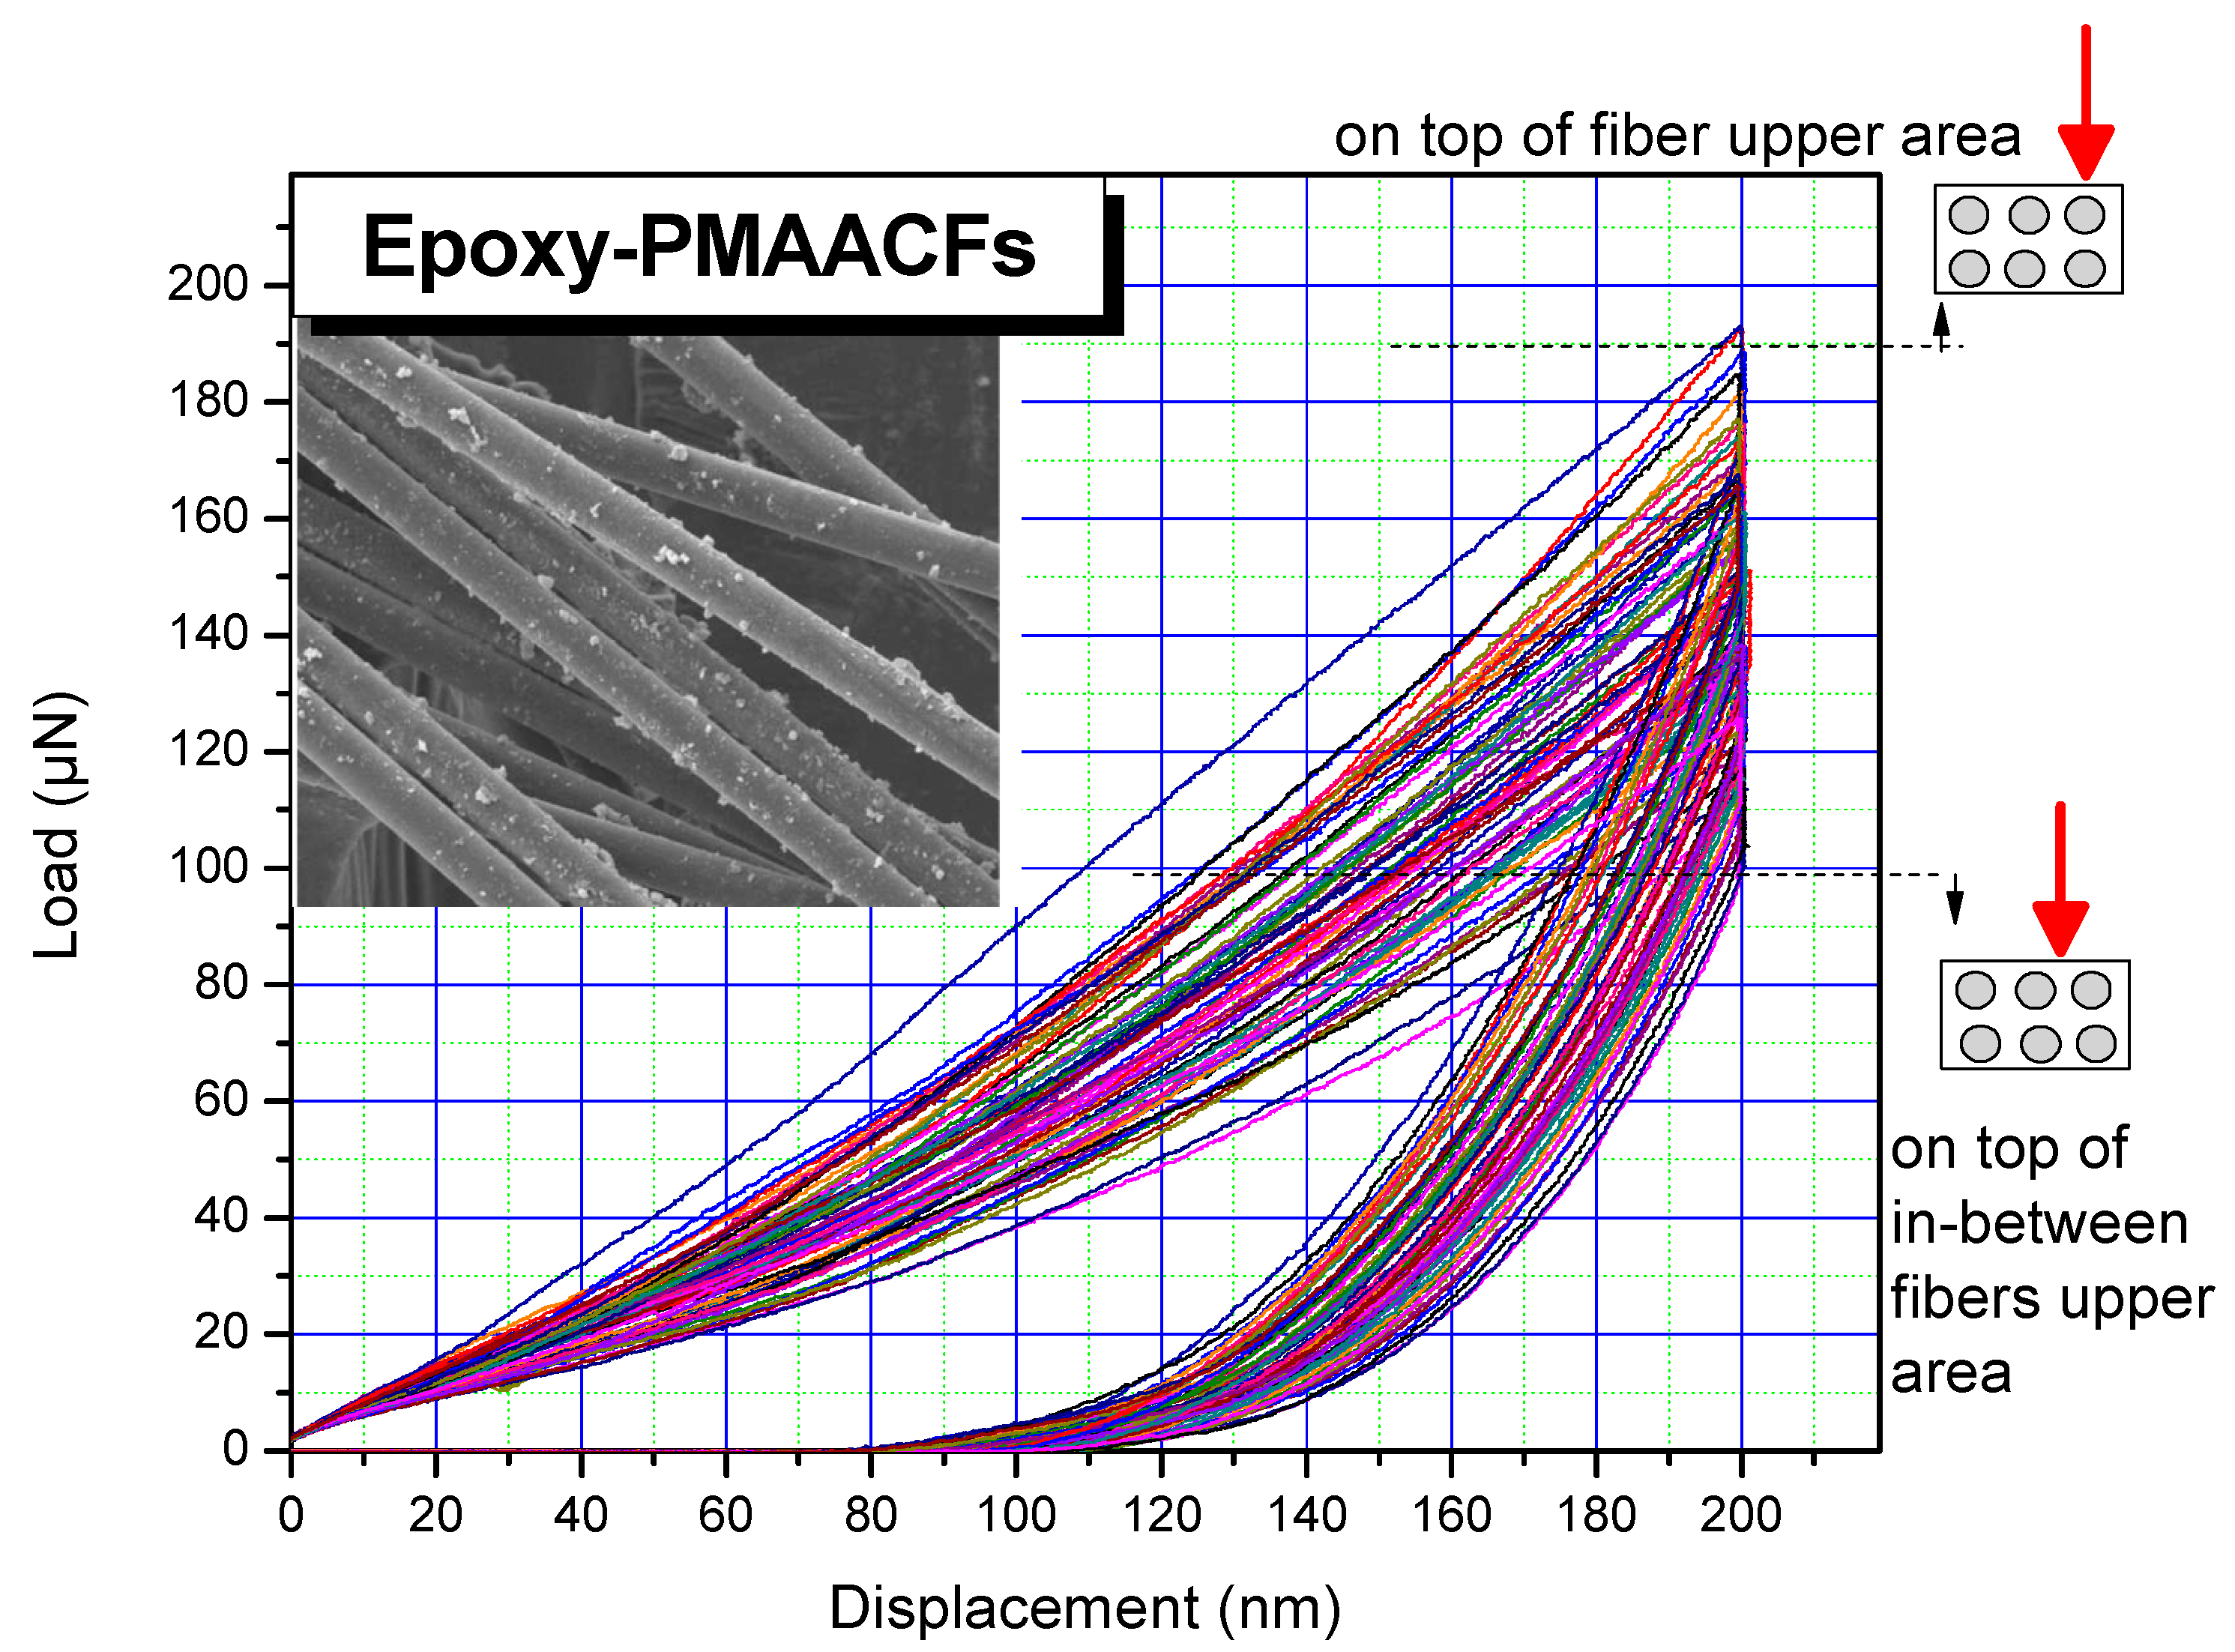
In Figure 3, Figure 4, Figure 5 and Figure 6, load-displacement data from the loading-unloading cycles at 200 nm of displacement, for all samples, are presented. The plasticity index (plastic deformation, reverse to elastic recovery) [15] for nanoindentation is calculated as the ratio of the total integrated area of loading–unloading curves to the integrated area under the loading part. Results show that for the case of epoxy-PAACFs, higher plastic deformation is evidenced (together with viscoelasticity and adhesion-discontinuities and fluctuations during measurement), while for the case of epoxy-CFs a load of 40 μΝ of is depicted, together with lower plastic deformation (epoxy-PANCFs and epoxy-PMAACFs with a load range of ~55 μΝ and ~90 μΝ, respectively). As nanoindentation produces relatively high local stresses [17,25], it is often that such generation of obvious time-dependent effects (e.g., progressive indenter penetration when a constant load is maintained) occur.
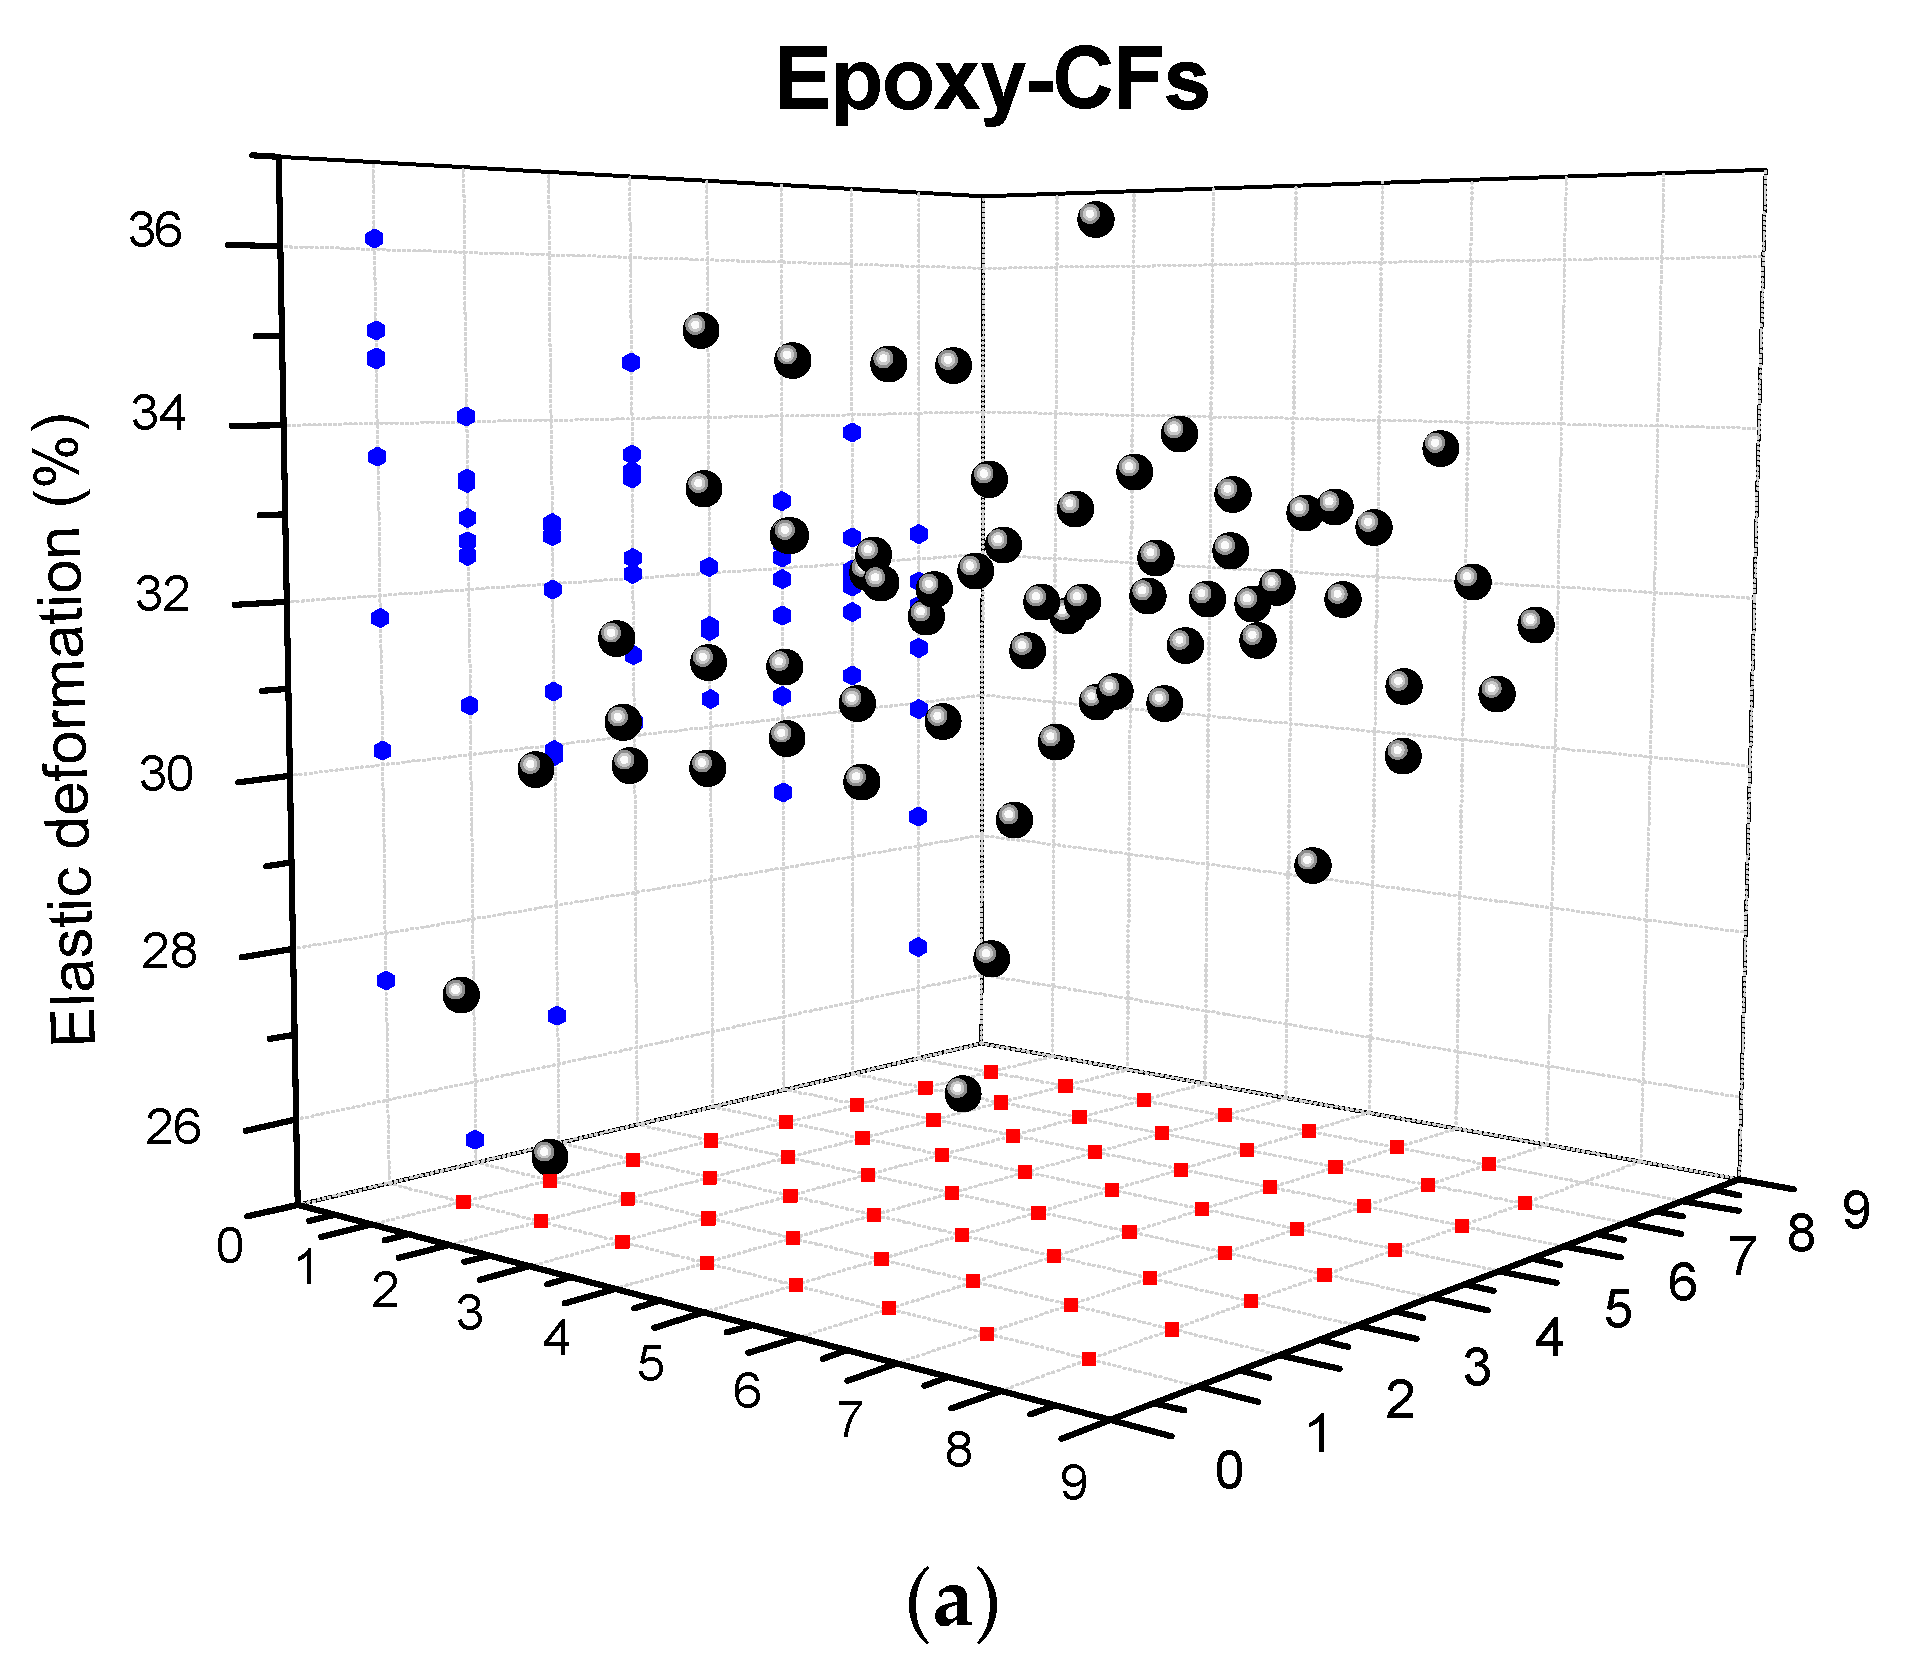
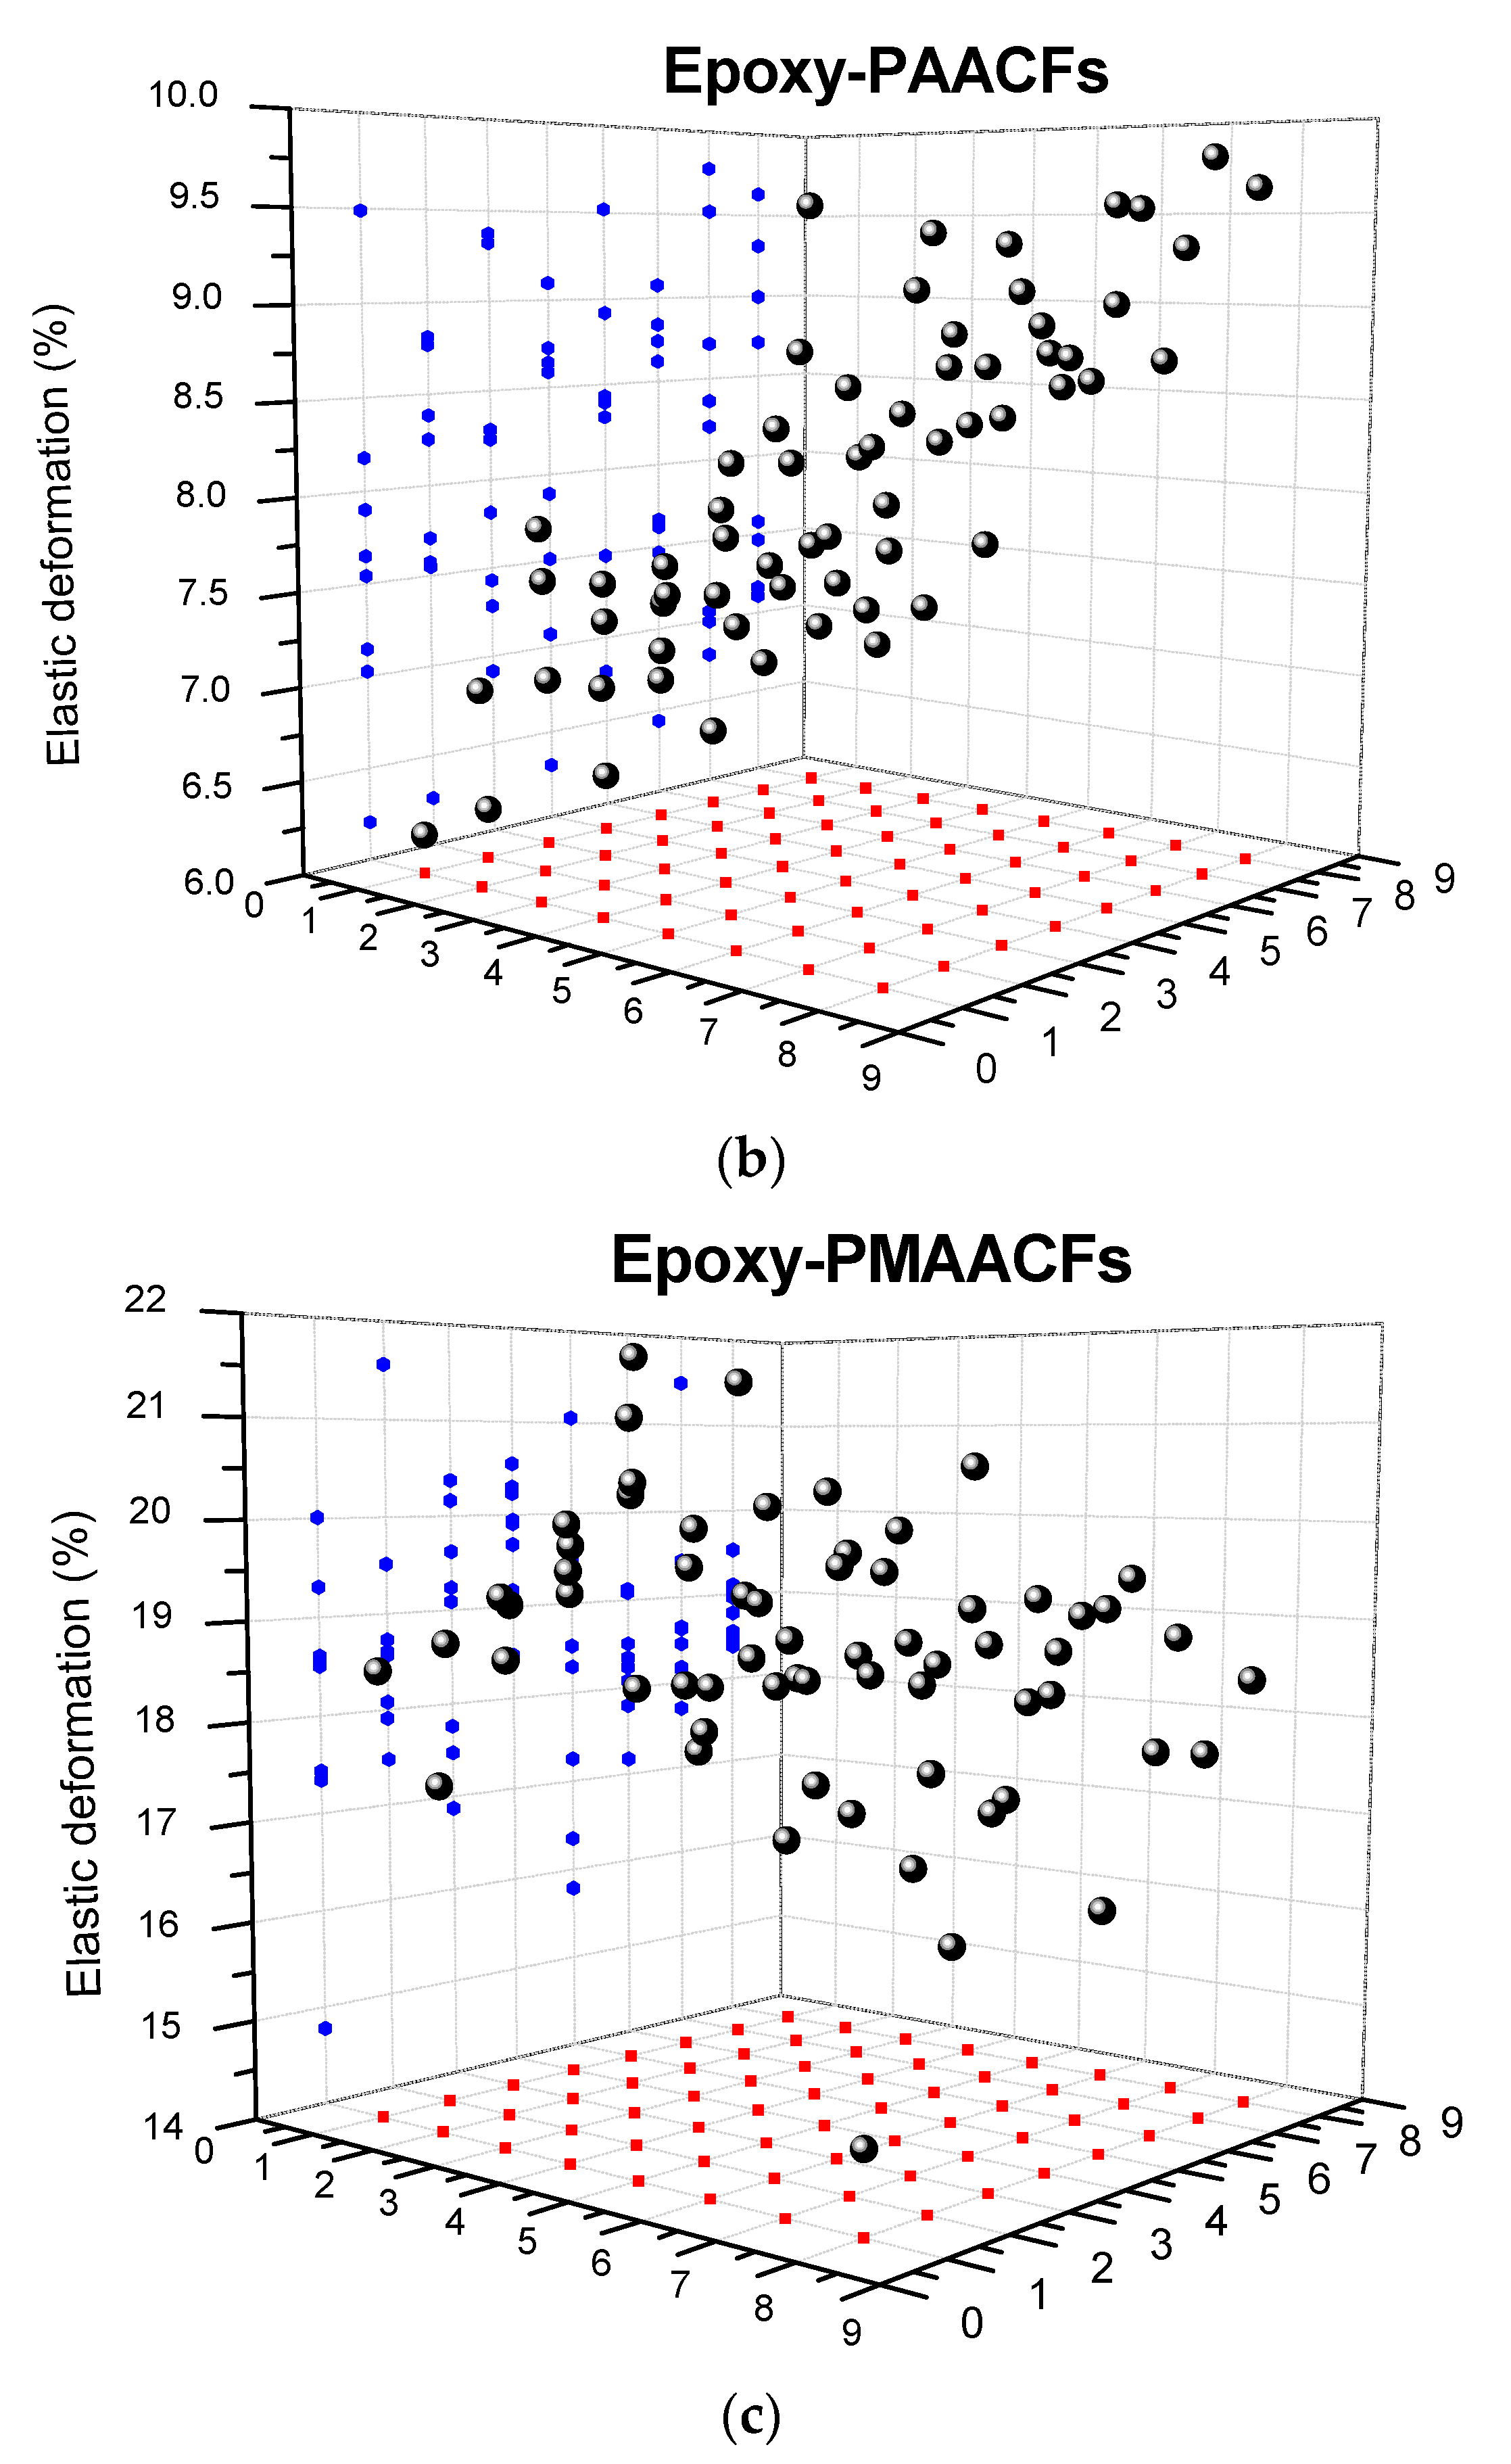
Apparently, there is a need for taking into consideration the possibility of creep affecting the results when experimental nanoindentation data are to be re-used to calculate constitutive relations. Figure 4 depicts the loading–unloading data for epoxy-PAACFs samples, which shows interesting local discontinuities [20,21,22,23,24,25] measured in the load-controlled loop test of this study; these are evidence of energy-absorbing/energy-releasing events occurring below Berkovich indenter. The transition from purely elastic to elastic/plastic deformation [20,24], occurring as a gradual slope change (yield-type “pop-in”), is depicted for epoxy-PANCFs at 20 nm of displacement. As nanoindentation technique is performed locally, an increase in local crystallinity may also result in a modulus values increase. In Figure 7, elastic deformation (recovery, as dissipated energy [15]) obtained from mapping data at 200 nm of displacement, for (a) epoxy-CFs (benchmark), (b) epoxy-PAACF (low resistance to applied load) and (c) epoxy-PMAACFs samples (high resistance to applied load), are presented. epoxy-CFs sample exhibits the highest elastic recovery; epoxy-PAACFs sample exhibits the lowest elastic recovery, while the epoxy-PMAACFs sample exhibits the highest elastic recovery, compared with epoxy-PANCF and epoxy-PAACF samples.
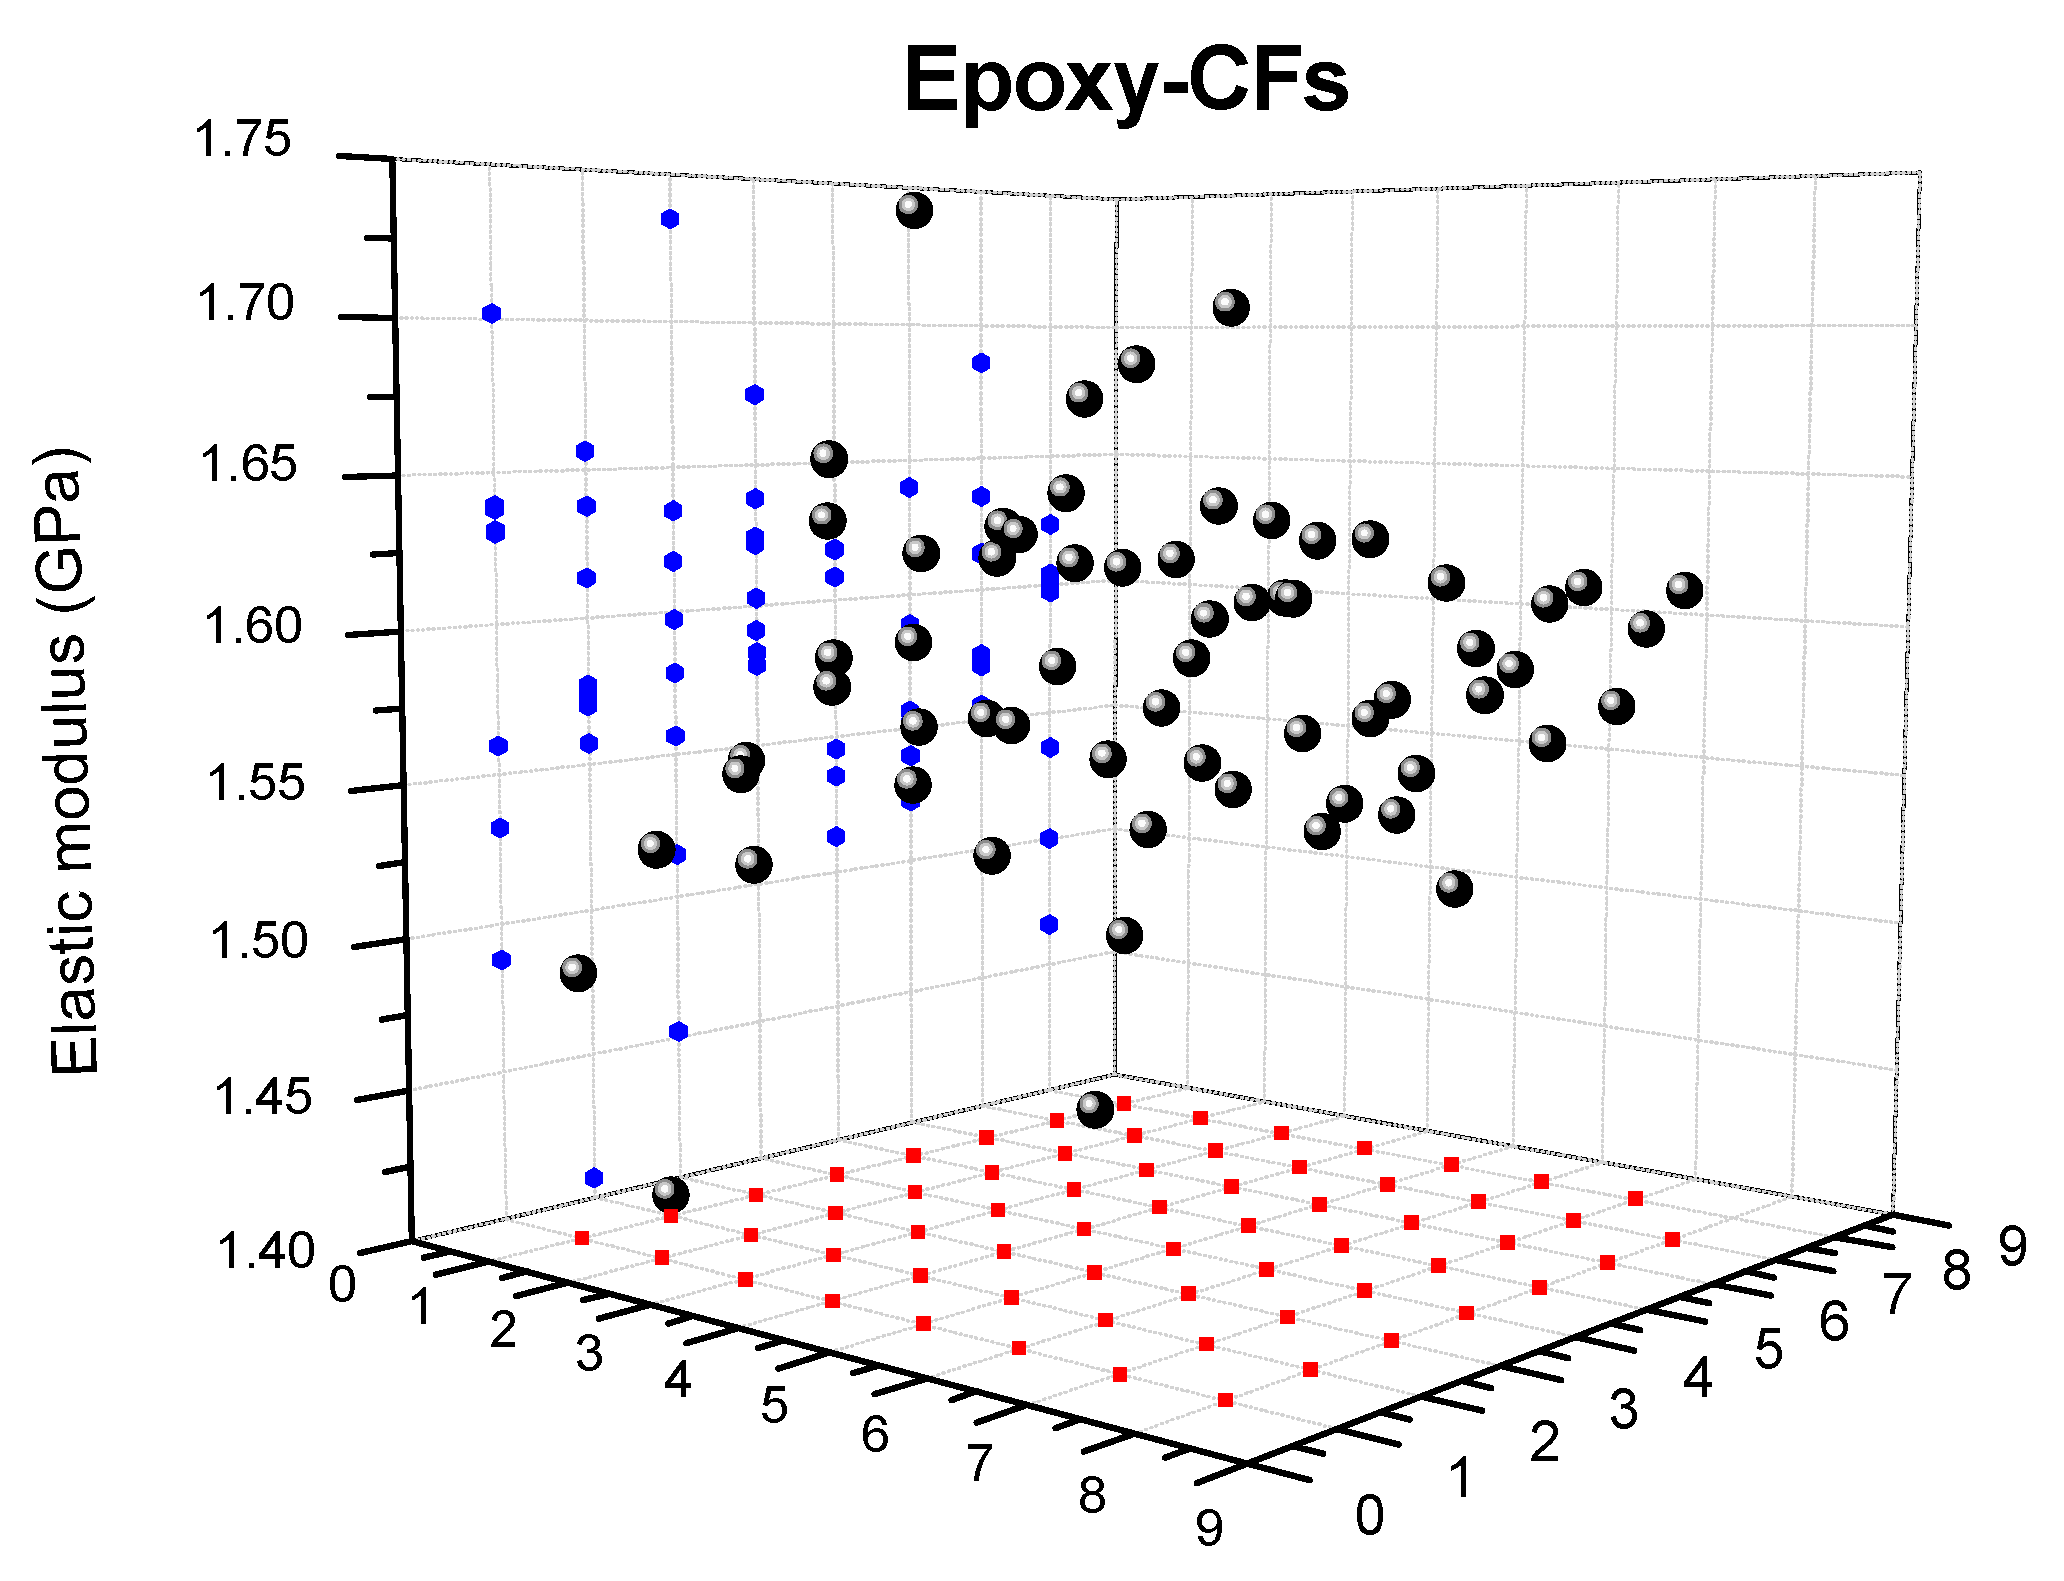
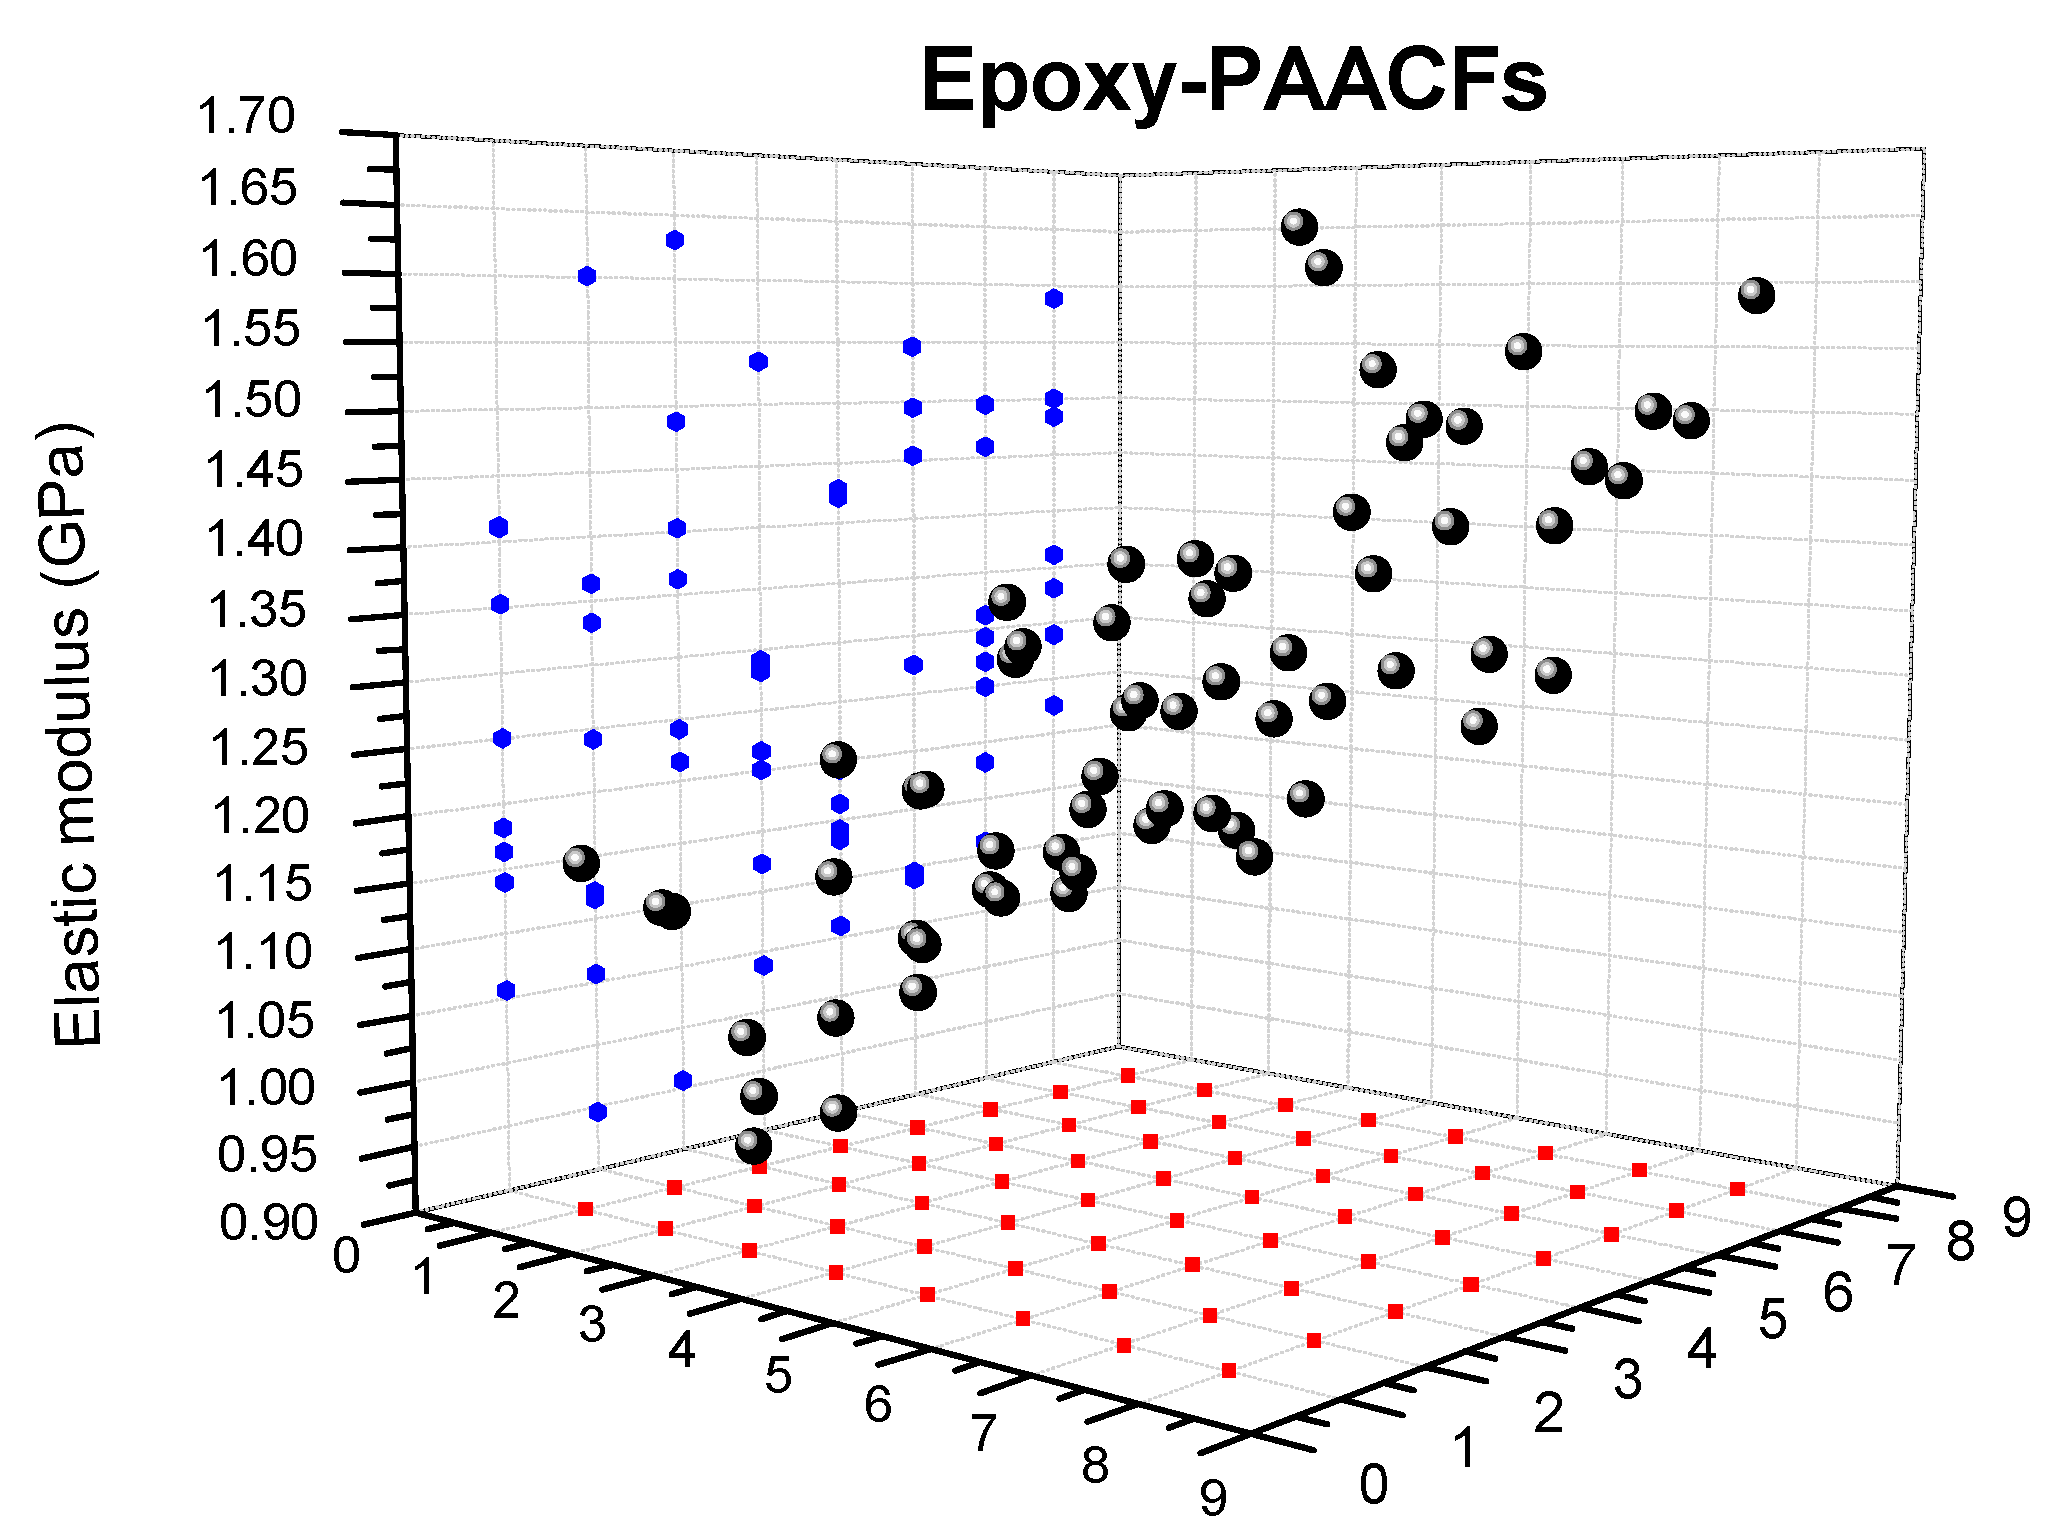
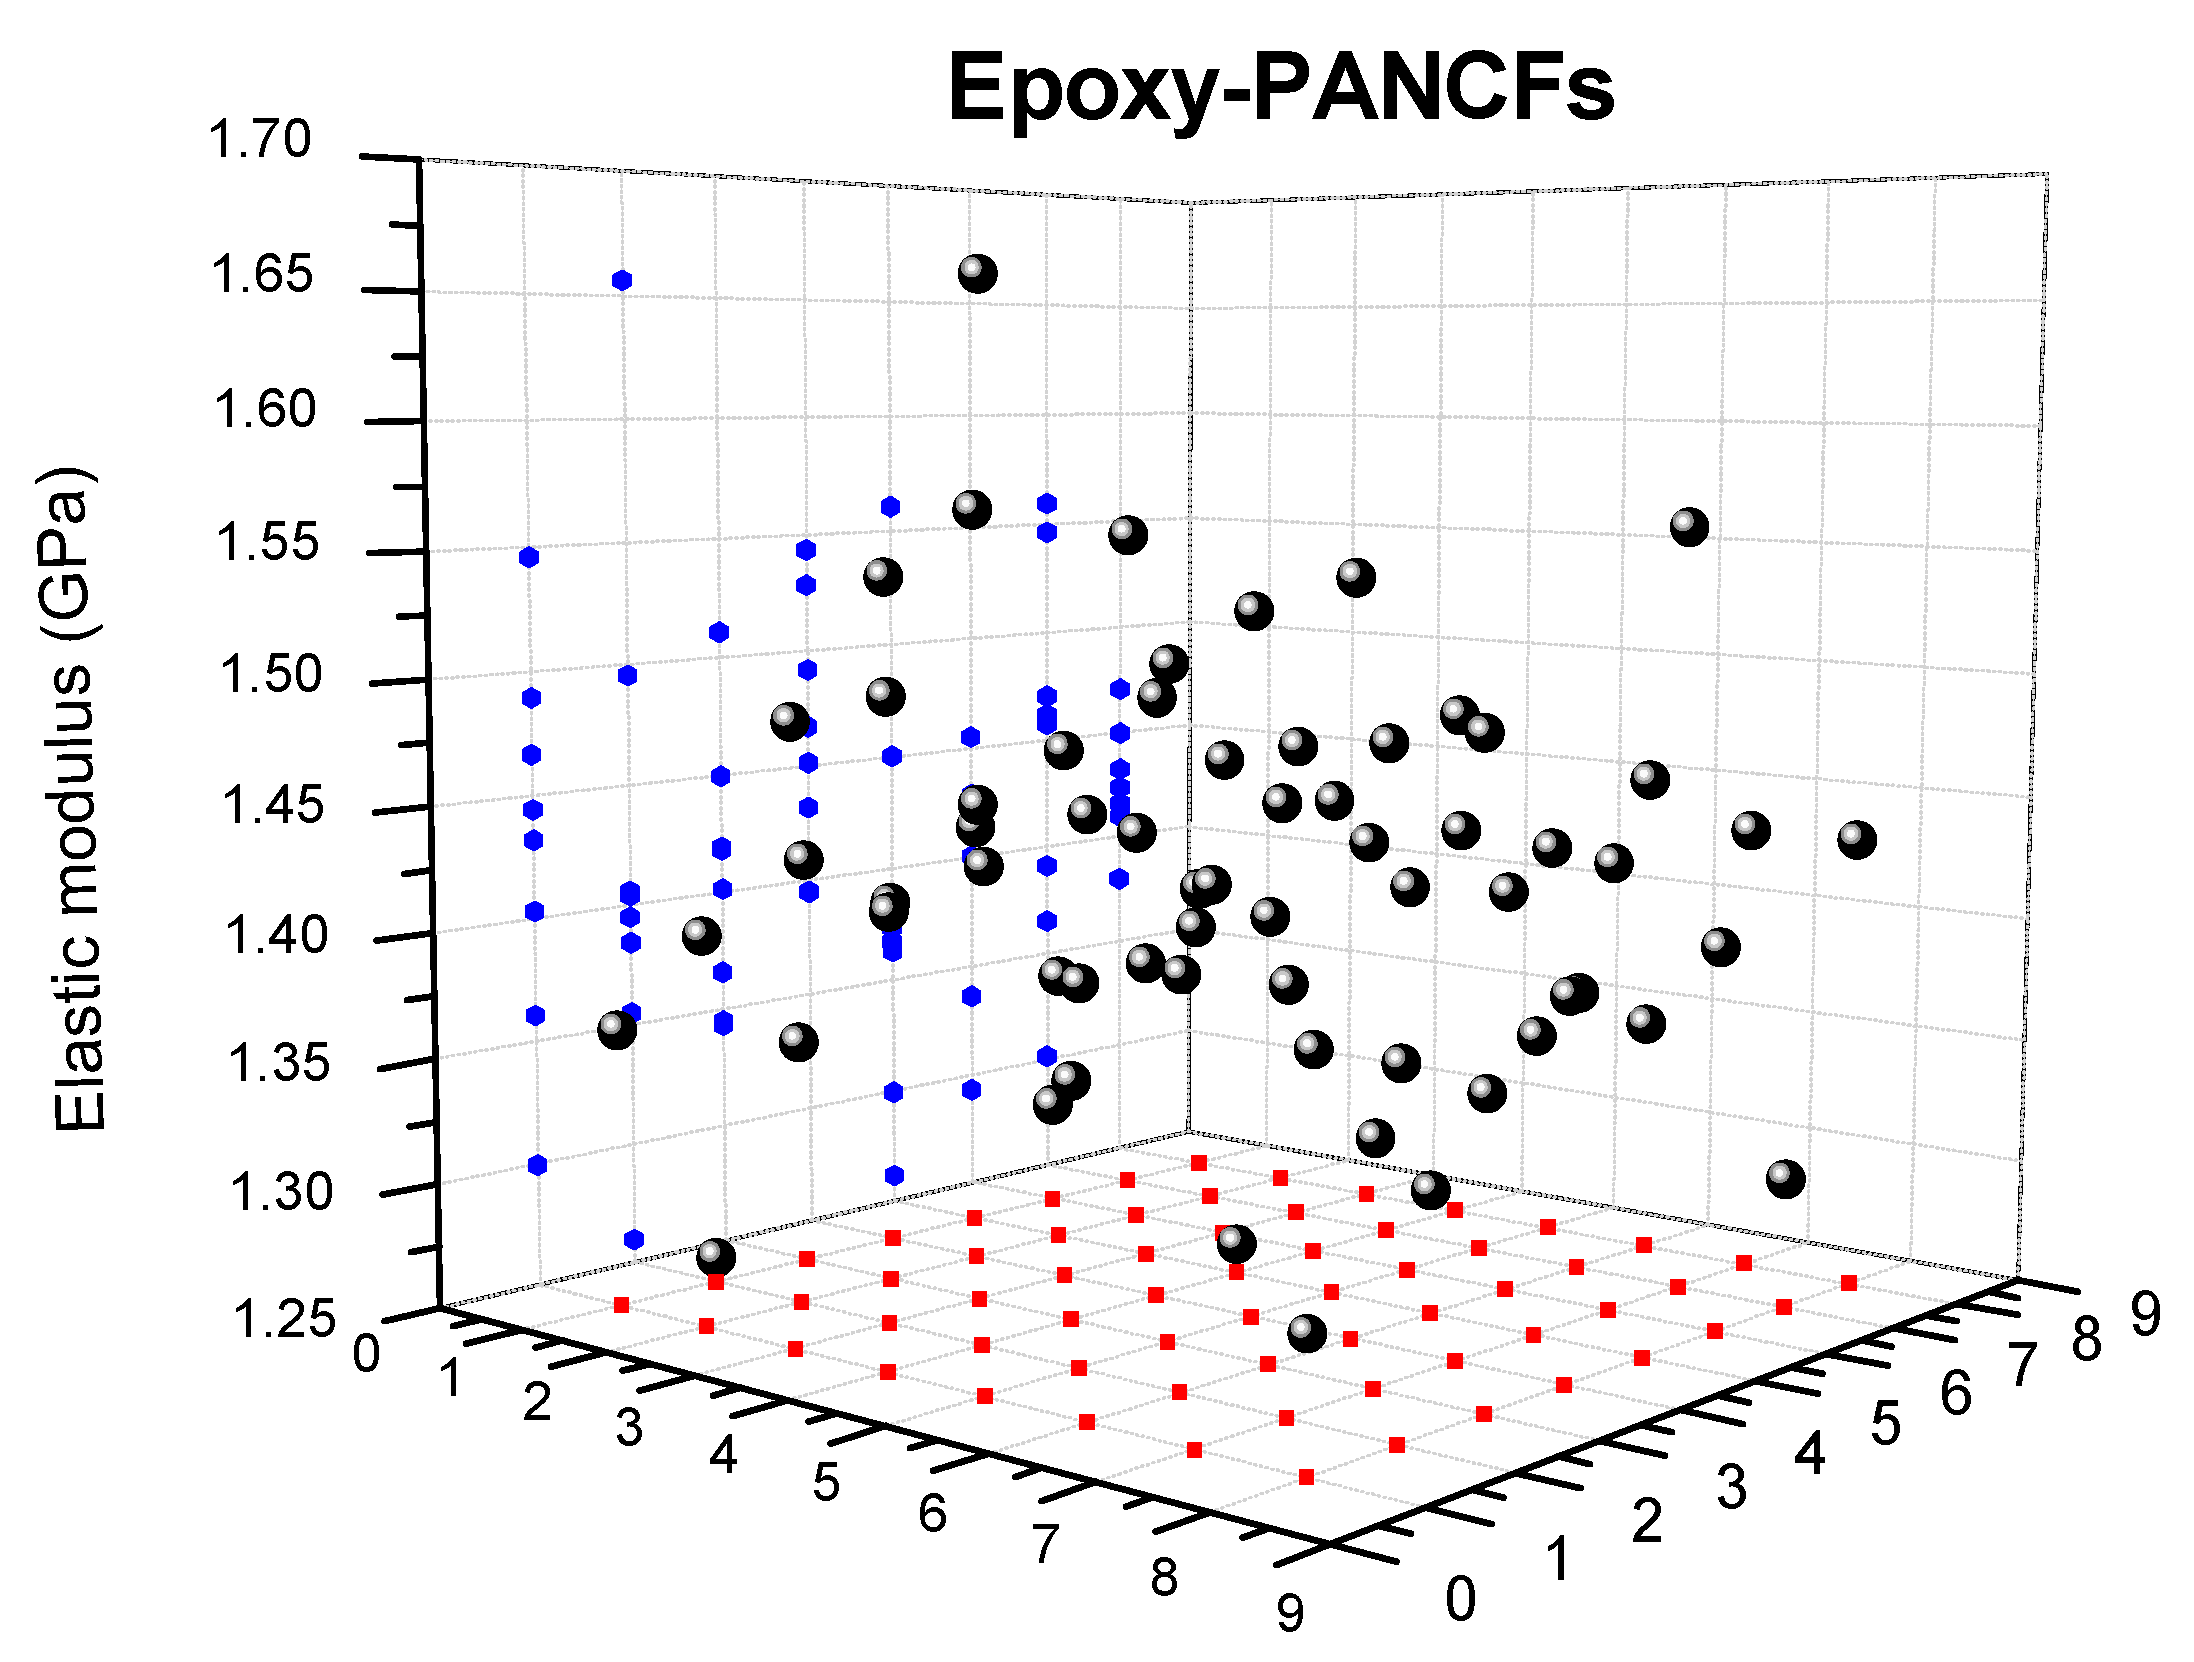
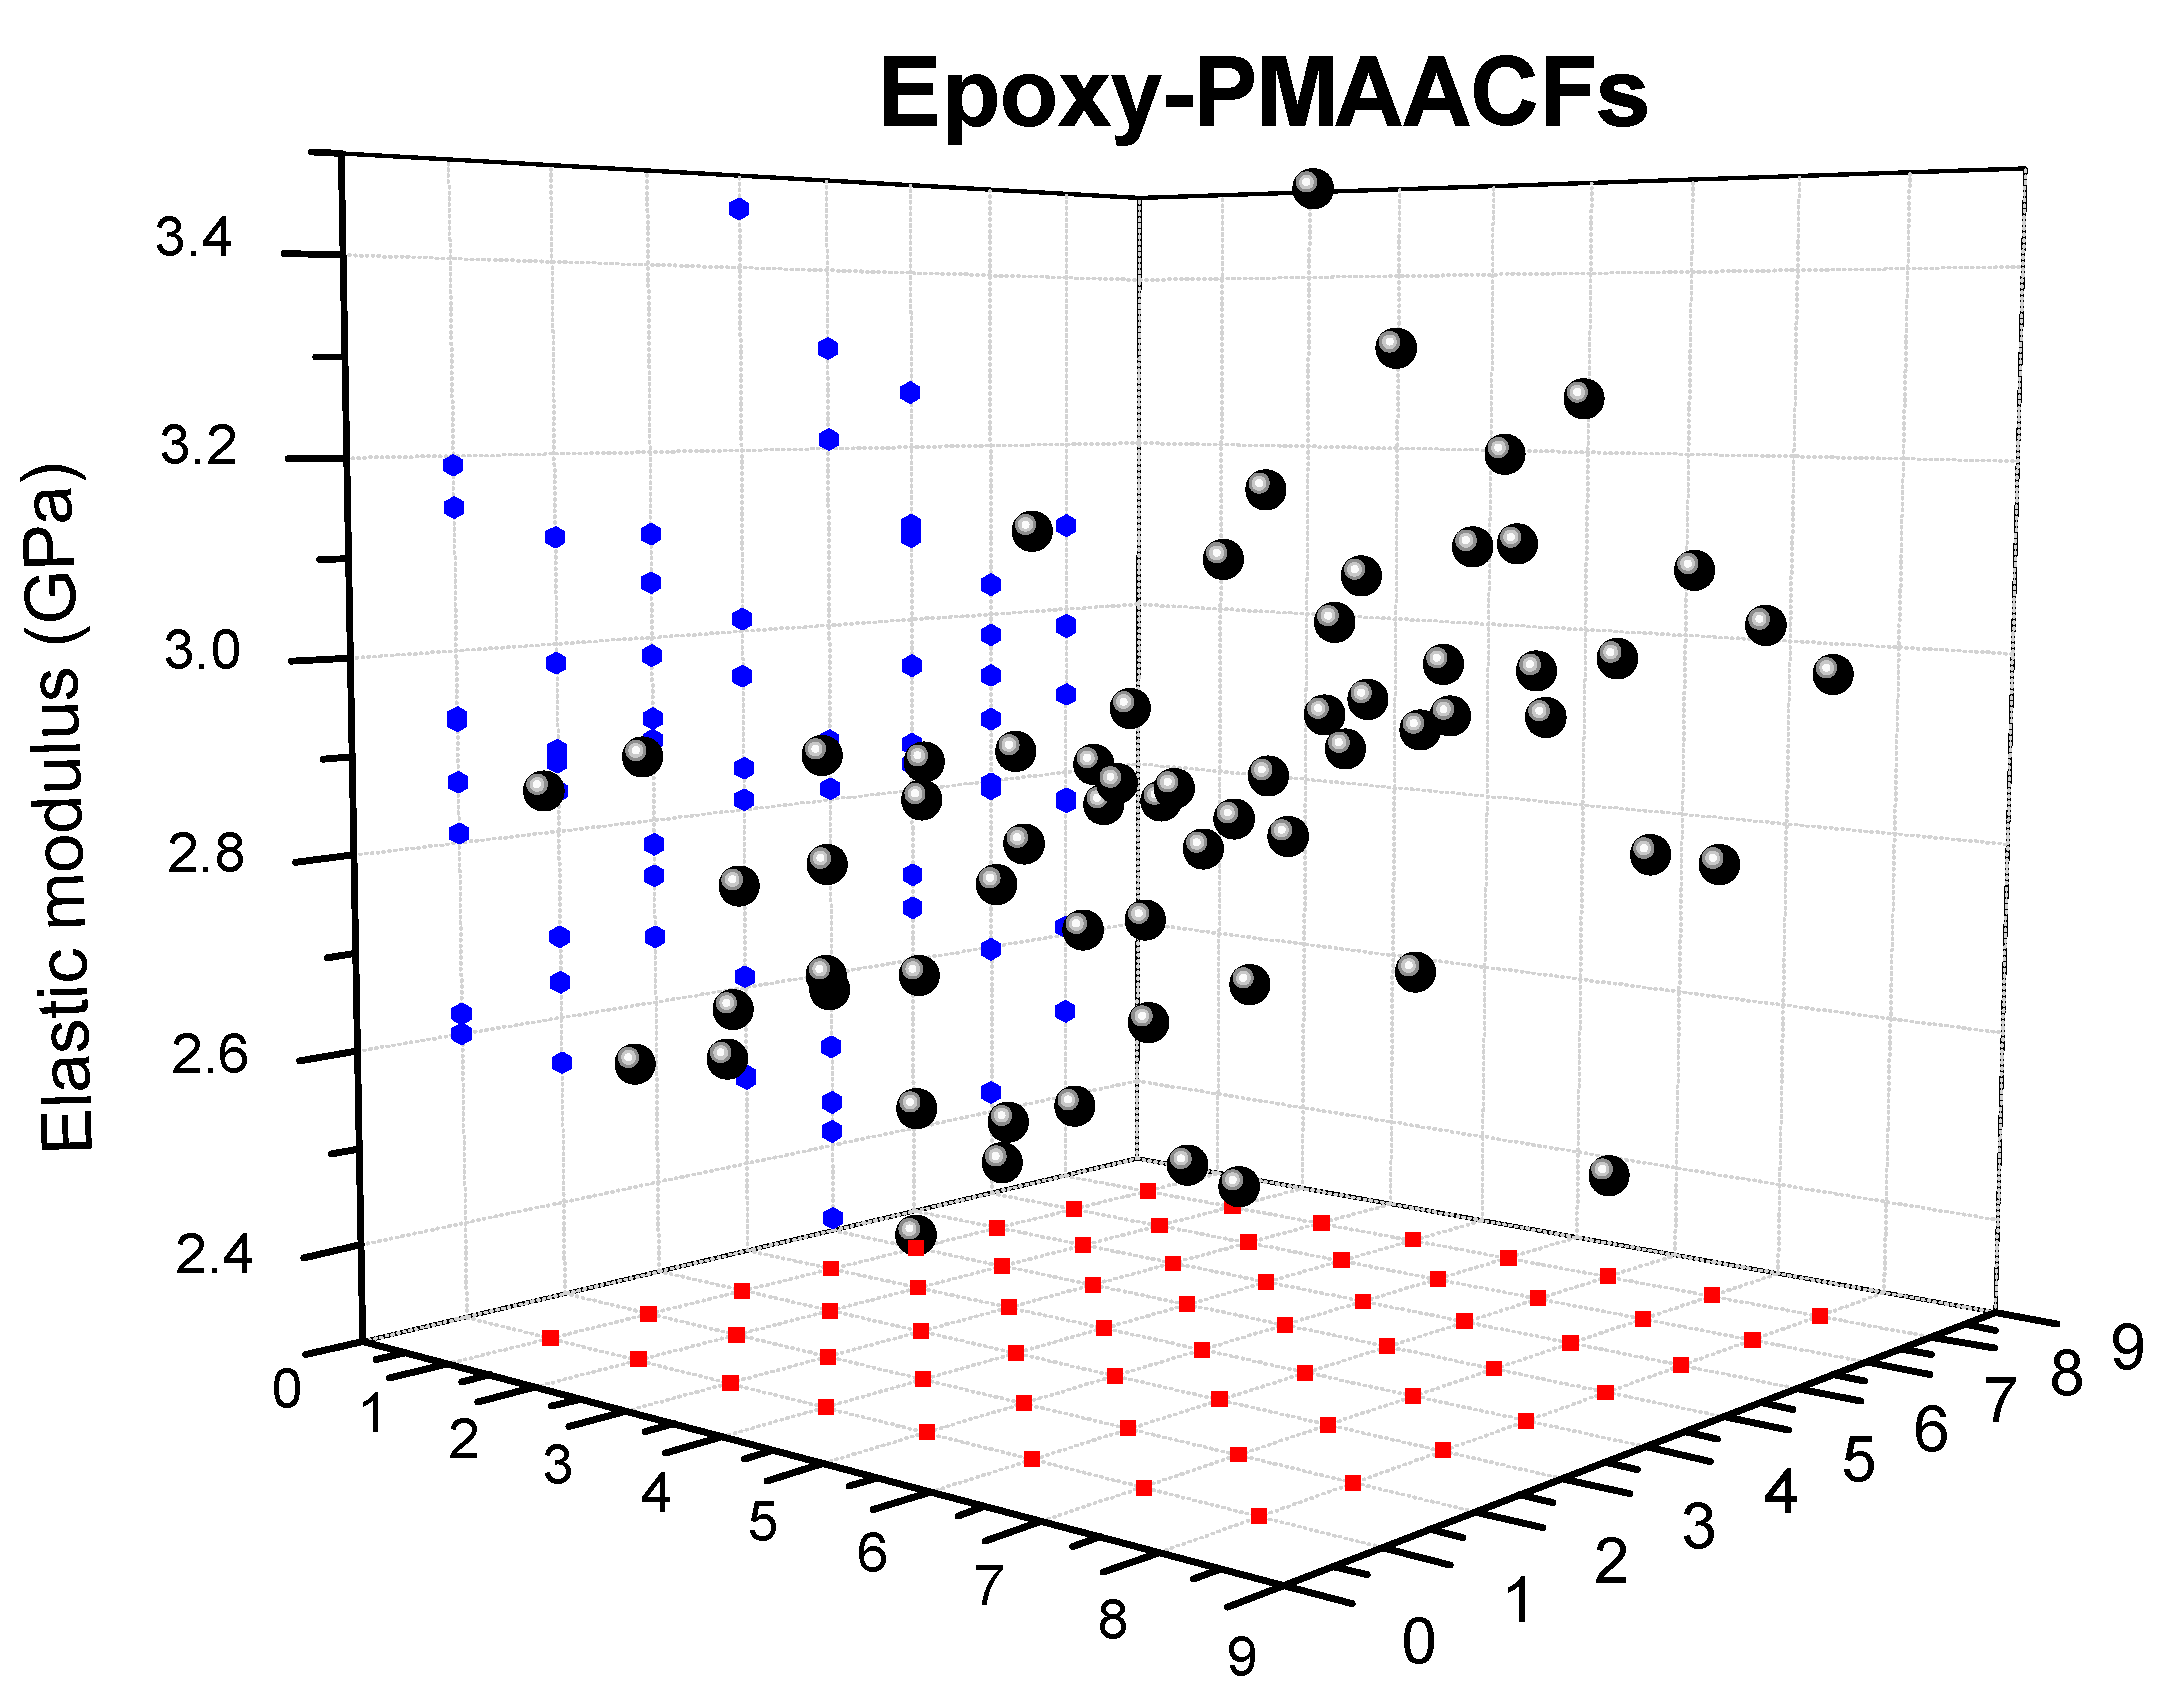
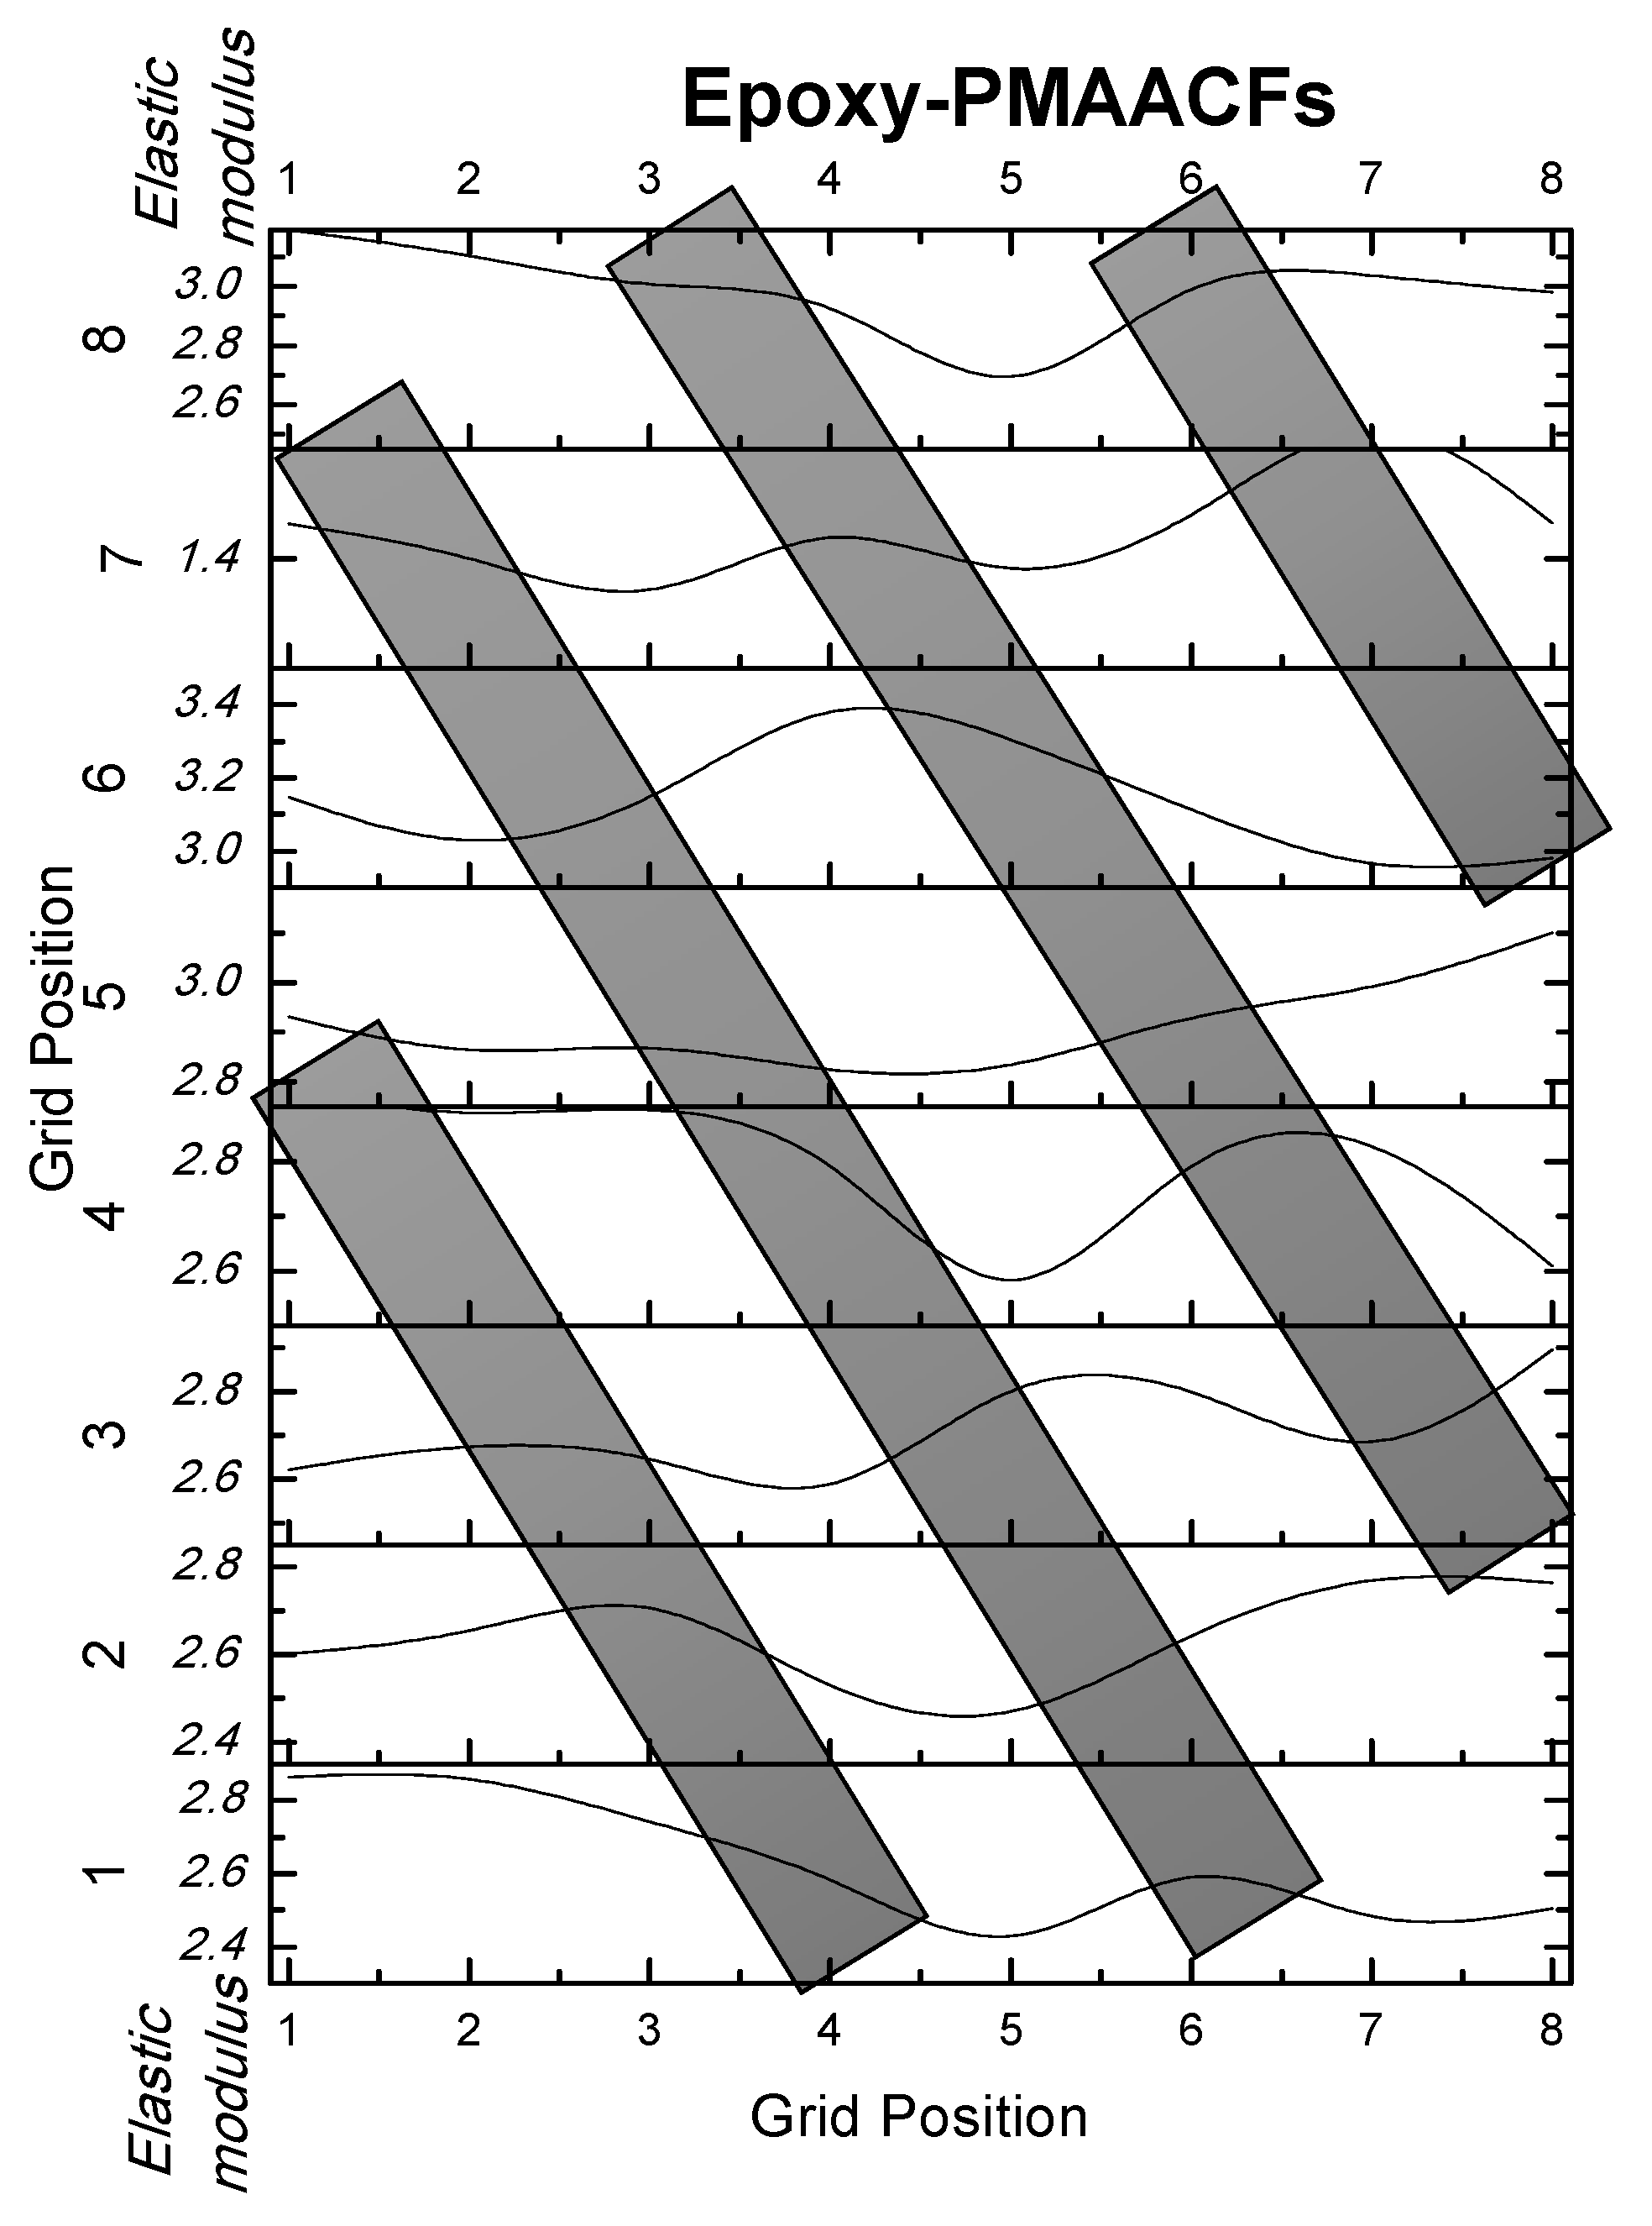
Elastic modulus (values referring to epoxy, affected by extent of interfacial adhesion and, thus, overall CFRP integrity) mapping for all samples showed that for the case of epoxy-PMAACFs, higher values (~3.5 GPa) are evidenced; this is also consistent with values from Figure 6, as it is denoted that higher applied loads are required for reaching 200 nm of displacement, comparing this with all other samples (of which the max. modulus values reached ~1.7 GPa). In Figure 8, Figure 9, Figure 10 and Figure 11, elastic modulus obtained from nanoindentation mapping measurements at 200 nm of displacement for all samples are presented. The 64 points are presented in red dots (base, X–Y axes), while elastic modulus values are presented in black; through trajection (blue colour), the deviation range of elastic moduli is depicted. epoxy-PMAACFs sample exhibits the highest elastic moduli range (up to ~3.4 GPa), while rest of the samples exhibit elastic moduli range up to ~1.7 GPa.
In Figure 12, identification of fibre orientation through elastic modulus nanoindentation mapping measurements at 200 nm of displacement in the epoxy-PMAACFs sample is presented (embedded fibre structures are used as the inset, as a means of presenting elastic modulus values, in line with fibre orientation).
4. Conclusions
The purpose of this study was to assess the integrity of CFRP comprising of commercial and surface modified CFs through a nanomechanical mapping protocol, towards the feasibility of a nanoindentation tool as a quality assurance means in a composite manufacturing process. The obtained results reveal that, for the case of epoxy-PAACFs, an increased plastic deformation is recorded (together with viscoelasticity and adhesion-discontinuities, and fluctuations during measurement), while the epoxy-PMAACF sample exhibits the highest elastic recovery, compared with epoxy-PANCF and epoxy-PAACF samples. Elastic modulus (values referring to epoxy, affected by extent of interfacial adhesion and, thus, overall CFRP integrity) mapping for all samples at 200 nm of displacement revealed that for the case of epoxy-PMAACFs, increased values are recorded. As for resistance to applied load, epoxy-PANCF and epoxy-PAACF samples exhibit lower resistance to applied load compared with epoxy-PMAACFs. Overall, epoxy-PMAACFs comprise the most suitable CF surface modification, with decreased plastic deformation and increased elastic modulus, while the resistance to applied load of the points that correspond to measurement on top of fibre upper area are higher from those of epoxy-CFs (benchmark). Additionally, identification of fibre orientation through elastic modulus nanoindentation mapping measurements at 200 nm of displacement for the epoxy-PMAACFs sample was achieved.
To conclude, a grid mapping protocol was proved as a powerful tool for the integrity assessment of CFRPs through nanomechanical mapping, revealing the effect extent of CF surface modification and supporting the selection of appropriate CF surface modification.
Author Contributions
E.P.K. conceived, designed and performed the experiments. C.A.C., E.P.K. collaborated in the results analysis and in the paper-writing.
Funding
This work partially received funding from the European Union’s Horizon 2020 Research and Innovation Programme MODCOMP under grant agreement No. 685844.
Acknowledgments
This work was partially supported by the EU H2020 Project “Modified Cost Effective Fibre Based Structures with Improved Multi-Functionality and Performance” (MODCOMP) under grant agreement no. 685844.
Conflicts of Interest
The authors declare no conflict of interest
References
- Kainourgios, P.; Kartsonakis, I.; Dragatogiannis, D.; Koumoulos, E.P.; Goulis, P.; Charitidis, C.A. Electrochemical surface functionalization of carbon fibers for chemical affinity improvement with epoxy resins. Appl. Surf. Sci. 2017, 416, 593–604. [Google Scholar] [CrossRef]
- Yuan, X.; Zhu, B.; Cai, X.; Liu, J.; Qiao, K.; Yu, J. Optimization of interfacial properties of carbon fiber/epoxy composites via a modified polyacrylate emulsion sizing. Appl. Surf. Sci. 2017, 401, 414–423. [Google Scholar] [CrossRef]
- Morgan, P. Surface treatment and sizing of carbon fibers. In Carbon Fibers and Their Composites, 1st ed.; CRC Press, Taylor & Francis Group: Boca Raton, FL, USA, 2005; pp. 347–376. [Google Scholar]
- Zhang, Y.; Zhang, Y.; Liu, Y.; Wang, X.; Yang, B. A novel surface modification of carbon fiber for high-performance thermoplastic polyurethane composites. Appl. Surf. Sci. 2016, 382, 144–154. [Google Scholar] [CrossRef]
- Tiwari, S.; Bijwe, J.; Panier, S. Optimization of surface treatment to enhance fiber–matrix interface and performance of composites. Wear 2012, 274–275, 326–334. [Google Scholar] [CrossRef]
- Ma, Q.; Gu, Y.; Li, M.; Wang, S.; Zhang, Z. Effects of surface treating methods of high-strength carbon fibers on interfacial properties of epoxy resin matrix composite. Appl. Surf. Sci. 2016, 379, 199–205. [Google Scholar] [CrossRef]
- Lee, H.; Ohsawa, I.; Takahashi, J. Effect of plasma surface treatment of recycled carbon fiber on carbon fiber-reinforced plastics (CFRP) interfacial properties. Appl. Surf. Sci. 2015, 328, 241–246. [Google Scholar] [CrossRef]
- Osbeck, S.; Ward, S.; Idriss, H. Effect of UV and electrochemical surface treatments on the adsorption and reaction of linear alcohols on non-porous carbon fibre. Appl. Surf. Sci. 2013, 270, 272–280. [Google Scholar] [CrossRef]
- Tofail, S.A.M.; Koumoulos, E.P.; Bandyopadhyay, A.; Bose, S.; O’Donoghue, L.; Charitidis, C. Additive manufacturing: Scientific and technological challenges, market uptake and opportunities. Mater. Today 2018, 21, 22–37. [Google Scholar] [CrossRef]
- Leatherbarrow, A.; Wu, H. Mechanical behaviour of the constituents inside carbon-fibre/carbon-silicon carbide composites characterised by nano-indentation. Eur. Ceram. Soc. 2012, 32, 579–588. [Google Scholar] [CrossRef] [Green Version]
- Urena, A.; Rams, J.; Escalera, M.D.; Sanchez, M. Characterization of interfacial mechanical properties in carbon fiber/aluminium matrix composites by the nanoindentation technique. Com. Sci. Tech. 2005, 65, 2025–2038. [Google Scholar] [CrossRef]
- Koumoulos, E.P.; Tofail, S.A.M.; Silien, C.; De Felicis, D.; Moscatelli, R.; Dragatogiannis, D.A.; Bemporad, E.; Sebastiani, M.; Charitidis, C.A. Metrology and nano-mechanical tests for nano-manufacturing and nano-bio interface: Challenges & future perspectives. Mater. Des. 2018, 137, 446–462. [Google Scholar]
- Koumoulos, E.P.; Charitidis, C. Surface analysis and mechanical behaviour mapping of vertically aligned cnt forest array through nanoindentation. Appl. Surf. Sci. 2017, 396, 681–687. [Google Scholar] [CrossRef]
- Koumoulos, E.P.; Charitidis, C.; Papageorgiou, D.P.; Papathanasiou, A.G.; Boudouvis, A.G. Nanomechanical and nanotribological properties of hydrophobic fluorocarbon dielectric coating on tetraethoxysilane for electrowetting applications. Surf. Coat. Technol. 2012, 206, 3823–3831. [Google Scholar] [CrossRef]
- Koumoulos, E.P.; Jagdale, P.; Kartsonakis, I.A.; Giorcelli, M.; Tagliaferro, A.; Charitidis, C.A. Carbon nanotube/polymer nanocomposites: A study on mechanical integrity through nanoindentation. Polym. Compos. 2015, 36, 1432–1446. [Google Scholar] [CrossRef]
- Charitidis, C.A.; Dragatogiannis, D.A.; Koumoulos, E.P.; Kartsonakis, I.A. Residual stress and deformation mechanism of friction stir welded aluminum alloys by nanoindentation. Mater. Sci. Eng. A 2012, 540, 226–234. [Google Scholar] [CrossRef]
- Koumoulos, E.P.; Charitidis, C.A. Lubricity Assessment, Wear and Friction of CNT-Based Structures in Nanoscale. Lubricants 2017, 5, 18. [Google Scholar] [CrossRef]
- Hu, Z.; Farahikia, M.; Delfanian, F. Fiber bias effect on characterization of carbon fiber-reinforced polymer composites by nanoindentation testing and modelling. J. Compos. Mater. 2015, 49, 3359–3372. [Google Scholar] [CrossRef]
- Maurin, R.; Davies, P.; Baral, N.; Baley, C. Transverse properties of carbon fibres by nano-indentation and micro-mechanics. Appl. Compos. Mater. 2008, 15, 61–73. [Google Scholar] [CrossRef]
- Hardiman, M.; Vaughan, T.J.; McCarthy, C.T. A review of key developments and pertinent issues in nanoindentation testing of fibre reinforced plastic microstructures. Compos. Struct. 2017, 180, 782–798. [Google Scholar] [CrossRef]
- Ulm, F.-J.; Vandamme, M.; Bobko, C.; Alberto Ortega, J.; Tai, K.; Ortiz, C. Statistical Indentation Techniques for Hydrated Nanocomposites: Concrete, Bone, and Shale. Am. Ceram. Soc. 2007, 90, 2677–2692. [Google Scholar] [CrossRef] [Green Version]
- Sebastiani, M.; Moscatelli, R.; Ridi, F.; Baglioni, P.; Carassitia, F. High-resolution high-speed nanoindentation mapping of cement pastes: Unravelling the effect of microstructure on the mechanical properties of hydrated phases. Mater. Des. 2016, 97, 372–380. [Google Scholar] [CrossRef]
- Koumoulos, E.P.; Jagadale, P.; Lorenzi, A.; Tagliaferro, A.; Charitidis, C.A. Evaluation of surface properties of epoxy–nanodiamonds composites. Compos. Part B Eng. 2015, 80, 27–36. [Google Scholar] [CrossRef]
- Constantinides, G.; Ravi Chandran, K.S.; Ulm, F.-J.; Vliet, K.J.V. Grid indentation analysis of composite microstructure and mechanics: Principles and validation. Mater. Sci. Eng. A 2006, 430, 189–202. [Google Scholar] [CrossRef]
- Semitekolos, D.; Kainourgios, P.; Jones, C.; Rana, A.; Koumoulos, E.P.; Charitidis, C.A. Advanced carbon fibre composites via poly methacrylic acid surface treatment; surface analysis and mechanical properties investigation. Compos. Part B Eng. 2018, 155, 237–243. [Google Scholar] [CrossRef]
- Tserpes, K.; Chanteli, A.; Pantelakis, S.; Koumoulos, E.P.; Charitidis, C.A. Mechanical and nanomechanical properties of MWCNT/PP nanocomposite. Frat. Integ. Strut. 2018, 12, 73–83. [Google Scholar]
- Kartsonakis, I.A.; Balaskas, A.C.; Koumoulos, E.P.; Charitidis, C.A.; Kordas, G.C. Incorporation of ceramic nanocontainers into epoxy coatings for the corrosion protection of hot dip galvanized steel. Corros. Sci. 2012, 57, 30–41. [Google Scholar] [CrossRef]
Figure 1.
SEM images of carbon fibres, reproduced from [1].
Figure 1.
SEM images of carbon fibres, reproduced from [1].

Figure 2.
Nanoindentation schematic representation of mapping grid measurements (a); the indentation occurs at epoxy surface (matrix) (b), while the affection of the fibres (and, thus, their interface) underneath is revealed through the variation in resistance to an applied load and load-unload curve form.

Figure 3.
Load-displacement data from the loading-unloading mapping measurements at 200 nm of displacement, for the epoxy-CF plain sample.
Figure 3.
Load-displacement data from the loading-unloading mapping measurements at 200 nm of displacement, for the epoxy-CF plain sample.
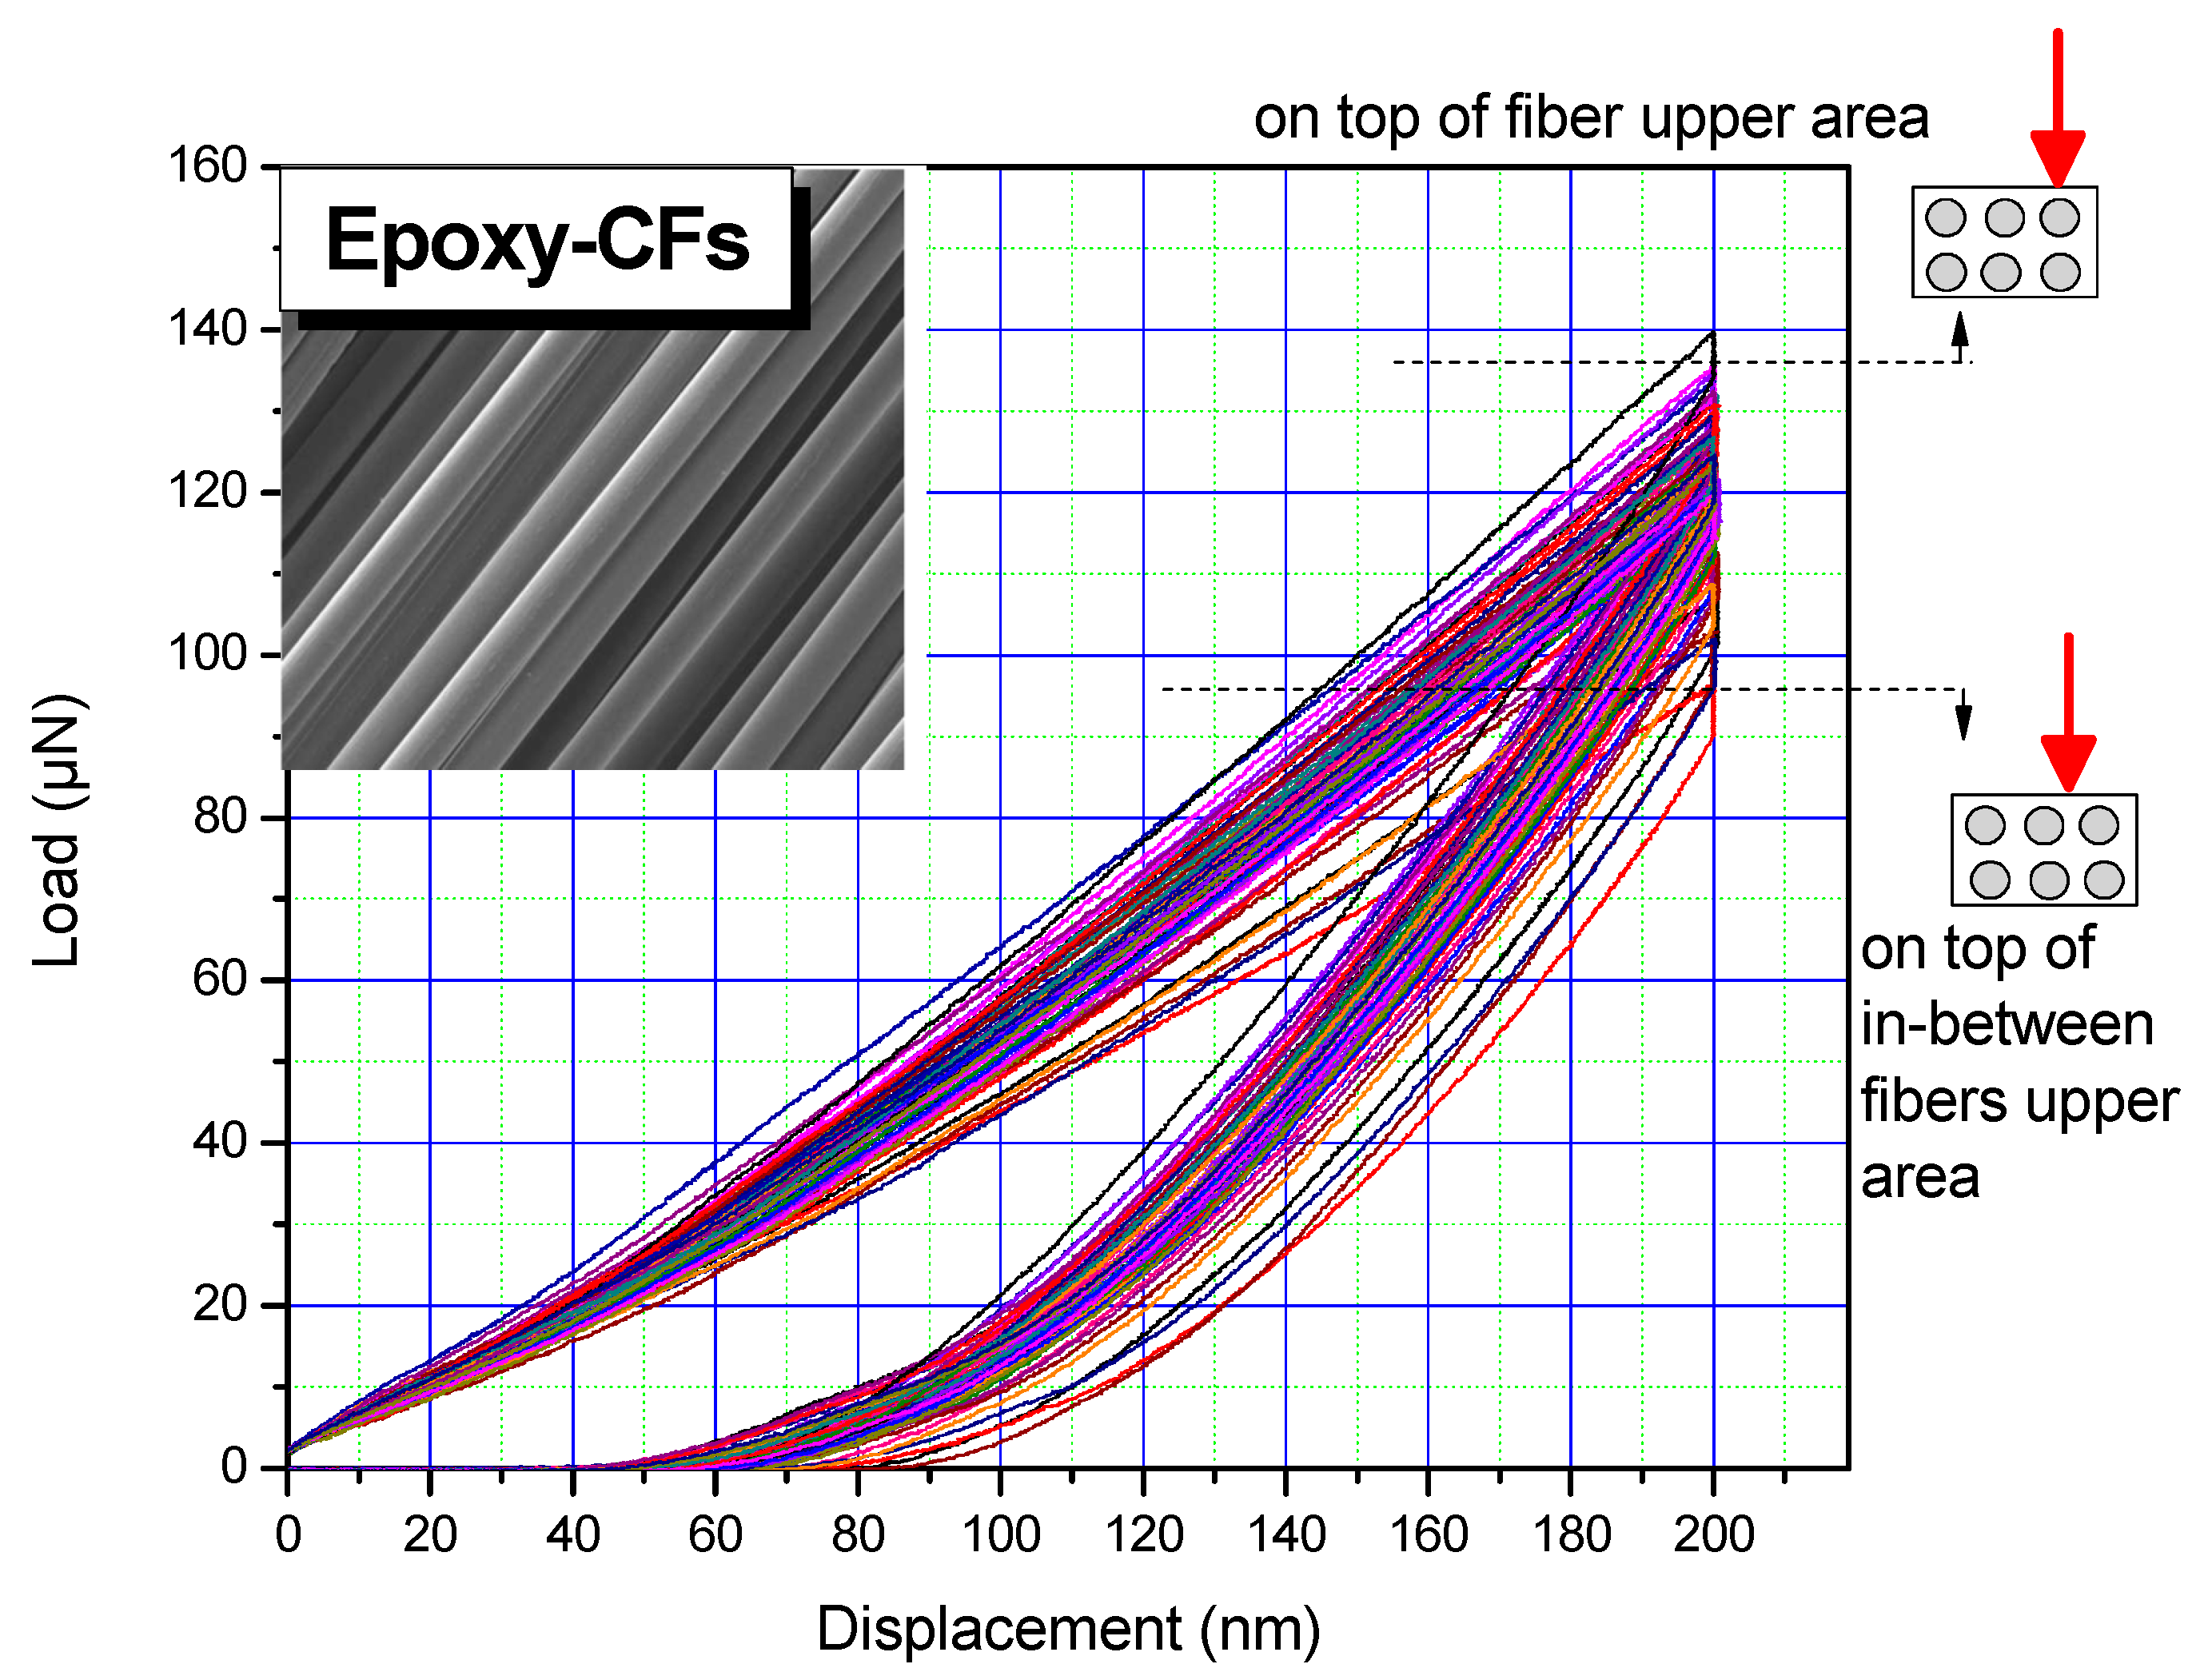
Figure 4.
Load-displacement data from the loading-unloading mapping measurements at 200 nm of displacement, for the epoxy-PAACFs sample.
Figure 4.
Load-displacement data from the loading-unloading mapping measurements at 200 nm of displacement, for the epoxy-PAACFs sample.

Figure 5.
Load-displacement data from the loading-unloading mapping measurements at 200 nm of displacement, for the epoxy-PANCFs sample.
Figure 5.
Load-displacement data from the loading-unloading mapping measurements at 200 nm of displacement, for the epoxy-PANCFs sample.

Figure 6.
Load-displacement data from the loading-unloading mapping measurements at 200 nm of displacement, for the epoxy-PMAACFs sample.
Figure 6.
Load-displacement data from the loading-unloading mapping measurements at 200 nm of displacement, for the epoxy-PMAACFs sample.

Figure 7.
Elastic deformation (recovery) obtained from the loading-unloading mapping measurements at 200 nm of displacement, for (a) epoxy-CFs (benchmark), (b) epoxy-PAACF (low resistance to applied load), and (c) epoxy-PMAACFs samples (high resistance to applied load).
Figure 7.
Elastic deformation (recovery) obtained from the loading-unloading mapping measurements at 200 nm of displacement, for (a) epoxy-CFs (benchmark), (b) epoxy-PAACF (low resistance to applied load), and (c) epoxy-PMAACFs samples (high resistance to applied load).


Figure 8.
Elastic modulus obtained from the loading-unloading mapping measurements at 200 nm of displacement for the epoxy-CFs sample.
Figure 8.
Elastic modulus obtained from the loading-unloading mapping measurements at 200 nm of displacement for the epoxy-CFs sample.

Figure 9.
Elastic modulus obtained from the loading-unloading mapping measurements at 200 nm of displacement for the epoxy-PAACFs sample.
Figure 9.
Elastic modulus obtained from the loading-unloading mapping measurements at 200 nm of displacement for the epoxy-PAACFs sample.

Figure 10.
Elastic modulus obtained from the loading-unloading mapping measurements at 200 nm of displacement for the epoxy-PANCFs sample.
Figure 10.
Elastic modulus obtained from the loading-unloading mapping measurements at 200 nm of displacement for the epoxy-PANCFs sample.

Figure 11.
Elastic modulus obtained from the loading-unloading mapping measurements at 200 nm of displacement for the epoxy-PMAACFs sample.
Figure 11.
Elastic modulus obtained from the loading-unloading mapping measurements at 200 nm of displacement for the epoxy-PMAACFs sample.

Figure 12.
Identification of fibre orientation through elastic modulus nanoindentation mapping measurements at 200 nm of displacement for the epoxy-PMAACFs sample (fibres in grey). Value increases represent the fibres underneath the indenter, while value decreases represent the area in between fibres.


Table 1.
Concentration details for the preparation of the epoxy solution.
| Reagent | GY 257 | HΥ 943 | Acetone |
|---|---|---|---|
| Wt% | 20.0 | 1.76 | 76.48 |
© 2018 by the authors. Licensee MDPI, Basel, Switzerland. This article is an open access article distributed under the terms and conditions of the Creative Commons Attribution (CC BY) license (http://creativecommons.org/licenses/by/4.0/).
Share and Cite
MDPI and ACS Style
Koumoulos, E.P.; Charitidis, C.A. Integrity of Carbon-Fibre Epoxy Composites through a Nanomechanical Mapping Protocol towards Quality Assurance. Fibers 2018, 6, 78. https://doi.org/10.3390/fib6040078
AMA Style
Koumoulos EP, Charitidis CA. Integrity of Carbon-Fibre Epoxy Composites through a Nanomechanical Mapping Protocol towards Quality Assurance. Fibers. 2018; 6(4):78. https://doi.org/10.3390/fib6040078
Chicago/Turabian StyleKoumoulos, Elias P., and Costas A. Charitidis. 2018. "Integrity of Carbon-Fibre Epoxy Composites through a Nanomechanical Mapping Protocol towards Quality Assurance" Fibers 6, no. 4: 78. https://doi.org/10.3390/fib6040078
Note that from the first issue of 2016, this journal uses article numbers instead of page numbers. See further details here.