Thulium-Doped Silica Fibers with Enhanced Fluorescence Lifetime and Their Application in Ultrafast Fiber Lasers

 ,
,  , , and
Abstract
:1. Introduction
2. Materials and Methods
2.1. Preparation of Preforms and Optical Fibers
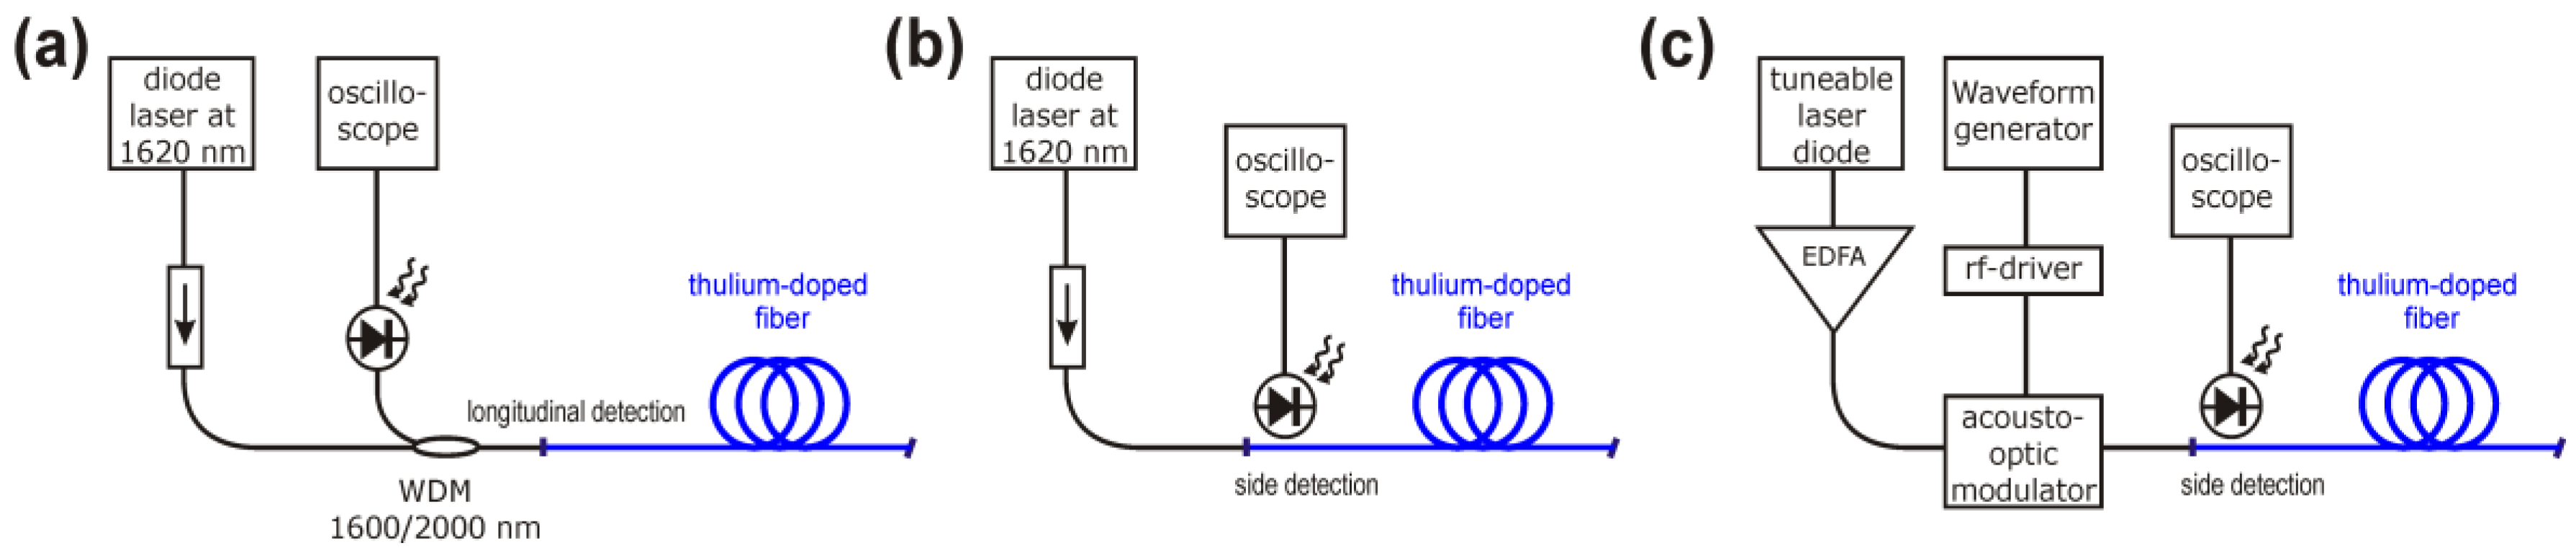
2.2. Characterization Methods
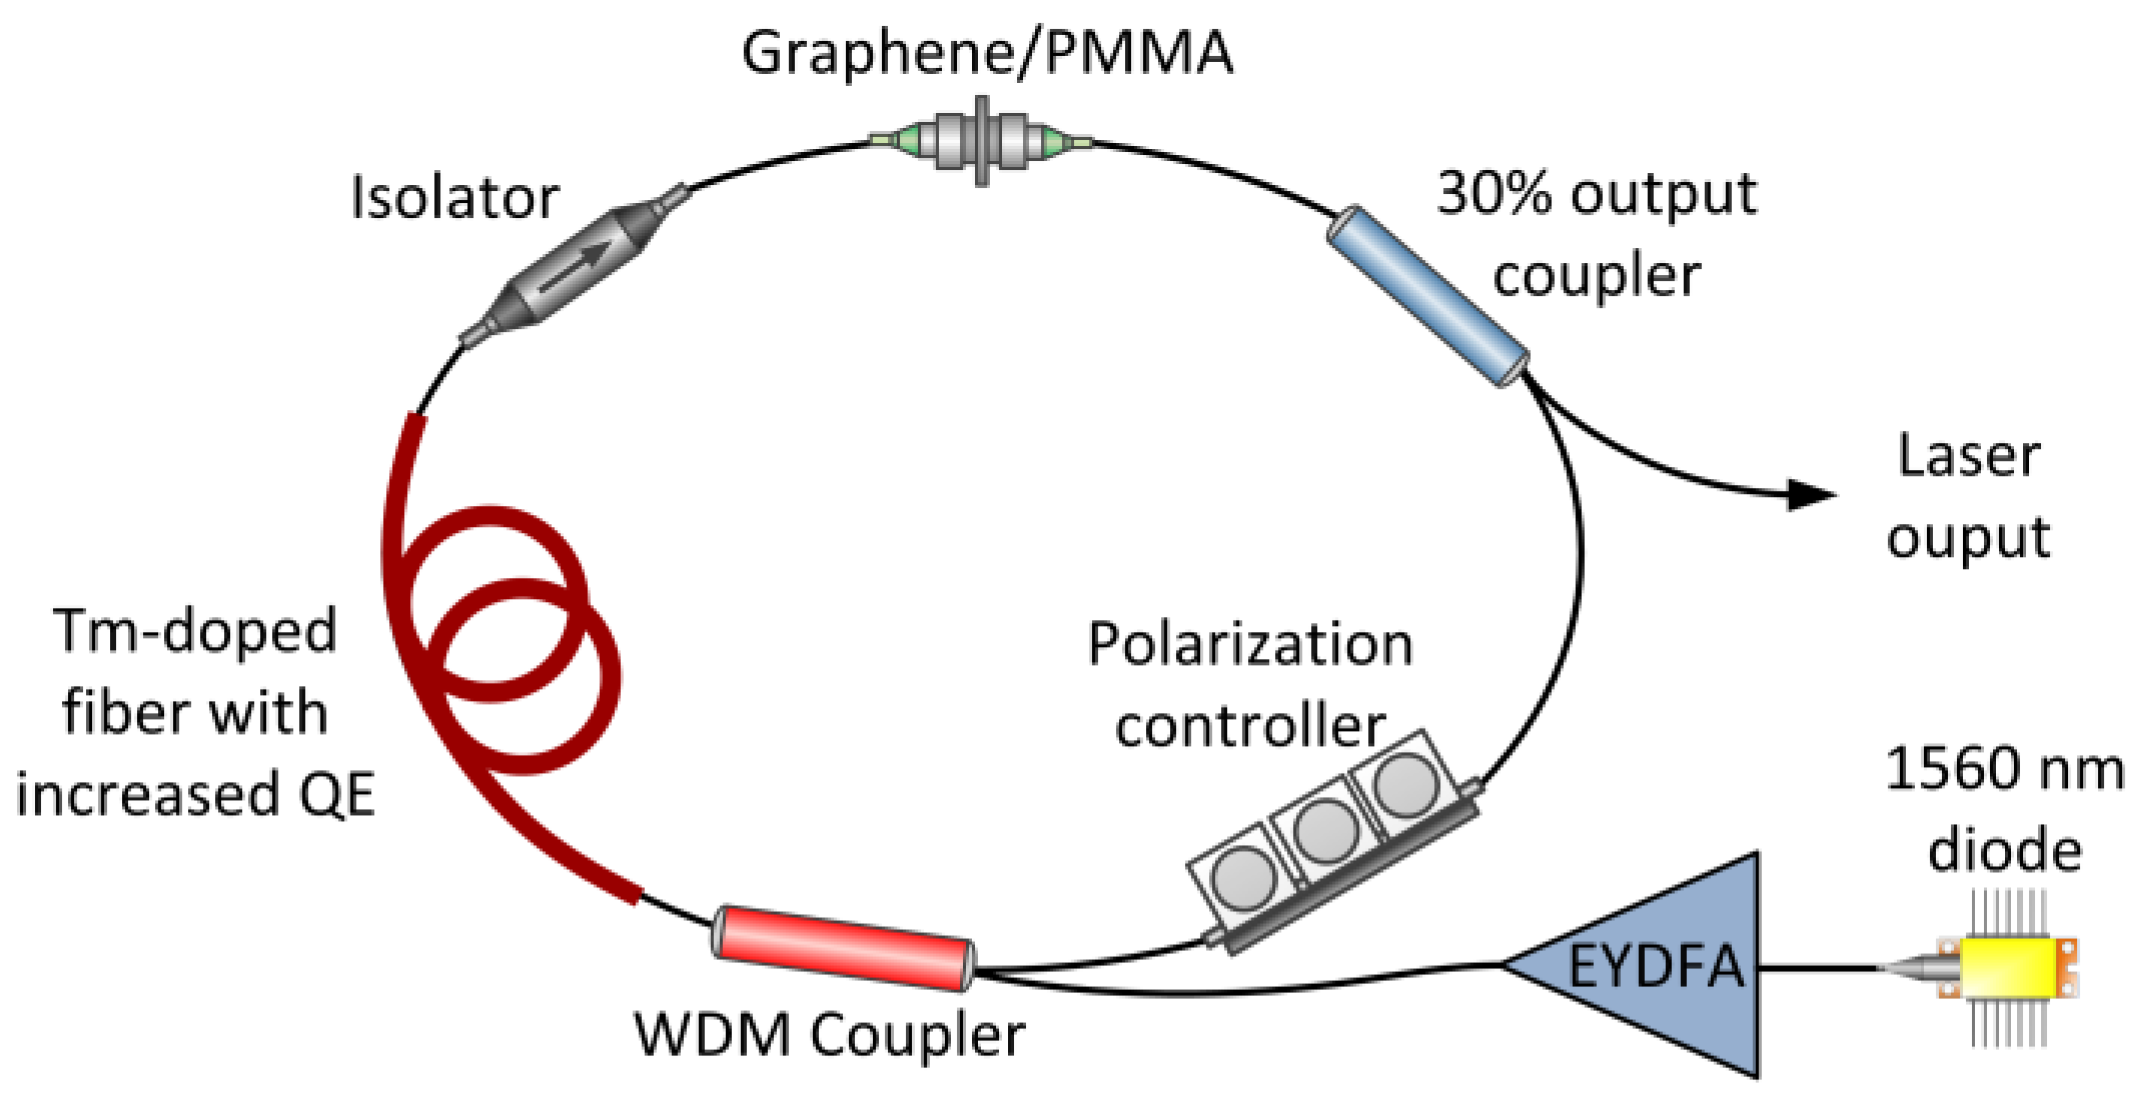
2.3. Mode-Locked Fiber Laser Setup
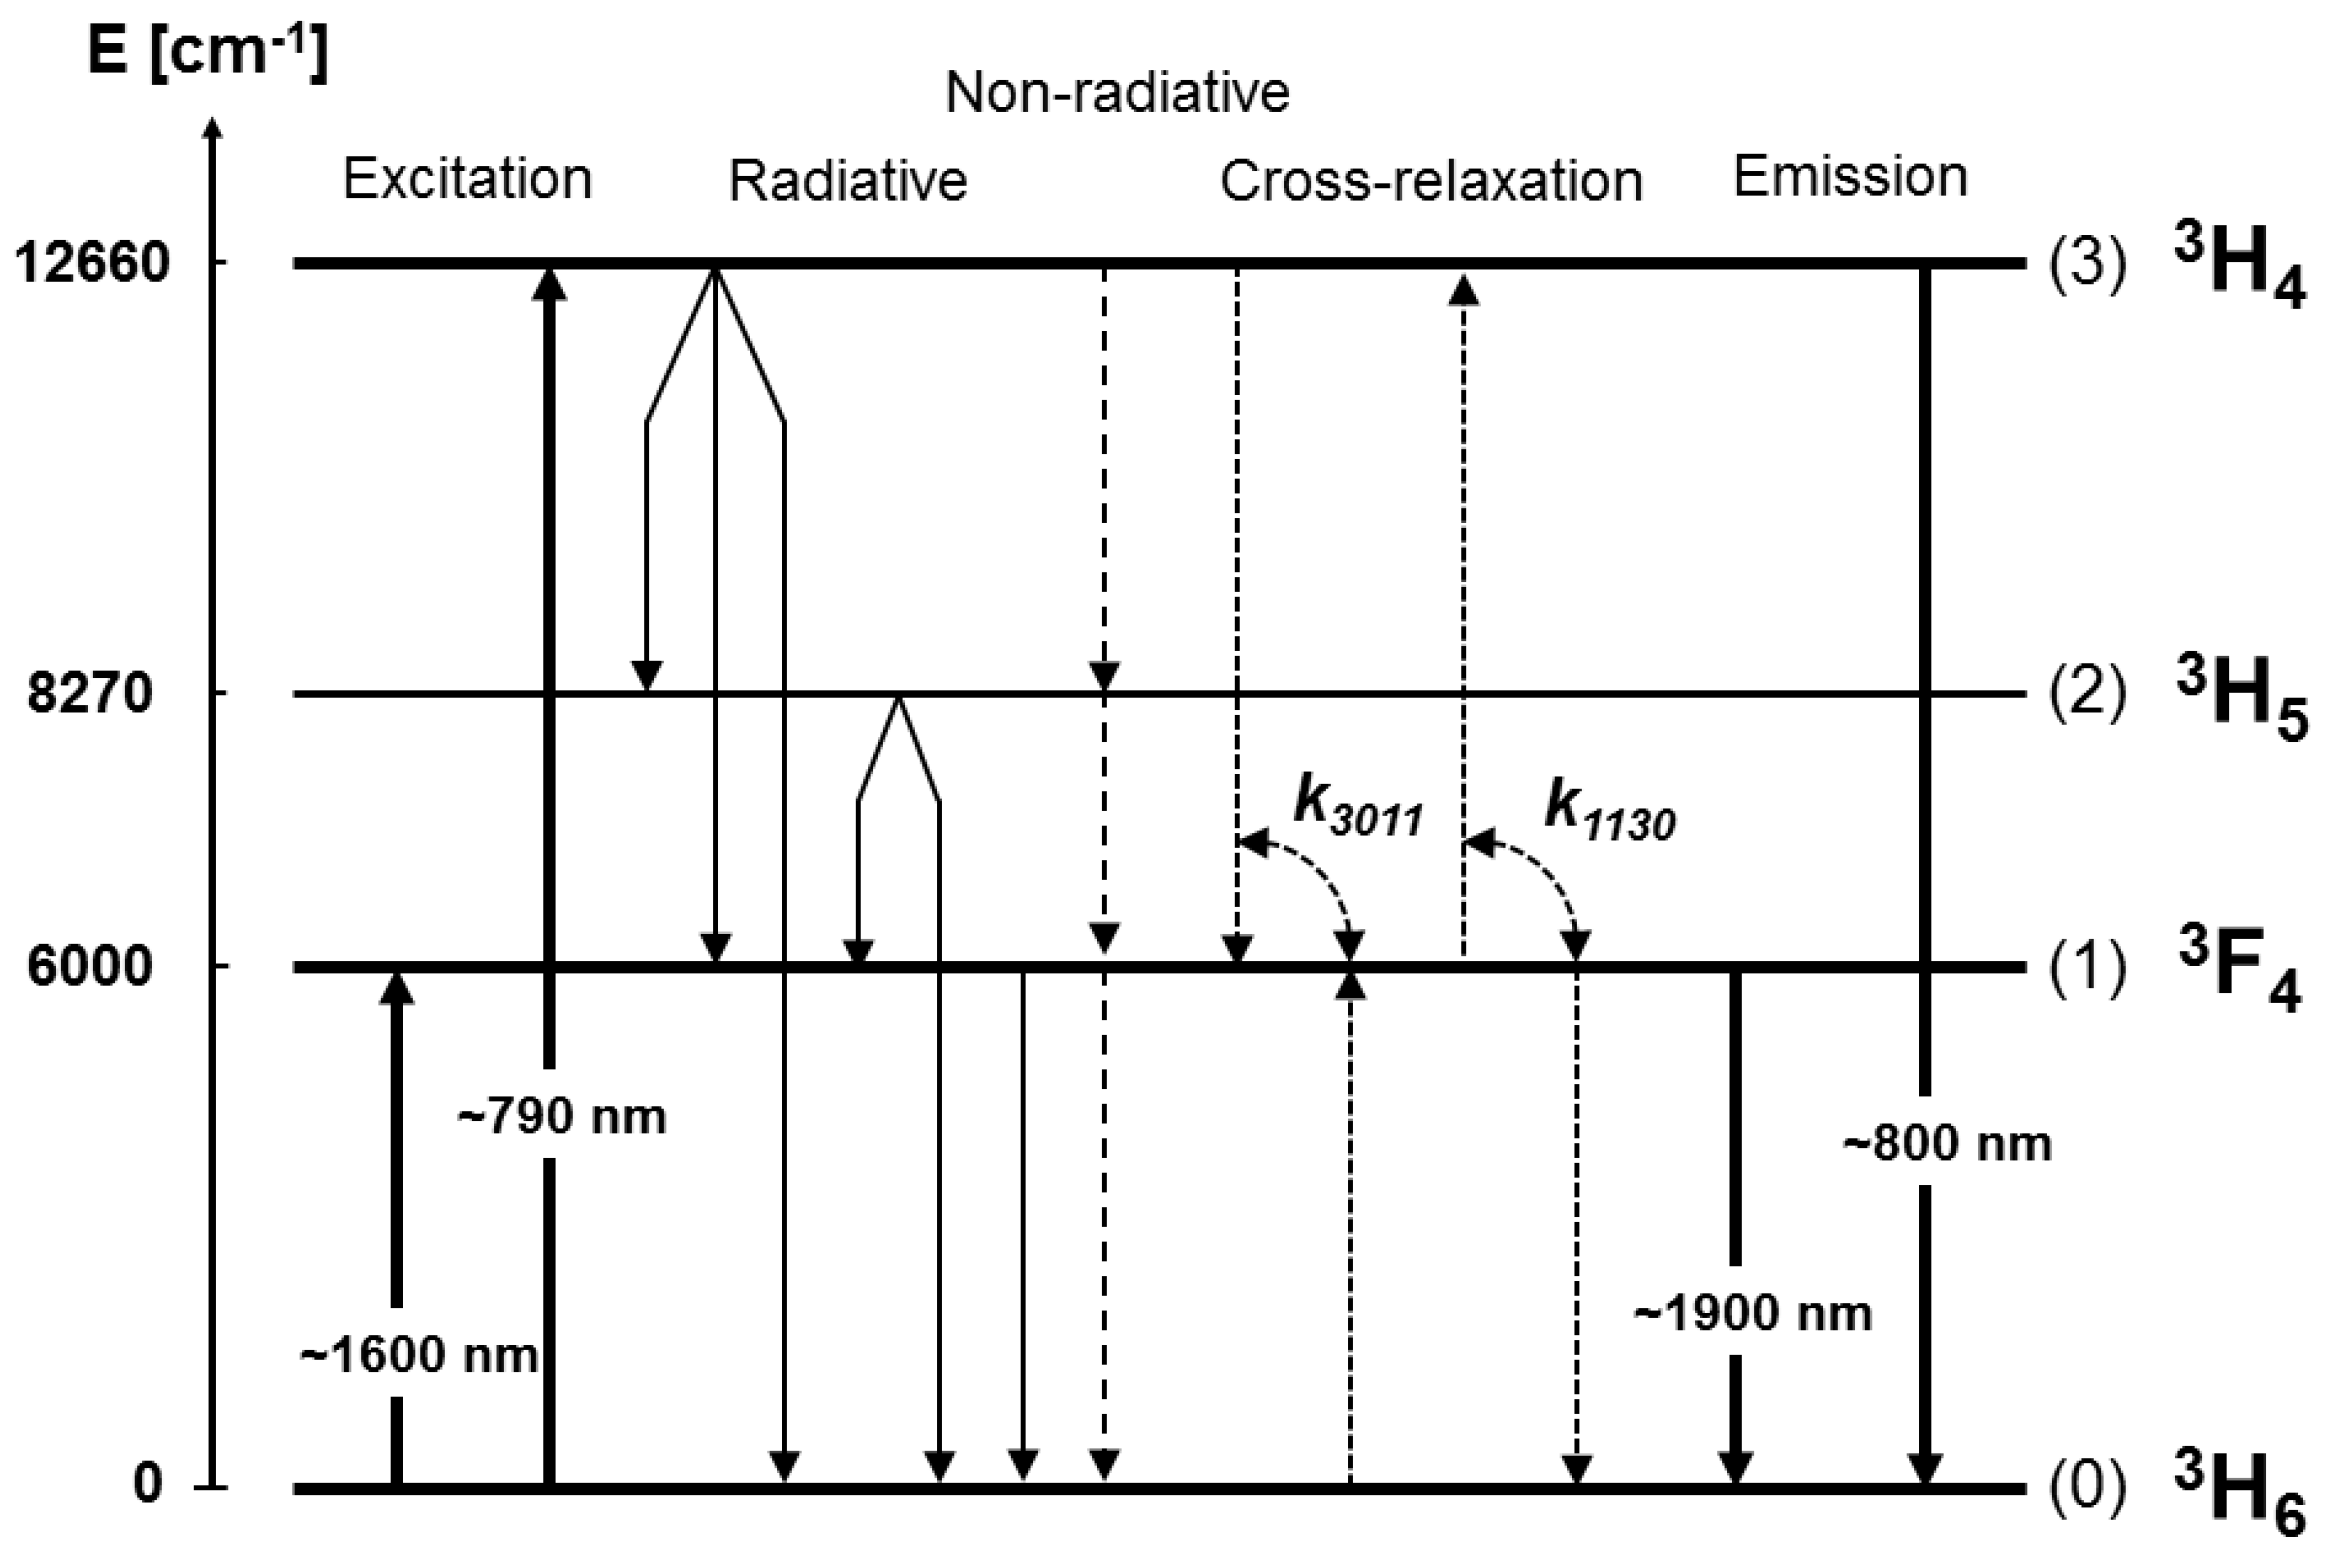
2.4. Theoretical Evaluation of Energy-Transfer Coefficients
- Only three energy levels 3H6 (level 0), 3F4 (level 1) and 3H4 (level 3) are considered, because the energy level 3H5 (level 2) is having very fast non-radiative multi-phonon transition to the energy level 3F4 (1). Therefore, also the cross-relaxation process CR20↔11 is neglected.
- Since we study only the decay part of the fluorescence, we neglect light-induced transitions described by Wij rates.
- The ASE (Amplified Spontaneous Emission) effect is neglected.
3. Results
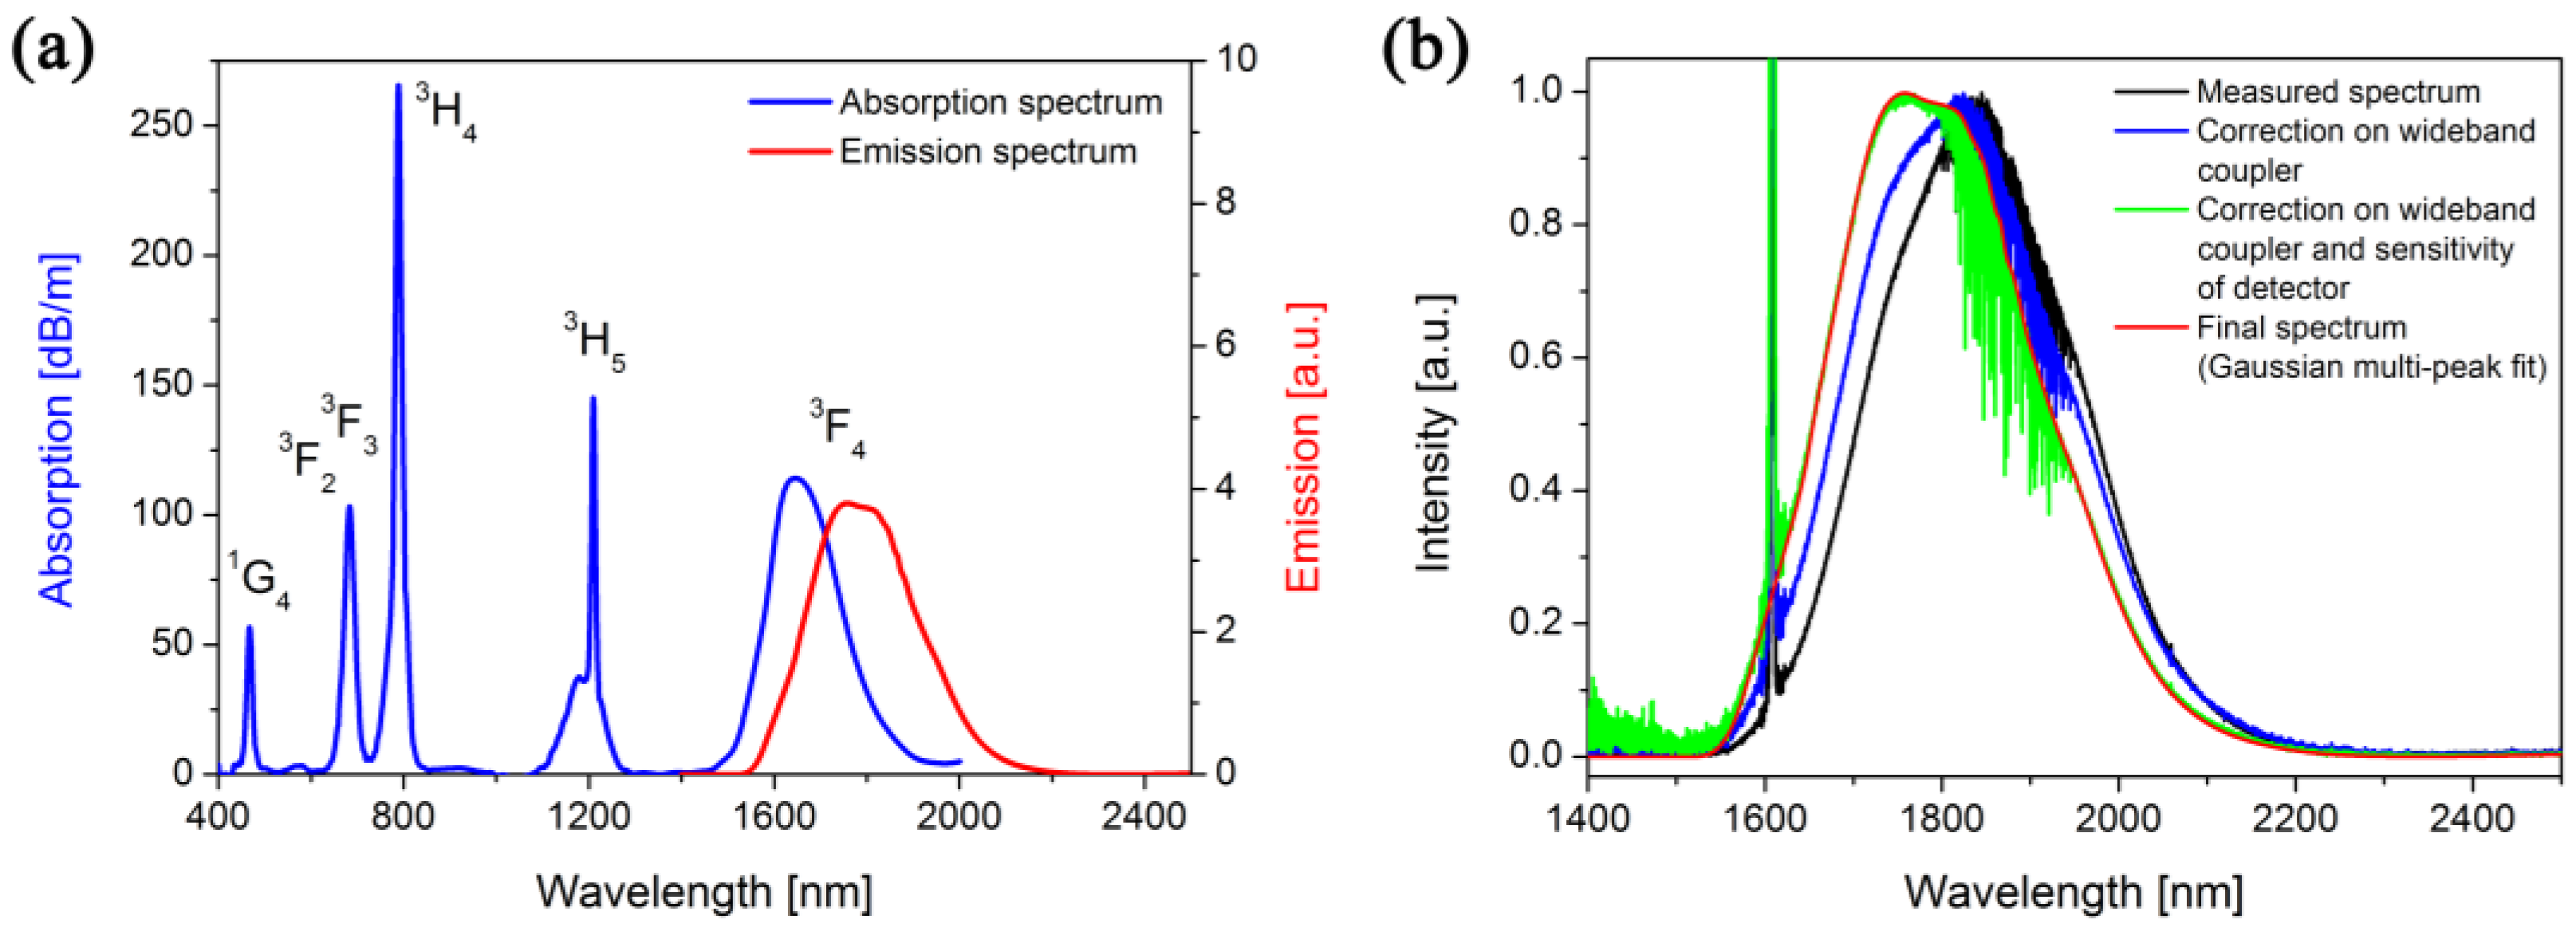
3.1. Refractive Index and Concentration Profiles, Optical Absorption, and Emission Spectra
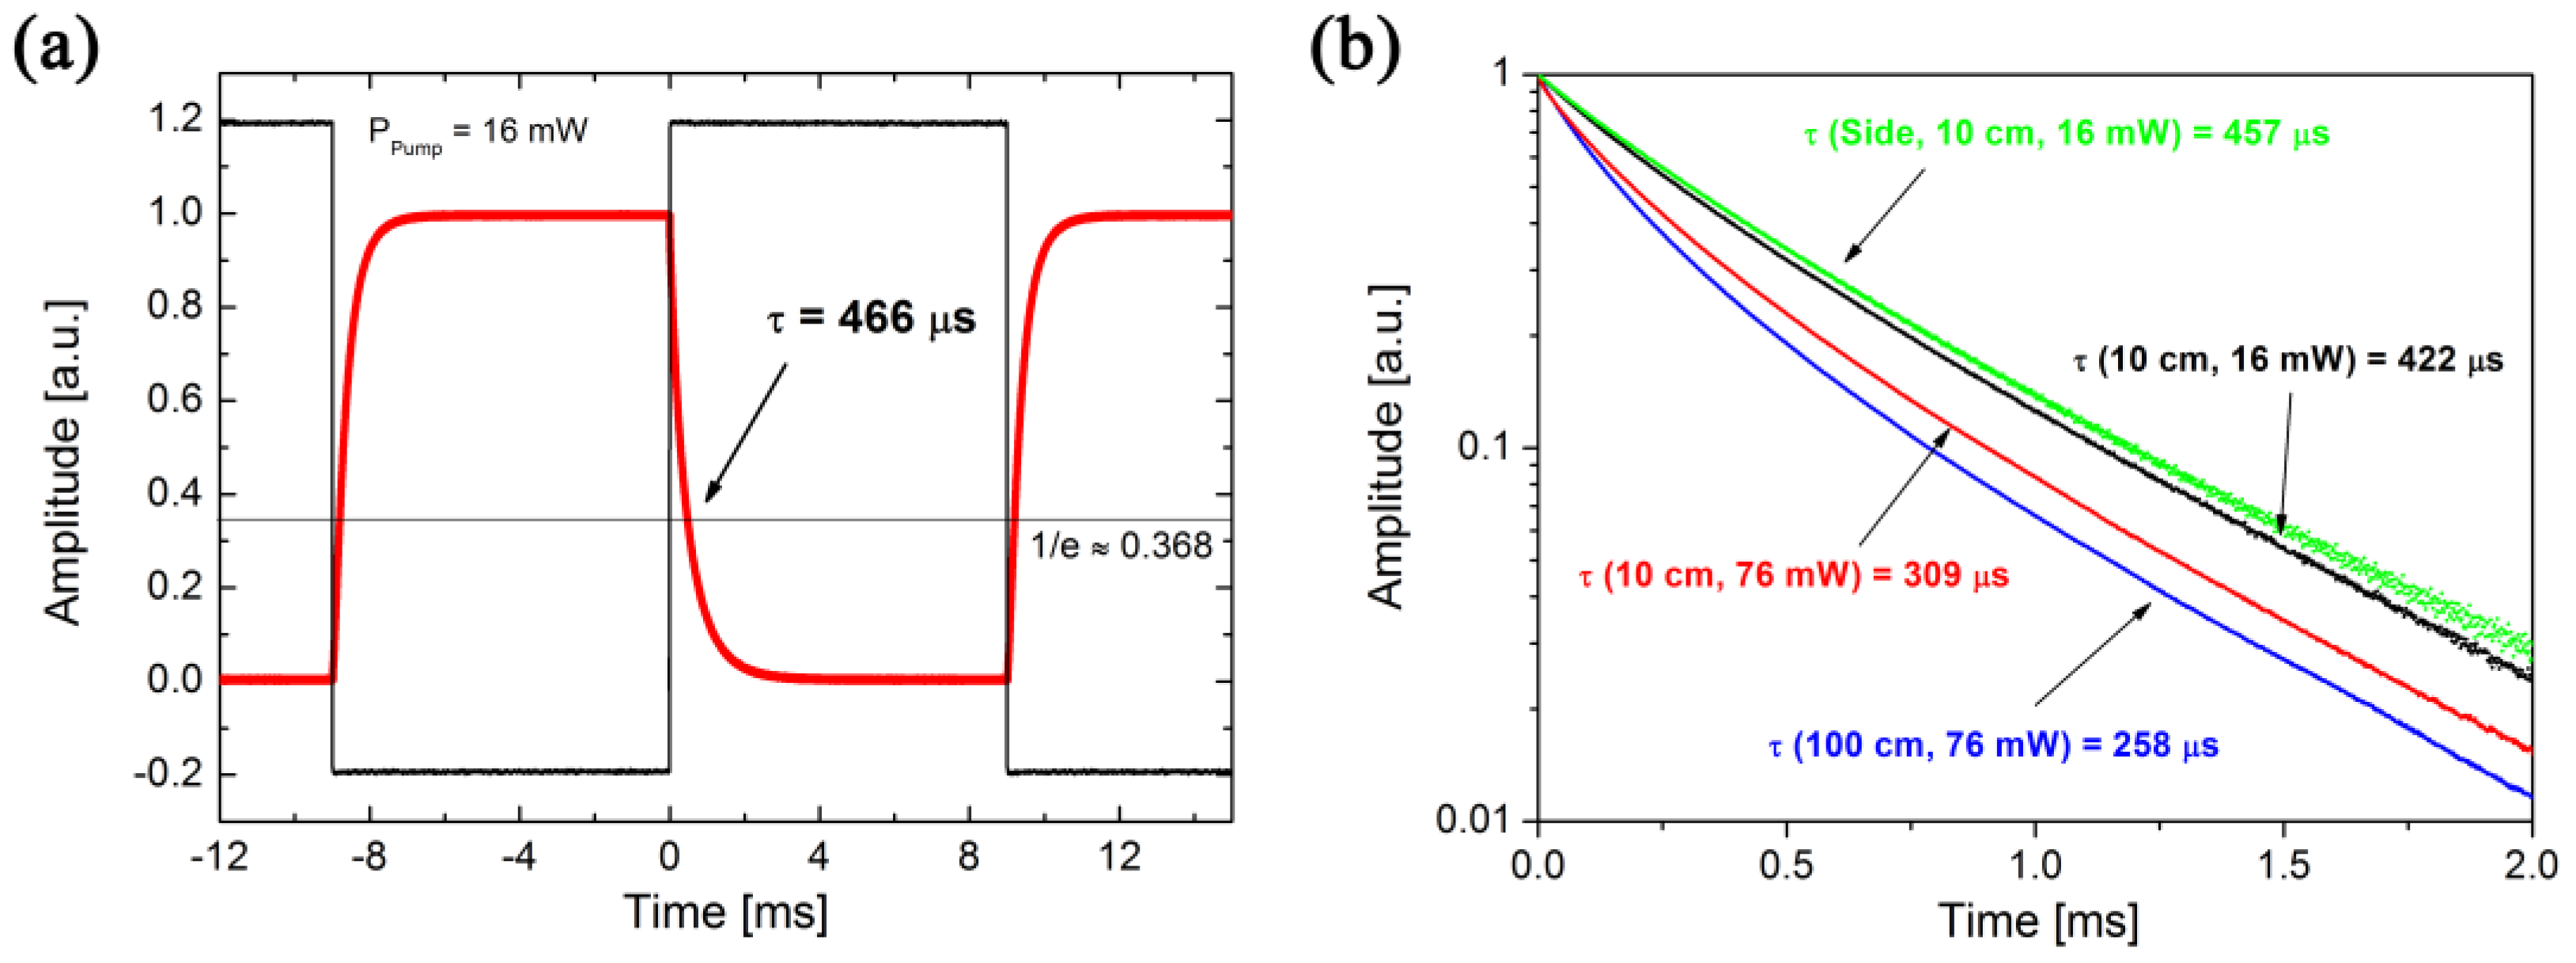
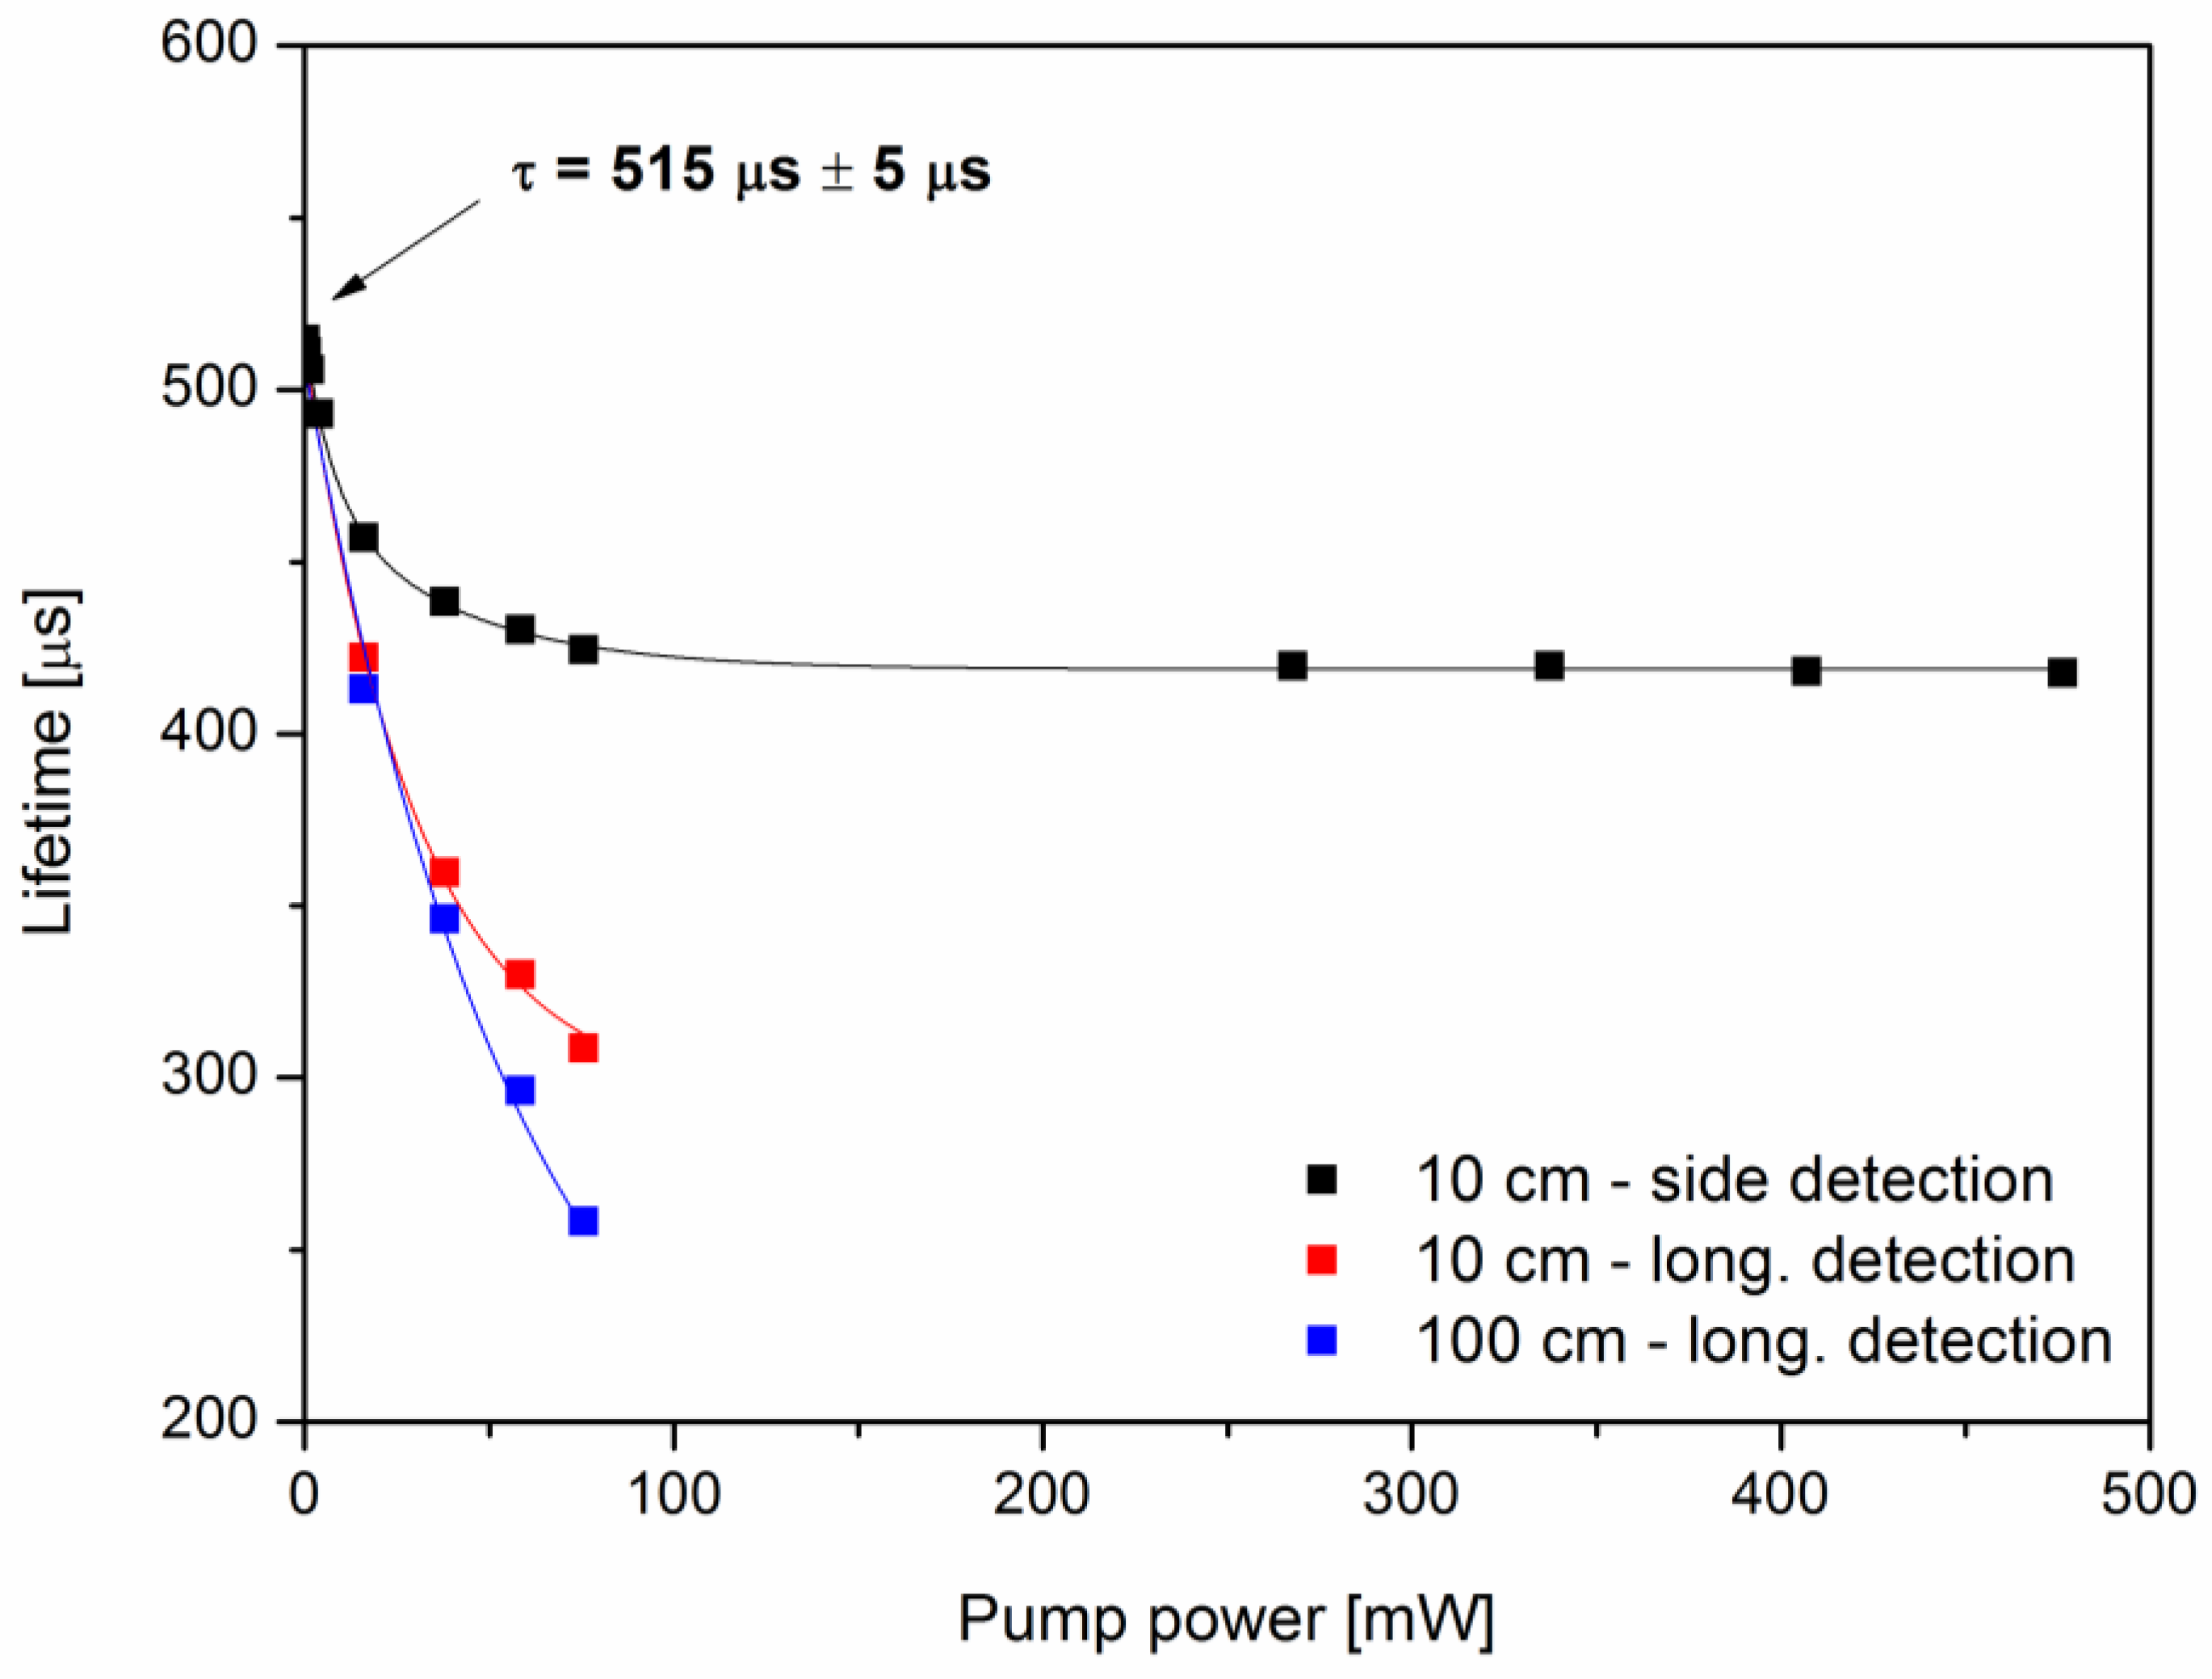
3.2. Fluorescence Lifetime and Energy-Transfer Coefficients
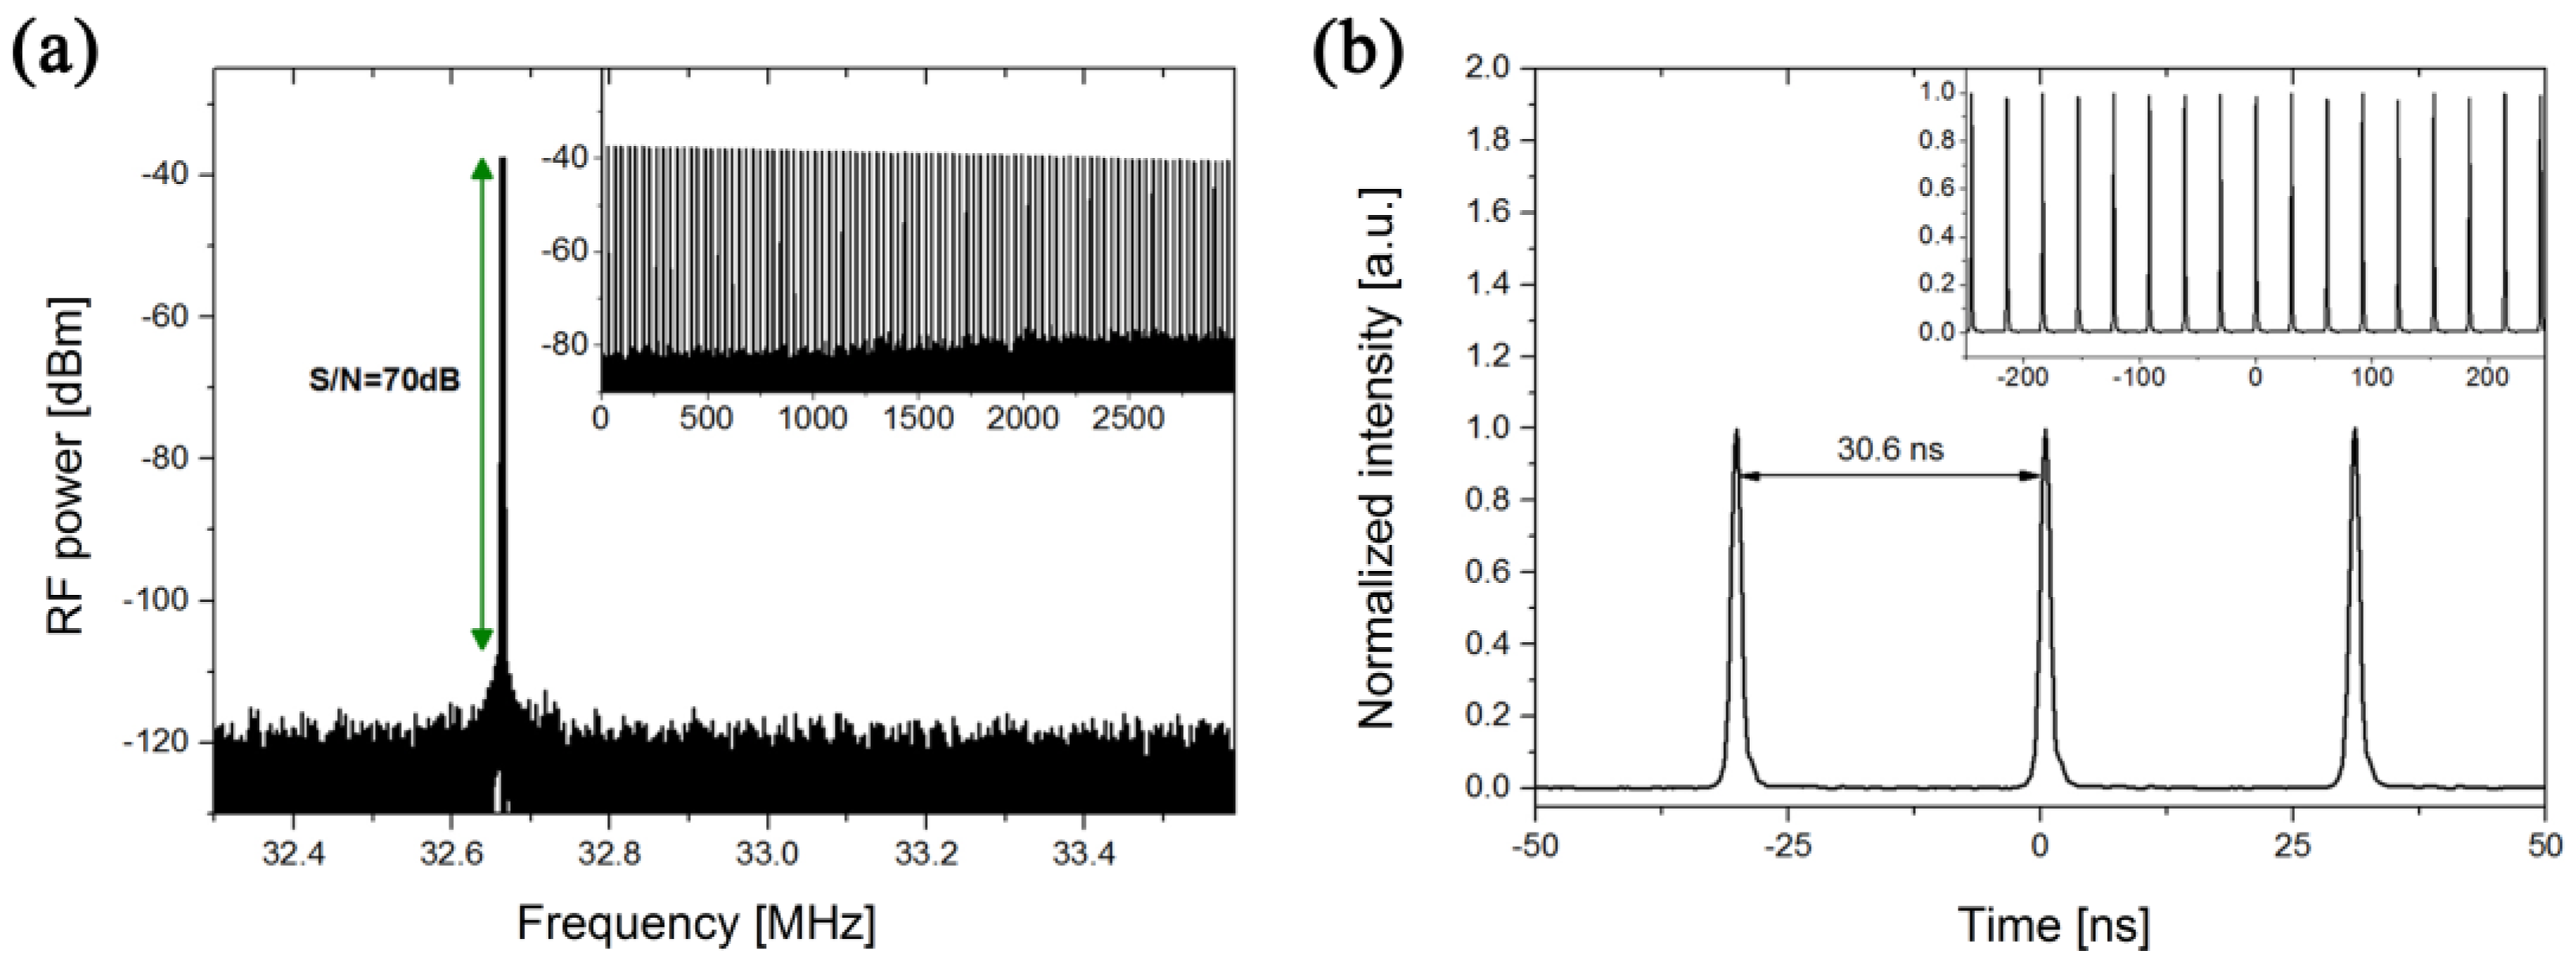
3.3. Laser Characteristics
4. Conclusions
Author Contributions
Funding
Acknowledgments
Conflicts of Interest
References
- Zervas, M.N.; Codemard, C.A. High Power Fiber Lasers: A Review. IEEE J. Sel. Top. Quantum Electron. 2014, 20, 219–241. [Google Scholar] [CrossRef]
- Digonnet, M.J.F. Rare Earth Doped Fiber Lasers and Amplifiers; Marcel Dekker: New York, NY, USA, 1993; p. 109. [Google Scholar]
- Hanna, D.C.; Percival, R.M.; Smart, R.G.; Tropper, A.C. Efficient and tunable operation of a Tm-doped fibre laser. Opt. Commun. 1990, 75, 283–286. [Google Scholar] [CrossRef]
- Jackson, S.D.; King, T.A. Theoretical modeling of Tm-doped silica fiber lasers. J. Lightwave Technol. 1999, 17, 948–956. [Google Scholar] [CrossRef]
- Walsh, B.M.; Barnes, N.P. Comparison of Tm:ZBLAN and Tm:silica fiber lasers; Spectroscopy and tunable pulsed laser operation around 1.9 μm. Appl. Phys. B 2004, 78, 325–333. [Google Scholar] [CrossRef]
- Simpson, D.A.; Gibbs, W.E.; Collins, S.F.; Blanc, W.; Dussardier, B.; Monnom, G.; Peterka, P.; Baxter, G.W. Visible and near infra-red up-conversion in Tm3+/Yb3+ co-doped silica fibers under 980 nm excitation. Opt. Express 2008, 16, 13781–13799. [Google Scholar] [CrossRef] [PubMed]
- Klimentov, D.; Dvoyrin, V.V.; Halder, A.; Paul, M.C.; Das, S.; Bhadra, S.K.; Sorokina, I.T. Emission decay and energy transfer in Yb/Tm Y-codoped fibers based on nano-modified glass. Opt. Mater. 2015, 42, 270–275. [Google Scholar] [CrossRef] [Green Version]
- Agger, S.D.; Povlsen, J.H. Emission and absorption cross section of thulium doped silica fibers. Opt. Express 2006, 14, 50–57. [Google Scholar] [CrossRef] [PubMed]
- Dennis, M.L.; Cole, B. Amplification Device Utilizing Thulium Doped Modified Silicate Optical Fiber. U.S. Patent 6,924,928 B2, 2 August 2005. [Google Scholar]
- Gebavi, H.; Taccheo, S.; Milanese, D. The enhanced two micron emission in thulium doped tellurite glasses. Opt. Mater. 2013, 35, 1792–1796. [Google Scholar] [CrossRef]
- Kasik, I.; Podrazky, O.; Mrazek, J.; Cajzl, J.; Aubrecht, J.; Probostova, J.; Peterka, P.; Honzatko, P.; Dhar, A. Erbium and Al2O3 nanocrystals-doped silica optical fibers. Bull. Pol. Acad. Sci.-Tech. Sci. 2014, 62, 641–646. [Google Scholar] [CrossRef]
- Podrazky, O.; Kasik, I.; Pospisilova, M.; Matejec, V. Use of alumina nanoparticles for preparation of erbium-doped fibers. In Proceedings of the 20th Annual Meeting of the IEEE Lasers and Electro-Optics Society (LEOS 2007), Lake Buena Vista, FL, USA, 21–25 October 2007; pp. 246–247. [Google Scholar]
- Blanc, W.; Dussardier, B.; Monnom, G.; Peretti, R.; Jurdyc, A.M.; Jacquier, B.; Foret, M.; Roberts, A. Erbium emission properties in nanostructured fibers. Appl. Opt. 2009, 48, G119–G124. [Google Scholar] [CrossRef] [PubMed]
- Baker, C.C.; Friebele, E.J.; Burdett, A.A.; Rhonehouse, D.L.; Fontana, J.; Kim, W.; Bowman, S.R.; Shaw, L.B.; Sanghera, J.; Zhang, J.; et al. Nanoparticle doping for high power fiber lasers at eye-safer wavelengths. Opt. Express 2017, 25, 13903–13915. [Google Scholar] [CrossRef] [PubMed] [Green Version]
- Dhar, A.; Kasik, I.; Podrazky, O.; Matejec, V.; Dussardier, B. Preparation and properties of Er-doped ZrO2 nanocrystalline phase-separated preforms of optical fibers by MCVD process. Int. J. Appl. Ceram. Technol. 2012, 9, 341–348. [Google Scholar] [CrossRef] [Green Version]
- Mrázek, J.; Kašík, I.; Procházková, L.; Čuba, V.; Girman, V.; Puchý, V.; Blanc, W.; Peterka, P.; Aubrecht, J.; Cajzl, J.; et al. YAG Ceramic Nanocrystals Implementation into MCVD Technology of Active Optical Fibers. Appl. Sci. 2018, 8, 833. [Google Scholar] [CrossRef]
- Cajzl, J.; Peterka, P.; Honzátko, P.; Mrázek, J.; Podrazký, O.; Todorov, F.; Gladkov, P.; Sahu, J.K.; Nunez-Velazquez, M.; Nekvindová, P.; et al. Characterization of fluorescence lifetime of Tm-doped fibers with increased quantum conversion efficiency. Proc. SPIE 2015, 9450, 945017. [Google Scholar]
- Peterka, P.; Honzátko, P.; Kašík, I.; Cajzl, J.; Podrazký, O. Thulium-doped optical fibers and components for fiber lasers in 2 µm spectral range. Proc. SPIE 2014, 9441, 94410B. [Google Scholar] [CrossRef]
- Pisarik, M.; Peterka, P.; Zvanovec, S.; Baravets, Y.; Todorov, F.; Kasik, I.; Honzatko, P. Fused fiber components for “eye-safe” spectral region around 2 μm. Opt. Quantum Electron. 2014, 46, 603–611. [Google Scholar] [CrossRef]
- Sobon, G. Mode-locking of fiber lasers using novel two-dimensional nanomaterials: Graphene and topological insulators [invited]. Photonics Res. 2015, 3, A56–A63. [Google Scholar] [CrossRef]
- Krajewska, A.; Pasternak, I.; Sobon, G.; Sotor, J.; Przewloka, A.; Ciuk, T.; Sobieski, J.; Grzonka, J.; Abramski, K.M.; Strupinski, W. Fabrication and applications of multi-layer graphene stack on transparent polymer. Appl. Phys. Lett. 2017, 110, 041901. [Google Scholar] [CrossRef]
- Sobon, G.; Sotor, J.; Pasternak, I.; Krajewska, A.; Strupinski, W.; Abramski, K. All-polarization maintaining, graphene-based femtosecond Tm-doped all-fiber laser. Opt. Express 2015, 23, 9339–9346. [Google Scholar] [CrossRef] [PubMed]
- Cajzl, J.; Peterka, P.; Honzátko, P.; Podrazký, O.; Kamrádek, M.; Aubrecht, J.; Proboštová, J.; Kašík, I. Evaluation of energy transfer coefficients in Tm doped fibers for fiber lasers. Proc. SPIE 2017, 10603. [Google Scholar] [CrossRef]
- Eichhorn, M. Numerical Modeling of Tm-Doped Double-Clad Fluoride Fiber Amplifiers. IEEE J. Quantum Electron. 2005, 41, 1574–1581. [Google Scholar] [CrossRef]
- Peterka, P.; Kasik, I.; Dhar, A.; Dussardier, B.; Blanc, W. Theoretical modeling of fiber laser at 810 nm based on thulium-doped silica fibers with enhanced 3H4 level lifetime. Opt. Express 2011, 19, 2773–2781. [Google Scholar] [CrossRef] [PubMed]
- Chen, G.X.; Zhang, Q.Y.; Yang, G.F.; Jiang, Z.H. Mid-Infrared Emission Characteristic and Energy Transfer of Ho3+-Doped Tellurite Glass Sensitized by Tm3+. J. Fluoresc. 2007, 17, 301–307. [Google Scholar] [CrossRef] [PubMed]
- de Camargo, A.S.S.; de Oliveira, S.L.; de Sousa, D.F.; Nunes, L.A.O.; Hewak, D.W. Spectroscopic properties and energy transfer parameters of Tm3+ ions in gallium lanthanum sulfide glass. J. Phys. Condens. Matter 2002, 14, 9495–9505. [Google Scholar] [CrossRef]
- Taher, M.; Gebavi, H.; Taccheo, S.; Milanese, D.; Balda, R. Novel approach towards cross-relaxation energy transfer calculation applied on highly thulium doped tellurite glasses. Opt. Express 2011, 19, 26269–26274. [Google Scholar] [CrossRef] [PubMed]
- Peterka, P.; Honzatko, P.; Becker, M.; Todorov, F.; Pisarik, M.; Podrazky, O.; Kasik, I. Monolithic Tm-doped fiber laser at 1951 nm with deep-UV femtosecond-induced FBG pair. IEEE Photonics Technol. Lett. 2013, 25, 1623–1625. [Google Scholar] [CrossRef]
- Faure, B.; Blanc, W.; Dussardier, B.; Monnom, G. Improvement of the Tm3+:3H4 level lifetime in silica optical fibers by lowering the local phonon energy. J. Non-Cryst. Solids 2007, 353, 2767–2773. [Google Scholar] [CrossRef] [Green Version]
- Blanc, W.; Sebastian, T.L.; Dussardier, B.; Michel, C.; Faure, B.; Ude, M.; Monnom, G. Thulium environment in a silica doped optical fibre. J. Non-Cryst. Solids 2008, 354, 435–439. [Google Scholar] [CrossRef] [Green Version]
- Dussardier, B.; Blanc, W.; Peterka, P. Tailoring of the local environment of active ions in rare-earth- and transition-metal-doped optical fibres, and potential applications. In Selected Topics on Optical Fiber Technology; Yasin, M., Harun, S.W., Arof, H., Eds.; InTech: Rijeka, Croatia, 2012. [Google Scholar]
- Dennis, M.L.; Duling, I.N., III. Experimental study of sideband generation in femtosecond fiber lasers. IEEE J. Quantum Electron. 1994, 30, 1469. [Google Scholar] [CrossRef]
- Smith, N.J.; Blow, K.J.; Andonovic, I. Sideband generation through perturbations to the average soliton model. IEEE J. Lightwave Technol. 1992, 10, 1329. [Google Scholar] [CrossRef]
- Nilsson, J.; Clarkson, W.A.; Selvas, R.; Sahu, J.K.; Turner, P.W.; Alam, S.-U.; Grudinin, A.B. High-power wavelength-tunable cladding-pumped rare-earth-doped silica fiber lasers. Opt. Fiber Technol. 2008, 10, 5–30. [Google Scholar] [CrossRef]


| Fiber No. | Preparation SD/NP * | Matrix | Δn (∙10−3) | Cutoff LP11 (nm) | Al2O3 (mol.%) | GeO2 (mol.%) | Tm3+ (ppm) AVG | Fluorescence Lifetime (μs) |
|---|---|---|---|---|---|---|---|---|
| SG1365 | SD | Tm-Si | 3.5 | 880 | 0 | 0 | 70 | 220 |
| SG1364 ** | SD | Tm-Si-P | 7 | 1050 | 0 | 0 | 5150 | 62 |
| SG1401 | SD | Tm-Si-Al | 2 | 1900 | 0.33 | 0 | 1740 | 323 |
| SG1360A | SD | Tm-Si-Al | 8 | 1560 | 4.8 | 0 | 2000 | 542 |
| SG1201R | NP | Tm-Si-Al | 27 | 1520 | 11.7 | 0 | 1000 | 756 |
| SG1338A | SD | Tm-Si-Al-Ge | 7 | >1600 | 3.4 | 0.6 | 1280 | 488 |
| SG1338B | NP | Tm-Si-Al-Ge | 7 | >1600 | 4.2 | 0.1 | 650 | 500 |
| SG1283 | SD | Tm-Si-Al-Ge | 9.5 | MM | 4.1 | 1.4 | 1140 | 495 |
| SG1290 | SD | Tm-Si-Al-Ge | 10 | 1500 | 4.5 | 2 | 3000 | 515 |
| SG1361A | SD | Tm-Si-Al-Ge | 7.5 | 1020 | 6 | 7 | 1590 | 500 |
| Fiber Label (No.) | Preparation Details |
|---|---|
| SD (SG1290) | Conventional solution doping from solution of 1 mol L−1 AlCl3 and 0.04 mol L−1 TmCl3·6H2O |
| Fiber | C (Tm3+) (·1025 m−3) | τ (3F4) Low (μs) | τ (3F4) High (μs) | τ (3H4) (μs) | τ (3H4) lowC (μs) | k3011 (·10−22 m3/s) | k1130 (·10−24 m3/s) |
|---|---|---|---|---|---|---|---|
| SD (SG1290) | 6.375 | 515 | 420 | 30 | 58 | 2.52 | 3.44 |
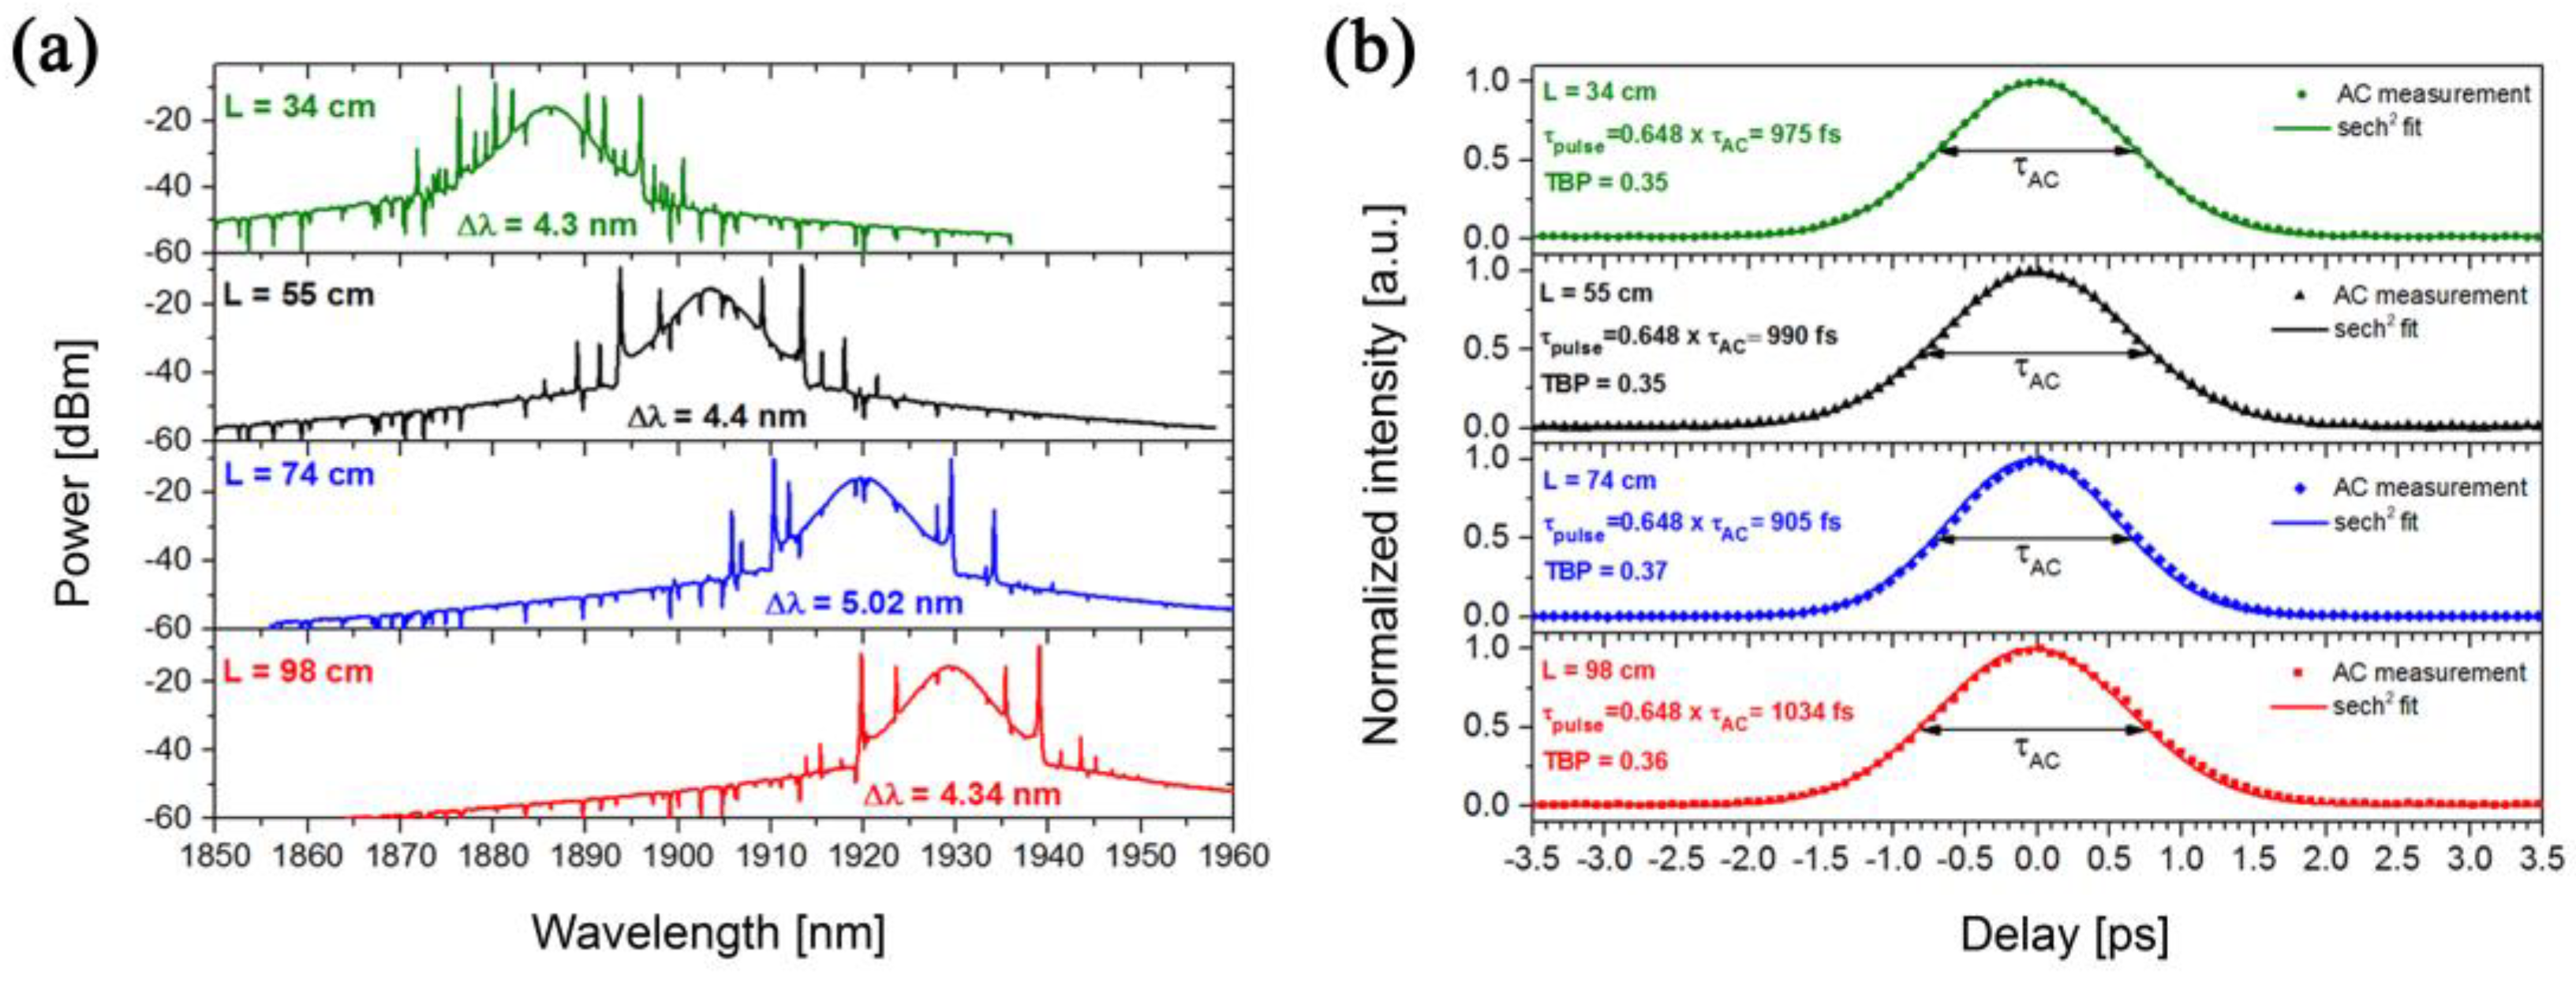
| Tm-Fiber Length (cm) | Pth a (mW) | Ppump_max b (mW) | S/N c (dB) | FWHM d (nm) | λc e (nm) | Pavg f (mW) | E g (pJ) | τ h (fs) | TBP i |
|---|---|---|---|---|---|---|---|---|---|
| 34 | 224 | 242 | 71 | 4.3 | 1886 | 7.3 | 223 | 975 | 0.35 |
| 55 | 196 | 290 | 70 | 4.4 | 1903.5 | 7.8 | 238 | 990 | 0.35 |
| 74 | 208 | 290 | 69 | 5.02 | 1919.8 | 8 | 244 | 905 | 0.37 |
| 98 | 210 | 255 | 70 | 4.34 | 1929.3 | 7.5 | 229 | 1034 | 0.36 |
© 2018 by the authors. Licensee MDPI, Basel, Switzerland. This article is an open access article distributed under the terms and conditions of the Creative Commons Attribution (CC BY) license (http://creativecommons.org/licenses/by/4.0/).
Share and Cite
Cajzl, J.; Peterka, P.; Kowalczyk, M.; Tarka, J.; Sobon, G.; Sotor, J.; Aubrecht, J.; Honzátko, P.; Kašík, I. Thulium-Doped Silica Fibers with Enhanced Fluorescence Lifetime and Their Application in Ultrafast Fiber Lasers. Fibers 2018, 6, 66. https://doi.org/10.3390/fib6030066
Cajzl J, Peterka P, Kowalczyk M, Tarka J, Sobon G, Sotor J, Aubrecht J, Honzátko P, Kašík I. Thulium-Doped Silica Fibers with Enhanced Fluorescence Lifetime and Their Application in Ultrafast Fiber Lasers. Fibers. 2018; 6(3):66. https://doi.org/10.3390/fib6030066
Chicago/Turabian StyleCajzl, Jakub, Pavel Peterka, Maciej Kowalczyk, Jan Tarka, Grzegorz Sobon, Jaroslaw Sotor, Jan Aubrecht, Pavel Honzátko, and Ivan Kašík. 2018. "Thulium-Doped Silica Fibers with Enhanced Fluorescence Lifetime and Their Application in Ultrafast Fiber Lasers" Fibers 6, no. 3: 66. https://doi.org/10.3390/fib6030066
APA StyleCajzl, J., Peterka, P., Kowalczyk, M., Tarka, J., Sobon, G., Sotor, J., Aubrecht, J., Honzátko, P., & Kašík, I. (2018). Thulium-Doped Silica Fibers with Enhanced Fluorescence Lifetime and Their Application in Ultrafast Fiber Lasers. Fibers, 6(3), 66. https://doi.org/10.3390/fib6030066