Shrinkage Cracking of Concrete Slabs-On-Grade: A Numerical Parametric Study


Abstract
:1. Introduction
2. Slab Geometry and Investigated Parameters
- Slab dimensions;
- Subgrade properties;
- Material properties;
- Shrinkage development.
2.1. Slab Dimensions
- 20 × 20 m;
- 30 × 30 m.
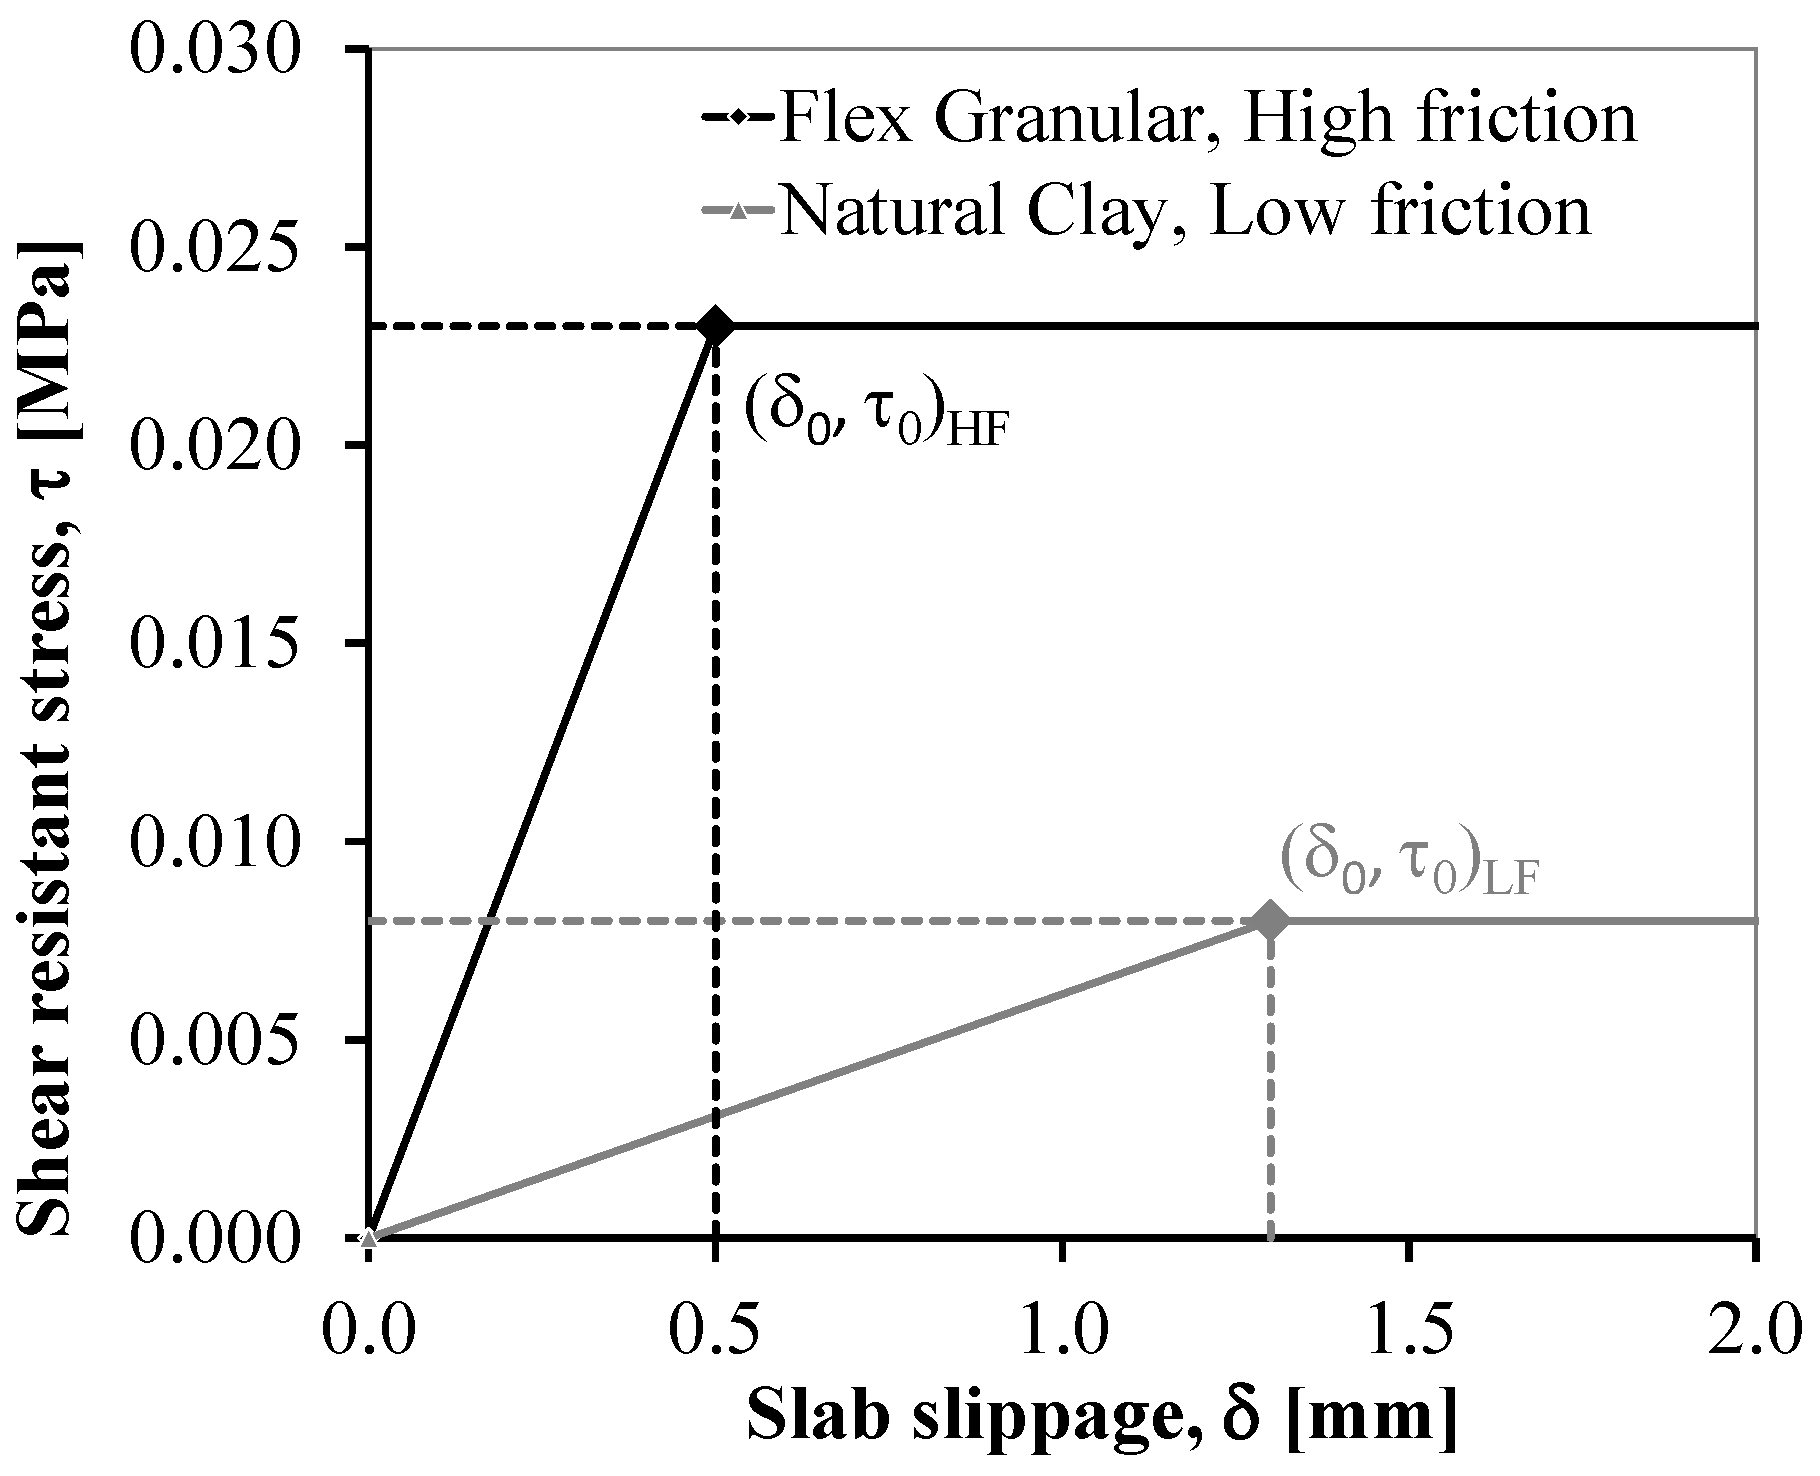
2.2. Subgrade Properties
2.3. Material Properties
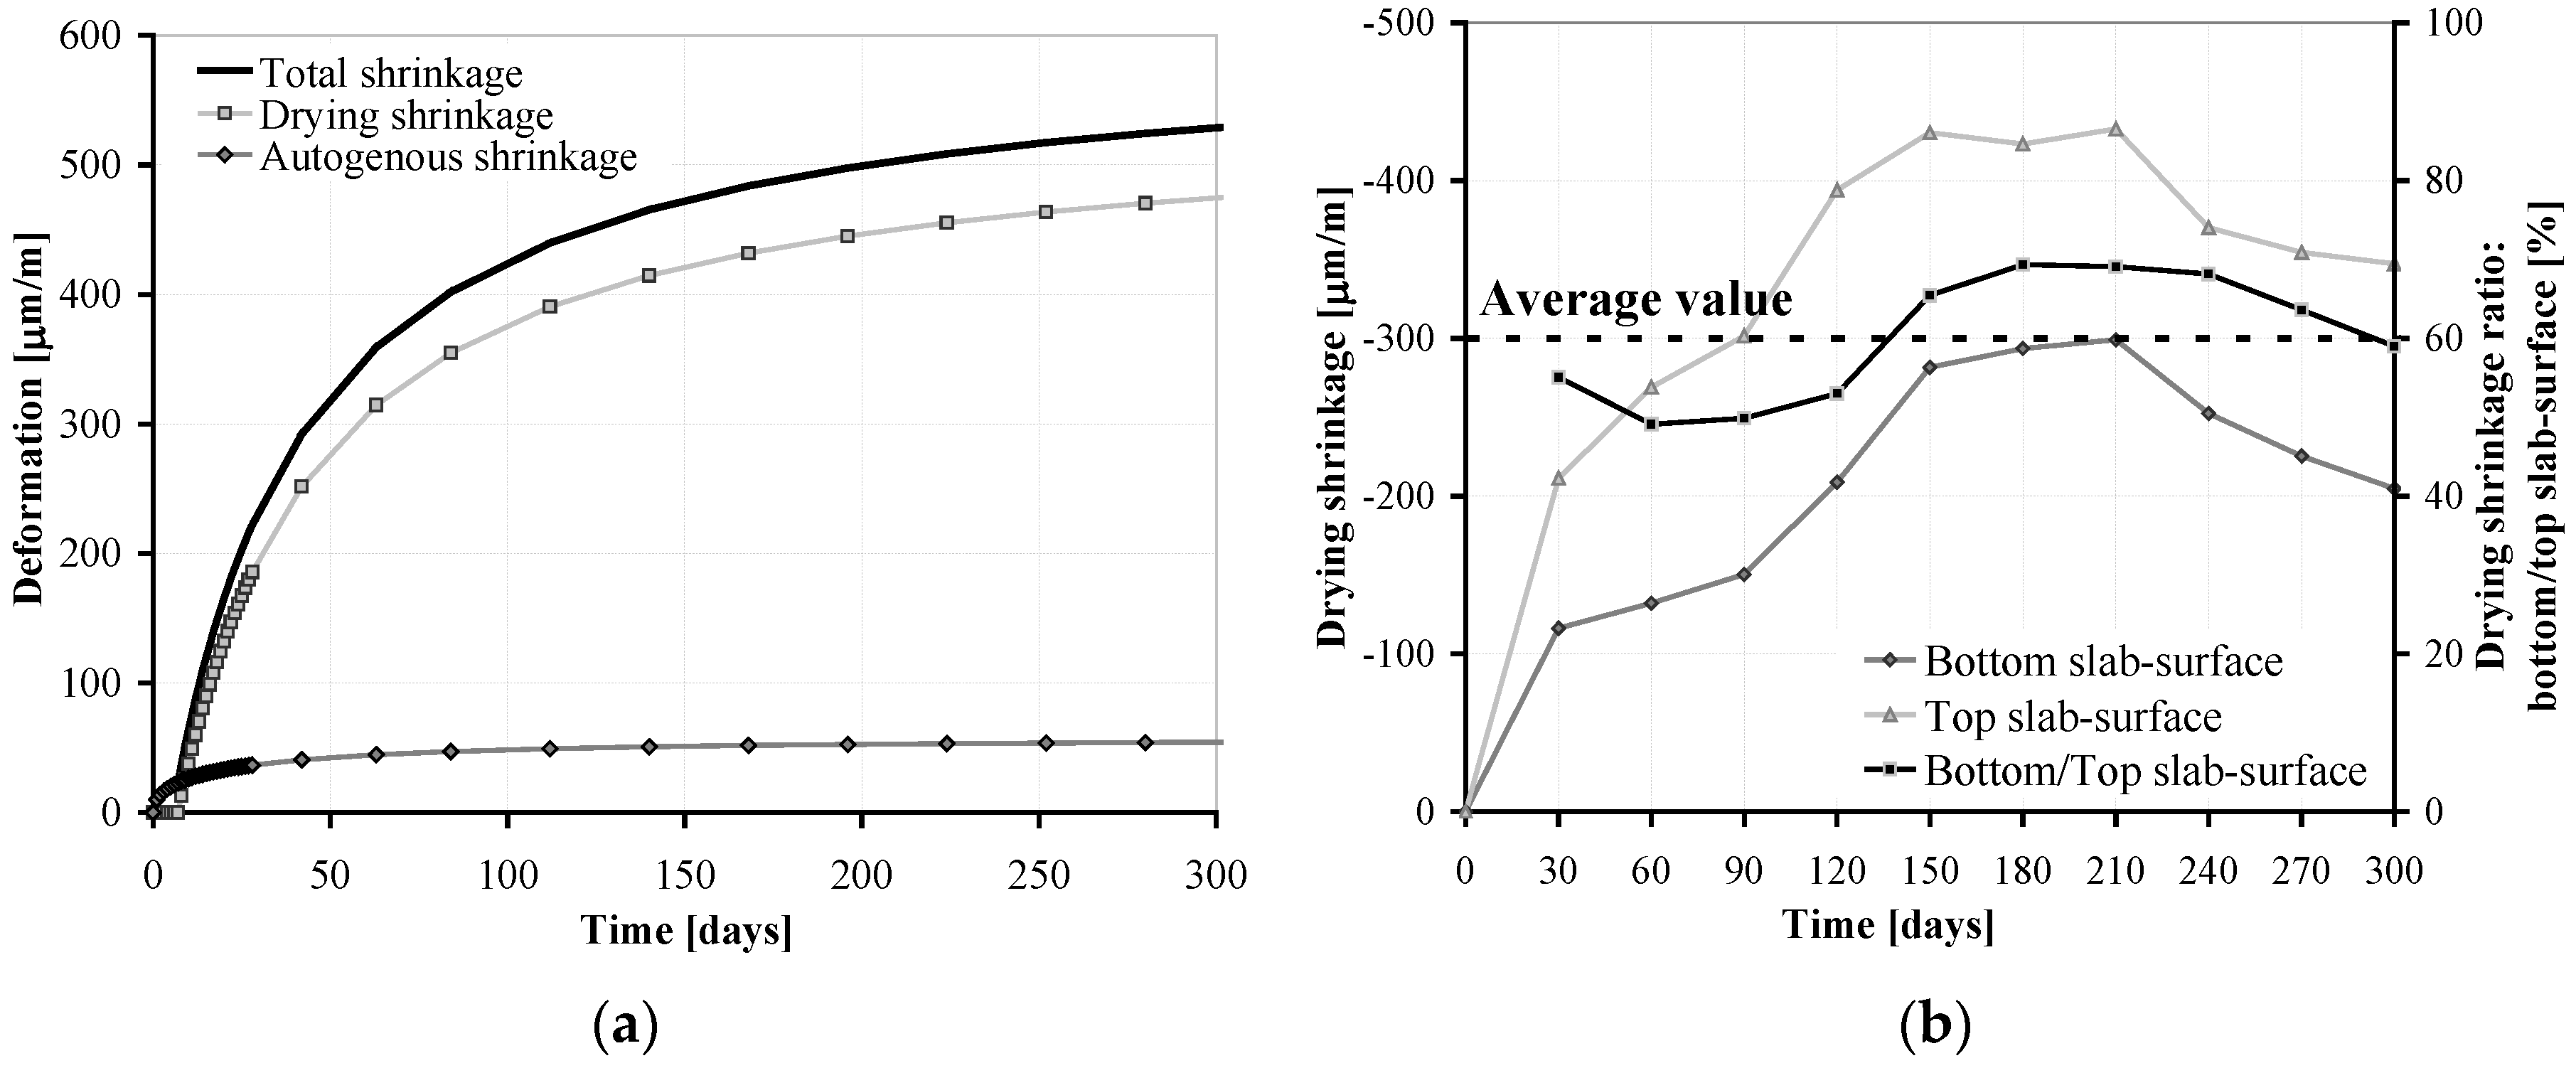
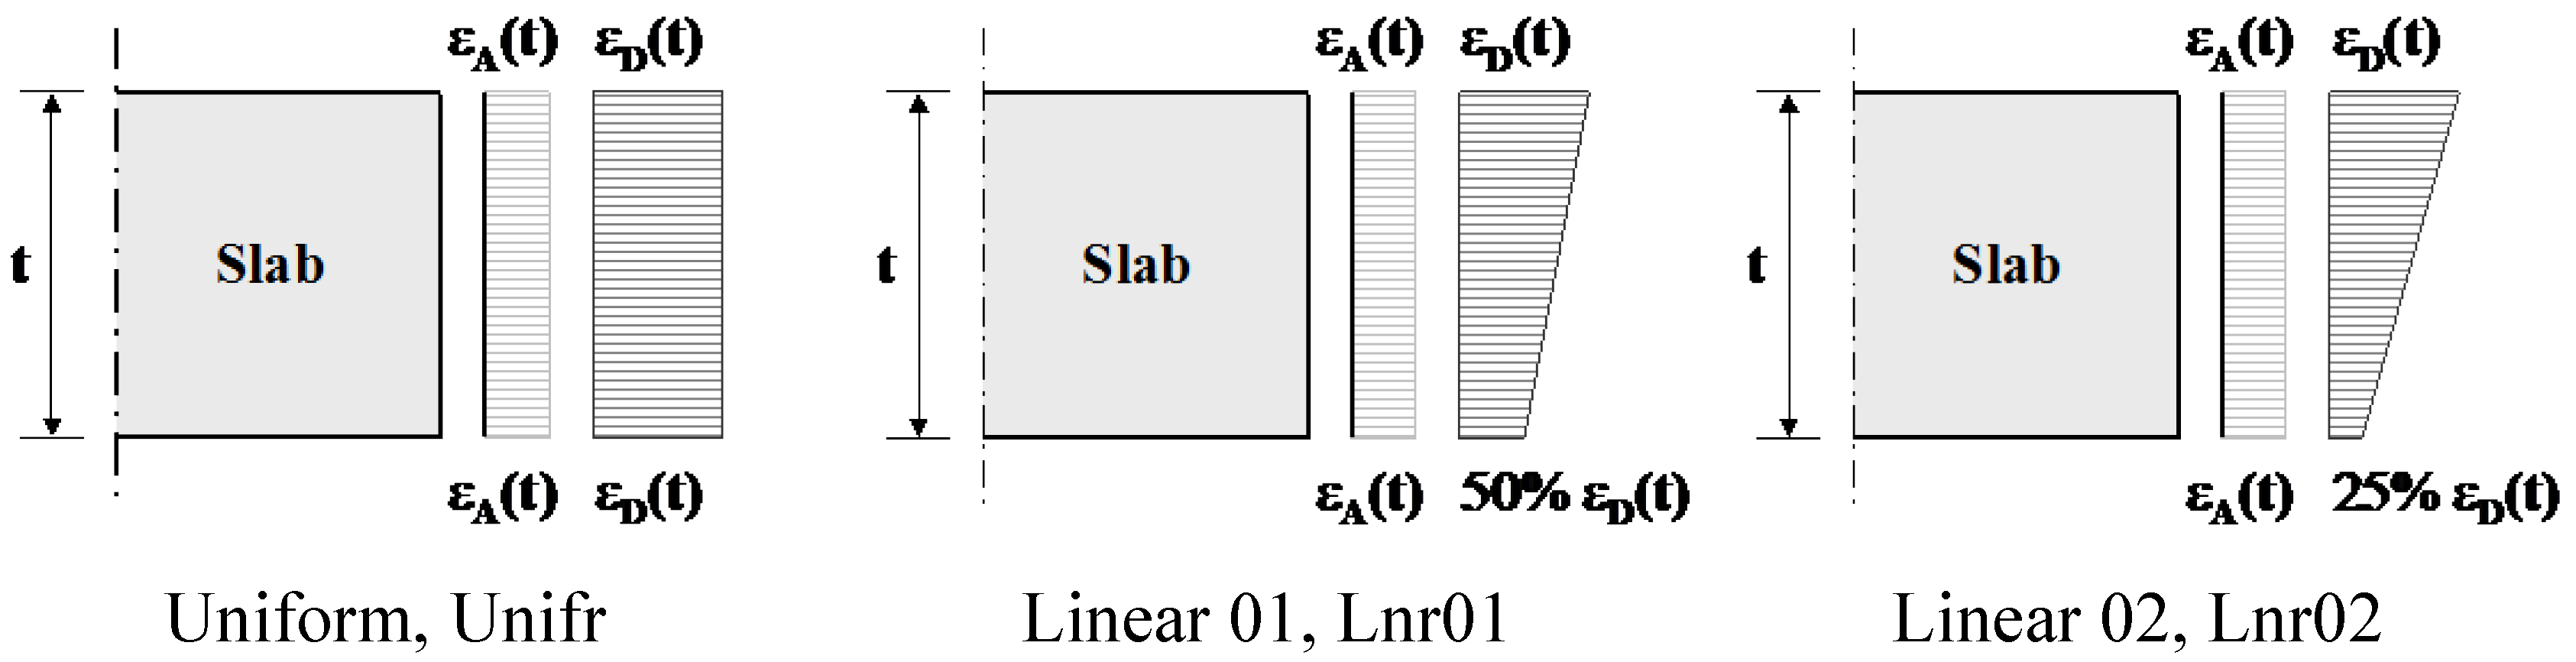
2.4. Shrinkage Development
- conventional notional sizes (h0) equal to 100 mm;
- ambient relative humidity of 65%;
- curing time equal to 7 days;
- cement class R [29].
3. Numerical Modeling
3.1. Numerical Modeling of Materials
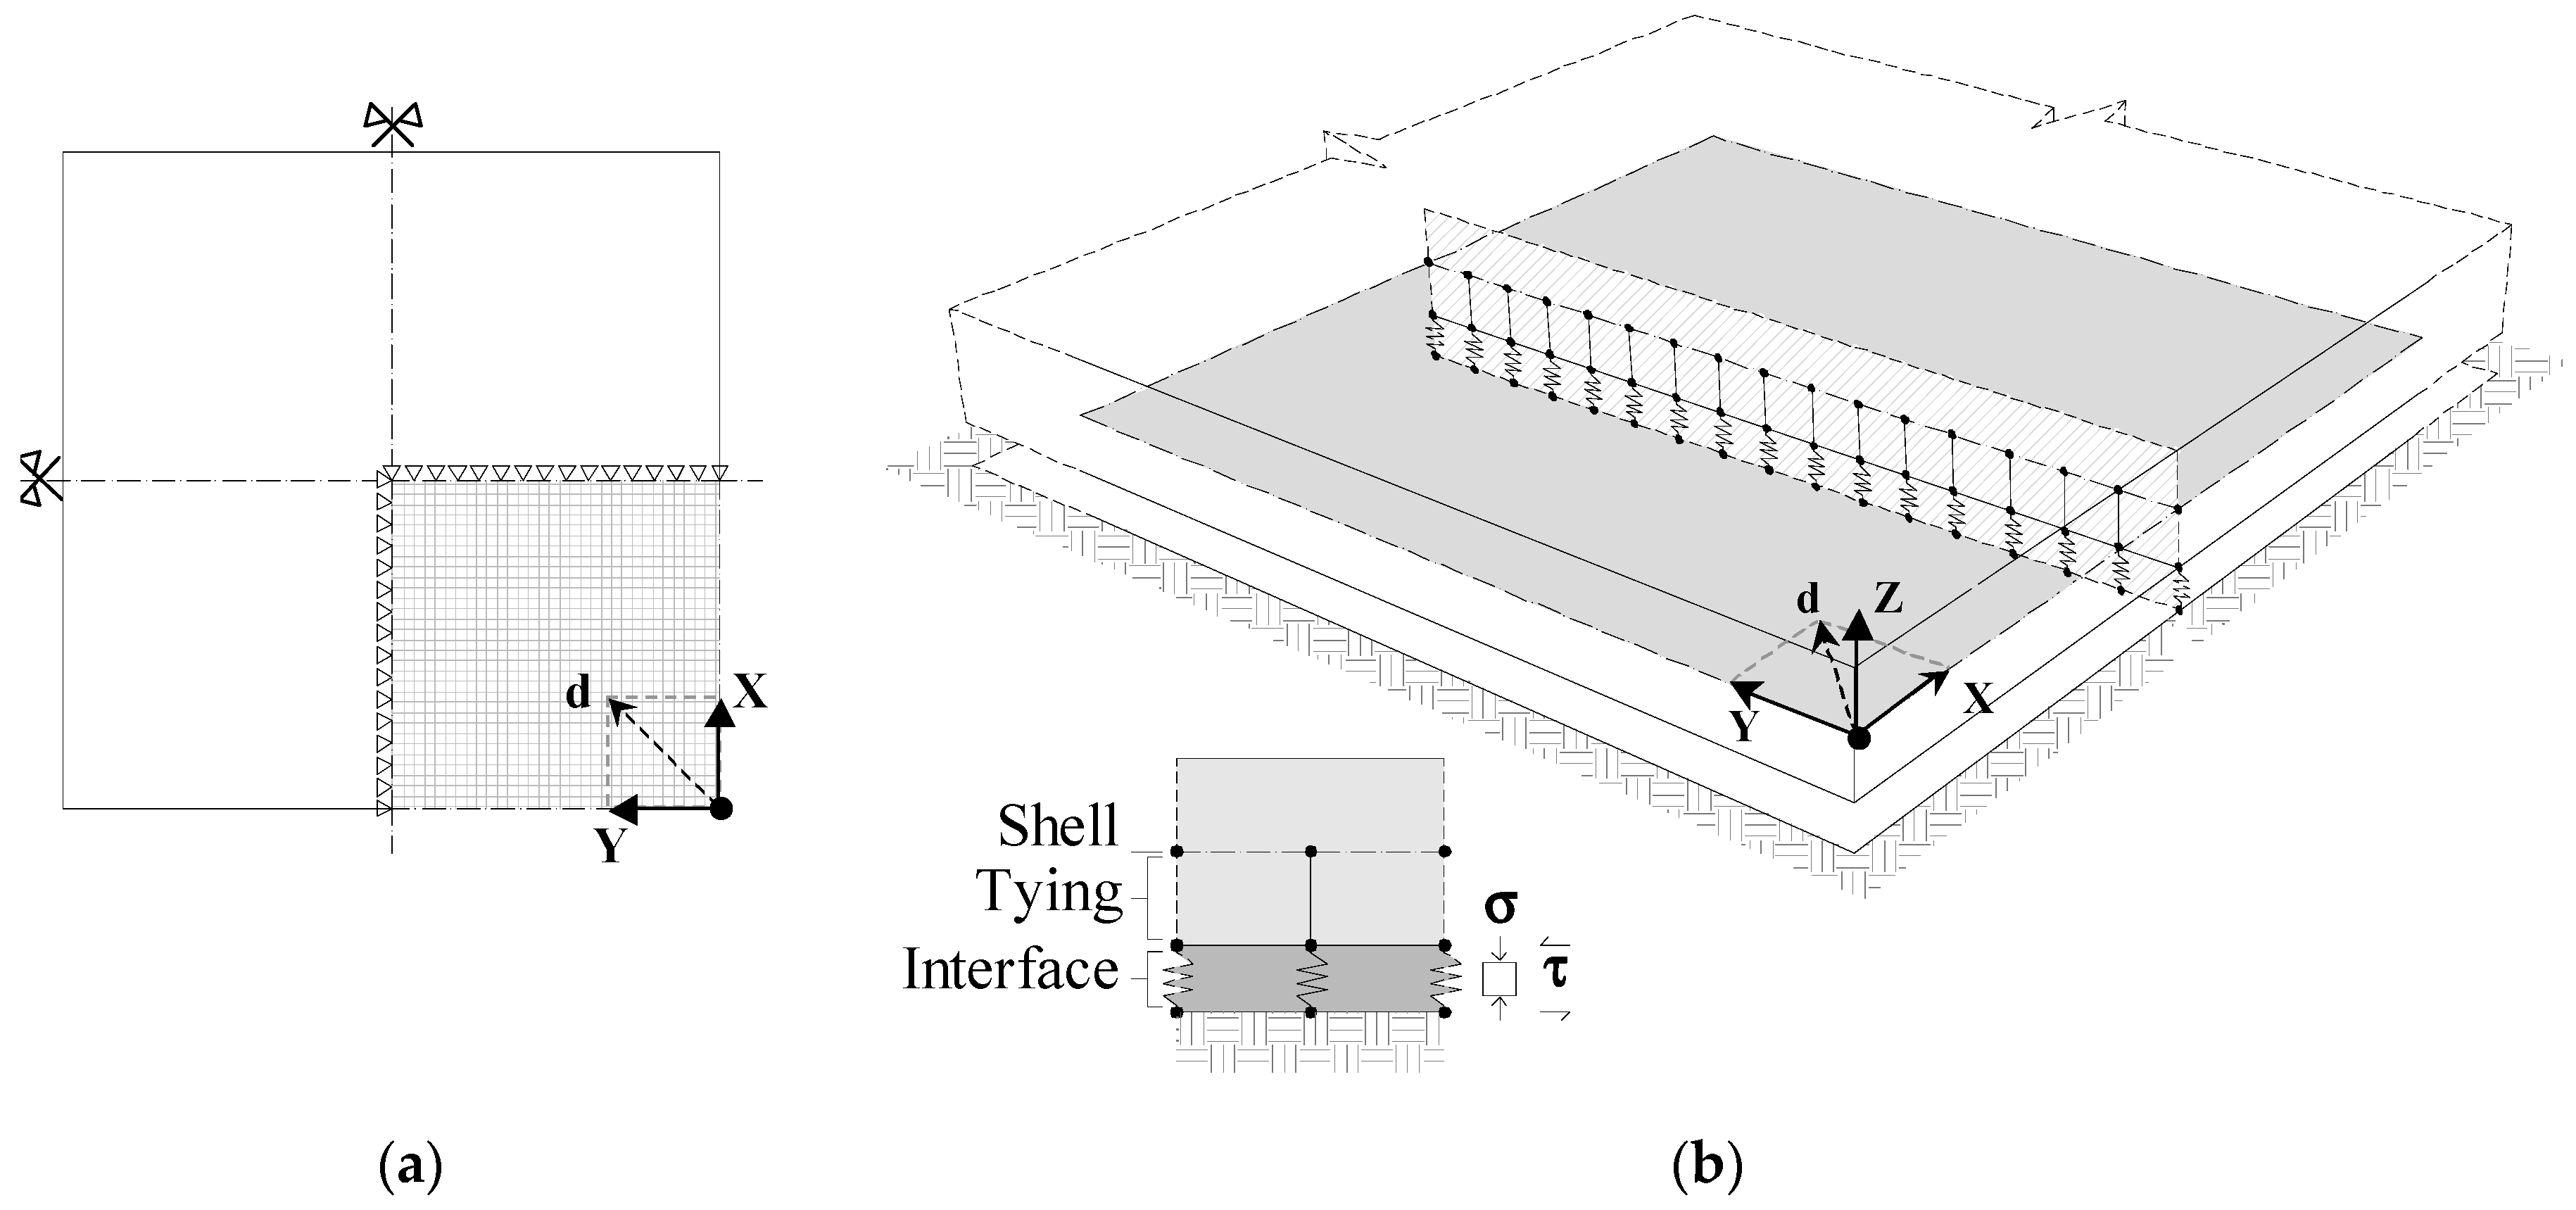
3.2. Slab-On-Grade Numerical Model
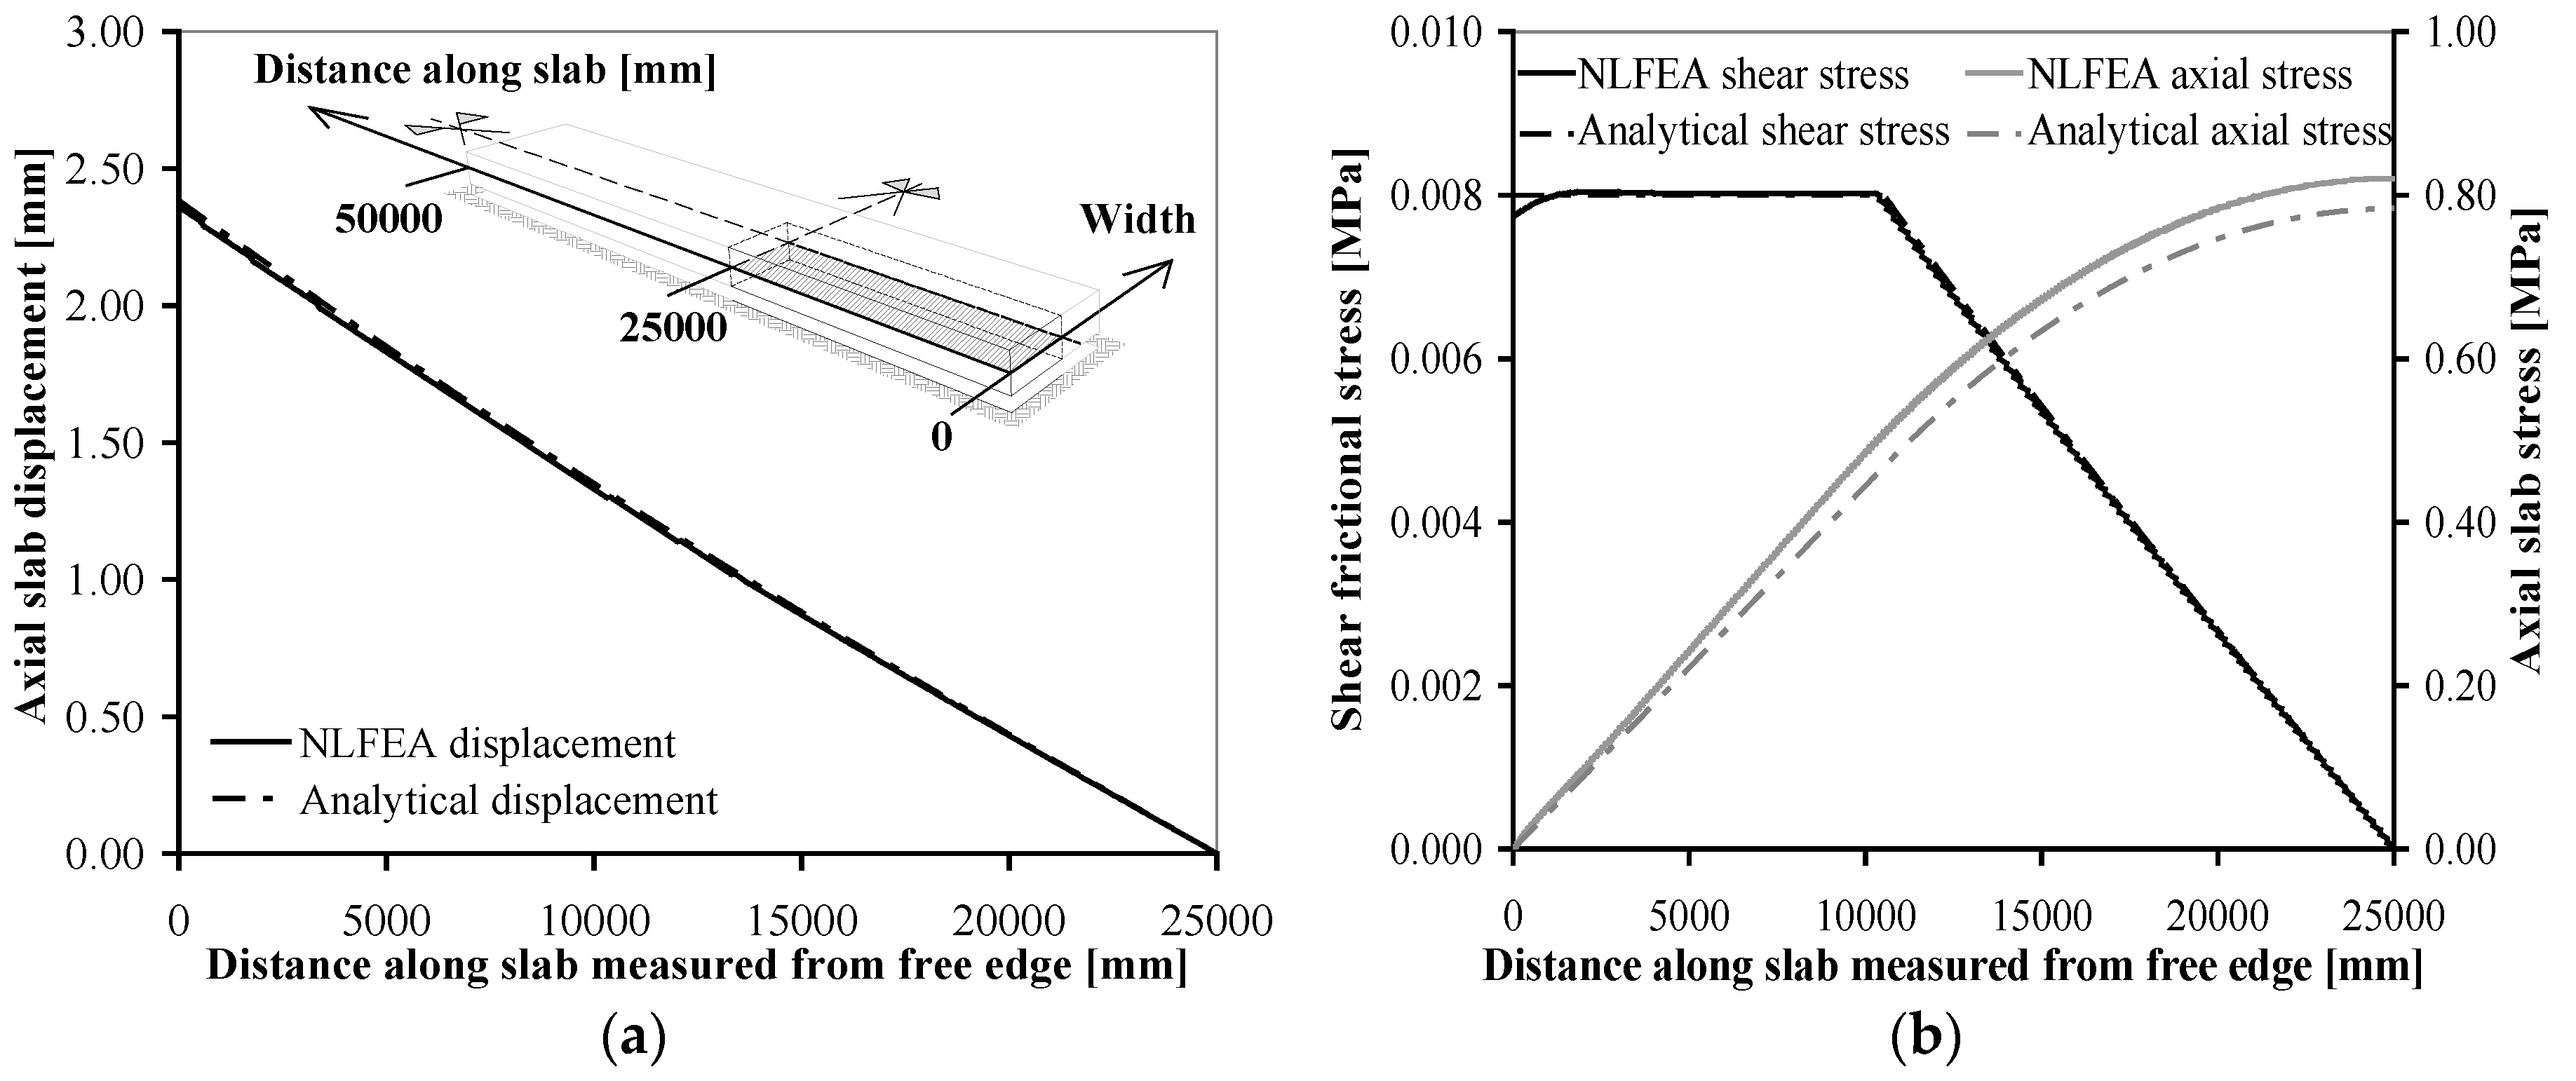
3.3. Validation of the Proposed Numerical Model
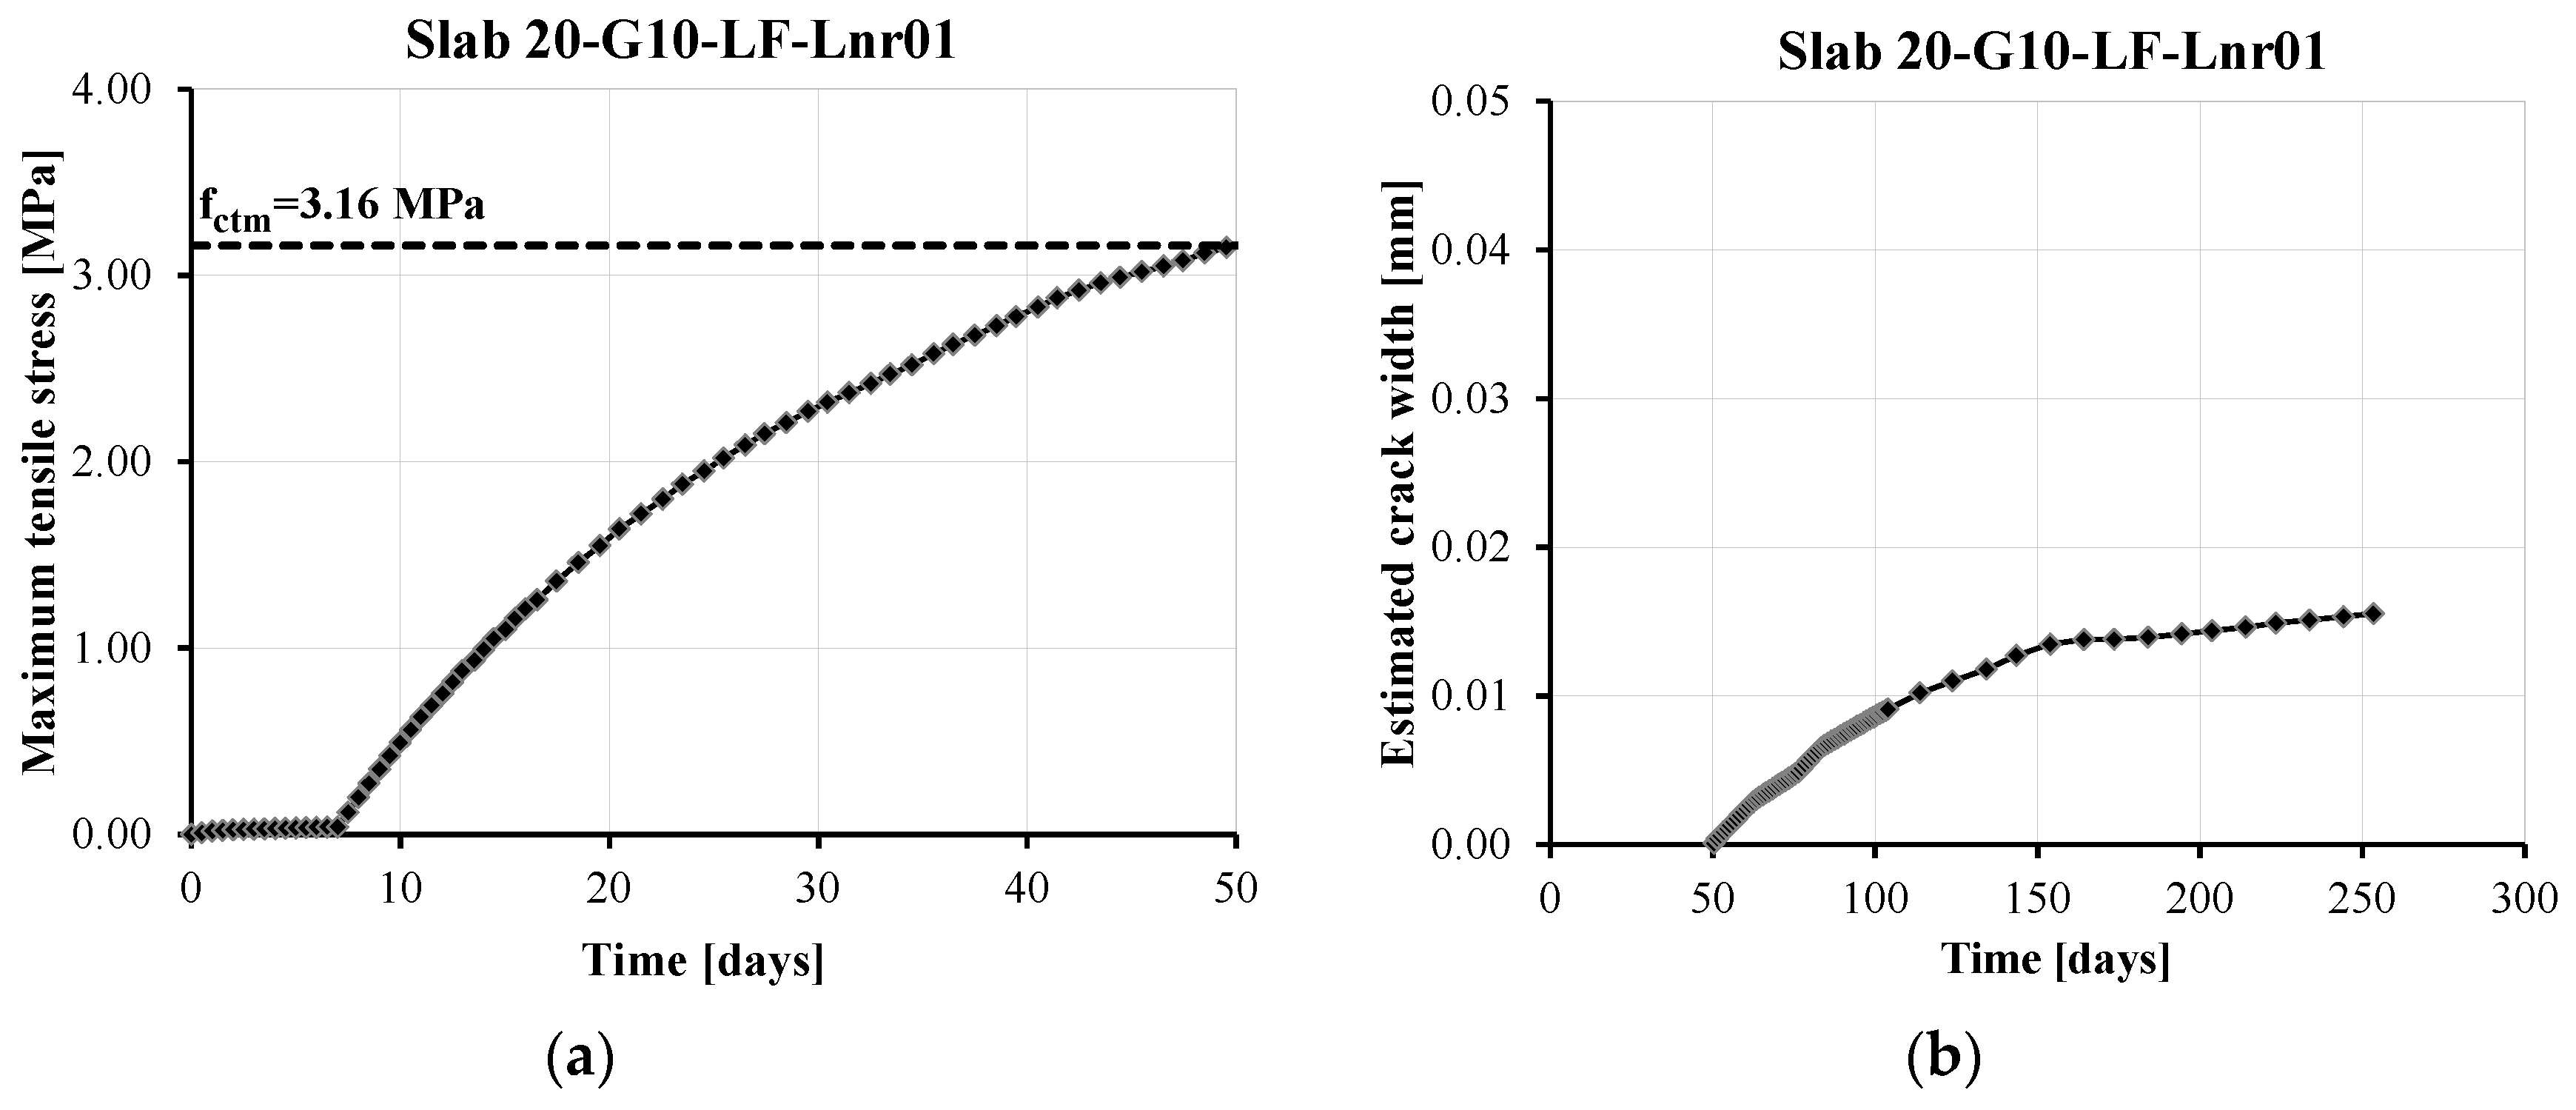
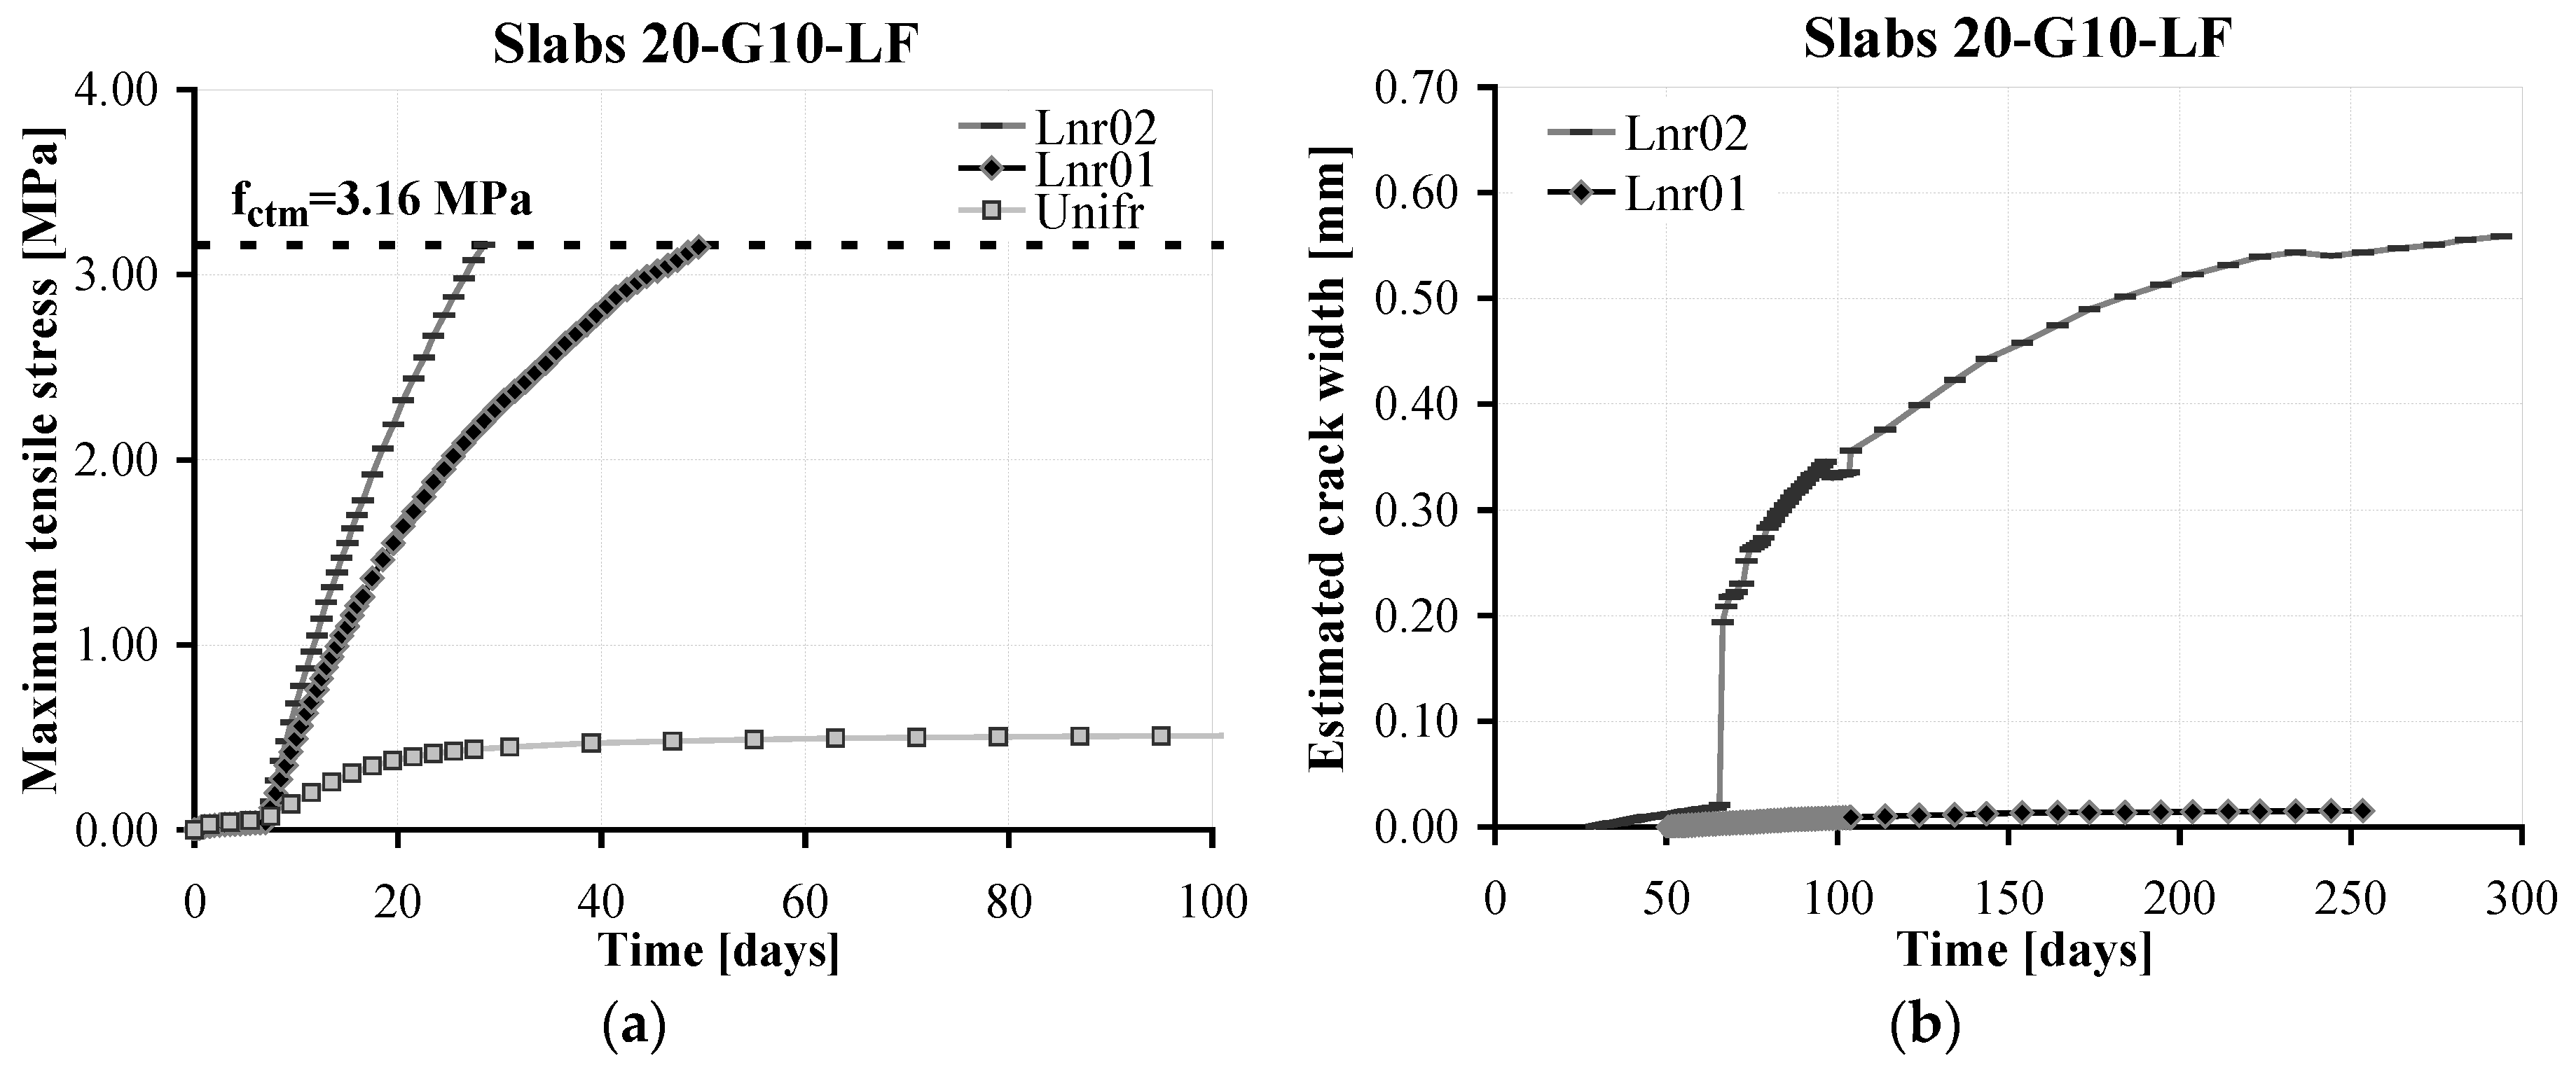
4. Numerical Results
5. Conclusions
- The proposed relatively simple numerical model is able to provide a reliable prediction about the effects of shrinkage phenomena on jointless pavement, since it is based on a suitable application of interface elements for taking into account friction stresses arising between slab and subbase;
- The slabs-on-grade behavior under shrinkage development is mainly governed by the interfacial friction between the slab and the supporting base. If the subgrade surface is not adequately prepared and a high friction is expected, it is recommended to limit the distance between construction joints and to use FRC with adequate toughness;
- With a very high shrinkage gradient along the slab thickness, a higher risk of cracking was observed in all the slabs investigated, leading to generally higher final crack widths as well as higher curling upward deflections;
- In case of very low variation of moisture demand through the thickness of the jointless pavement the risk of cracking considerably decreases. Nevertheless, since the behavior of the slab is governed by its axial shortening, a strong influence of the frictional properties of the subgrade on the maximum tensile stresses, was evidenced;
- This parametric numerical study represents a useful tool that can be adopted for preliminary estimating cracking behavior of jointless pavements under shrinkage phenomena. This is important since in practice the latter is generally not directly considered in the design process, which is mainly focused only on the effects on pavements of the applied external loads.
Author Contributions
Funding
Acknowledgments
Conflicts of Interest
Notation List
| Ec | concrete elastic modulus; |
| fcm | mean cylindrical compressive concrete strength; |
| fcm,cube | mean cubic compressive concrete strength; |
| fck | characteristic cylindrical compressive concrete strength; |
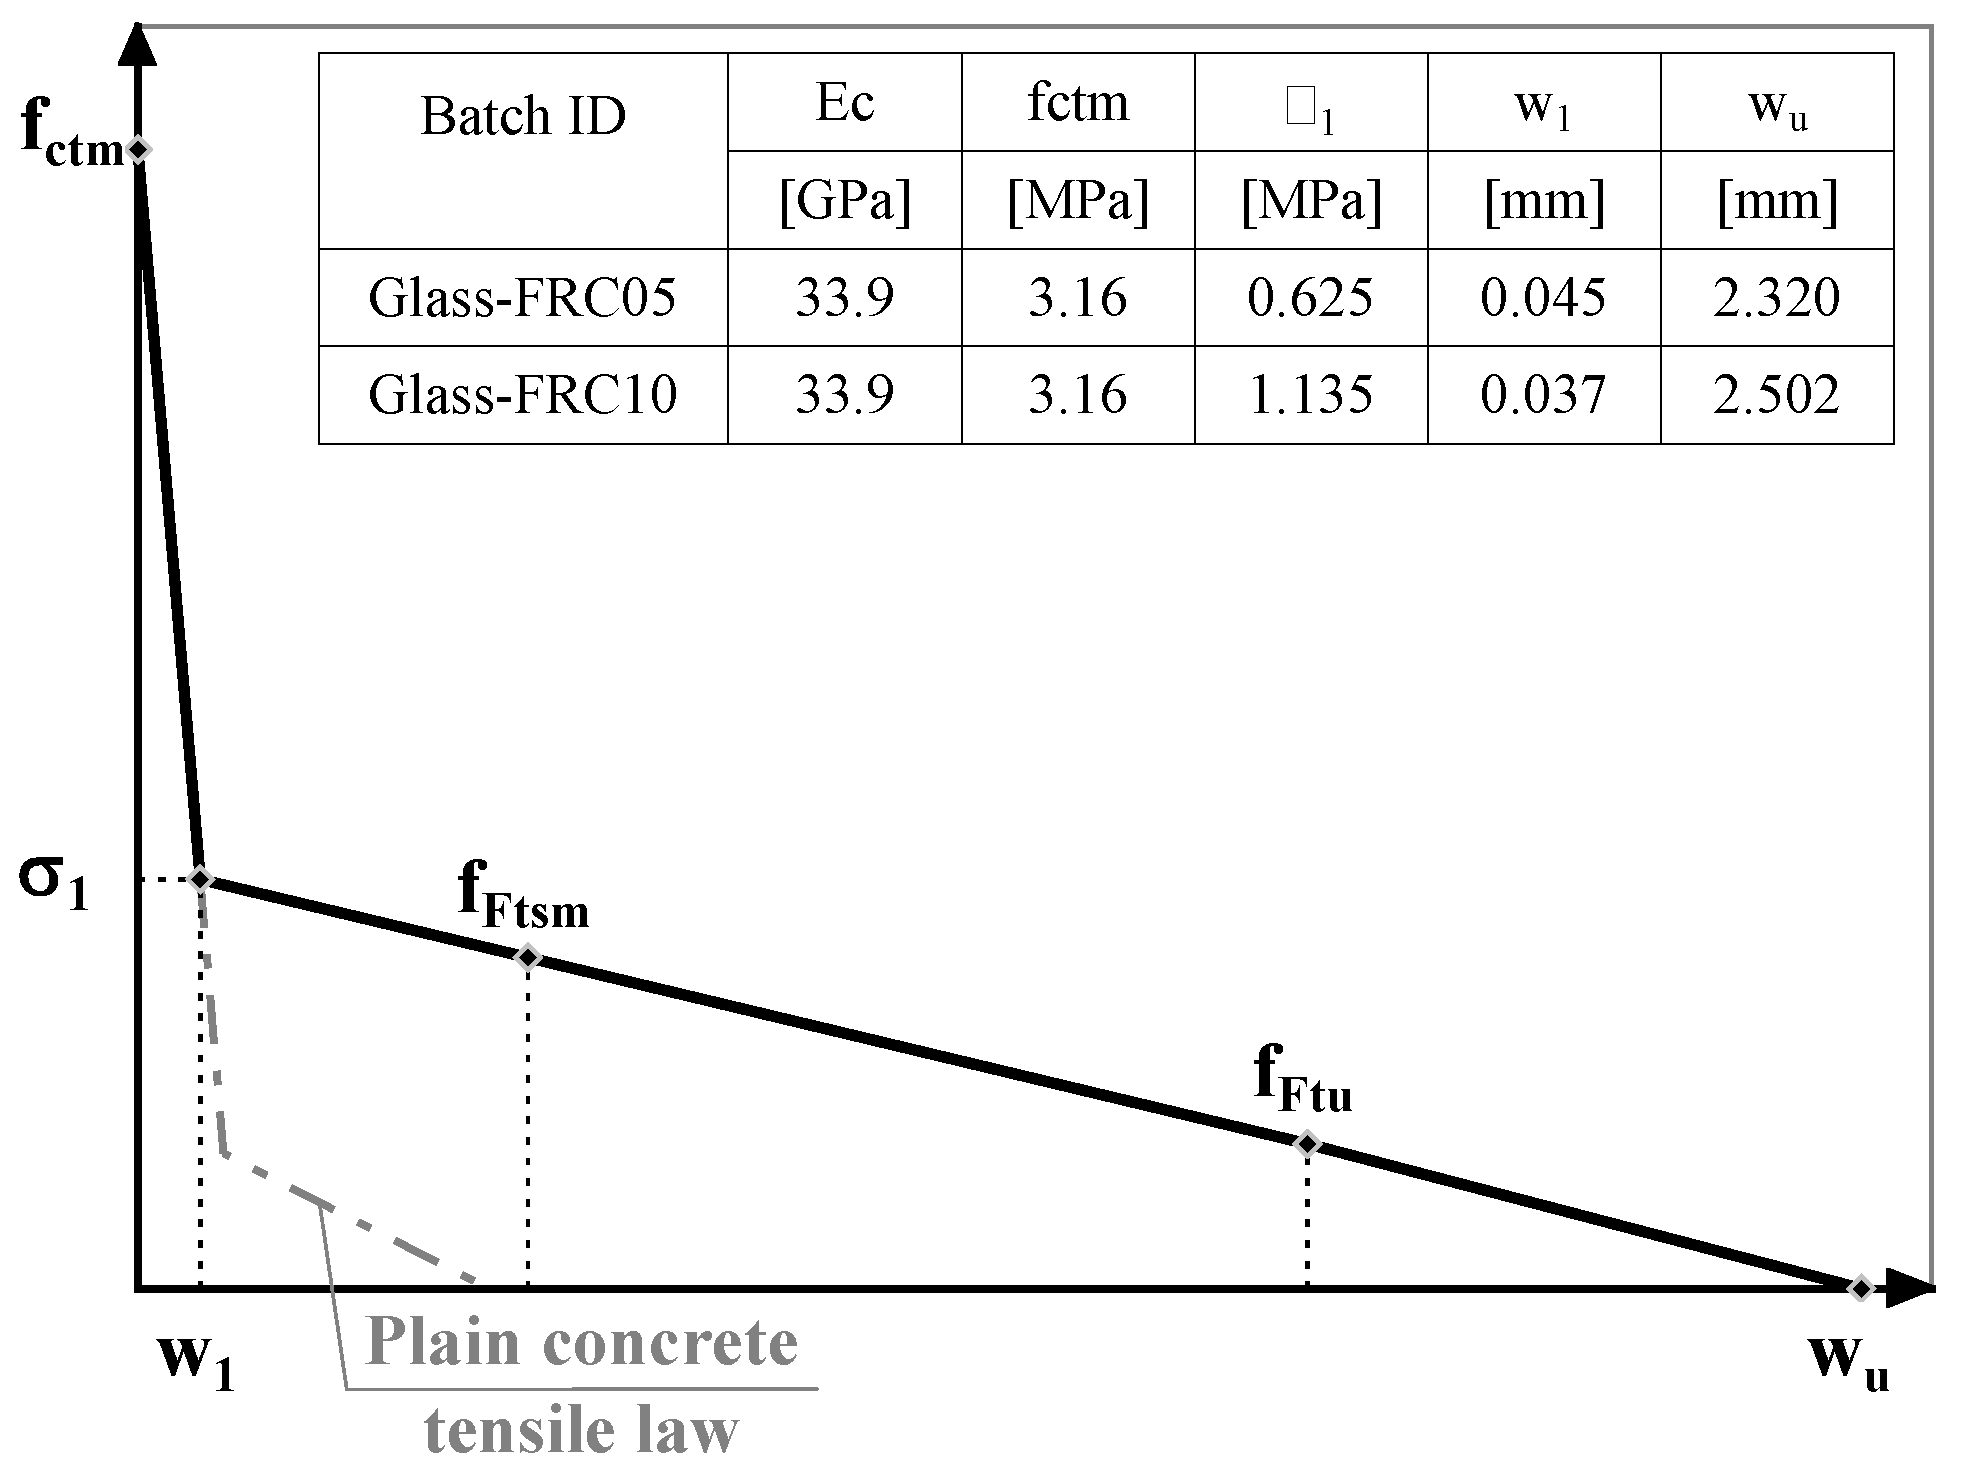
| fctm | mean cylindrical tensile concrete strength; |
| fLm | mean value of limit of proportionality; |
| fFtsm | mean value of post-crack strength for serviceability crack opening; |
| fFtum | ultimate residual strength (post-cracking strength for ultimate crack opening); |
| fRjm | mean residual flexural tensile strength of fiber reinforced concrete corresponding to CMOD=CMODj; |
| fuf | ultimate tensile strength of fiber’s filament; |
| h0 | notional size of structural element; |
| KWinkler | Winkler soil stiffness; |
| Lf | fiber length; |
| Lf/φf | fiber aspect ratio; |
| Li | internal length adopted in numerical analyses; |
| Td | total in-plane axial displacement of slab free corner; |
| TX | axial displacement in global x in-plane direction of slab free corner; |
| TY | axial displacement in global y in-plane direction of slab free corner; |
| TZ | upward deflection of slab free corner; |
| Vf | volume fraction of fibers; |
| w1 | crack width at breakpoint (bi-linear post-cracking law); |
| wc | ultimate crack width (bi-linear post-cracking law); |
| δ0 | relative displacement between subgrade and slab (end of elastic branch of bilinear function adopted); |
| εa(t) | autogenous shrinkage deformation at a given time (free shrinkage law); |
| εd(t) | drying shrinkage deformation at a given time (free shrinkage law); |
| σ1 | post-cracking tensile strength at breakpoint (bi-linear post-cracking law); |
| σX,max | maximum axial slab stress in global x in-plane direction; |
| σY,max | maximum axial slab stress in global y in-plane direction; |
| τ0 | shear frictional stresses between subgrade and slab (end of elastic branch of bilinear function adopted); |
| φf | fiber diameter. |
References
- Guide for Concrete Floor and Slab Construction; ACI: Farmington Hills, MI, USA, 1996; p. 65.
- Design of Slabs on Grade; ACI: Farmington Hills, MI, USA, 1997; p. 57.
- Istruzioni per la progettazione, l’esecuzione ed il controllo delle pavimentazioni di calcestruzzo. Available online: https://www.cnr.it/it/node/2631 (accessed on 4 September 2018).
- British Concrete Society. Concrete Industrial Ground Floors: A Guide to Design and Construction; Technical Report; The Concrete Society: Camberley, UK, 2003; p. 140. [Google Scholar]
- Barragan, B.; Facconi, L.; Plizzari, G.A. Design of glass fiber reinforced concrete floors according to the fib Model Code 2010. ACI Spec. Publ. 2014, 310, 311–320. [Google Scholar]
- Suprenant, B.A. Why Slabs Curl Part I: A Look at the Curling Mechanism and the Effect of Moisture and Shrinkage Gradients on the Amount of Curling. Available online: https://trid.trb.org/view/709544 (accessed on 4 September 2018).
- Suprenant, B.A. Why Slabs Curl Part II: Factors Affecting the Amount of Curling. Available online: https://trid.trb.org/view/710678 (accessed on 4 September 2018).
- Ytterberg, R.F. Control of Shrinkage and Curling in Slabs on Grade Part I: Shrinkage Problems: Causes and Cures. Available online: https://www.google.com.hk/url?sa=t&rct=j&q=&esrc=s&source=web&cd=1&ved=2ahUKEwi42PrF3aDdAhWZ7GEKHfytBsYQFjAAegQIAhAC&url=https%3A%2F%2Fwww.concreteconstruction.net%2F_view-object%3Fid%3D00000153-8bb4-dbf3-a177-9fbdce6d0000&usg=AOvVaw3dbxc0SwXUUApceQWHWBTd (accessed on 4 September 2018).
- Ytterberg, R.F. Control of Shrinkage and Curling in Slabs on Grade Part II: How to Deal with Warping and Curling. Available online: https://www.concreteconstruction.net/_view-object?id=00000153-8bb3-dbf3-a177-9fbbd5390000 (accessed on 4 September 2018).
- Zhang, J.; Leng, B. Analysis of shrinkage-induced stresses in concrete pavements. Mag. Concr. Res. 2004, 56, 585–595. [Google Scholar] [CrossRef]
- Zhang, J.; Li, V.C. Influence of supporting base characteristics on shrinkage-induced stresses in concrete pavements. J. Transp. Eng. 2001, 127, 455–462. [Google Scholar] [CrossRef]
- Banthia, N.; Bindiganavile, V.; Azhari, F.; Zanotti, C. Curling control in concrete slabs using fiber reinforcement. J. Test. Eval. 2014, 42, 390–397. [Google Scholar] [CrossRef]
- Reggia, A.; Tortelli, S.; Marchi, M.; Borsa, M.; Plizzari, G.A. Analysis of a jointless floor with calcium sulpho-aluminate and portland cement. ACI Spec. Publ. 2015, 305, 45. [Google Scholar]
- Mailvaganam, N.; Springfield, J.; Repette, W.; Taylor, D. Curling of Concrete Slabs on Grade. Available online: http://citeseerx.ist.psu.edu/viewdoc/download?doi=10.1.1.6.178&rep=rep1&type=pdf (accessed on 4 September 2018).
- Garber, G. Concrete Floors: Design and Construction of Concrete Floors; Butterworth-Heinemann: Oxford, UK, 2006; p. 384. [Google Scholar]
- Neal, F.R. Concrete Industrial Ground Floors: ICE Design and Practice Guide; Thomas Telford Publishing: London, UK, 2002; p. 62. [Google Scholar]
- Meda, A.; Plizzari, G.A. New design approach for steel fiber-reinforced concrete slabs-on-ground based on fracture mechanics. ACI Struct. J. 2004, 101, 298–303. [Google Scholar] [CrossRef]
- Sorelli, L.G.; Meda, A.; Plizzari, G.A. Steel fiber concrete slabs on ground: A structural matter. ACI Struct. J. 2006, 103, 551–558. [Google Scholar]
- Falkner, H.; Huang, Z.; Teutsch, M. Comparative Study of Plain and Steel Fiber-Reinforced Concrete Ground Slabs. Concr. Int. 1995, 17, 45–51. [Google Scholar]
- Tatnall, P.C.; Kuitenbouwer, L. Steel Fiber Reinforced Concrete in Industrial Floors. Concr. Int. 1992, 14, 43–47. [Google Scholar]
- Vasanelli, E.; Micelli, F.; Aiello, M.A.; Plizzari, G. Long term behavior of frc flexural beams under sustained load. Eng. Struct. 2013, 56, 1858–1867. [Google Scholar] [CrossRef]
- Tiberti, G.; Minelli, F.; Plizzari, G. Reinforcement optimization of fiber reinforced concrete linings for conventional tunnels. Compos. Part B Eng. 2014, 58, 199–207. [Google Scholar] [CrossRef]
- Plizzari, G.A.; Cangiano, S.; Cere, N. Post-peak Behavior of Fiber-Reinforced Concrete under Cyclic Tensile Loads. ACI Mater. J. 2000, 97, 182–192. [Google Scholar]
- Germano, F.; Tiberti, G.; Plizzari, G. Post-peak fatigue performance of steel fiber reinforced concrete under flexure. Mater. Struct. 2016, 49, 4229–4245. [Google Scholar] [CrossRef]
- Nayar, S.K.; Gettu, R. A comprehensive methodology for the design of fibre reinforced concrete pavements. ACI Spec. Publ. 2014, 310, 321–330. [Google Scholar]
- Wesevich, J.W.; McCullough, B.F.; Burns, N.H. Stabilized Subbase Friction Study for Concrete Pavements. Available online: https://library.ctr.utexas.edu/digitized/texasarchive/phase2/459-1.pdf (accessed on 4 September 2018).
- Wimsatt, A.W.; McCullough, B.F.; Burns, N.H. Methods of Analyzing and Factors Influencing Frictional Effects of Subbases. Available online: https://trid.trb.org/view/1182178 (accessed on 4 September 2018).
- Rozycki, D.K.; Rasmussen, R.O. Assessment of Slab-Base Interaction in PCC Airfield Pavements. Available online: https://trid.trb.org/view/506377 (accessed on 4 September 2018).
- Eurocode 2: Design of Concrete Structures—Part 1: General Rules and Rules for Buildings; NSAI: Dublin, Ireland, 2004; p. 225.
- Test Method for Metallic Fibre Concrete—Measuring the Flexural Tensile Strength (Limit of Proportionally (LOP), Residual); BSI: London, UK, 2005; p. 18.
- Brason, D.E. Shrinkage, Creep and Other Concrete Properties. In Control of Cracking in Reinforced Concrete Structures: Research Project CEOS.fr (Civil Engineering and Geomechanics); Wiley-ISTE: London, UK, 2016; pp. 119–142. [Google Scholar]
- ACI Committee. Prediction of Creep, Shrinkage, and Temperature Effects in Concrete Structures; American Concrete Institute: Farmington Hill, MI, USA, 1992; p. 47. [Google Scholar]
- CEB-FIP Model Code 1990; Thomas Telford Publishing: London, UK, 1993; p. 437.
- Fib Model Code for Concrete Structures 2010; Ernst & Sohn: Hoboken, NJ, USA, 2010; p. 434.
- Rasmussen, R.O.; McCullough, B.F. A Foundation for High Performance Jointed Concrete Pavement Design and Construction Guidelines; Transtec Consultants: Austin, TX, USA, 1998. [Google Scholar]
- Heath, A.C.; Roesler, J.R. Shrinkage and Thermal Cracking of Fast Setting Hydraulic Cement Concrete Pavements in Palmdale, California. Available online: https://trid.trb.org/view.aspx?id=644231 (accessed on 4 September 2018).
- Dere, Y.; Asgari, A.; Sotelino, E.D.; Archer, G.C. Failure prediction of skewed jointed plain concrete pavements using 3D FE analysis. Fail. Anal. 2006, 13, 898–913. [Google Scholar] [CrossRef]
- Blanco, A.; Cavalaro, S.; De la Fuente, A.; Grunewald, S.; Blom, C.B.M.; Walraven, J.C. Application of FRC constitutive models to modelling of slabs. Mater. Struct. 2015, 48, 2943–2959. [Google Scholar] [CrossRef]
- Bernardi, P.; Cerioni, R.; Michelini, E. Analysis of post-cracking stage in sfrc elements through a non-linear numerical approach. Fract. Mech. 2013, 108, 238–250. [Google Scholar] [CrossRef]
- Diana v.9.4.4. Material Library Release. Available online: https://dianafea.com/manuals/d944/MatLib/MatLib.html (accessed on 4 September 2018).
- Rots, J.G. Computational Modeling of Concrete Fracture. Ph.D. Thesis, Delft University of Technology, Delft, The Netherlands, September 1988. [Google Scholar]
- Di Prisco, M.; Colombo, M.; Dozio, D. Fibre-reinforced concrete in fib Model Code 2010: Principles, models and test validation. Struct. Concr. 2013, 14, 342–361. [Google Scholar] [CrossRef]
- Hillerborg, A.; Modéer, M.; Petersson, P.-E. Analysis of crack formation and crack growth in concrete by means of fracture mechanics and finite elements. Cem. Concr. Res. 1976, 6, 773–781. [Google Scholar] [CrossRef]
- Diana v.9.4.4. Element Library Release. Available online: https://dianafea.com/manuals/d944/ElmLib/ElmLib.html (accessed on 4 September 2018).
- Chen, H.L.; Schell, T.H.; Sweet, J.G. Field study of early-age behaviour of jointed plain concrete pavements. ACI Spec. Publ. 2002, 206, 243–258. [Google Scholar]


| Subgrade | KWinkler | Frictional Behavior | |
|---|---|---|---|
| τ0 | δ0 | ||
| (N/mm3) | (MPa) | (mm) | |
| Low friction, LF | 0.08 | 0.008 | 1.3 |
| High friction, HF | 0.08 | 0.023 | 0.5 |
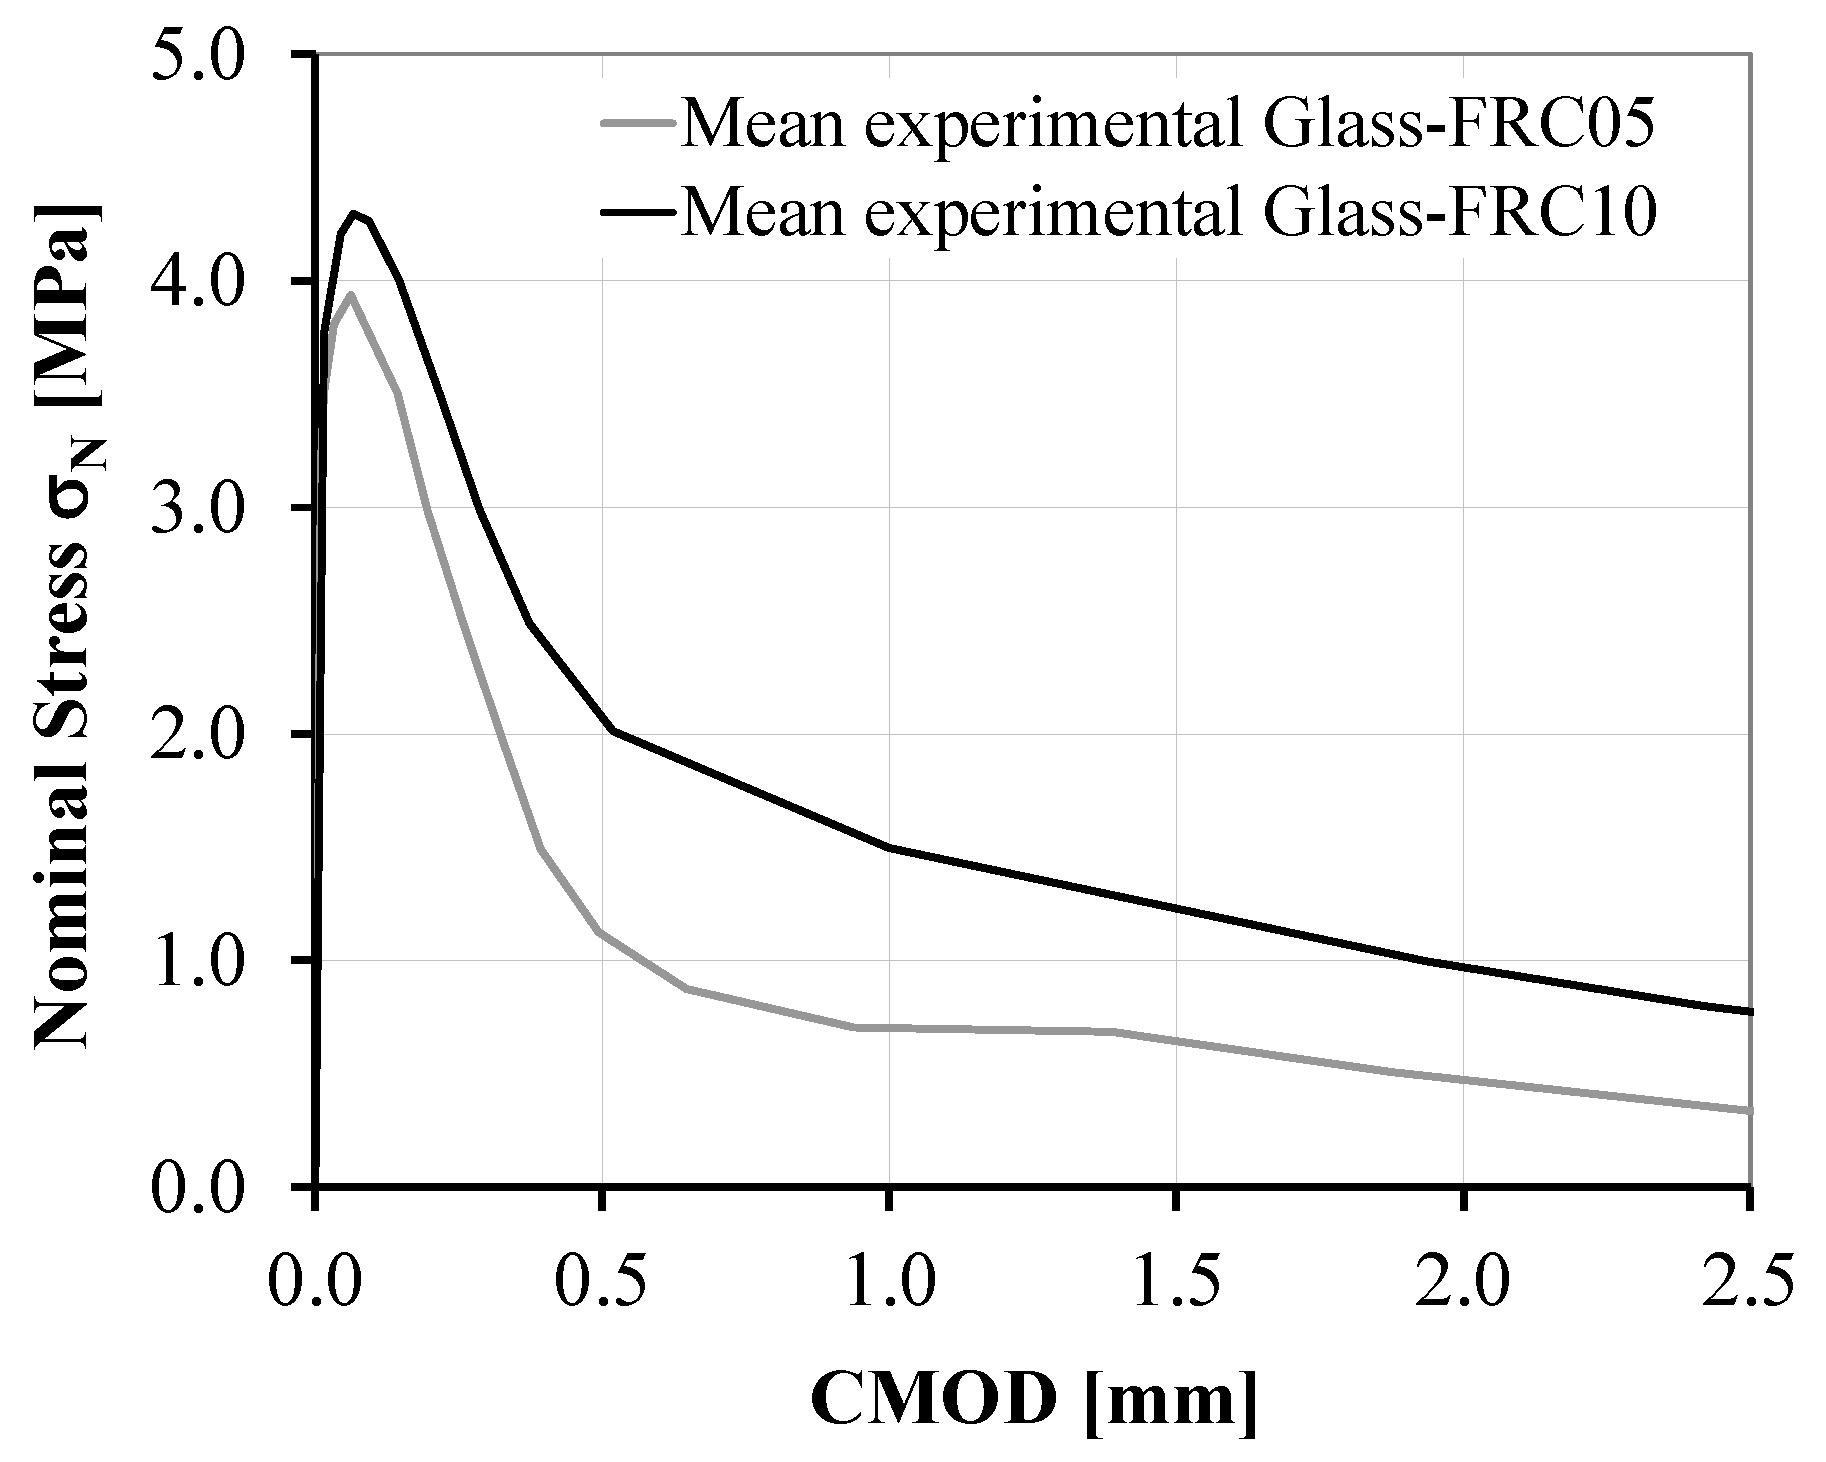
| Batch ID | Ec 1 | fcm,cube | fcm 1 | fctm 1 | fLm | fR1m | fR3m |
|---|---|---|---|---|---|---|---|
| (MPa) | (MPa) | (MPa) | (MPa) | (MPa) | (MPa) | (MPa) | |
| Glass-FRC05 | 33.9 | 50.6 | 42.0 | 3.16 | 3.93 | 1.11 | 0.34 |
| Glass-FRC10 | 33.9 | 50.8 | 42.2 | 3.16 | 4.27 | 2.04 | 0.78 |
| Slab ID | First Cracking Age | Estimated Crack | Upward Deflection of Free Corner, Tz | |
|---|---|---|---|---|
| Age | Width | |||
| (days) | (days) | (mm) | (mm) | |
| 20-G05-HF-Lnr01 | 35 | 294 | 0.592 | 8.2 |
| 20-G10-HF-Lnr01 | 35 | 294 | 0.200 | 8.3 |
| 30-G05-HF-Lnr01 | 25 | 78 1 | 0.626 | 5.3 |
| 30-G10-HF-Lnr01 | 25 | 294 | 0.906 | 8.7 |
| 20-G05-LF-Lnr01 | 49 | 244 | 0.014 | 9.3 |
| 20-G10-LF-Lnr01 | 49 | 253 | 0.016 | 9.4 |
| 30-G05-LF-Lnr01 | 43 | 223 | 0.020 | 9.0 |
| 30-G10-LF-Lnr01 | 43 | 194 | 0.017 | 8.7 |
| 20-G05-HF-Lnr02 | 22 | 303 | 0.850 | 9.2 |
| 20-G10-HF-Lnr02 | 22 | 324 | 0.767 | 13.5 |
| 30-G05-HF-Lnr02 | 18 | 39 1 | 0.661 | 5.8 |
| 30-G10-HF-Lnr02 | 18 | 46 1 | 0.488 | 7.0 |
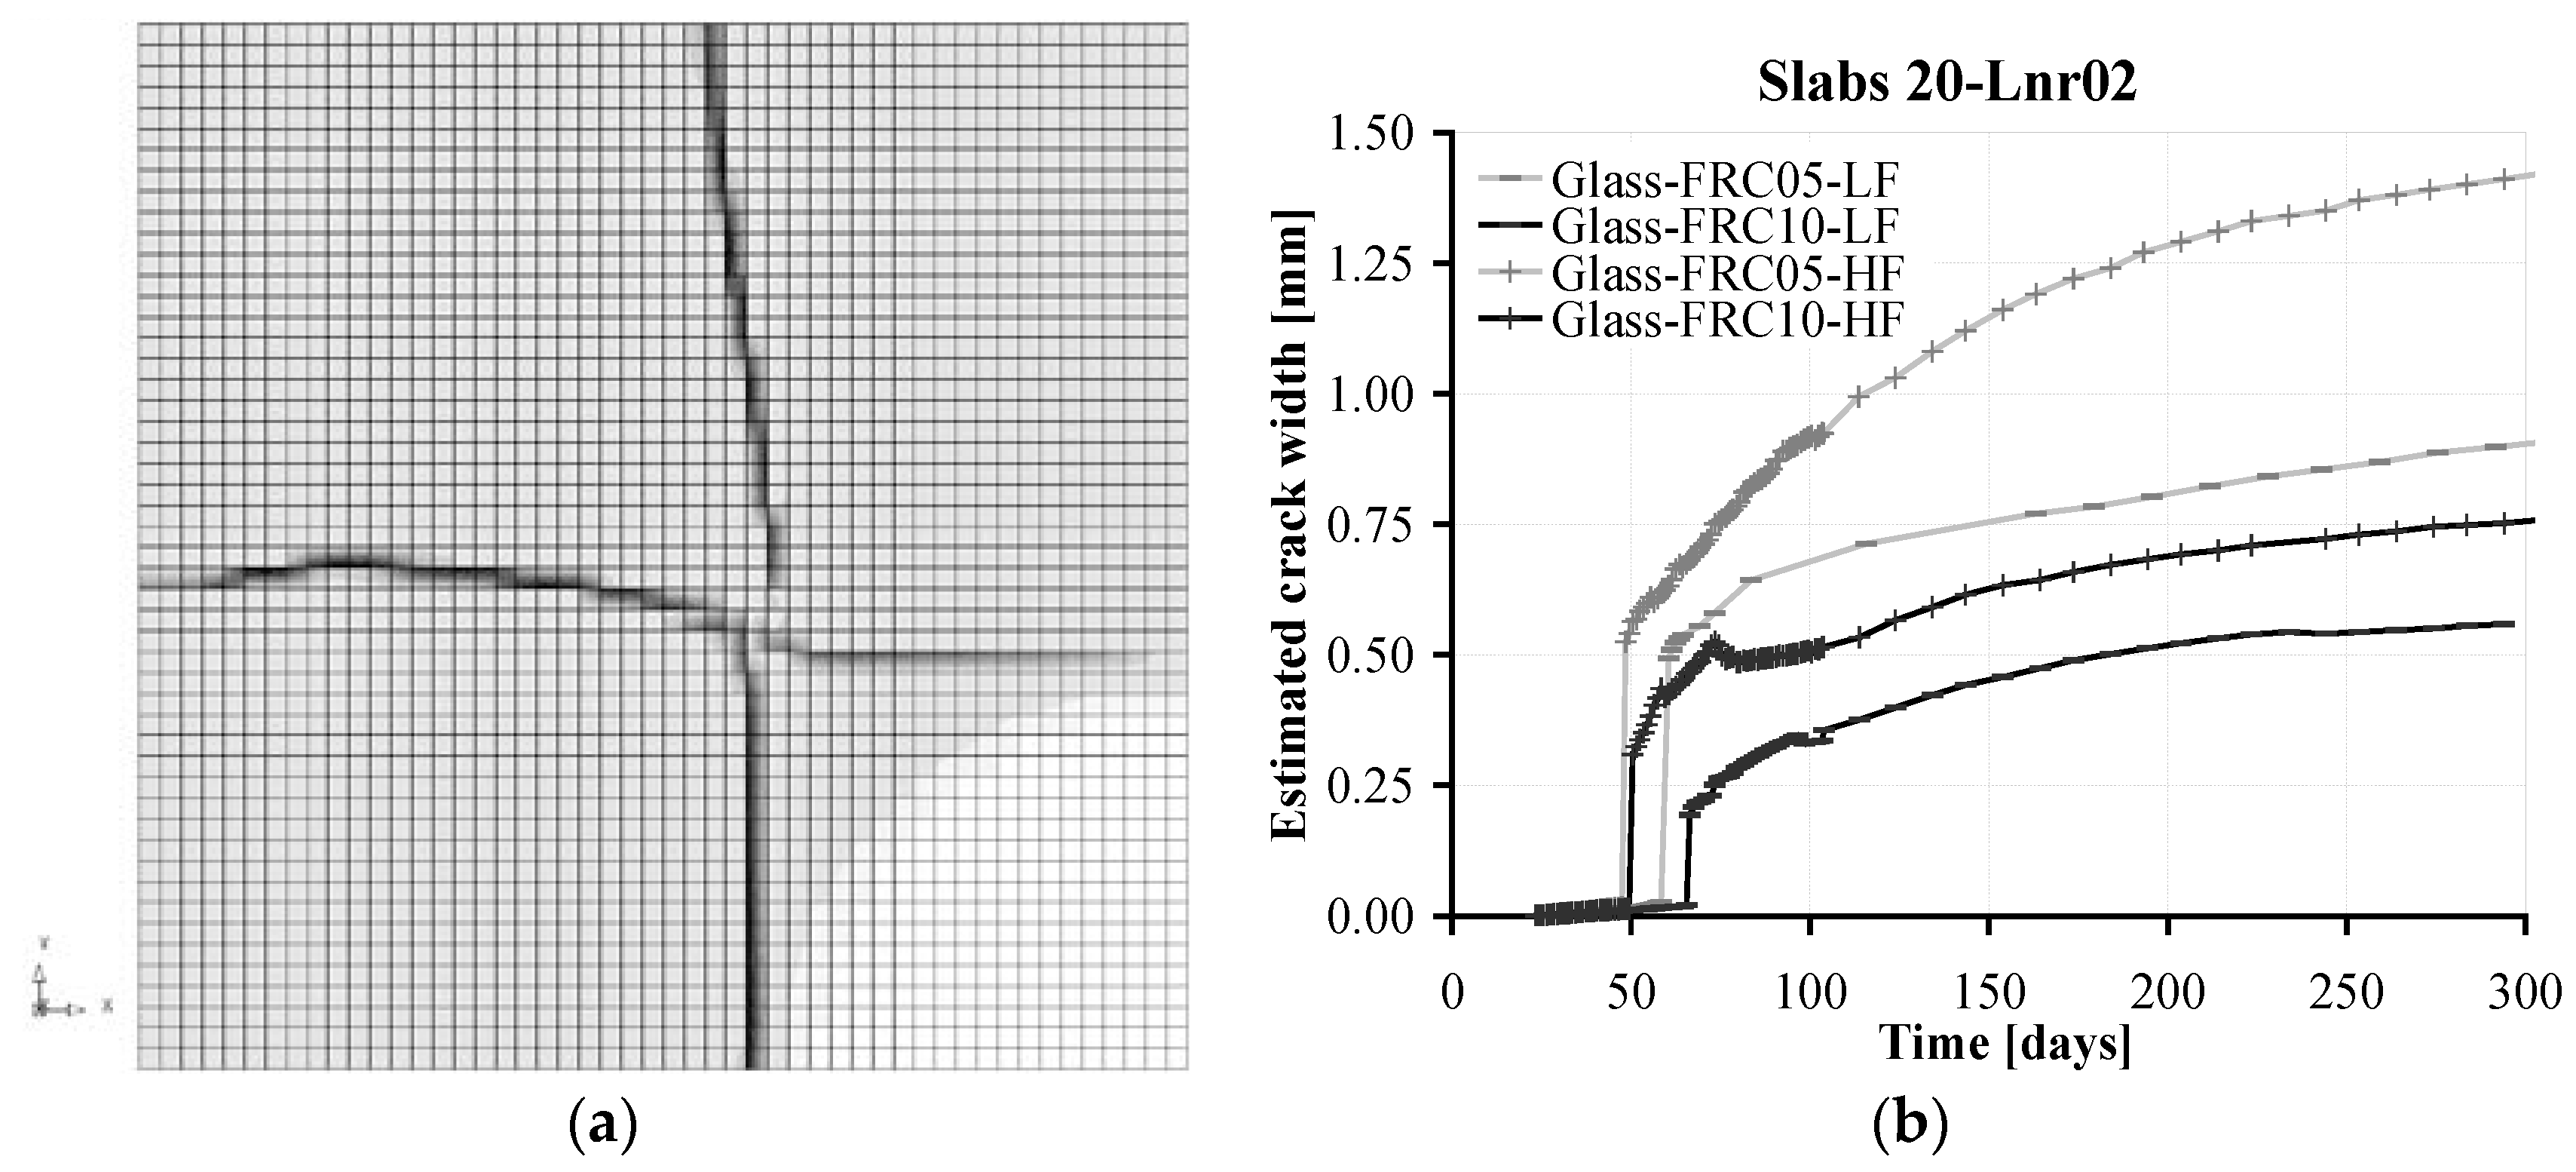
| 20-G05-LF-Lnr02 | 28 | 324 | 0.918 | 10.8 |
| 20-G10-LF-Lnr02 | 28 | 294 | 0.560 | 13.0 |
| 30-G05-LF-Lnr02 | 26 | 251 | 1.080 | 12.4 |
| 30-G10-LF-Lnr02 | 26 | 331 | 0.570 | 13.5 |
| Slab ID | Maximum Tensile Stress σX,max = σY,max | Axial Displacement of Free Corner, Tx = Ty (Td) |
|---|---|---|
| (MPa) | (mm) | |
| 20-G05-HF-Unifr | 1.10 | 5.3 (7.5) |
| 20-G10-HF-Unifr | ||
| 30-G05-HF-Unifr | 1.63 | 7.9 (11.2) |
| 30-G10-HF-Unifr | ||
| 20-G05-LF-Unifr | 0.37 | 5.4 (7.6) |
| 20-G10-LF-Unifr | ||
| 30-G05-LF-Unifr | 0.57 | 8.1 (11.5) |
| 30-G10-LF-Unifr |
© 2018 by the authors. Licensee MDPI, Basel, Switzerland. This article is an open access article distributed under the terms and conditions of the Creative Commons Attribution (CC BY) license (http://creativecommons.org/licenses/by/4.0/).
Share and Cite
Tiberti, G.; Mudadu, A.; Barragan, B.; Plizzari, G. Shrinkage Cracking of Concrete Slabs-On-Grade: A Numerical Parametric Study. Fibers 2018, 6, 64. https://doi.org/10.3390/fib6030064
Tiberti G, Mudadu A, Barragan B, Plizzari G. Shrinkage Cracking of Concrete Slabs-On-Grade: A Numerical Parametric Study. Fibers. 2018; 6(3):64. https://doi.org/10.3390/fib6030064
Chicago/Turabian StyleTiberti, Giuseppe, Antonio Mudadu, Bryan Barragan, and Giovanni Plizzari. 2018. "Shrinkage Cracking of Concrete Slabs-On-Grade: A Numerical Parametric Study" Fibers 6, no. 3: 64. https://doi.org/10.3390/fib6030064
APA StyleTiberti, G., Mudadu, A., Barragan, B., & Plizzari, G. (2018). Shrinkage Cracking of Concrete Slabs-On-Grade: A Numerical Parametric Study. Fibers, 6(3), 64. https://doi.org/10.3390/fib6030064