The Degradation of Cellulose by Radio Frequency Plasma


Department of Fiber Science & Apparel Design, Cornell University, Ithaca, NY 14850, USA
*
Author to whom correspondence should be addressed.
Fibers 2018, 6(3), 61; https://doi.org/10.3390/fib6030061
Submission received: 27 July 2018
/
Revised: 20 August 2018
/
Accepted: 23 August 2018
/
Published: 24 August 2018
Abstract
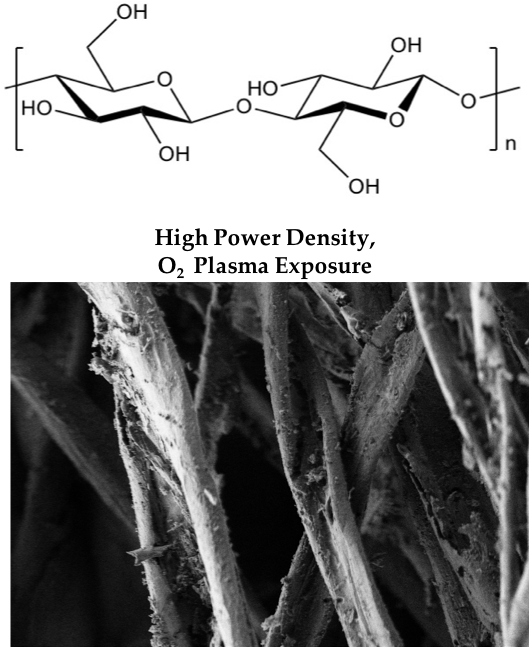
:This paper describes the results of using oxygen (O2) plasma to treat both greige and scoured cotton yarns to cause significant degradation of cellulose. This study is an effort to reduce hazardous caustic chemicals commonly used to make the cellulose molecule more accessible for uses in such applications as biofuels. Through high power density, 0.46 W/cm2, and the study of varying exposure times, we find longer durations of 30 min to 90 min result in significant cellulose structure degradation. Due to waxes and contaminants found on greige yarns, scoured yarn degradation occurs at shorter exposure times than greige yarns, however, both experience tearing and pitting with longer exposures. This study provides evidence that significant degradation of cellulosic yarns can be achieved through high power density O2 plasma exposure.
1. Introduction
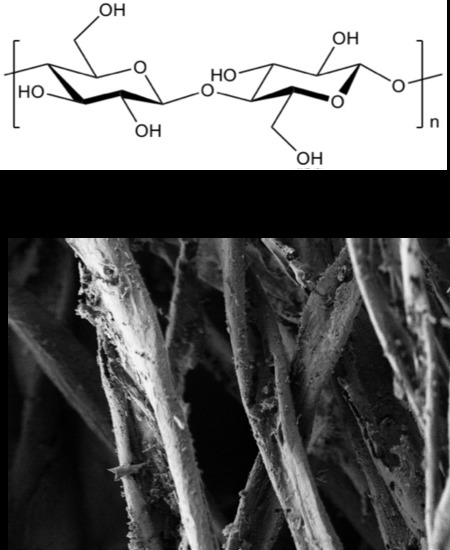
Cellulosic materials are found in plants and are heavily used in the textile industry. Because of the ubiquity of cellulose, strategies for its environmental break down are important and necessary. For example, the cotton materials that end up in the waste stream contain valuable cellulosic material that could have potential use as alternative fuels [1]. Enzymatic saccharification for the breakdown of pure cellulosic material for use in biofuels is often difficult, resulting in lower than desired yields due to the cellulose structure [2]. Therefore, pre-treatments are needed to make the cellulose more accessible to the enzymes. A common method for the degradation of cellulosic materials is acid hydrolysis, which uses caustic chemicals [3,4]. It is therefore important to investigate non-hazardous techniques to increase/aid in the decomposition of cellulose so that it may be made more accessible.
Plasmas show promise as safe, chemical free, high energy [5] sources that could be applied to the safe and clean processing of cotton. While there is the potential to create ozone by use of plasma [6], we feel the benefit from reducing the use of caustic chemicals outweighs this risk. Research on treating textiles with various sources of plasmas has shown the potential to both process textiles via de-sizing [7,8], as well as induce degradation in low molecular weight amorphous cellulose to produce biomass for fuels [9]. Additionally, plasmas have been used for surface functionalization of cotton [10].
Due to the electron and ion bombardment, such as that provided by plasma exposed samples, backbone and side chain scissions may occur [7], resulting in cellulose chain degradation. In the research described here, the objective was to explore the conditions that enable the use of oxygen (O2) plasma as a non-hazardous and solvent free method to significantly degrade greige and scoured cellulose yarns. While argon and O2 plasmas at short exposure times (less than 15 min) have been researched on cotton by Hua et al. we chose to implement O2 plasma, as Hu et al. found that cotton experiences more pyranosidic bond cleavages with O2 plasma than with argon plasma [11].
In this work, we explored both long (30 min, 60 min, and 90 min) and short (15 min) plasma exposure times at a high power density of 0.46 W/cm2 on cotton yarn samples. Other researchers have observed slight degradation of cotton fabrics using atmospheric pressure plasma treatments with exposure times less than or equal to 30 min [12,13,14]; we found, however, longer plasma exposure times greater than 30 min with a power density of 0.46W/cm2 to cause significant degradation of both greige and scoured cellulose yarn. The time to significant degradation in this study was relatively long, however, degradation should occur at shorter plasma exposure times if a higher power density unit is implemented. Mechanical testing, gel permeation chromatography (GPC), and x-ray photoelectron spectroscopy (XPS) were studied for signs of degradation.
2. Materials and Methods
2.1. Materials
For comparisons, skeins of greige and scoured (boiled off) cotton yarns (two ply) were purchased from Test Fabrics, Inc. (West Pittston, PA, USA). Cotton is composed of cellulose, however a variety of other components such as waxes, proteins, sugars, organic acids, etc. are also present on the fibers [15,16]. Due to the scouring process of boiling off, scoured yarns should be free of these substances; however, while lower, they are still present [17].
2.2. Plasma Treatment
Several plasmas could be used to purposely cause fiber degradation, including but not limited to helium, nitrogen, argon, and O2. For this research, however, we chose to degrade cellulose with O2 plasma. Skeins of yarn were exposed to O2 plasma at various conditions in three different sized plasma units provided by Plasma Etch, Inc. (Carson City, NV, USA); BT-1, PE50, and PE200RIE. All tests conducted in the various units are shown in the Supplemental Table S1. All samples were tensile tested (Instron), however further experimental testing was limited to samples listed in Table 1 as these samples showed significant visual and tensile degradation at longer exposure times. During plasma treatment, the temperature of the sample platform was set at 40 °C for the BT-1 and PE200RIE units; the smaller PE50 units did not possess temperature control capabilities.
2.3. Field Emission Scanning Electron Microscopy (FE-SEM)
We used FE-SEM imaging to qualitatively investigate the morphology and surface characteristics of greige and scoured yarns before and after O2 plasma treatments. The low accelerating voltage (1 kV) used with the LEO 1550 FE-SEM (Zeiss, Oberkochen, Germany) allows samples to be imaged without sample coating.
2.4. Tensile Testing for Load at Break
Yarn samples were left at 21 °C and 65% relative humidity for at least twenty-four hours prior to mechanical testing. Gauge length was set to 50 mm with a crosshead speed of 25 mm min−1 using a 10 N load cell. We performed five tests per sample, when possible (the exceptions being plasma treated yarns that were too weak to withstand testing). Tensile testing was used to examine the relationship between load at break, plasma exposure time, and plasma power density.
2.5. X-ray Photoelectron Spectroscopy (XPS)
Samples were analyzed approximately 1–2 months after plasma treatment by XPS, using Surface Science Instruments SSX-100 (Service Physics Inc., Bend, OR, USA) with operating pressure ~2 × 10⁻⁹ Torr. Monochromatic AlK-alpha x-rays (1486.6 electron volt (eV)) (Service Physics Inc., Bend, OR, USA) were used with a beam diameter of 1 mm. Photoelectrons were collected at a 55 degree emission angle. A hemispherical analyzer determined electron kinetic energy, using the pass energy of 150 V for wide/survey scans, and 50 V for high resolution scans. A flood gun was used for charge neutralization of non-conductive samples. Wide scans provide evidence of elements on the cellulose samples such as nitrogen, calcium and potassium. By running XPS high resolution spectra, we were able to investigate changes in elemental composition for adventitious carbon, C1s (C-C//C-H (C1), C−O (C2), C=O/O−C−O (C3), and O−C=O (C4)) with chemical changes occurring at the surface of samples. We are also able to compare the atomic ratios of oxygen (O1s) and C1s spectra. Sample spectra were analyzed using CASA XPS. A Shirley background was taken and the Gaussian-Lorentzian curve fitting was performed at 30% Gaussian and 70% Lorentzian. We shifted the spectra so that adventitious carbon was located at 285.0 eV. For C1s spectra, C1 was constrained to a full width half max (fwhm) between 1 and 2.3, while C2–C4 were constrained to have the same fwhm value as C1.
2.6. Gel Permeation Chromatography (GPC)
A Viscotek TDA 302 Triple Detection GPC with a 0.5% LiCl in dimethylacetamide (DMAc) mobile phase (Malvern Panalytical Inc., Westborough, MA, USA) was used to determine the polydispersity index (PDI) and average molecular weights (Mw, Mn) of the cellulosic yarns. Yarn samples were prepared in two steps: first, the cellulose was activated for dissolution, after which the yarns were dissolved in 8% LiCl dissolved in DMAc. GPC samples were then prepared by diluting 100–200 μL of sample stock in 3.5–4.5 mL of mobile phase (0.5% LiCl/DMAc) and stirred for 3 h at ambient temperature. Finally, the sample was filtered and analyzed. Three replicates were done for each sample, except for greige yarn treated at 15 min at 200 cc/min O2 flow rate and scoured yarn treated at 15 min at 75 cc/min O2 flow rate; these samples were analyzed twice.
3. Results and Discussion
3.1. Visual Yarn Degradation
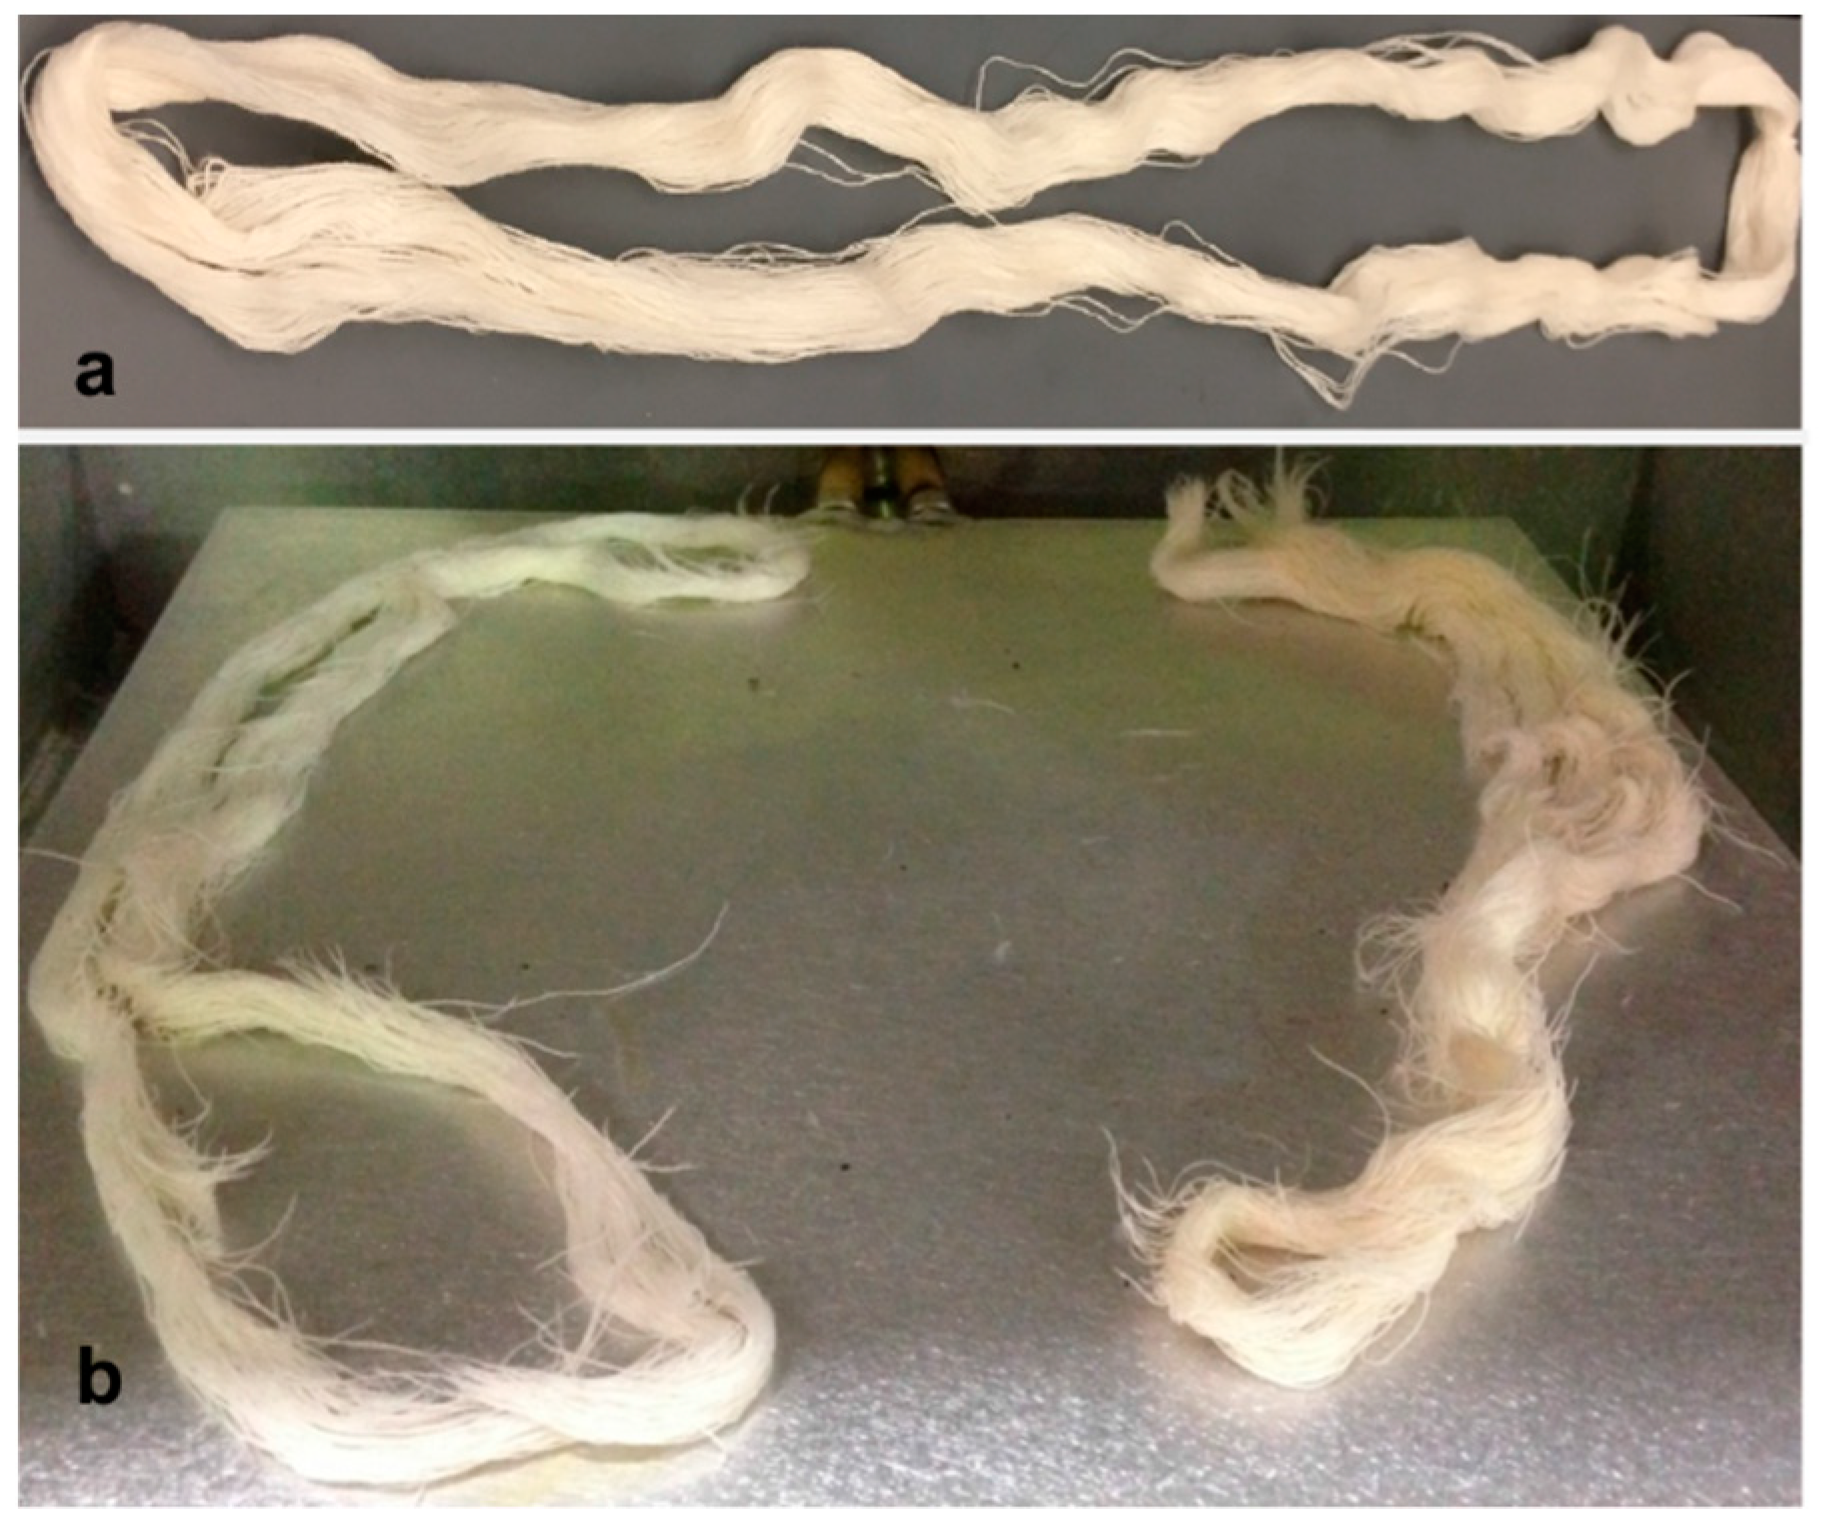
After we treated yarns with plasma, we were immediately able to see if severe degradation of the yarns had occurred. Control yarns had no breakages and did not break upon handling. Plasma treated yarns, however, began to exhibit visual breakages when treated for 15 min with an O2 flow rate of 200 cc/min (not 75 cc/min), as well as a severe decrease in structural integrity that was further amplified at longer exposure times. (Figure 1, Supplemental Video S1).
With SEM image analysis, we achieved a more comprehensive visualization of polymer degradation, or lack thereof. Scoured yarns were seen to have clear physical degradation, including pitting and splitting of the fibers, with as little as 15 min of plasma exposure (Figure 2 (left)). In contrast, greige yarns showed less severe damage at 15 min plasma exposure, but with increased plasma treatment time, pitting and breakages became apparent (Figure 2 (right)). The initial lack of significant degradation of greige yarn was attributed to the greater amount of waxes and other components present at the yarn surface compared to scoured yarns. The degradation we observed was much more severe than that observed previously by other researchers who implemented varying plasmas (i.e., air, O2) at shorter exposure times and/or lower power densities [7,18].
Plasma is known to etch cellulose [7,15,19], and based on the visual etching/degradation presented in this work, although we did not measure weight loss, we can infer that this has occurred. A decrease in cellulose sample weight has been associated with the splitting off of hydroxyl groups and free radical formation [20].
3.2. Load at Break for Yarns
Power density, exposure time, and O2 flowrate all impacted changes in load at break for cotton fibers. Power density is the power of radio frequency (RF) plasma over the area of the electrode. At first, under low power density, time, and O2 flow rate, breaking strength increased greater than the control greige and scoured yarns (Figure 3a,b), which was likely due to crosslinking at the fiber’s surface. After a sufficient duration of plasma exposure at high enough power densities (0.46 W/cm2) and flow rates (200 cc/min), the breaking strength began to decrease; we attributed this effect to hydroxyl groups splitting off and glycosidic bond scissions in the backbone.
The lower amount of waxes and other components on the surfaces of scoured yarns yielded an initially more severe decrease in load at break for scoured yarns than greige. It is also worth mentioning that skeins of the yarn were laid in the plasma chamber and not spread out, so the yarn properties may have been slightly different for yarns that were at the bottom versus yarns at the top; this may be why there was such large variation. Again, for power densities of 0.46 W/cm2 and exposure times of 15 min, 30 min, 60 min, and 90 min, both the greige and scoured yarns were physically damaged and visibly weaker. The samples with severe physical breakages represent zero strength, which was unaccounted for in these measurements.
3.3. Molecular Weight
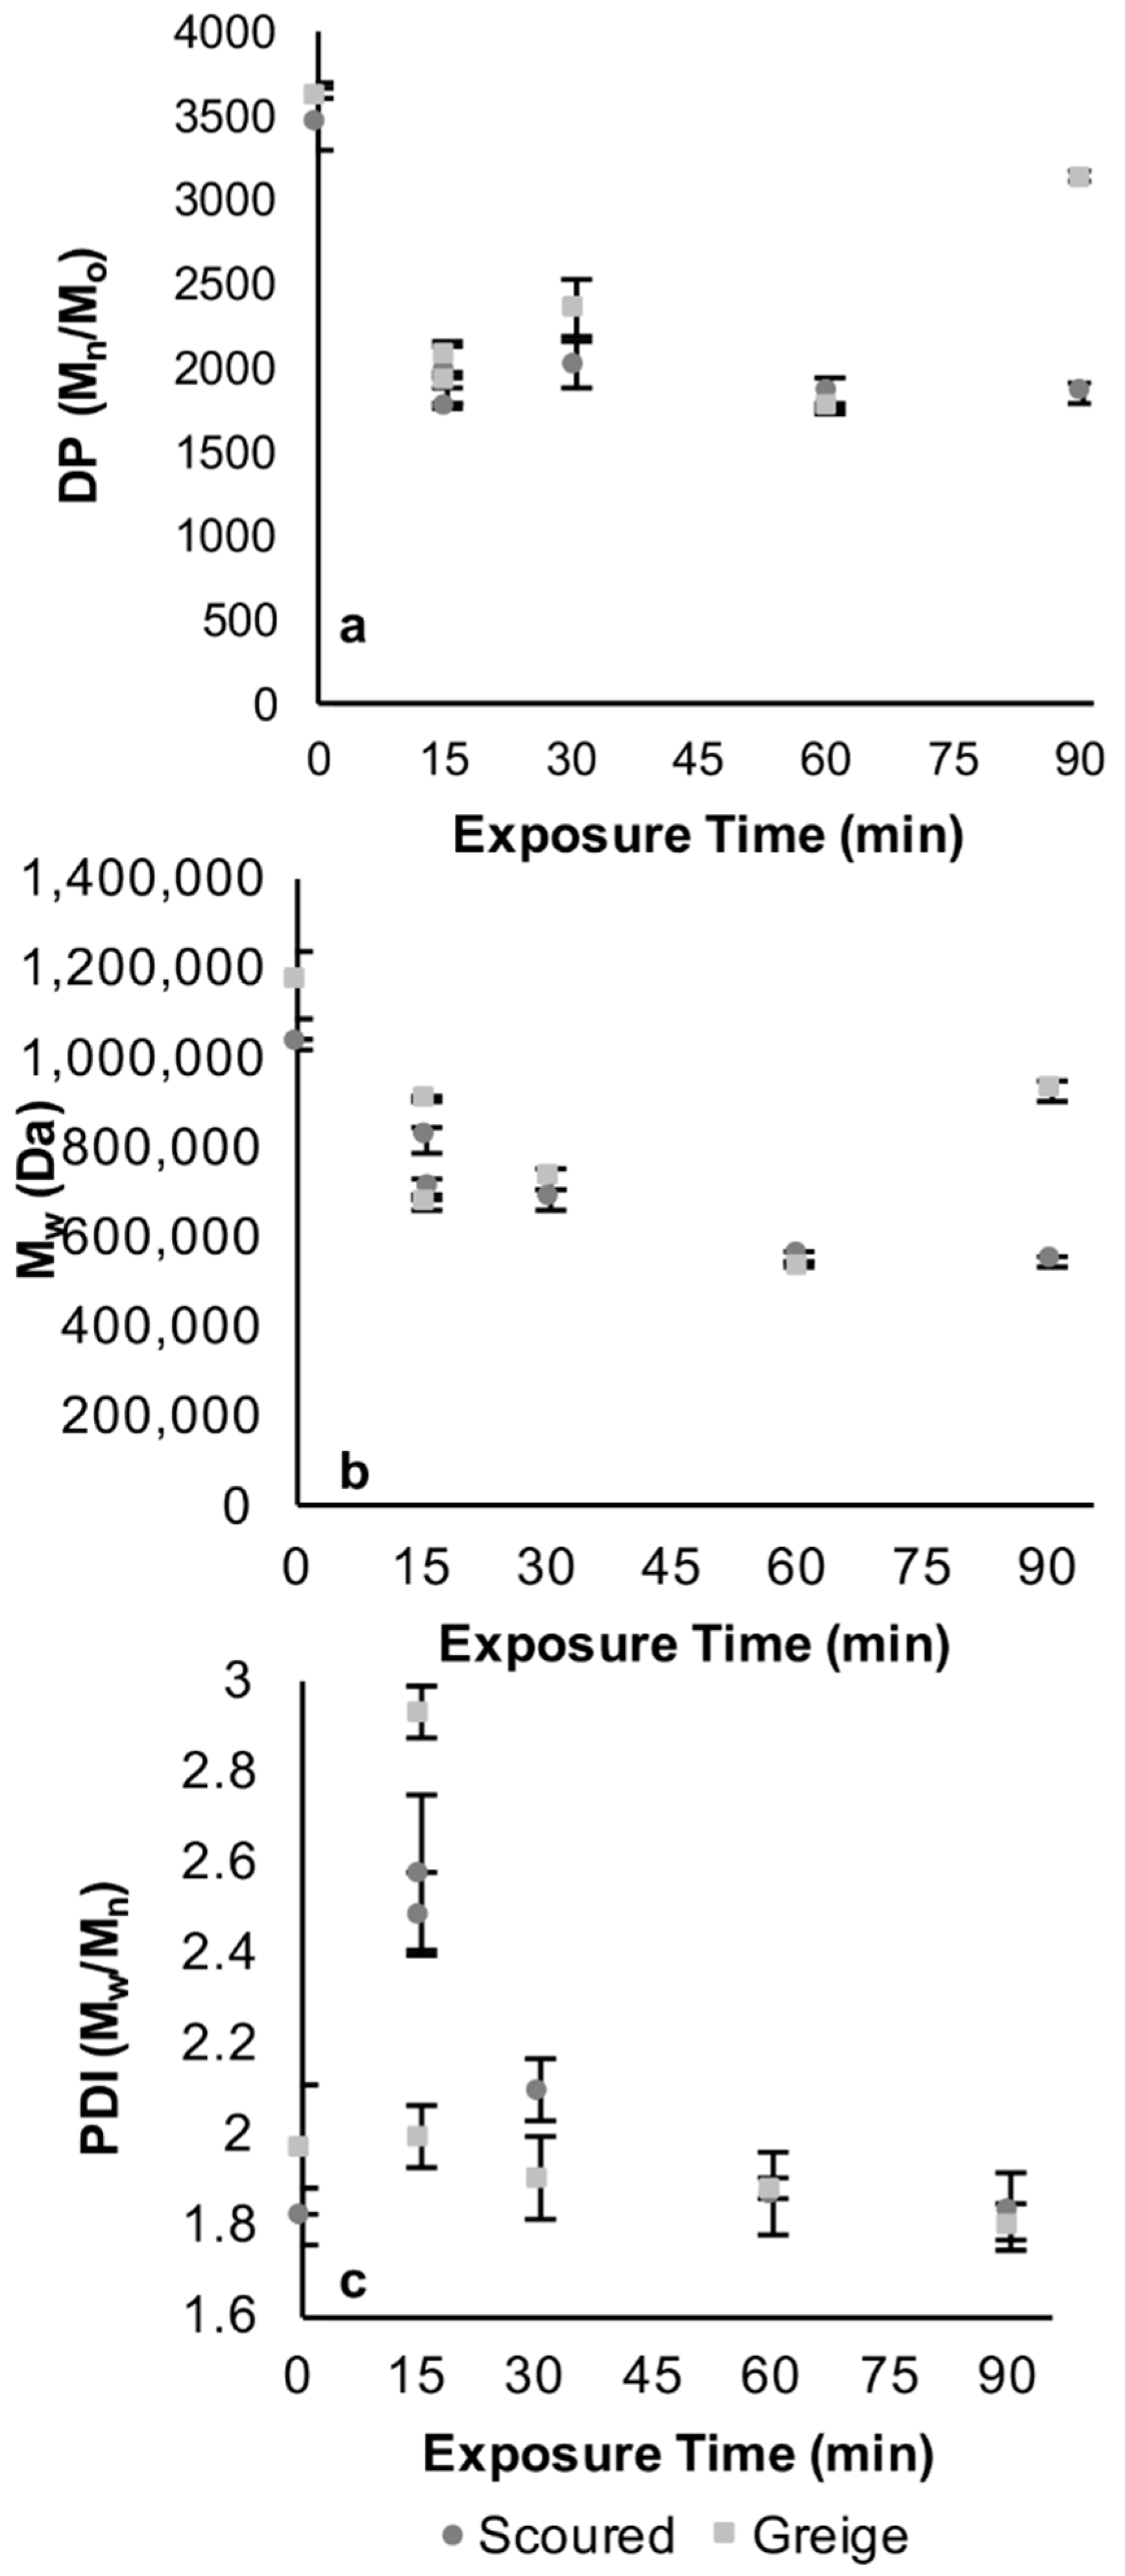
Considering the number of average molecular (Mn) values gathered by GPC, the degree of polymerization (DP) was calculated using Equation (1). The DP decreased by approximately half for both greige and scoured yarns (Figure 4a). We attribute the decrease in DP to main chain scissions [20]. In addition, the weight-average molecular weight (Mw) decreased significantly for plasma treated samples, compared to control greige and scoured yarns (Figure 4b).
As an indicator of the amount of variability in the types of polymers (i.e., heterogeneity index) comprising the fiber, the polydispersity index (PDI) stayed around 1.8–2, with the exception of 15 min where it increased (Figure 4c). This increase in PDI can be explained by the onset of cellulosic degradation. Again, breakage was first observed visually at 15 min of O2 plasma treatment at 200 cc/min for greige and scoured yarns. With an exposure time of 15 min and a flow rate of 75 cc/min, scoured yarn differed from the greige yarn by having a lower load at break compared to its control, and although there were no visual breakages observed for the scoured yarn at these conditions, polymer degradation had occurred as evidenced by SEM, mechanical testing, and GPC. Further increases in plasma exposure time past the onset of degradation narrowed the PDI.
3.4. Evaluation of C1s Deconvoluted Peaks
We implemented XPS to investigate the low-resolution survey scans for the non-cellulosic components present on yarns (calcium, potassium, and nitrogen). Calcium and potassium are two of the most abundant metals naturally found in cotton [21]. Interestingly, however, potassium was present only for greige yarns, and only after they were treated with plasma exposure; this was evident in the low-resolution survey scans as well as high-resolution C1s scans. Due to the scouring process that was used to remove contaminants, the presence of potassium only in greige yarns is reasonable. Example high resolution scans and deconvoluted peaks are shown in Supplemental Figure S1. With the low quantity of calcium, nitrogen, and potassium components, we did not consider their contribution when determining the O:C atomic ratio in high resolution scans. For cellulose, the theoretical O:C atomic ratio was 0.83. For our control greige and scoured yarns, the O:C atomic ratio was 0.136 and 0.258, respectively (Table 2). These low atomic ratios were the result of waxes and other contaminants present at the surface of fibers. The scoured yarns had a slightly higher atomic ratio than the greige yarns due to their scouring process which removes, but does not eliminate, waxes and contaminants. Aside from our high power density, our shortest plasma exposure time of 15 min is relatively long compared to other studies; therefore, we saw a large increase in the O:C atomic ratio immediately. This value for greige yarns eventually increased above the theoretical value of 0.83, which was due to the O2 plasma that introduced more oxygenated species at the yarn surfaces.
In addition to the O:C atomic ratio, the high resolution C1s peak of cellulose provided further information about the chemical nature at the yarn surfaces; we evaluated the % areas of deconvoluted peaks C1–C4 (Table 2). We assigned C1 (C-C/C-H bonds) at 285.0 eV, C2 (C-O bonds) at 286.6 ± 0.1 eV, C3 (C=O/O-C-O) at 288.0 ± 0.1 eV, and C4 (O-C=O) at 289.0 ± 0.1 eV [15]. Through the evaluation of the C1s peak, the chemical changes occurring at the surface of the fibers can be determined in relation to plasma exposure. The C1 peak decreased with plasma exposure as the C-C and C-H contaminants were being removed by the plasma process. For the most part, we found that C2–C4 increased compared to control yarns, as more polar groups were forming as the result of the plasma treatment [15,19]. Other researchers have attributed the increase of oxygen moieties present at cellulose surfaces to the increase in hydrophilicity often observed on cotton after plasma exposure [15,16]. While we did not observe the expected decrease in C-O bonds that is attributed to main chain scissions [20], we were using O2 plasma at significantly longer exposure times in comparison to other studies; this is our reasoning for why we saw such high percentages of C-O compared to our controls.
4. Conclusions
Using O2 plasma with high power density and extended treatment times of 15 min to 90 min, we are able to link the physical degradation observed in yarns to the degradation of cellulose structure. Based on the evidence here, we can say that treatment times of 60–90 min for greige yarns, and 30–90 min for scoured yarns yields a significant amount of physical and chemical degradation of cellulose. We found a decrease in the load at break for greige and scoured cotton yarns by approximately 80% and 90%, respectively. We start with high Mw and DP of cellulose and are able to reduce both by roughly 50%. Although the DP is still quite high, plasma may be used as a “greener” pre-treatment to degrade high molecular weight cellulose for its potential use in biofuels. We also found differences in the surface chemistry of cotton with plasma exposure, as verified by X-ray Photoelectron Spectroscopy, showing the greater amount of oxygenated species as a result of the O2 plasma treatment at the yarn surfaces.
Supplementary Materials
The following are available online at https://www.mdpi.com/2079-6439/6/3/61/s1, Table S1: All experimental conditions performed on greige and scoured yarns, Video S1: Video of the visual degradation of yarns after 90 min of O2 plasma treatment using a power density of 0.46 W/cm2, Figure S1: XPS data of C1s with four deconvoluted peak fittings for (a) control greige yarn, (b) control scoured yarn, (c) greige yarn treated at 0.46 W/cm2 for 60 min, and (d) scoured yarn treated at 0.46 W/cm2 for 60 min.
Author Contributions
Conceptualization, L.M.S. and M.W.F.; Data curation, L.M.S.; Formal analysis, L.M.S.; Funding acquisition, M.W.F.; Investigation, L.M.S.; Methodology, L.M.S. and M.W.F.; Project administration, M.W.F.; Resources, M.W.F.; Supervision, M.W.F.; Validation, L.M.S.; Writing—original draft, L.M.S.; Writing—review & editing, L.M.S. and M.W.F.
Funding
Monsanto Company and the College of Human Ecology at Cornell University provided funding for this research. This work made use of the Cornell Center for Materials Research Shared Facilities which are supported through the NSF MRSEC program (DMR-1719875).
Acknowledgments
We thank Plasma Etch, Inc. for onsite assistance with sample processing. We acknowledge PolyAnalytik, Inc. for performing GPC experiments and providing experimental values. We recognize Jon Shu for running XPS analysis on cotton yarns and Darren Dale for aiding in the analysis. We also appreciate contributions from Alan Taylor and Catharine Catranis.
Conflicts of Interest
The authors declare no conflict of interest.
References
- Mu, B.; Xu, H.; Yang, Y. Accelerated hydrolysis of substituted cellulose for potential biofuel production: Kinetic study and modeling. Bioresour. Technol. 2015, 196, 332–338. [Google Scholar] [CrossRef] [PubMed] [Green Version]
- Horn, S.; Vaaje-Kolstad, G.; Westereng, B.; Eijsink, V.G. Novel enzymes for the degradation of cellulose. Biotechnol. Biofuels 2012, 5, 45. [Google Scholar] [CrossRef] [PubMed]
- Lin, J.-H.; Chang, Y.-H.; Hsu, Y.-H. Degradation of cotton cellulose treated with hydrochloric acid either in water or in ethanol. Food Hydrocoll. 2009, 23, 1548–1553. [Google Scholar] [CrossRef]
- Mukherjee, S.M.; Woods, H.J. X-ray and electron microscope studies of the degradation of cellulose by sulphuric acid. Biochim. Biophys. Acta 1953, 10, 499–511. [Google Scholar] [CrossRef]
- Morent, R.; De Geyter, N.; Vershuren, J.; De Clerck, K.; Kiekens, P.; Leys, C. Non-thermal plasma treatment of textiles. Surf. Coat. Technol. 2008, 202, 3427–3449. [Google Scholar] [CrossRef]
- Pekárek, S. Non-Thermal Plasma Ozone Generation. Acta Polytech. 2003, 43, 47–51. [Google Scholar]
- Bhat, N.V.; Netravali, A.N.; Gore, A.V.; Sathianarayanan, M.P.; Arolkar, G.A.; Deshmukh, R.R. Surface modification of cotton fabrics using plasma technology. Text. Res. J. 2011, 81, 1014–1026. [Google Scholar] [CrossRef]
- Peng, S.; Gao, Z.; Sun, J.; Yao, L.; Qiu, Y. Influence of argon/oxygen atmospheric dielectric barrier discharge treatment on desizing and scouring of poly (vinyl alcohol) on cotton fabrics. Appl. Surf. Sci. 2009, 255, 9458–9462. [Google Scholar] [CrossRef]
- Benoit, M.; Rodrigues, A.; De Oliveira Vigier, K.; Fourré, E.; Barrault, J.; Tatibouët, J.-M.; Jérôme, F. Combination of ball-milling and non-thermal atmospheric plasma as physical treatments for the saccharification of microcrystalline cellulose. Green Chem. 2012, 14, 2212. [Google Scholar] [CrossRef]
- Mihailović, D.; Šaponjić, Z.; Radoičić, M.; Lazović, S.; Baily, C.J.; Jovančić, P.; Nedeljković, J.; Radetić, M. Functionalization of cotton fabrics with corona/air rf plasma and colloidal tio2 nanoparticles. Cellulose 2011, 18, 811–825. [Google Scholar] [CrossRef]
- Hua, Z.Q.; Sitaru, R.; Denes, F.; Young, R.A. Mechanisms of oxygen- and argon-rf-plasma-induced surface chemistry of cellulose. Plasmas Polym. 1997, 2, 199–224. [Google Scholar] [CrossRef]
- Jinka, S.; Turaga, U.; Singh, V.; Behrens, R.L.; Gumeci, C.; Korzeniewski, C.; Anderson, T.; Wolf, R.; Ramkumar, S. Atmospheric Plasma Effect on Cotton Nonwovens. Ind. Eng. Chem. Res. 2014, 53, 12587–12593. [Google Scholar] [CrossRef]
- Karahan, H.A.; Ozdogan, E.; Demir, A.; Ayhan, H.; Seventekin, N. Effects of Atmospheric Pressure Plasma Treatments on Certain Properties of Cotton Fabrics. Fibres Text. East. Eur. 2009, 17, 19–22. [Google Scholar]
- Sun, D.; Stylios, G.K. Investigating the plasma modification of natural fiber fabrics-the effect on fabric surface and mechanical properties. Text. Res. J. 2005, 75, 639–644. [Google Scholar] [CrossRef]
- Inbakumar, S.; Morent, R.; De Geyter, N.; Desmet, T.; Anukaliani, A.; Dubruel, P.; Leys, C. Chemical and physical analysis of cotton fabrics plasma-treated with a low pressure dc glow discharge. Cellulose 2009, 17, 417–426. [Google Scholar] [CrossRef]
- Karahan, H.A.; Ozdogan, E. Improvements of surface functionality of cotton fibers by atmospheric plasma treatment. Fibers Polym. 2008, 9, 21–26. [Google Scholar] [CrossRef]
- Topalovic, T.; Nierstrasz, V.A.; Bautista, L.; Jocic, D.; Navarro, A.; Warmoeskerken, M.M.C.G. Xps and contact angle study of cotton surface oxidation by catalytic bleaching. Colloids Surf. A Physicochem. Eng. Asp. 2007, 296, 76–85. [Google Scholar] [CrossRef]
- Sun, D.; Stylios, G.K. Fabric surface properties affected by low temperature plasma treatment. J. Mater. Process. Technol. 2006, 173, 172–177. [Google Scholar] [CrossRef]
- Vasiljević, J.; Gorjanc, M.; Jerman, I.; Tomšič, B.; Modic, M.; Mozetič, M.; Orel, B.; Simončič, B. Influence of oxygen plasma pre-treatment on the water repellency of cotton fibers coated with perfluoroalkyl-functionalized polysilsesquioxane. Fibers Polym. 2016, 17, 695–704. [Google Scholar] [CrossRef]
- D’Agostino, R.; Favia, P.; Fracassi, F. Plasma Processing of Polymers; Kluwer Academic Publishers: Dordrecht, The Netherlands, 1997. [Google Scholar]
- Brushwood, D.E.; Perkins, H.H. Determining the metal content of cotton. Text. Chem. Color. 1994, 26, 32–35. [Google Scholar]
Figure 1.
(a) Control cotton yarn with no plasma exposure and no visual yarn breakages and (b) the visual breakages observed after plasma degradation of yarns exposed to 90 min plasma exposure at 0.46 W/cm2.
Figure 1.
(a) Control cotton yarn with no plasma exposure and no visual yarn breakages and (b) the visual breakages observed after plasma degradation of yarns exposed to 90 min plasma exposure at 0.46 W/cm2.

Figure 2.
(left) Field Emission Scanning Electron Microscopy (FE-SEM) images of scoured yarn treated at 75 cc/min and 200 cc/min oxygen flow rate and 0.46 W/cm2 power density, with increasing exposure time (right) FE-SEM images of greige yarn treated at 75 cc/min and 200 cc/min oxygen flow rate and 0.46 W/cm2 power density, with increasing exposure time.
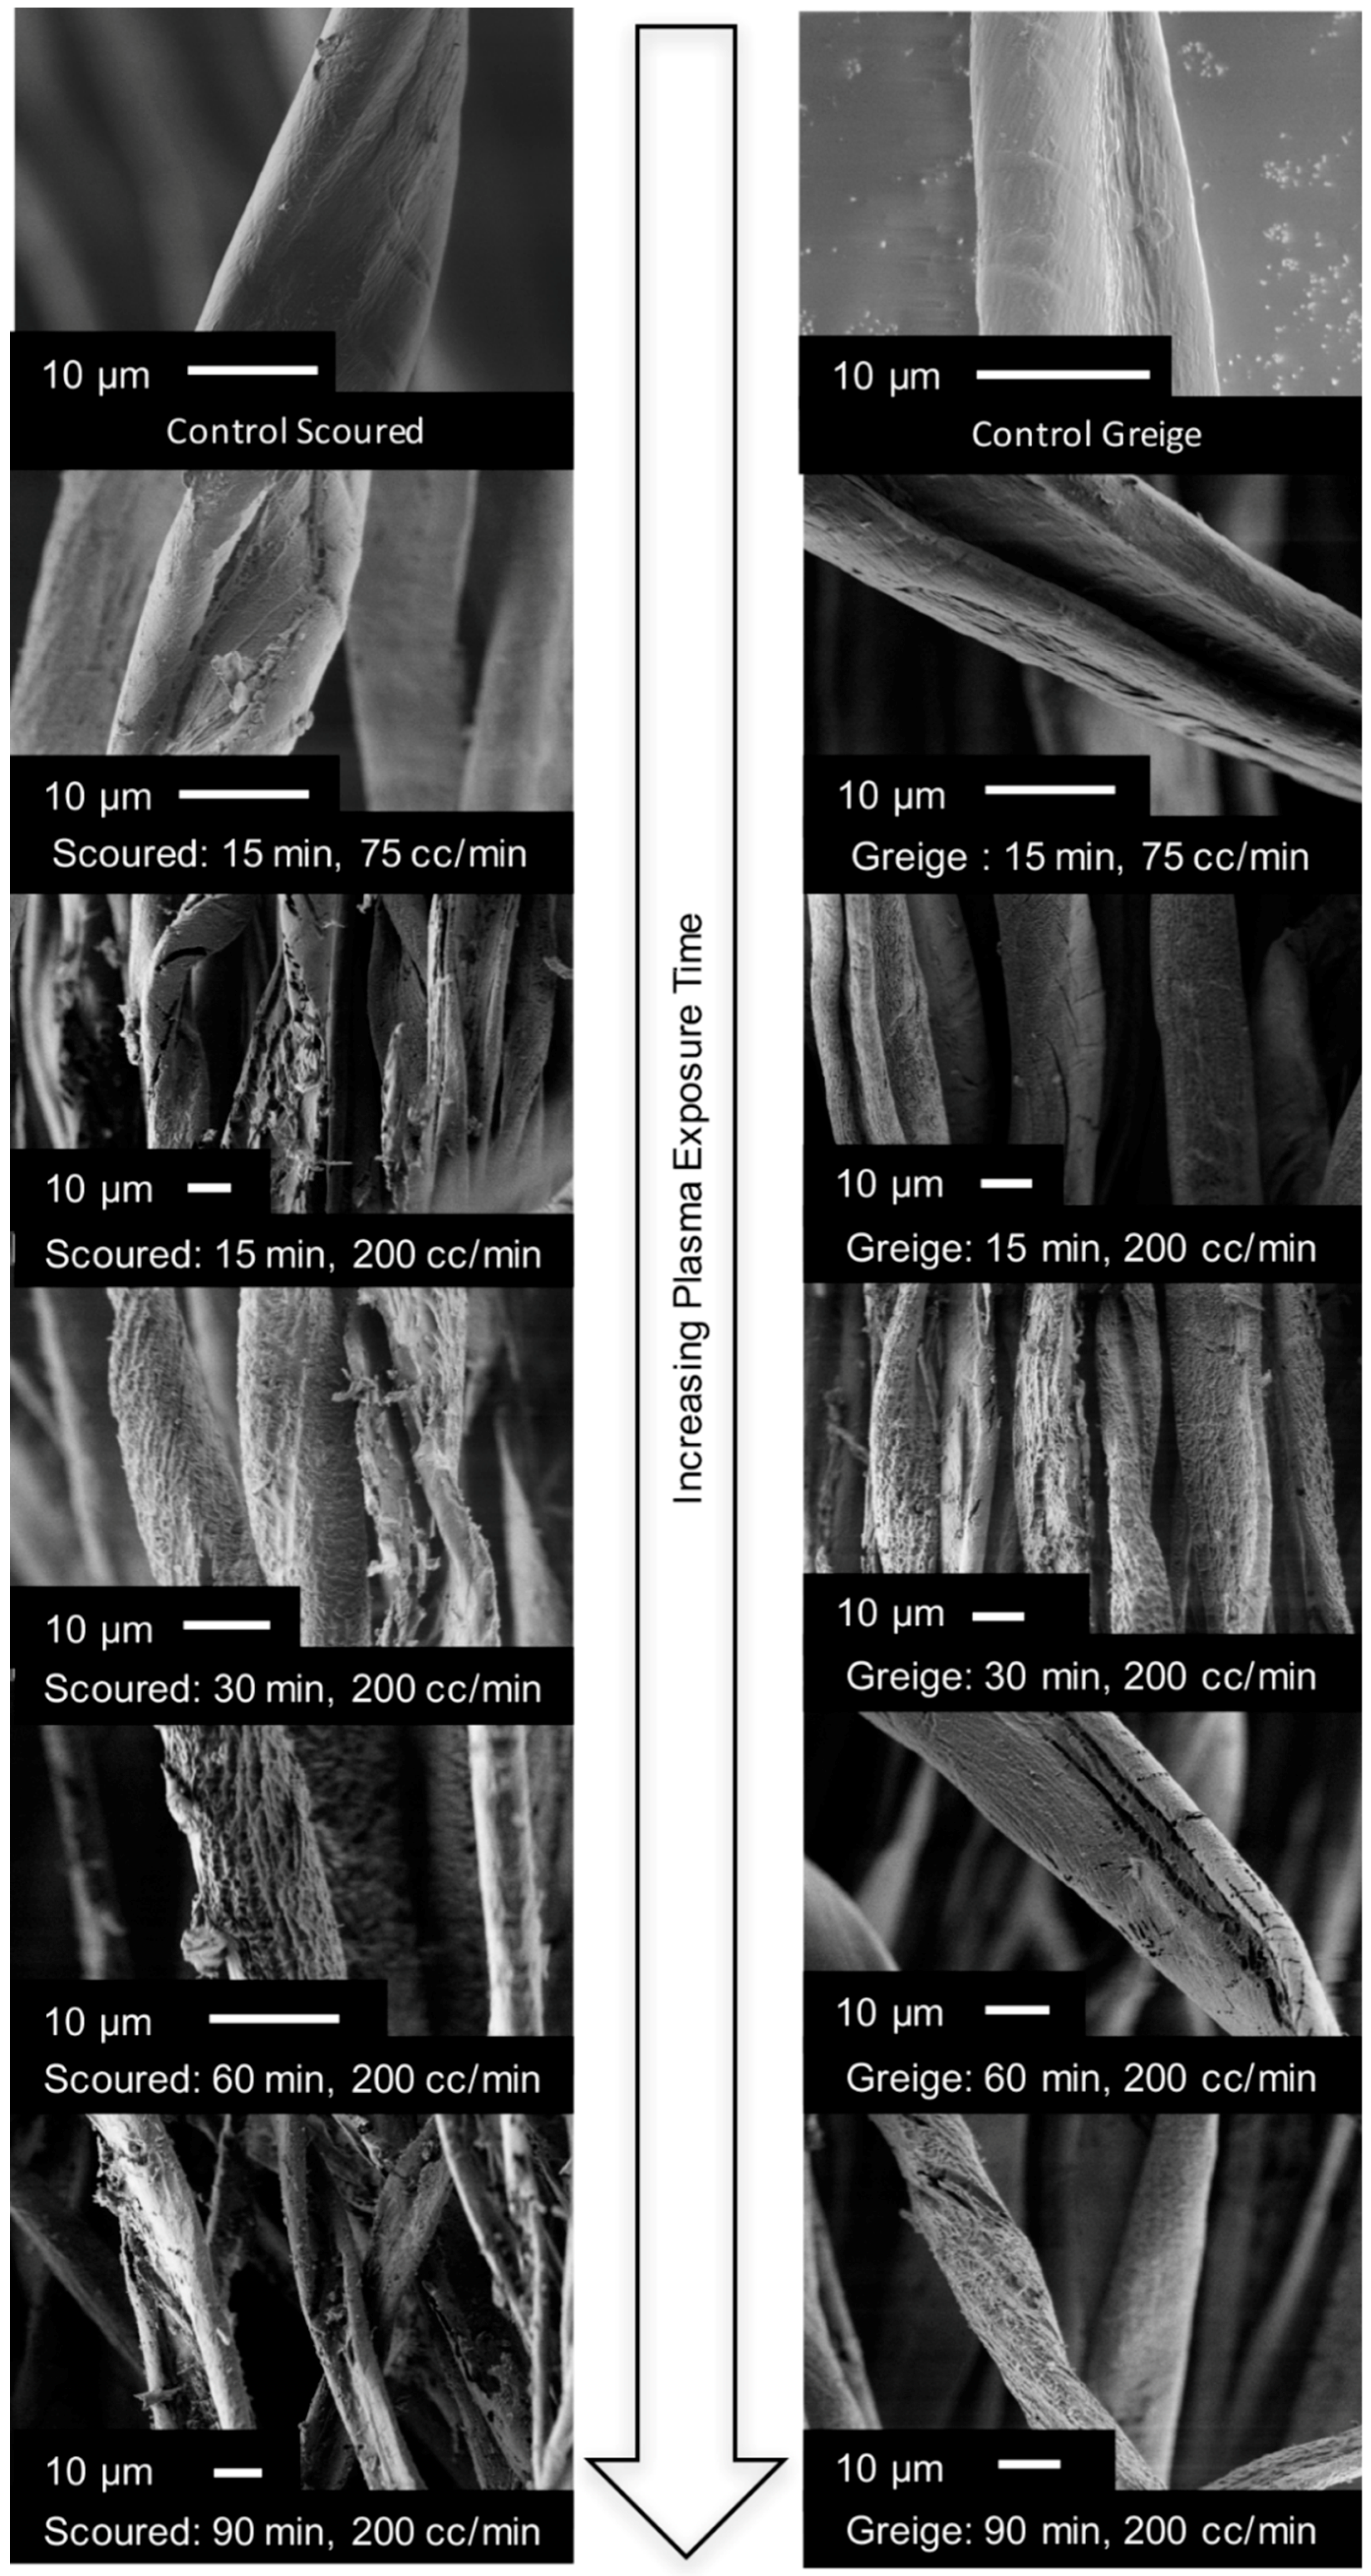
Figure 3.
Load at break for yarns treated with O2 plasma normalized by breaking the load at break of control yarns: (a) greige yarn and (b) scoured yarn (plasma exposures using 0.46 W/cm2 at (i) 15 min, (ii) 30 min, (iii) 60 min, and (iv) 90 min. Bars = standard deviations).
Figure 3.
Load at break for yarns treated with O2 plasma normalized by breaking the load at break of control yarns: (a) greige yarn and (b) scoured yarn (plasma exposures using 0.46 W/cm2 at (i) 15 min, (ii) 30 min, (iii) 60 min, and (iv) 90 min. Bars = standard deviations).

Figure 4.
At 0.46 W/cm2 power density, the effect of plasma exposure duration on the (a) degree of polymerization (DP); (b) weight-average molecular weight, and (c) polydispersity, as determined by GPC, Bars = standard deviations. Mw = molecular weight. PDI = polydispersity index.
Figure 4.
At 0.46 W/cm2 power density, the effect of plasma exposure duration on the (a) degree of polymerization (DP); (b) weight-average molecular weight, and (c) polydispersity, as determined by GPC, Bars = standard deviations. Mw = molecular weight. PDI = polydispersity index.

Table 1.
Oxygen plasma conditions tested in the PE200RIE machine on greige and scoured yarns.
| Exposure Time (min) | Radio Frequency (RF) Power (W) | Power Density (W/cm2) | O2 Flowrate (cc/min) |
|---|---|---|---|
| 15 | 500 | 0.46 | 75 |
| 15 | 500 | 0.46 | 200 |
| 30 | 500 | 0.46 | 200 |
| 60 | 500 | 0.46 | 200 |
| 90 | 500 | 0.46 | 200 |
Table 2.
X-ray Photoelectron Spectroscopy (XPS) C1s deconvoluted peak percent areas (C1, C2, C3, and C4) and the O1s and C1s atomic % ratio for greige and scoured yarns treated at 0.46 W/cm2 power density.
Table 2.
X-ray Photoelectron Spectroscopy (XPS) C1s deconvoluted peak percent areas (C1, C2, C3, and C4) and the O1s and C1s atomic % ratio for greige and scoured yarns treated at 0.46 W/cm2 power density.
| Yarn Type | Exposure Time (min) | C-C/C-H (C1) (%) | C-O (C2) (%) | C=O/O-C-O (C3) (%) | O-C=O (C4) (%) | O:C Atomic Ratio |
|---|---|---|---|---|---|---|
| Greige | 0 | 84.6 | 10.0 | 5.47 | 0 | 0.136 |
| 15 a | 40.2 | 36.8 | 12.1 | 10.9 | 0.748 | |
| 15 | 47.4 | 27.3 | 14.5 | 10.8 | 0.733 | |
| 30 | 44.1 | 32.6 | 11.7 | 11.5 | 0.782 | |
| 60 | 32.2 | 38.9 | 4.61 | 14.3 | 0.852 | |
| 90 | 32.9 | 40.8 | 18.7 | 7.63 | 0.929 | |
| Scoured | 0 | 72.1 | 18.8 | 6.38 | 2.75 | 0.258 |
| 15 a | 43.0 | 33.8 | 10.5 | 12.7 | 0.582 | |
| 15 | 38.2 | 37.9 | 11.4 | 12.5 | 0.754 | |
| 30 | 45.8 | 32.9 | 11.1 | 10.2 | 0.620 | |
| 60 | 29.8 | 44.2 | 14.2 | 11.8 | 0.800 | |
| 90 | 30.9 | 42.9 | 13.3 | 12.9 | 0.765 |
C1–C4 are rounded to three significant figures and a represents yarns treated at 75 cc/min oxygen flowrate.
© 2018 by the authors. Licensee MDPI, Basel, Switzerland. This article is an open access article distributed under the terms and conditions of the Creative Commons Attribution (CC BY) license (http://creativecommons.org/licenses/by/4.0/).
Share and Cite
MDPI and ACS Style
Shepherd, L.M.; Frey, M.W. The Degradation of Cellulose by Radio Frequency Plasma. Fibers 2018, 6, 61. https://doi.org/10.3390/fib6030061
AMA Style
Shepherd LM, Frey MW. The Degradation of Cellulose by Radio Frequency Plasma. Fibers. 2018; 6(3):61. https://doi.org/10.3390/fib6030061
Chicago/Turabian StyleShepherd, Larissa Marie, and Margaret Wilde Frey. 2018. "The Degradation of Cellulose by Radio Frequency Plasma" Fibers 6, no. 3: 61. https://doi.org/10.3390/fib6030061
Note that from the first issue of 2016, this journal uses article numbers instead of page numbers. See further details here.