
Asymptotic Modeling of Optical Fibres: Annular Capillaries and Microstructured Optical Fibres


LSTME Busan, Busan 46742, Republic of Korea
*
Author to whom correspondence should be addressed.
Fibers 2023, 11(12), 104; https://doi.org/10.3390/fib11120104
Submission received: 27 October 2023
/
Revised: 22 November 2023
/
Accepted: 27 November 2023
/
Published: 1 December 2023
Abstract
:Microstructured optical fibres (MOFs) are a new type of optical fibres that possess a wide range of optical properties and many advantages over common optical fibres. Those are provided by unique structures defined by a pattern of periodic or quasi-periodic arrangement of air holes that run through the fibre length. In recent years, MOFs have opened up new possibilities in the field of optics and photonics, enabling the development of advanced devices and novel optical systems for different applications. The key application areas of MOFs vary from telecommunications and high-power energy transmission to quantum optics and sensing. The stack-and-draw method is a standard manufacturing technique for MOFs, where a preform is first manually created and then drawn in a sophisticated furnace into a fibre with the required final dimensions and position of the air holes. During the manufacturing process, experimenters can control only a few parameters, and mathematical models and numerical simulations of the drawing process are highly requested. They not only allow to deepen the understanding of physical phenomena occurring during the drawing process, but they also accurately predict the final cross-section shape and size of the fibre. In this manuscript, we assume thermal equilibrium between the furnace and the fibre and propose a functional form of the fibre temperature distribution. We utilise it with asymptotic mass, momentum, and evolution equations for free surfaces already available in the literature to describe the process of fibre drawing. By doing so, the complex heat exchange problem between the fibre and the furnace need not be solved. The numerical results of the whole asymptotic model overall agree well with experimental data available in the literature, both for the case of annular capillaries and for the case of holey fibres.
1. Introduction
Microstructured optical fibres (MOFs) are a novel kind of optical fibre that arose approximately thirty years ago and led to a revolution in the field of optical fibre technology. These fibres are notable for their ability to manipulate, guide, and control light, enabling a wide range of applications in different fields [1,2]. They contain a highly controlled and periodic array of air holes or voids of micron-scale size extending through the whole fibre length that is precisely designed and structured within the fibre. Light guidance within MOFs mainly occurs by two mechanisms, i.e., the index guiding or the photonic bandgap (PBG) effect. The former is achieved by replacing one or more air capillaries in the centre of the whole structure with solid glass rods, and it is essentially a modified form of the total internal reflection (TIR) mechanism since the resulting solid core region possesses a higher refractive index than the surrounding region laced with air holes. On the other hand, by removing one or more air capillaries from the centre of the air hole array or by replacing them with one air capillary of a different size, the PBG effect is obtained [3,4]. On the one hand, an example of solid core fibres is the suspended-core fibres (SCFs) where the core is suspended in the air by thin strands of glass linked to a solid object. On the other hand, hollow-core fibres (HCFs) are a type of MOF that exploits the PBG mechanism to guide light. HCFs guide light mostly within a hollow region and only a small portion of light propagates in the solid material of the fibre. MOFs are highly versatile and flexible and allow us to obtain a wide range of optical properties that are not possible to be realized with conventional optical fibres. This is possible since the arrangement and the sizes of the air holes and the crystal lattice constant can be suitably adjusted to select the guidance of specific modes. MOFs are widely employed in high-power and energy transmission [5,6], fibre amplifiers [7], Brillouin scattering [8], supercontinuum generation [9], optical communications [10], stimulated Raman scattering [11], and optical sensors [12,13], among others. Specifically, SCFs are used to build gas and liquid sensing devices for chemical and biological applications [14], interferometer temperature sensors [15], and for nonlinear applications such as supercontinuum generation (SCG) [16,17]. Instead, HCFs find applications in nonlinear gas fibre optics [18], gas and optical fibre sensing [19], laser beam delivery, and optical communications [20].
The first step of the MOF manufacturing process is to create definite structures called preforms, which are macroscopic versions of the final fibre structures containing periodic patterns of air holes in their cross-section. A popular and versatile technique utilised to create preforms is the stack-and-draw method, where drawn capillary tubes and solid rods are precisely aligned, stacked, and fastened together. This method allows structures with a complex pattern of air holes to be easily, flexibly, and quickly manufactured. Subsequently, preforms are heated and drawn in high-tech furnaces into long and thin fibres known as canes or preform canes. These structures do not attain the required final fibre dimensions and one or more drawing stages are required to obtain the final size. The hole dimensions and positions within a fibre structure are of paramount importance to obtain a device with specific optical properties, and only small variations concerning the hole size and locations are allowed. Deviations from the designed structure may lead to a fibre with undesired optical characteristics. The alteration of the shape and the size of holes during the drawing process or even their collapse may occur due to the complex interplay between the surface tension effects and the stress redistribution within the fibre. Often, internal pressurization is utilized to avoid hole collapse and to precisely control the size of the holes. In general, the fabrication of MOFs is a complex process that requires great ability, precision, control, and expertise to preserve the required highly regular fibre structure from the beginning to the end of the drawing. Experimentally, only a few parameters can be controlled, that is, the peak temperature of the furnace, the feed and drawing speed, and the value of the internal pressurization. Usually, many preform canes are utilized for the development of new fibre structures and for process optimization. However, this experimental trial-and-error routine is costly and time-consuming. This burden motivated the development of many mathematical models and utilization of numerical simulations that describe the drawing process over the years since they can potentially reduce the experimental costs and improve the physical understanding of the whole process.
Modelling of drawing of axis-symmetric molten threads was first driven by the spinning of synthetic fibres for textiles. To this end, Matovich and Pearson [21], Peak and Runk [22], Glicksman [23], and Myers [24] utilized a perturbation approach to derive one-dimensional models that included asymptotic mass, momentum, and energy equations with an increasing degree of sophistication. Modelling of drawing of axis-symmetric optical fibres has been undertaken by Yarin [25], Fitt et al. [26], and Luzi [27,28], among others. They derived one-dimensional models using an asymptotic expansion in terms of the small fibre aspect ratio. They investigated the effects of inertia, gravity, surface tension, and inner pressurization in the process of fibre drawing and demonstrated that an appropriate choice of furnace temperature distribution permits obtaining a good concordance between experimental trials and numerical results. Subsequently, Voyce et al. [29,30] integrated the effect of fibre rotation into the model of Fitt et al. [26]. Preform rotation is a very useful means to control fibre size and optical effects. More recently, Taroni et al. [31], and Luzi et al. [32] extended the work by Fitt et al. [26] by deriving asymptotic energy equations both for a solid fibre and a capillary to investigate the relevance of conduction, convection, and radiation phenomena in the drawing process. All these models mentioned so far have been derived in an Eulerian reference frame, where fibre drawing is a steady-state problem. Despite the fact that the formulation of the problem in the Eulerian coordinate system greatly simplifies the original full three-dimensional problem in the case of axis-symmetric geometries, it is not suitable for non-axis-symmetric geometries.
On the other hand, the utilization of a Lagrangian coordinate system with an asymptotic approach allows for modeling fibres with general cross-sectional shapes. Works in this direction have been initiated by Dewinne et al. [33,34], who modelled the drawing of a solid viscous thread with an arbitrary cross-sectional shape. In their works, they neglected the presence of surface tension, but they examined the effects of inertia and gravity. Griffiths and Howell [35,36] investigated the evolution of a thin annular two-dimensional fluid region retaining the effects of surface tension and applied pressure. Cummings and Howell [37], Stokes et al. [38] and Chen et al. [39] developed an asymptotic formulation for modelling the fibre drawing process. To this end, they employed a Lagrangian reference frame with asymptotic techniques and a reduced time variable . By doing so, they showed that the full three-dimensional problem can be split into a one-dimensional axial-stretching problem and a two-dimensional Stokes flow free-boundary problem driven by unit surface tension and unit viscosity. Both problems are coupled by the whole length of the cross-sectional perimeter. This formulation is very general and applies to fibres with any cross-sectional shape and variable viscosity. Furthermore, it allows for including the effects of the inner pressurization as well. Subsequently, Stokes et al. [40] derived a three-dimensional asymptotic energy equation and included it in their previous models. To simplify the treatment of the cross-sectional problem, Buchak et al. [41] proposed the generalized elliptical pore model (GEPM) to model the drawing process of fibres containing many holes. This model is based on the complex variable formulation of the cross-plane problem and the utilization of inner–outer-matched asymptotic expansions. Assuming an elliptical shape of the holes that compose the fibre cross-section, their evolution is dictated by the solution of a set of nonlinear ordinary integrodifferential and algebraic equations. The GEPM is an extension of the model developed by Crowdy [42] to investigate the evolution of a two-dimensional inviscid elliptical bubble. In the case of fibres with arbitrary cross-sectional hole shapes, the numerical scheme proposed by Buchak and Crowdy [43] allows for a precise representation of evolving free surfaces of arbitrary shape even with extreme curvature gradients.
Alternatively, the drawing process of optical fibres with an arbitrary cross-sectional shape can also be simulated using the finite-element method (FEM). To this end, Xue et al. [44,45,46], and Luzi et al. [47] carried out numerical computations of the drawing process of optical fibres with a handful of holes, examining how the hole shape changes throughout the drawing due to the complex interplay among surface tension, inner pressure, and redistribution of viscous stresses. Luzi et al. [47] showed that a good agreement between experiments and numerical simulations can be achieved by specifying a suitable furnace temperature profile. However, three-dimensional FEM simulations are computationally expensive, and high-performance computers (HPCs) are usually required. On the contrary, Chen et al. [48] showed that the coupling between asymptotic techniques and the numerical method proposed by Buchak and Crowdy [43] leads to an enormous reduction in the computational time compared to the FEM simulations. The agreements between numerical results and experimental trials are superior to those obtained using the FEM. In a different contribution, Chen et al. [49] used the formulations proposed by Stokes et al. [38] and Chen et al. [39] to predict the drawing process of six annular preforms under a wide range of operating conditions including internal pressurization. The results of their simulations agree well with experimental trials. These examples demonstrate that the asymptotic approach constitutes a powerful modelling tool for describing the fibre drawing process.
In this manuscript, we model the drawing process of silica glass annular capillaries and holey fibres both in the absence and in the presence of internal pressurization using the asymptotic models of Stokes et al. [38], Chen et al. [48], and Buchak et al. [41]. To this end, we do not model the thermal effects due to the heat transfer during the drawing process, but we include them in the viscosity model by specifying a suitable functional form of the fibre temperature profile. The assumption of thermal equilibrium between the furnace walls and the fibre during the drawing process is only realistic for fibre velocities of the order of magnitudes of the feeding speeds [30,32]. Nevertheless, we demonstrate here that a good accordance between experimental and numerical results can be achieved by a suitable specification of the fibre temperature profile. The remainder of the manuscript is organized as follows. In Section 2, we expose the theoretical formulation of the problem, providing a concise description of the mass, momentum, and of corresponding boundary conditions that govern the drawing process of annular capillaries and holey fibres. In Section 3, we compare the numerical results with experimental data available in the literature, and in Section 4, we discuss the results, the limitations of the present approach, and hypothesize modalities for its improvement.
2. Model Description
2.1. Three-Dimensional Model
We consider the problem of a fibre preform that enters the top inlet of a furnace with a constant feeding speed . The fibre is heated inside the oven and is pulled from the bottom so that it reaches a final fixed speed at the exit of the furnace. The fibre cross-section has many air holes which greatly shrink during the drawing process and gradually attain the required final size at the outlet of the oven. The drawing process is depicted in Figure 1. To model the drawing process of MOFs, we start from the three-dimensional mass and momentum equations written in the Cartesian coordinate system and we assume an incompressible Newtonian fluid [50].
The origin of the coordinate system is located in the middle of the inlet of the furnace and in the geometrical centre of the fibre cross-sectional area at the entrance of the oven. y and z are the coordinates in the cross-sectional plane and x is the coordinate in the drawing direction. and p denote the velocity vector and the pressure of the fluid. t, and are the time, density, and the stress tensor of the fluid, respectively. reads
where represents the dynamic viscosity of the fluid. The two terms on the left-hand side of Equation denote the temporal and convective inertial acceleration. The three terms on the right-hand side represent the pressure gradient, the divergence of the stress tensor, and the sum of the body forces. The kinematic and stress conditions read
where denotes the external free surface of the fibre and , indicates the free surface of each of the internal channels of the fibre. and are the applied internal pressurization and the local curvature of the ith free surface. The operator ∇ in Cartesian coordinates reads
where , , and denote the unit vectors in the x, y, and z direction, respectively. The unit normal vector , , may be written as
2.2. Non-Dimensionalization
Cumming and Howell [37], Stokes et al. [38] and Chen et al. [39] suggest the following scalings
to non-dimensionalize the mass and momentum equations and the kinematic and dynamic boundary conditions. L represents the length of a “hot zone” in the furnace where the viscosity of the glass is low enough to enable the drawing. denotes the glass viscosity at the softening point, and are the square of the cross-sectional area of the fibre at the entrance of the furnace and any location in the drawing direction, respectively. represents the total sum of the perimeters of the outer and inner cross-sectional free surfaces. Chen et al. [39] show that using this scaling, the mass and momentum equations assume the form
while the dynamic and kinematic boundary conditions are transformed into
and
and are the slenderness parameter and the Reynolds number. They read
2.3. Final Asymptotic Equations
Triggered by the work of previous researchers (Yarin et al. [25], Fitt et al. [26], Luzi et al. [27], Taroni et al. [31], Dewynne et al. [34], Cummings and Howell [37], Stokes et al. [38]), Chen et al. [39] performed a regular expansion of the unknown in terms of the parameter
Substituting these expressions into (5), (6a), (6b), (6c), (7a), (7b), (7c) and (8), and assuming that , Chen et al. [48] obtained at the zeroth order the following mass and momentum equations
From Equation (10b), the eigensolution follows. The kinematic and dynamic boundary conditions at the zeroth order read
for . assumes the form
for more details, see Chen et al. [39]. To obtain the leading-order model for the axial flow, Cummings and Howell [37], Stokes et al. [38] and Chen et al. [39] show that it is necessary to proceed with the asymptotic expansion up to the order
Integrating now Equations (13a) and (13b) in the cross-sectional plane and applying the divergence theorem, one obtains after lengthy algebraic manipulations [38,39]
where
is the difference between the area encompassed by the external boundary and the sum of the areas encompassed by the internal boundaries. Since the inertia terms can be neglected. In addition, we consider the case where the internal channel pressurization is constant. Therefore, Equation (14) reduces to
Equation (15) can be written in a Lagrangian reference frame where the problem is unsteady as
where is the material derivative and is the scaled pulling tension of the fibre . To this end, Stokes et al. [38] integrated the kinematic condition Equation (11a) in the cross-sectional plane and utilized the zeroth order continuity equation, i.e., Equation (10a).
2.3.1. Leading-Order Model for the Transverse Flow
Stokes et al. [38,40] and Chen et al. [39] proposed the following coordinate system
for the transverse flow in the cross-sectional plane. By doing so, neither rigid-body translation nor rotation of each cross-section is assumed. The pressure and velocity components in the cross-sectional plane in this new coordinate system transform as follows
In turn, the leading-order equations for the mass, momentum, kinematic, and dynamic boundary conditions read
where Equations (19d), (19e) and (19f) are defined on . (19d) is written in terms of a “reduced time” defined as
which is referred to as the total deformation time of the draw [37,38,39]. Equations (19d), (19e) and (19f) constitutes a Stokes flow free-boundary problem defined in a region with unit viscosity, surface tension, and cross-sectional area. Using Equations (20) and (16) becomes
for more details see [37,38,39,40].
2.3.2. The Case of a Circular Tube
The asymptotic mass and momentum equations are first employed to model the drawing of capillaries. Chen et al. [39] naturally chose polar coordinates to recast Equations (19a), (19b), (19c), (19d), (19e) and (19f) for the cross-sectional plane flow. The outer and inner radii are indicated by and , respectively. is the ratio between the inner and the outer radii such that
The axial momentum equation, Equation (21), transforms as follows
and the cross-plane equations read
where , for more details see [38,39]. This system of equations can be solved for the radial component of the velocity and the pressure, and an evolution equation for the ratio between the inner and the outer diameter can be found
for more details, see Chen et al. [39].
2.3.3. The Cross-Plane Problem and the Complex Variable Formulation
The Stokes equations govern the steady free-boundary cross-plane problem
where the kinematic boundary conditions read
and the dynamic boundary conditions assume the form
where , , and , are the velocity vector, gradient, and Laplacian in the two-dimensional cross-sectional plane. is the normal velocity of the interface and the cross-plane stress tensor [51]. It can be shown that the two-dimensional problem described by Equations (25a) and (25b) can be formulated in terms of a stream function that satisfies
whose solution is
being and two Goursat functions that are analytic in the fluid region, and and are the standard complex variables. The fluid pressure , the vorticity , the velocity , and the rate-of-strain tensor may be written as
The dynamic boundary condition Equation (25d) assumes the form
for , and the kinematic boundary condition reads
where is the arclength of the boundary .
2.3.4. The Generalised Elliptical Pore Model (GEPM)
Buchak et al. [41] proposed the generalized elliptical pore model (GEPM) to simulate the drawing process of multi-hole fibres. It assumes that the n channels of an MOF are always elliptical during the evolution and exert a pressure , vorticity , and strain rate on the flow field. The Goursat functions and are defined as
and
so that the whole fluid flow region is described by a superposition of sources of strength and stresslets of strength that model the presence of the channels. In turn, the pressure term of Equation (27a) describes the influence of the outer free surface on the inner channels. In Equations (27a) and (27b), is the centroid of the nth channel. Buchak et al. [41] derived evolution equations for the channel centroids
and showed that the local pressure, vorticity, and strain rate exerted by the nth channel obey the following relationships
Assuming an elliptical shape of the channels in terms of complex variables
Buchak et al. [41] obtained evolution equations for the parameters and utilizing the method of inner–outer-matched asymptotic expansion
where
where and . and describe the orientation, eccentricity, and area of each channel during the evolution.
The outer boundary is modelled as and stays circular and centred at the origin during the evolution. Its evolution equation is
where , for more details see Buchak et al. [41].
2.3.5. Fibre Temperature Profile and Glass Viscosity
We select the following functional form of the fibre temperature distribution
where . is the furnace peak temperature and K represents the softening temperature of the glass. Furthermore, , , , and . By doing so, the fibre temperature distribution is centred in the middle of the “hot zone”, which is a small region of the oven where the temperature is high enough so that the glass melts and the drawing can occur. Moreover, we retain the length of the “hot zone” to be 12 [mm], as in our previous work. An example of the fibre temperature profile is presented in Figure 2, where the oven peak temperature is 2050 (C).
To set the dependence of the viscosity on the glass temperature, we select
if the temperature range is 1400 C 2500 C. Instead, we utilize
if the temperature range is . In Equations (33a) and (33b), the temperature T is in K and the viscosity is in as explained by Voyce et al. [30].
3. Results
3.1. Solution Methodology
We employ the robust fourth-order Runge–Kutta–Merson method to integrate Equation (24c) for the case of a single capillary and Equations (28), (31a) and (31b) for the case of multi-hole fibres. The parameters , , , , and are found by solving the algebraic equations Equations (29a), (29b), (31c) and (31d). The ratios DR 36-1, DR 54-15, and DR 72-2 are termed slow drawing ratios, and the ratios DR 1-102, DR 2-204, DR 3-306, DR 20-187, and DR 10-42 are termed high drawing ratios. The main initial values and the parameters used for the numerical computations are listed in Table 1.
The values of the glass parameters are in principle all dependent on the temperature. However, we only consider the dependency of the glass viscosity on the temperature since it is the only one that spans several orders of magnitude. In this work, all the governing differential equations are integrated with respect to and not with respect to , using a step size . By doing so, the simulations are very stable and it is not necessary to integrate them into a loop until the final stage of the drawing is achieved [40]. Instead, we integrate the system of equations iteratively until the value of the tension satisfies the condition
3.2. Annular Capillaries: Slow Drawing Ratios (SDRs)
We first consider the case DR 36-1 without internal pressurization to show the evolution of the axial velocity and the inner and outer fibre radii and in the drawing direction . Figure 3a shows that varies by several orders of magnitude in the “hot zone”. At the beginning of the “hot zone”, the values of the axial velocity are very low and close to the ones of the feeding speed until approximately ≈ 0.2. Subsequently, increases until it achieves the final value at approximately ≈ 0.9. The main variations in the values of the axial velocity occur in the part of the “hot zone” where the viscosity is low enough to allow the molten glass to flow. To obey the mass conservation equation, the fibre cross-section reduces its size, from values very close to ≈ 1 at the beginning of the “hot zone” down to ≈ 0.06 at the end of it. In Figure 4, we compare the external diameters of an annular capillary obtained numerically and experimentally for the three drawing ratios SDR 36-1, SDR 54-15, and SDR 72-2 without internal pressurization. We term these drawing ratios “slow drawing ratios” (SDRs), since the drawing speeds are significantly lower compared to the ones needed to draw fibres of commercially available size. We progressively increment the oven peak temperature from 1850 (C) up to 2050 (C) in steps of 25 (C). The differences between numerical and experimental results are very small since the discrepancies vary from a minimum of approximately 0.06% up to a maximum of approximately 3.5%, see Figure 4a–c. In Figure 5, we contrast the air-filling fractions obtained numerically and experimentally for the same SDRs considered in Figure 4. In this case, the numerical results only agree reasonably well with experimental data in the peak temperature range between 1850 (C) and 2000 (C), since the differences between them vary approximately from 0.14% up to a maximum of approximately 17.5%. In the case of higher oven peak temperatures, the discrepancies between numerical and experimental data can reach very high values. For instance, in the case of DR 36-1 and 2050 (C), the difference between the air-filling fraction obtained numerically and experimentally is approximately 61.2%. Since the fibre temperature correlation we propose in this work must encompass a wide range of peak temperatures, the fibre temperature is probably underestimated in the late stage of the drawing, especially in the case of high furnace peak temperatures. This leads to an overprediction of the viscosity of the glass and, consequently, of the fibre size.
Afterward, in Figure 6a,b, we analyze a case with internal pressurization. We fix the furnace peak temperature 1950 (C) and vary the internal pressure from 5 (mbar) to 25 (mbar) in steps of 2.5 (mbar). In Figure 6a we contrast the final external diameter and in Figure 6b the air-filling fractions of an annular capillary obtained both experimentally and numerically. As far as the external diameter of the capillary is concerned, the numerical data agree well with the experimental ones for the whole range of pressure values considered, since the maximum difference between experiments and computations is approximately 12%. Concerning the air-filling fractions, the concordance between experiments and simulations is very good in the pressure range 5 (mbar) < < 17.5 (mbar), since the discrepancies between numerical and experimental values achieve a maximum of approximately 18%. In the pressure range 20 (mbar) < < 25 (mbar) the agreement between experiments and simulations declines but it is still fair, reaching a maximum value of approximately 24%. The major deviations between experimental and numerical results occur as the value of the inner pressurization increases. This may be caused by the fibre temperature functional form used in this work, which may lead to an overestimation of the viscosity of the glass for the considered oven peak temperature. Consequently, the inner surface of the capillary computed numerically results less inflated than the real one under the effects of internal pressurization, and the final fibre size results under-predicted.
3.3. Annular Capillaries: High Drawing Ratios (HDRs)
In this section, we analyze the cases of three high drawing ratios (HDS), that is, DR 1-102, DR 2-204, and DR 3-306, both in the presence and the absence of internal pressurization. In these cases, the final size of an annular capillary reaches dimensions similar to those of commercially available standard optical fibres. The evolution of the axial component of the velocity, of the fibre cross-section, and the inner and outer radii are similar to those presented in Figure 3. Nevertheless, the variation between the initial and the final values is much steeper and occurs in a shorter distance [32]. As we have conducted previously, we begin the comparison between experiments and simulations considering two cases without internal pressurization, that is, the drawing ratios DR 1-102 and DR 3-306. To this end, we progressively change the furnace peak temperature from 1900 (C) to 2050 (C). The agreement between the final outer diameter of the capillary obtained numerically and experimentally is very good, and the maximum difference between the experimental and numerical results is approximately 12%. This happens for the case DR 1-102 and 2050 (C), where the capillary may have undergone experimentally a partial collapse, see Figure 7a. Concerning the air-filling fraction, the agreement between experiments and numerical simulations is also very good for all the cases of the oven peak temperature considered, except for the case DR 3-306 and 2050 (C), where the deviation is approximately 24.5%, see Figure 8a. Analogously to the SDRs cases without internal pressurization, the deviations between experiments and simulations increase as the furnace peak temperature increases, and the functional form of the fibre temperature profile we selected may under-predict the real one. Therefore, the predicted final fibre size is smaller than the real one due to the excessive values the viscosity assumes.
In Figure 7c and Figure 8c, we consider a case with internal pressurization. Specifically, we define a case with DR 2-204, 1950 (C), and inner pressurization ranging from (mbar) up to (mbar). The agreement between experiments and numerical results is very good for the whole pressure range, and the maximum discrepancy between the numerical and experimental outer diameter is approximately 13.8%, see Figure 7c. The agreement between the numerical and experimental data of the air-filling fractions is also very good and the maximum difference is approximately 15.5%, see Figure 8c.
3.4. Holey Fibres (HFs)
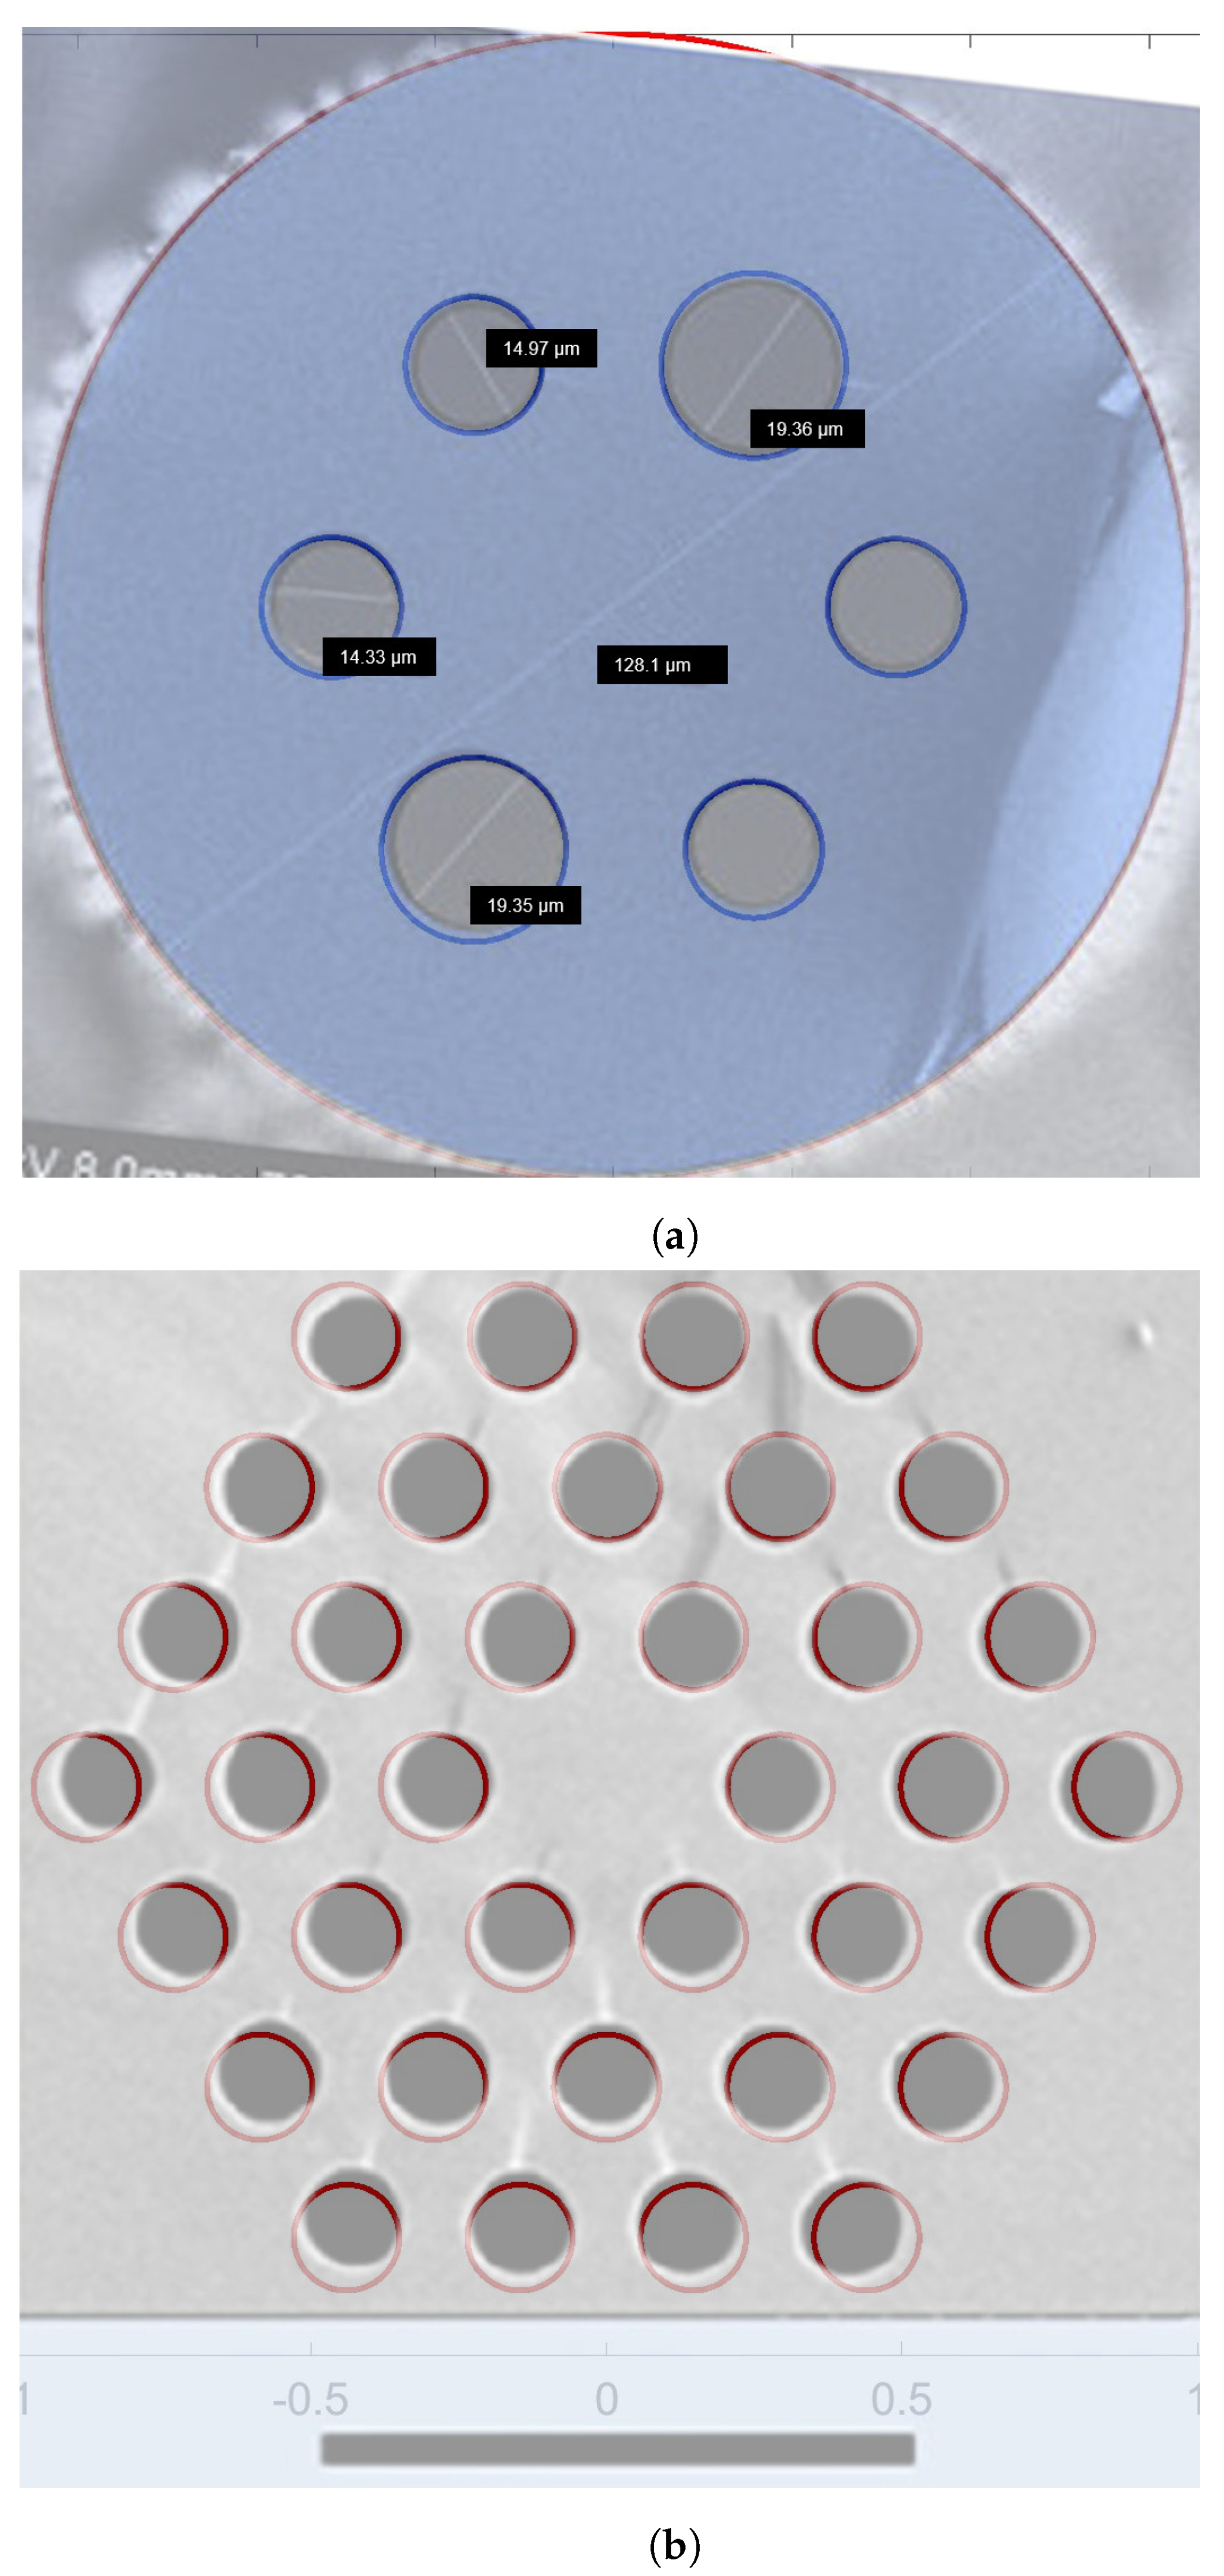
In this section, we first test our fibre temperature profile for the case of a six-hole structure in the absence of internal pressurization. We previously simulated such a geometrical configuration utilizing Ansys PolyFlow®, an FEM-based commercial software. Ansys PolyFlow® is a general-purpose computational fluid dynamic (CFD) software suitable for simulating extrusion, thermoforming, glass moulding, fibre drawing, polymer, and glass forming processes. Furthermore, it possesses an extensive library of visco-elastic models. This FEM software features robust iterative solvers based on incomplete lower–upper (ILU) matrix factorization schemes. In addition, it is equipped with robust re-meshing techniques that are needed to relocate internal nodes in the case of displacement of boundary nodes. Those features are very useful in simulating the fibre drawing process where large deformations of the boundaries occur [53]. The initial hole sizes and configuration can be found in Figure 1 of the manuscript of Luzi et al. [47]. The drawing conditions are: 1890 (C), DR 20-187, and = 0 (mbar). In Figure 9a, we overlap the experimental results, the previous FEM simulations, and the outcome of the present computations. Figure 9a exhibits an excellent agreement between the current computations and the experimental results. The shape, size, and positions of the holes at the end of the drawing are well predicted, and the maximum discrepancy between simulations and experiments is only 0.17%. Afterward, we consider a thirty-six-hole cross-section with internal pressurization, whose geometrical details of the shape are given in the manuscript of Frosz et al. [52]. 1973 (C), = 173 (mbar), and DR 10-42, as indicated in Table 1. Figure 9b displays an excellent agreement between the final fibre cross-section obtained experimentally and the one computed numerically. In particular, the hole sizes and locations in the fibre cross-section are correctly predicted by the numerical simulations.
4. Discussion
We proposed a novel correlation to compute the fibre temperature profile and integrated it into the three-dimensional asymptotic extensional-flow models of Stokes et al. [38], Chen et al. [39] and Buchak et al. [41] assuming thermal equilibrium between the furnace walls and the fibre. Those models describe the drawing process of both annular capillaries and MOFs that can contain many holes. In our previous work [32], we showed that the temperature profile of a capillary of a certain size strongly varies in the drawing direction and imperceptible changes can be noted in the radial one. In the first half of the “hot zone”, the fibre and furnace temperature profile almost coincided both for the SDRs cases and for the HDRs cases, indicating thermal equilibrium between the oven and the capillary due to the low values of the feeding velocities. In the second half of the “hot zone” the fibre temperature profile significantly departed from that of the oven, assuming always lower values, thereby revealing a strong convective cooling phenomenon due to the high values of the drawing speeds. This drove us toward the selection of a fibre temperature profile with a lower peak temperature compared to the one of the furnace but with a slightly wider width to avoid excessive high values of the viscosity that could prejudice the drawing leading to the breakage of the fibre. After a trial and error procedure, we fixed the values of the parameters that determine the fibre temperature profile. We chose to integrate the system of differential equations with respect to and not with respect to . By doing so, all the numerical simulations are very stable and there is no need to implement an upper bound for the viscosity in the computer codes. With regards to the developed computer codes, we carefully debugged them since the present mathematical framework contains a lot of equations. To this end, we thoroughly analysed and interpreted the outcomes, checked for possible errors in the computer commands and for errors made by the algorithms, looked for possible bugs in the model, and we also scrutinized hypothetical explanations concerning the validity of the results. Moreover, during model tests and computer implementation, we proceeded in small steps, carefully testing and debugging the codes before adding the next steps.
We first compared the results of our numerical simulations for the case of annular capillaries and afterward, we considered holey fibres. To this end, we contrasted our numerical outcomes with the experiments of Luzi et al. [27,47] and Frosz et al. [52]. Overall, we obtained good agreements between numerical and experimental results for a wide range of drawing conditions and fibre cross-sectional shapes. The computational time needed to solve the governing system of differential and algebraic equations is substantially shorter than the time needed to solve the full set of three-dimensional Navier–Stokes equations. On the one hand, it takes some minutes to solve numerically the equations governing the drawing of annular capillaries and to perform several iterations for the case with thirty-six capillaries. On the other hand, it takes hours on a high-performance computer (HPC) centre to carry out a simulation of a six-hole fibre structure using an FEM-based software [47]. The fibre temperature profile applied in this work leads to very good agreement between numerical simulations and experimental data for the cases of HDRs and furnace peak temperatures 2000 (C). Plausible reasons for this are the lower peak temperature of the fibre compared to the one in the oven and the effects of the strong convective cooling. Both may lead to values of the viscosity that are so high that the drawing conditions only influence to a certain extent the final fibre cross-section. Differently, for the cases of SDRs and furnace peak temperatures 2000 (C) the agreement between numerical computations and experiments depreciates significantly. The values of the viscosity may be low enough to allow significant changes in the fibre geometry during the drawing process. The convective cooling effects may be insufficient due to the low drawing speeds. In addition, a partial collapse of the fibre structure begins to occur in the experiments due to the longer residence time of the fibre in the oven and a longer exposition of the fibre to the furnace heating, modifying significantly the fibre geometry. Under those circumstances, the proposed fibre temperature profile does not lead to the correct prediction of the glass viscosity which may be low enough to enable significant changes in the fibre structure during the drawing. Consequently, the final fibre size results were overestimated. The specified fibre temperature profile also leads to values of the final fibre structure that slightly change with the oven peak temperature. We hypothesize that the values of the viscosity computed using the proposed correlation for the temperature of the fibre are too high to allow the fibre to change significantly its size with the oven peak temperature.
To obtain more accurate results for a wide range of furnace peak temperatures and drawing conditions the heat exchange between the furnace and the fibre must be modelled [31,32,40]. The fibre temperature profile strongly depends on the heat exchange between the furnace and the fibre itself and the convective cooling, in particular in the late stage of the drawing where the fibre achieves high speeds. The effects of viscous dissipation may also become important in regions where the velocity gradients are significant, especially in the axial direction, and capillaries may begin to collapse at high peak temperatures if the feeding and drawing speeds are low enough. In such circumstances, first, the inner surface of a capillary begins to collapse, and afterward, the whole fibre structure follows. All these issues make the final fibre structure difficult to accurately predict with only one correlation that solely depends on the peak temperature of the oven. Nevertheless, we also obtain a good concordance between experiments and simulations for the case of holey fibres, both when the fibre is not pressurized and when internal pressurization is applied. Since in this case the furnace peak temperature is not so high and the drawing speed promotes significant cooling, the real fibre temperature is probably well approximated by the proposed correlation. The present correlation of the fibre temperature can be also utilized with the model of Buchak and Crowdy [43] that can handle fibres with general cross-sectional shapes.
In the present work, an existing mathematical formulation has been used to predict the drawing process of silica glass fibres. However, it can be also utilized straightforwardly to model the drawing process of optical fibres manufactured with other glasses by properly tuning some parameters. For instance, Stokes et al. [38] and Chen et al. [39,49] used F2 glass, a lead-silicate soft glass produced by the Schott Glass Company that is less expensive than silica glass. Although the value of the surface tension for F2 glass ( 0.23 [N/m]) is very similar to the value for silica glass we utilized in this work( 0.25 [N/m]), the thermal properties are completely different. Therefore, the operating peak temperatures of the furnace are also distinct, and an adequate temperature-viscosity correlation must be selected. Stokes et al. [38] and Chen et al. [39,49] suggest employing a Vogel–Fulcher–Tammann relation to compute the glass viscosity of F2 glass from a known value of the temperature. Other types of soft glasses can be also used for manufacturing MOFs. For instance, Tellurite, lead–bismuth–gallium Oxide-based, and multicomponent oxide glasses also represent an alternative to silica glasses [54]. Similarly to F2 glass, the correct thermal and mechanical properties need to be introduced in the present mathematical model and a suitable temperature viscosity relation must be selected.
5. Conclusions
In this work, we proposed a novel correlation to calculate the fibre temperature during the drawing process of MOFs. To this end, we assumed thermal equilibrium between the oven walls and the fibre. First, we used this correlation in the model of Chen et al. [39] to model the drawing process of an axis-symmetric capillary, and afterward, we used it with the model of Buchak et al. [41] to simulate the drawing process of holey fibres. The asymptotic models developed over the years by Stokes et al. [38], Chen et al. [39], and Buchak et al. [41] can be quickly solved numerically and does not necessitate significant computational resources compared to the full three-dimensional formulation. They can be solved on common workstations and the computational time is of the order of minutes which is significantly lower than the time required to carry out three-dimensional FEM simulations. The numerical predictions obtained in this work are overall in good accordance with experimental results despite the assumption that thermal equilibrium is only valid for fibre velocities close to the feeding speeds. A good concordance has been obtained both for the cases of SDRs and HDRs, both for annular capillaries and holey fibres, and both for pressurized and unpressurized fibres. The agreement between experiments and simulations could be even improved by selecting a different fibre temperature distribution, thereby furnishing experimenters with a powerful and fast predictive tool.
Author Contributions
G.L., conception and design of the study, analysis, and interpretation of the data, writing, review, and editing; V.K., critical revision for important intellectual content; A.D., critical revision for important intellectual content. All authors have read and agreed to the published version of the manuscript.
Funding
This work was supported by the National Research Foundation of Korea (NRF) grant funded by the Korean government (MSIT) (No. 2021R1F1A1050103).
Acknowledgments
The authors would like to thank Michael Frosz for providing us with the necessary drawing parameters for the simulations and for useful discussions.
Conflicts of Interest
The authors declare no conflict of interest.
Abbreviations
The following abbreviations are used in this manuscript:
| MOFs | Microstructured optical fibres |
| SCFs | Suspended-core fibres |
| HCFs | Hollow-core fibres |
| TIR | Total internal reflection |
| FEM | Finite element method |
| GEPM | Generalized elliptical pore model |
| DR | Drawing ratio |
| SDRs | Slow drawing ratios |
| HDRs | High drawing ratios |
| HFs | Holey fibres |
| SEM | Scanning electron microscope |
| CFD | Computational fluid dynamics |
| ILU | Incomplete lower–upper |
| PBG | Photonic band gap |
References
- Russell, P.S. Photonic-Crystal Fibers. J. Light. Technol. 2006, 24, 4729–4749. [Google Scholar] [CrossRef]
- Knight, J.C. Photonic crystal fibres. Nature 2003, 424, 847–851. [Google Scholar] [CrossRef] [PubMed]
- Buczynski, R. Photonic Crystal Fibers. Acta Phys. Pol. A 2004, 106, 141–167. [Google Scholar] [CrossRef]
- Monro, T.M.; Ebendorff-Heidepriem, H. Progress in Microstructured Oprical Fibers. Annu. Rev. Mater. Res. 2006, 36, 467–495. [Google Scholar] [CrossRef]
- Wadsworth, W.; Percival, R.; Bouwmans, G.; Knight, J.; Russell, P. High power air-clad photonic crystal fibre laser. Opt. Express 2003, 11, 48–53. [Google Scholar] [CrossRef] [PubMed]
- Humbert, G.; Knight, J.; Bouwmans, G.; Russell, P.; Williams, D.; Roberts, P.; Mangan, B. Hollow core photonic crystal fibers for beam delivery. Opt. Express 2004, 12, 1477–1484. [Google Scholar] [CrossRef] [PubMed]
- Di Teodoro, F.; Brooks, C.D. 1.1 MW peak-power, 7 W average-power, high-spectral-brightness, diffraction-limited pulses from a photonic crystal fiber amplifier. Opt. Lett. 2005, 30, 2694–2696. [Google Scholar] [CrossRef]
- Dainese, P.; St., Russell, P.J.; Joly, N.; Knight, J.C.; Wiederhecker, G.S.; Fragnito, H.L.; Laude, V.; Khelif, A. Stimulated Brillouin scattering from multi-GHz-guided acoustic phonons in nanostructured photonic crystal fibres. Nat. Phys. 2006, 2, 388–392. [Google Scholar] [CrossRef]
- Chernikov, S.V.; Zhu, Y.; Taylor, J.R.; Gapontsev, V.P. Supercontinuum self-Q-switched ytterbium fiber laser. Opt. Lett. 1997, 22, 298–300. [Google Scholar] [CrossRef]
- Nyachionjeka, K.; Tarus, H.; Langat, K. Design of a photonic crystal fiber for optical communications application. Sci. Afr. 2020, 9, e00511. [Google Scholar] [CrossRef]
- Benabid, F.; Knight, J.C.; Antonopoulos, G.; Russell, P.S.J. Stimulated Raman scattering in hydrogen-filled hollow-core photonic crystal fiber. Science 2002, 298, 399–402. [Google Scholar] [CrossRef] [PubMed]
- Monro, T.M.; Belardi, W.; Furusawa, K.; Baggett, J.C.; Broderick, N.G.R.; Richardson, D.J. Sensing with microstructured optical fibres. Meas. Sci. Technol. 2001, 12, 854–858. [Google Scholar] [CrossRef]
- Marques, C.A.F.; Pospori, A.; Demirci, G.; Çetinkaya, O.; Gawdzik, B.; Antunes, P.; Bang, O.; Mergo, P.; André, P.; Webb, D.J. Fast Bragg Grating Inscription in PMMA Polymer Optical Fibres: Impact of Thermal Pre-Treatment of Preforms. Sensors 2017, 17, 891. [Google Scholar] [CrossRef] [PubMed]
- Monro, T.M.; Warren-Smith, S.; Schartner, E.P.; François, A.; Heng, S.; Ebendorff-Heidepriem, H.; Afshar, S. Sensing with suspended-core optical fibers. Opt. Fiber Technol. 2010, 16, 343–356. [Google Scholar] [CrossRef]
- Pinto, A.M.R.; Frazão, O.; Santos, J.L.; Lopez-Amo, M.; Kobelke, J.; Schuster, K. Interrogation of a Suspended-Core Fabry–Perot Temperature Sensor Through a Dual Wavelength Raman Fiber Laser. J. Light. Technol. 2010, 28, 3149–3155. [Google Scholar] [CrossRef]
- Fu, L.; Thomas, B.K.; Dong, L. Efficient supercontinuum generations in silica suspended core fibers. Opt. Express 2008, 16, 19629–19642. [Google Scholar] [CrossRef] [PubMed]
- Savelii, I.; Jules, J.C.; Gadret, G.; Kibler, B.; Fatome, J.; El-Amraoui, M.; Manikandan, N.; Zheng, X.; Désévédavy, F.; Dudley, J.M.; et al. Suspended core tellurite glass optical fibers for infrared supercontinuum generation. Opt. Mater. 2011, 33, 1661–1666. [Google Scholar] [CrossRef]
- Li, J.; Li, H.; Wang, Z. Application of Hollow-Core Photonic Crystal Fibers in Gas Raman Lasers Operating at 1.7 μm. Crystals 2021, 11, 121. [Google Scholar] [CrossRef]
- Jin, W.; Xuan, H.F.; Ho, H.L. Sensing with hollow-core photonic bandgap fibers. Meas. Sci. Technol. 2010, 21, 094014. [Google Scholar] [CrossRef]
- Poletti, F.; Petrovich, M.N.; Richardson, D.J. Hollow-core photonic bandgap fibers: Technology and applications. Nanophotonics 2013, 2, 315–340. [Google Scholar] [CrossRef]
- Matovich, M.A.; Pearson, J.R.A. Spinning a Molten Threadline. Steady-State Isothermal Viscous Flows. Ind. Eng. Chem. Fundam. 1969, 8, 512–520. [Google Scholar] [CrossRef]
- Paek, U.C.; Runk, R.B. Physical behavior of the neck–down region during furnace drawing of silica fibers. J. Appl. Phys. 1978, 49, 4417–4422. [Google Scholar] [CrossRef]
- Glicksman, L.R. The Dynamics of a Heated Free Jet of Variable Viscosity Liquid at Low Reynolds Numbers. J. Basic Eng. 1968, 90, 343–354. [Google Scholar] [CrossRef]
- Myers, M.R. A model for unsteady analysis of preform drawing. AIChE J. 1989, 35, 592–602. [Google Scholar] [CrossRef]
- Yarin, A.L.; Gospodinov, P.; Roussinov, V.I. Stability loss and sensitivity in hollow fiber drawing. Phys. Fluids 1994, 6, 1454–1463. [Google Scholar] [CrossRef]
- Fitt, A.D.; Furusawa, K.; Monro, T.M.; Please, C.P.; Richardson, D.J. The mathematical modelling of capillary drawing for holey fibre manufacture. J. Eng. Math. 2002, 43, 201–227. [Google Scholar] [CrossRef]
- Luzi, G.; Epple, P.; Scharrer, M.; Fujimoto, K.; Rauh, C.; Delgado, A. Influence of Surface Tension and Inner Pressure on the Process of Fibre Drawing. J. Light. Technol. 2010, 28, 1882–1888. [Google Scholar] [CrossRef]
- Luzi, G.; Epple, P.; Scharrer, M.; Fujimoto, K.; Rauh, C.; Delgado, A. Asymptotic Analysis of Flow Processes at Drawing of Single Optical Microfibres. Int. J. Chem. React. Eng. 2011, 9, 1–28. [Google Scholar] [CrossRef]
- Voyce, C.J.; Fitt, A.D.; Monro, T.M. The mathematical modelling of rotating capillary tubes for holey-fibre manufacture. J. Eng. Math. 2008, 60, 69–87. [Google Scholar] [CrossRef]
- Voyce, C.J.; Fitt, A.D.; Monro, T.M. Mathematical Modeling as an Accurate Predictive Tool in Capillary and Microstructured Fiber Manufacture: The Effects of Preform Rotation. J. Light. Technol. 2008, 26, 791–798. [Google Scholar] [CrossRef]
- Taroni, M.; Breward, C.J.W.; Cummings, L.J.; Griffiths, I.M. Asymptotic solutions of glass temperature profiles during steady optical fibre drawing. J. Eng. Math. 2013, 80, 1–20. [Google Scholar] [CrossRef]
- Luzi, G.; Lee, S.; Gatternig, B.; Delgado, A. An Asymptotic Energy Equation for Modelling Thermo Fluid Dynamics in the Optical Fibre Drawing Process. Energies 2022, 15, 7922. [Google Scholar] [CrossRef]
- Dewynne, J.N.; Ockendon, J.R.; Wilmott, P. A systematic derivation of the leading-order equations for extensional flows in slender geometries. J. Fluid Mech. 1992, 244, 323. [Google Scholar] [CrossRef]
- Dewynne, J.N.; Howell, P.D.; Wilmott, P. Slender Viscous Fibres With Inertia And Gravity. Q. J. Mech. Appl. Math. 1994, 47, 541–555. [Google Scholar] [CrossRef]
- Griffiths, I.M.; Howell, P.D. The surface-tension-driven evolution of a two-dimensional annular viscous tube. J. Fluid Mech. 2007, 593, 181–208. [Google Scholar] [CrossRef]
- Griffiths, I.M.; Howell, P.D. Mathematical modelling of non-axisymmetric capillary tube drawing. J. Fluid Mech. 2008, 605, 181–206. [Google Scholar] [CrossRef]
- Cummings, L.J.; Howell, P.D. On the evolution of non-axisymmetric viscous fibres with surface tension, inertia and gravity. J. Fluid Mech. 1999, 389, 361–389. [Google Scholar] [CrossRef]
- Stokes, Y.M.; Buchak, P.; Crowdy, D.G.; Ebendorff-Heidepriem, H. Drawing of micro-structured fibres: Circular and non-circular tubes. J. Fluid Mech. 2014, 755, 176–203. [Google Scholar] [CrossRef]
- Chen, M.J.; Stokes, Y.M.; Buchak, P.; Crowdy, D.G.; Ebendorff-Heidepriem, H. Microstructured optical fibre drawing with active channel pressurisation. J. Fluid Mech. 2015, 783, 137–165. [Google Scholar] [CrossRef]
- Stokes, Y.M.; Wylie, J.J.; Chen, M.J. Coupled fluid and energy flow in fabrication of microstructured optical fibres. J. Fluid Mech. 2019, 874, 548–572. [Google Scholar] [CrossRef]
- Buchak, P.; Crowdy, D.G.; Stokes, Y.M.; Ebendorff-Heidepriem, H. Elliptical pore regularisation of the inverse problem for microstructured optical fibre fabrication. J. Fluid Mech. 2015, 778, 5–38. [Google Scholar] [CrossRef]
- Crowdy, D.G. Compressible bubbles in Stokes flow. J. Fluid Mech. 2003, 476, 345–356. [Google Scholar] [CrossRef]
- Buchak, P.; Crowdy, D.G. Surface-tension-driven Stokes flow: A numerical method based on conformal geometry. J. Comput. Phys. 2016, 317, 347–361. [Google Scholar] [CrossRef]
- Xue, S.C.; Tanner, R.I.; Barton, G.W.; Lwin, R.; Large, M.; Poladian, L. Fabrication of microstructured optical fibers-part I: Problem formulation and numerical modeling of transient draw process. J. Light. Technol. 2005, 23, 2245–2254. [Google Scholar] [CrossRef]
- Xue, S.C.; Large, M.; Barton, G.W.; Tanner, R.I.; Poladian, L.; Lwin, R. Role of material properties and drawing conditions in the fabrication of microstructured optical fibers. J. Light. Technol. 2006, 24, 853–860. [Google Scholar] [CrossRef]
- Xue, S.C.; Tanner, R.I.; Barton, G.W.; Lwin, R.; Large, M.; Poladian, L. Fabrication of microstructured optical fibers-part II: Numerical modeling of steady-state draw process. J. Light. Technol. 2005, 23, 2255–2266. [Google Scholar] [CrossRef]
- Luzi, G.; Epple, P.; Scharrer, M.; Fujimoto, K.; Rauh, C.; Delgado, A. Numerical Solution and Experimental Validation of the Drawing Process of Six-Hole Optical Fibers Including the Effects of Inner Pressure and Surface Tension. J. Light. Technol. 2012, 30, 1306–1311. [Google Scholar] [CrossRef]
- Chen, M.J.; Stokes, Y.M.; Buchak, P.; Crowdy, D.G.; Ebendorff-Heidepriem, H. Asymptotic Modelling of a Six-Hole MOF. J. Light. Technol. 2016, 34, 5651–5656. [Google Scholar] [CrossRef]
- Chen, M.J.; Stokes, Y.M.; Buchak, P.; Crowdy, D.G.; Foo, H.T.; Dowler, A.; Ebendorff-Heidepriem, H. Drawing tubular fibres: Experiments versus mathematical modelling. Opt. Mater. Express 2016, 6, 166. [Google Scholar] [CrossRef]
- Schlichting, H.; Gersten, K. Boundary-Layer Theory; Springer: Berlin/Heidelberg, Germany, 2017. [Google Scholar] [CrossRef]
- Langlois, W.E.; Deville, M.O. Slow Viscous Flow; Springer International Publishing: Cham, Switzerland, 2014. [Google Scholar] [CrossRef]
- Frosz, M.H.; Ahmed, G.; Lapshina, N.; Keding, R.; Babic, F.; Joly, N.Y.; St., Russell, P.J. Reducing losses in solid-core photonic crystal fibers using chlorine dehydration. Opt. Mater. Express 2016, 6, 2975. [Google Scholar] [CrossRef]
- Barnes, H.A.; Hutton, J.F.; Walters, K. Polyflow User’s Guide; ANSYS, Inc.: Canonsburg, PA, USA, 2013. [Google Scholar]
- Stepien, R.; Cimek, J.; Pysz, D.; Kujawa, I.; Klimczak, M.; Buczynski, R. Soft glasses for photonic crystal fibers and microstructured optical components. Opt. Eng. 2014, 53, 071815. [Google Scholar] [CrossRef]
Figure 1.
Sketch of the drawing process of an MOF with several holes.
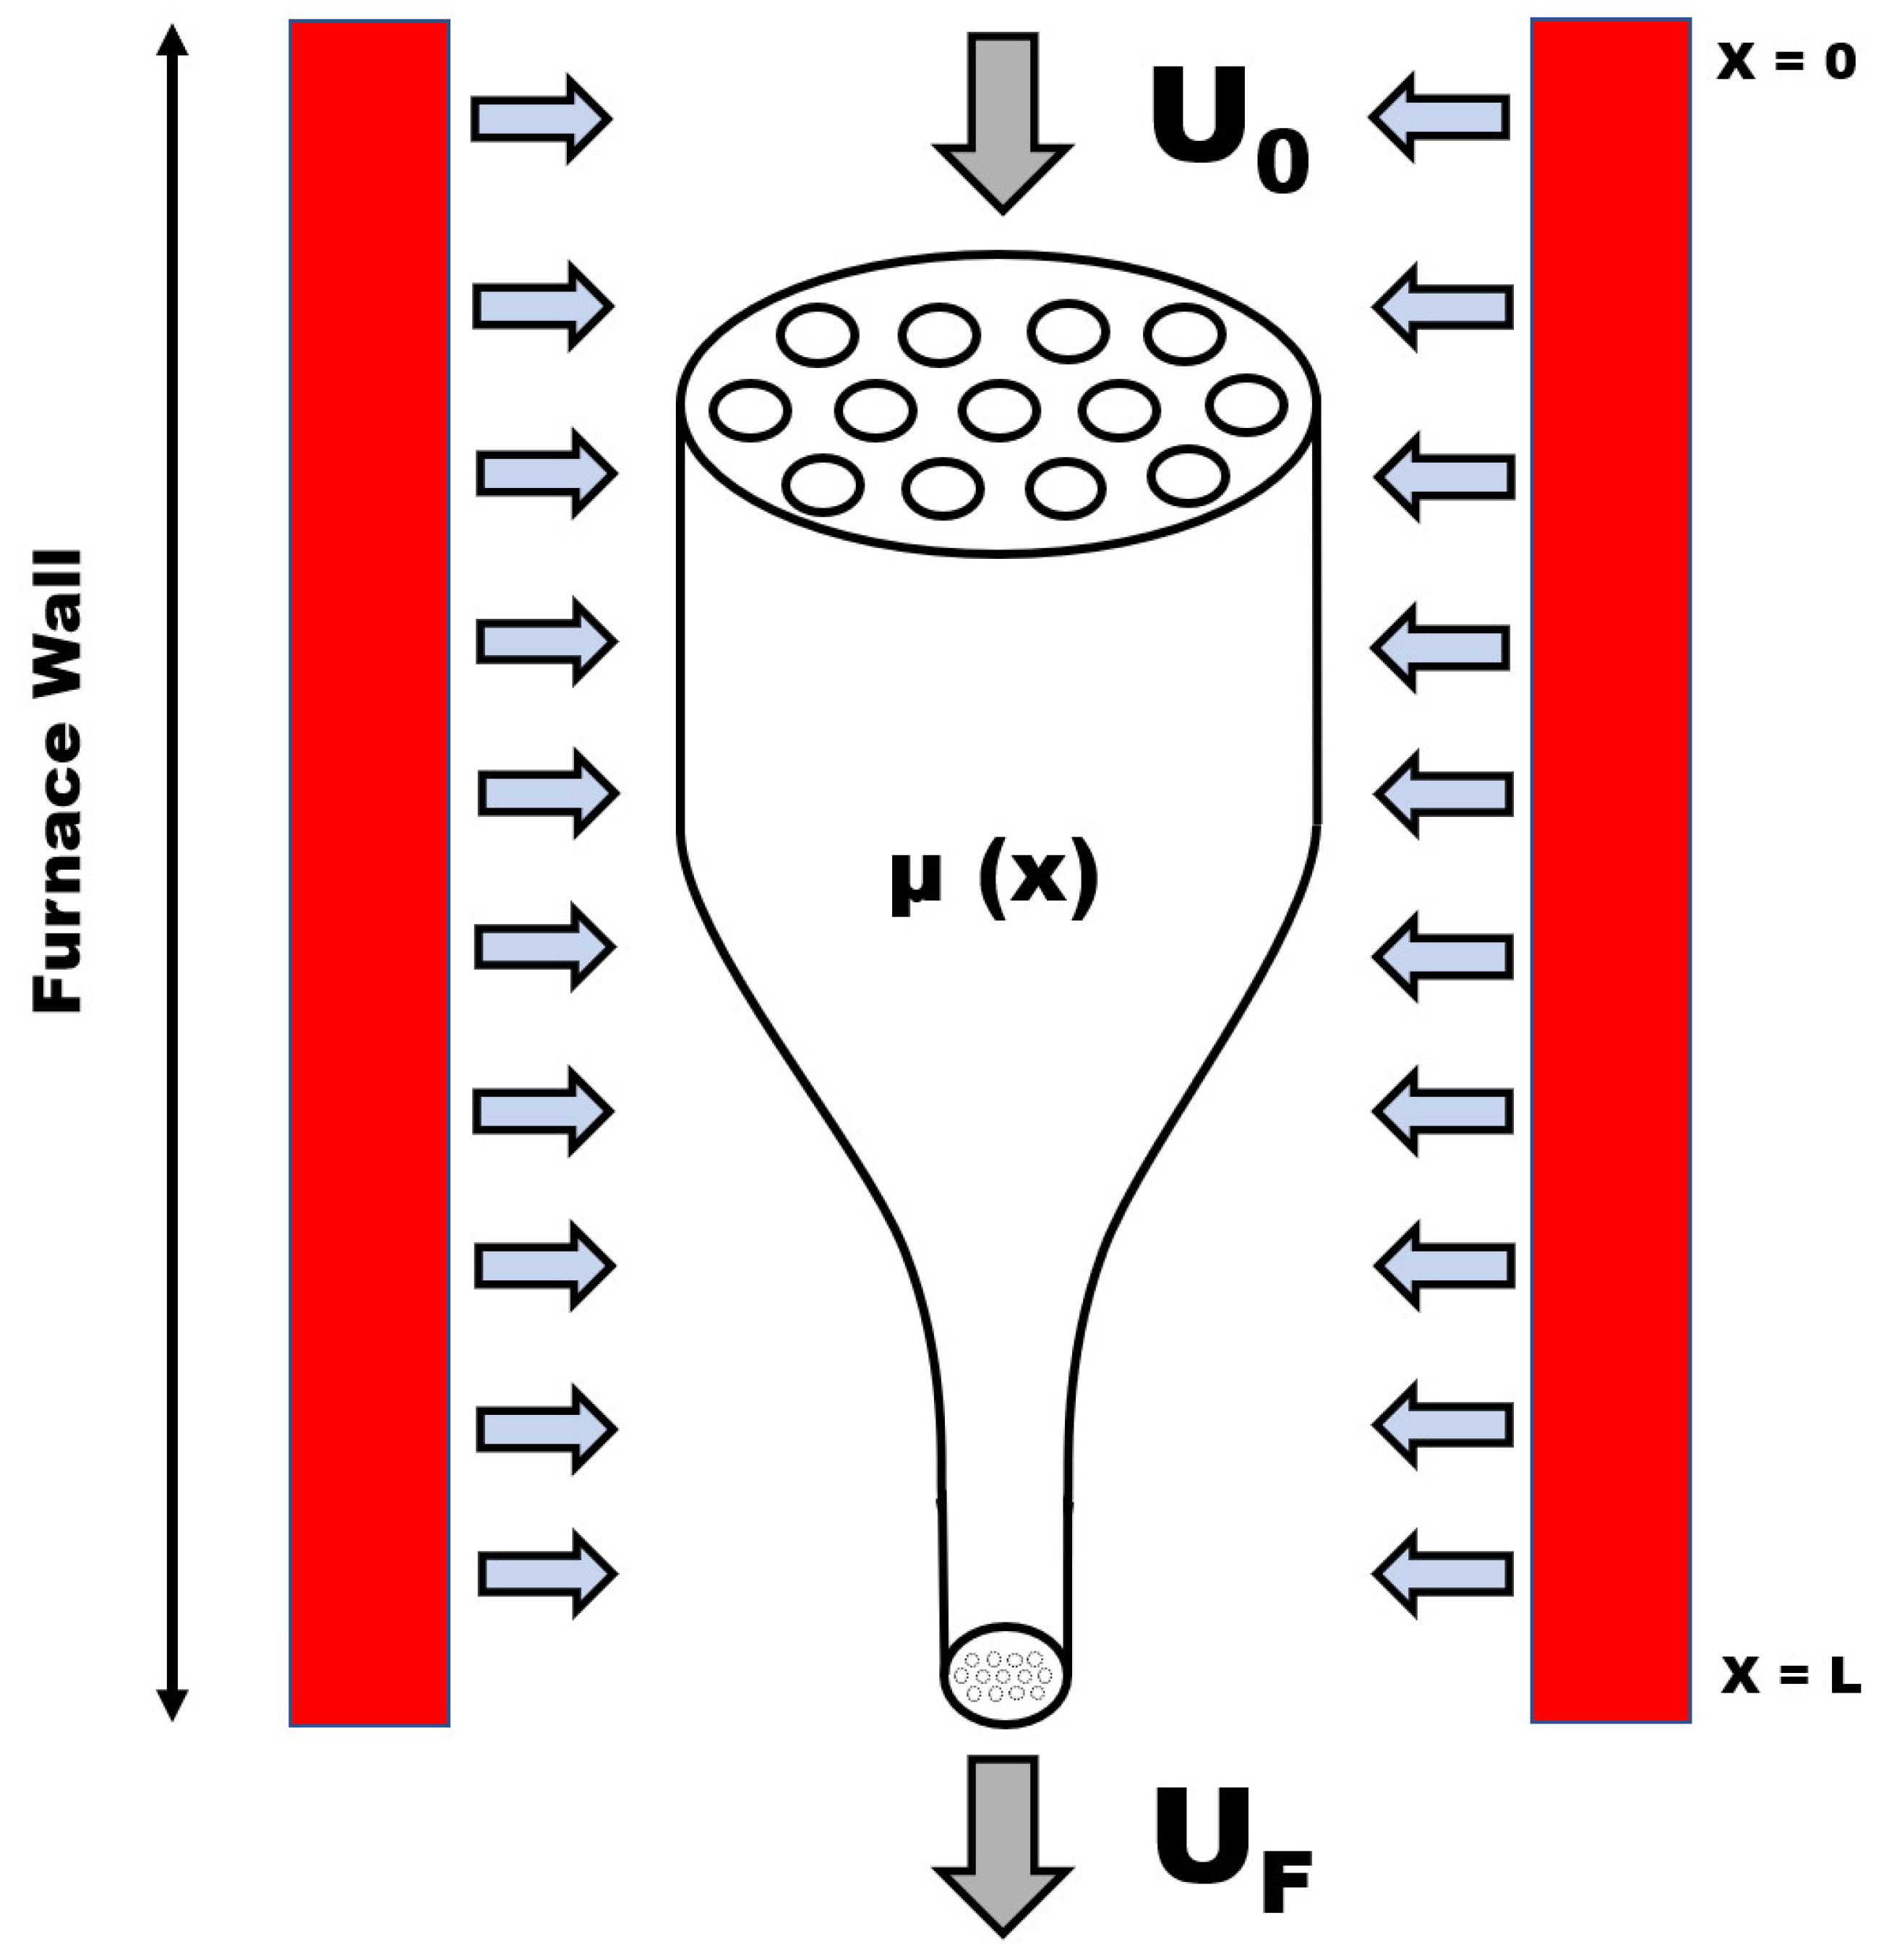
Figure 2.
Fibre temperature distribution according to Equation (32) with 2050 (C).
Figure 2.
Fibre temperature distribution according to Equation (32) with 2050 (C).
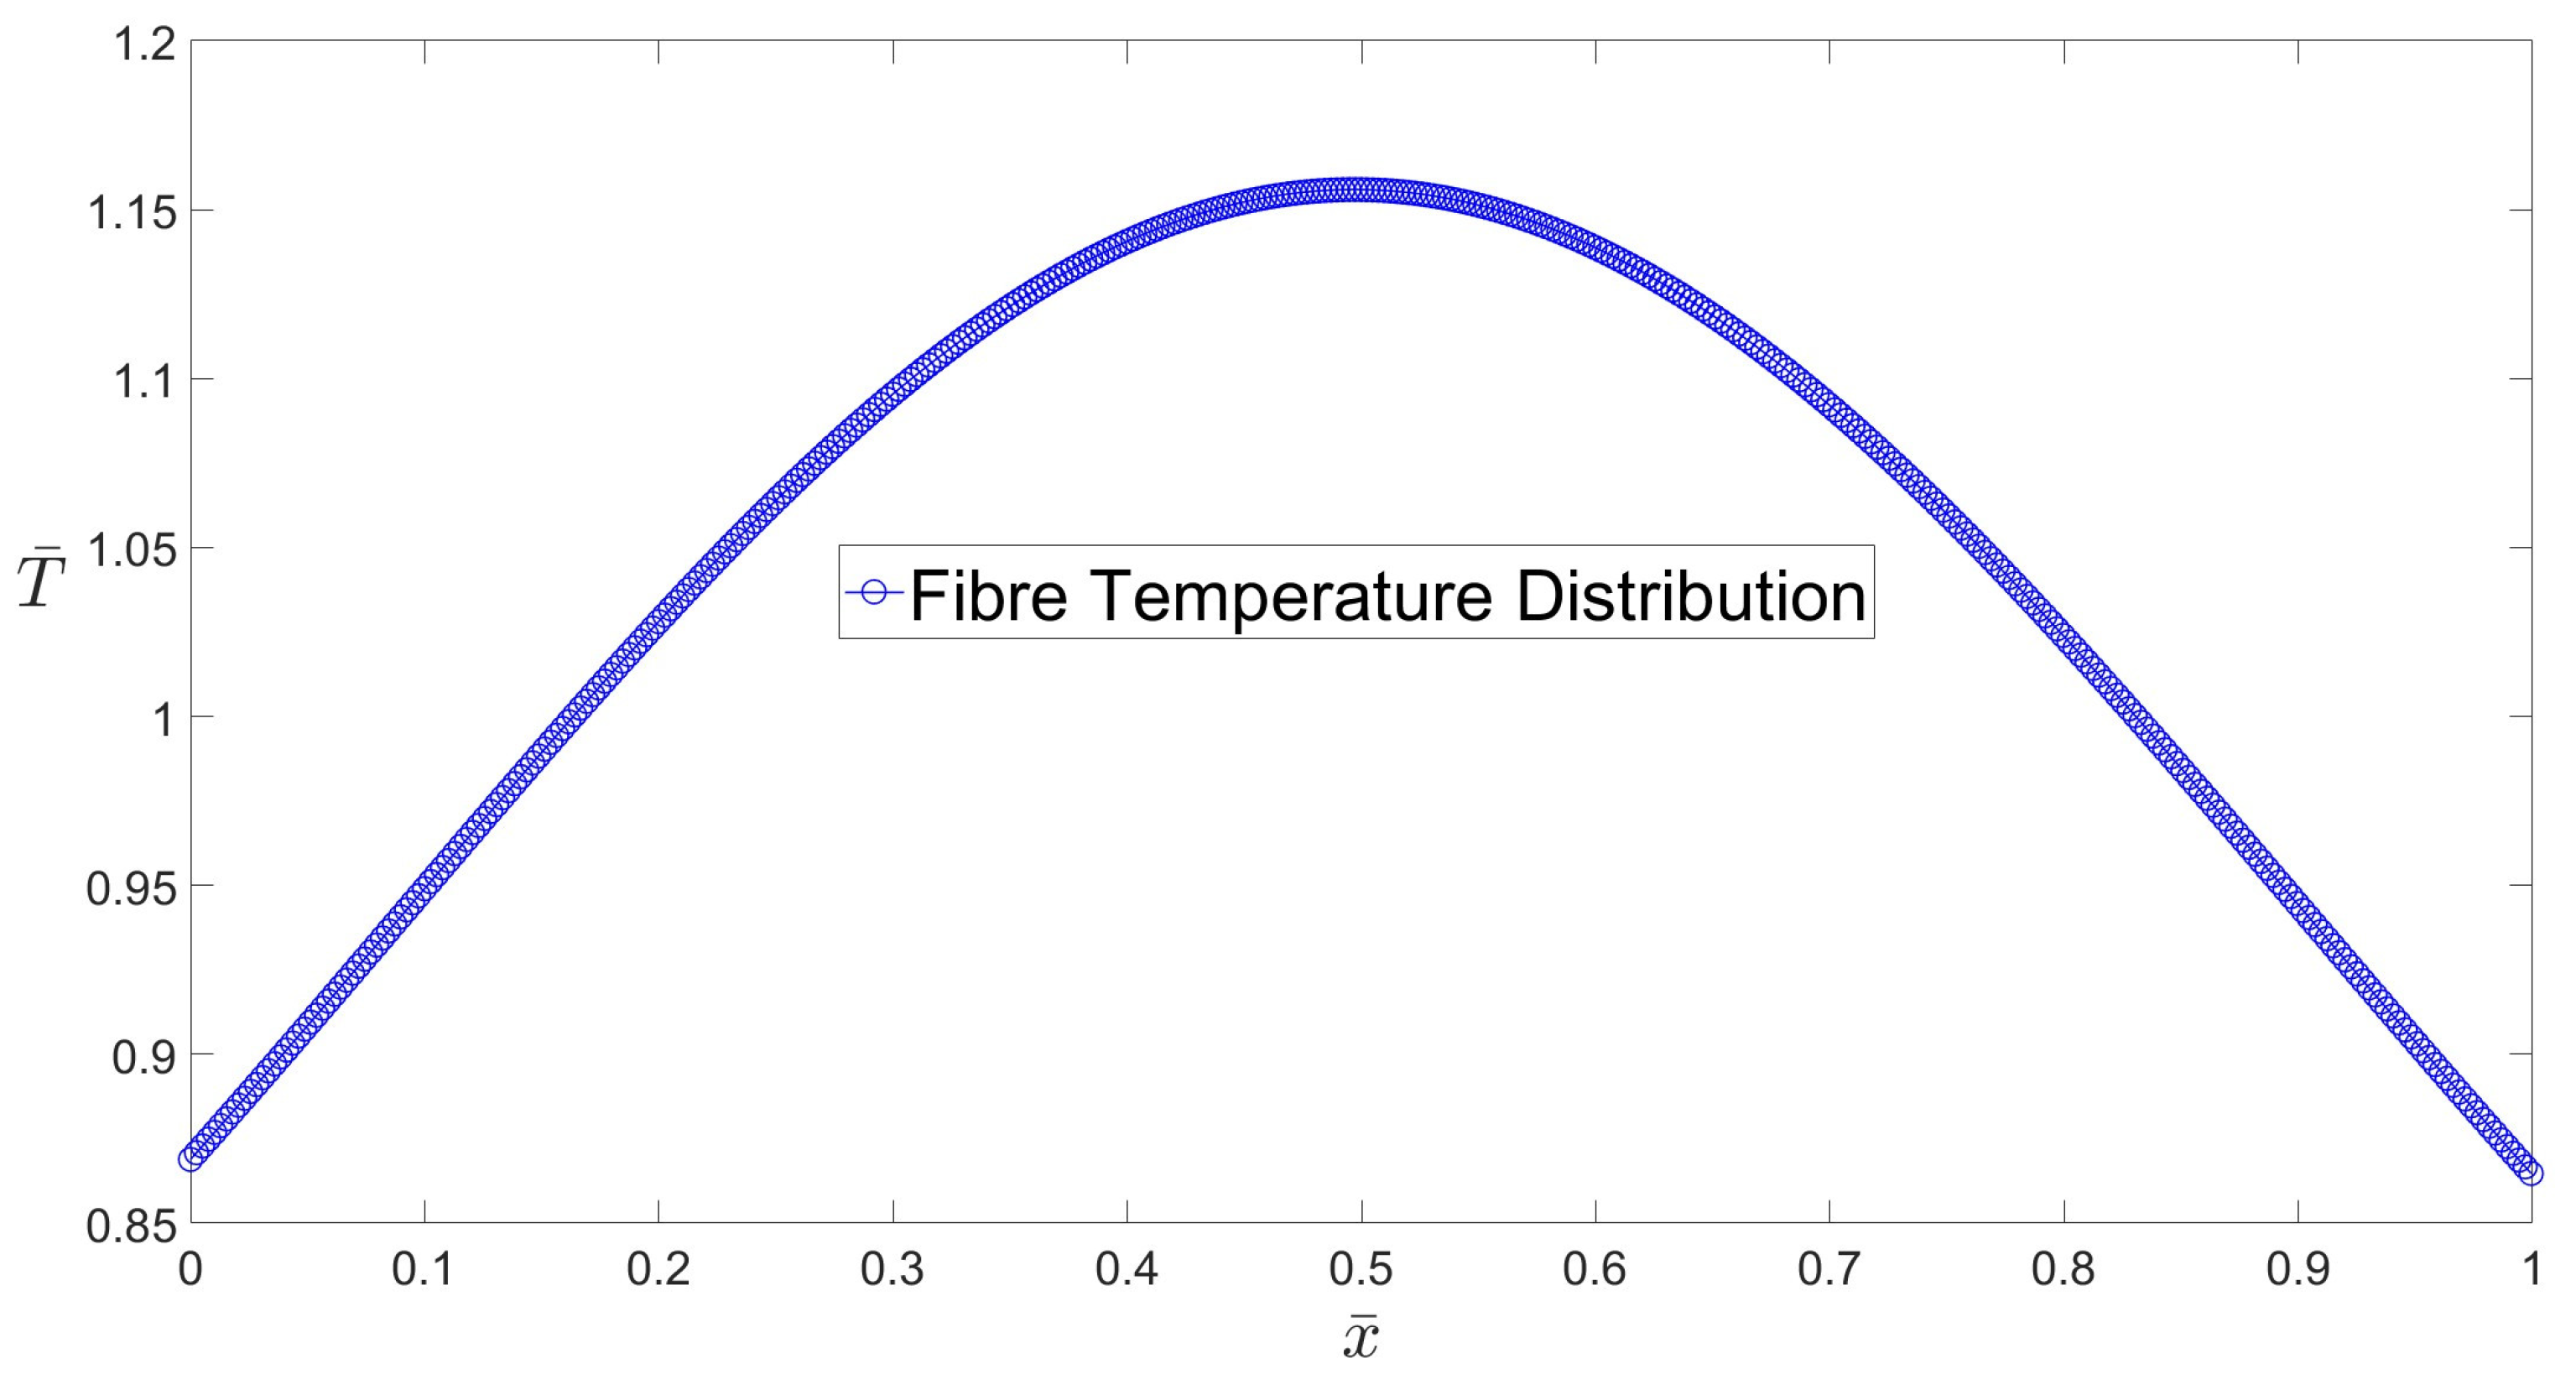
Figure 3.
(a) Evolution of the axial component of the velocity in the drawing direction . (b) Dimensionless square root of the cross-sectional area against . (c) Evolution of the inner and outer surfaces during the drawing process. DR 36-1 and 2050 (C).
Figure 3.
(a) Evolution of the axial component of the velocity in the drawing direction . (b) Dimensionless square root of the cross-sectional area against . (c) Evolution of the inner and outer surfaces during the drawing process. DR 36-1 and 2050 (C).
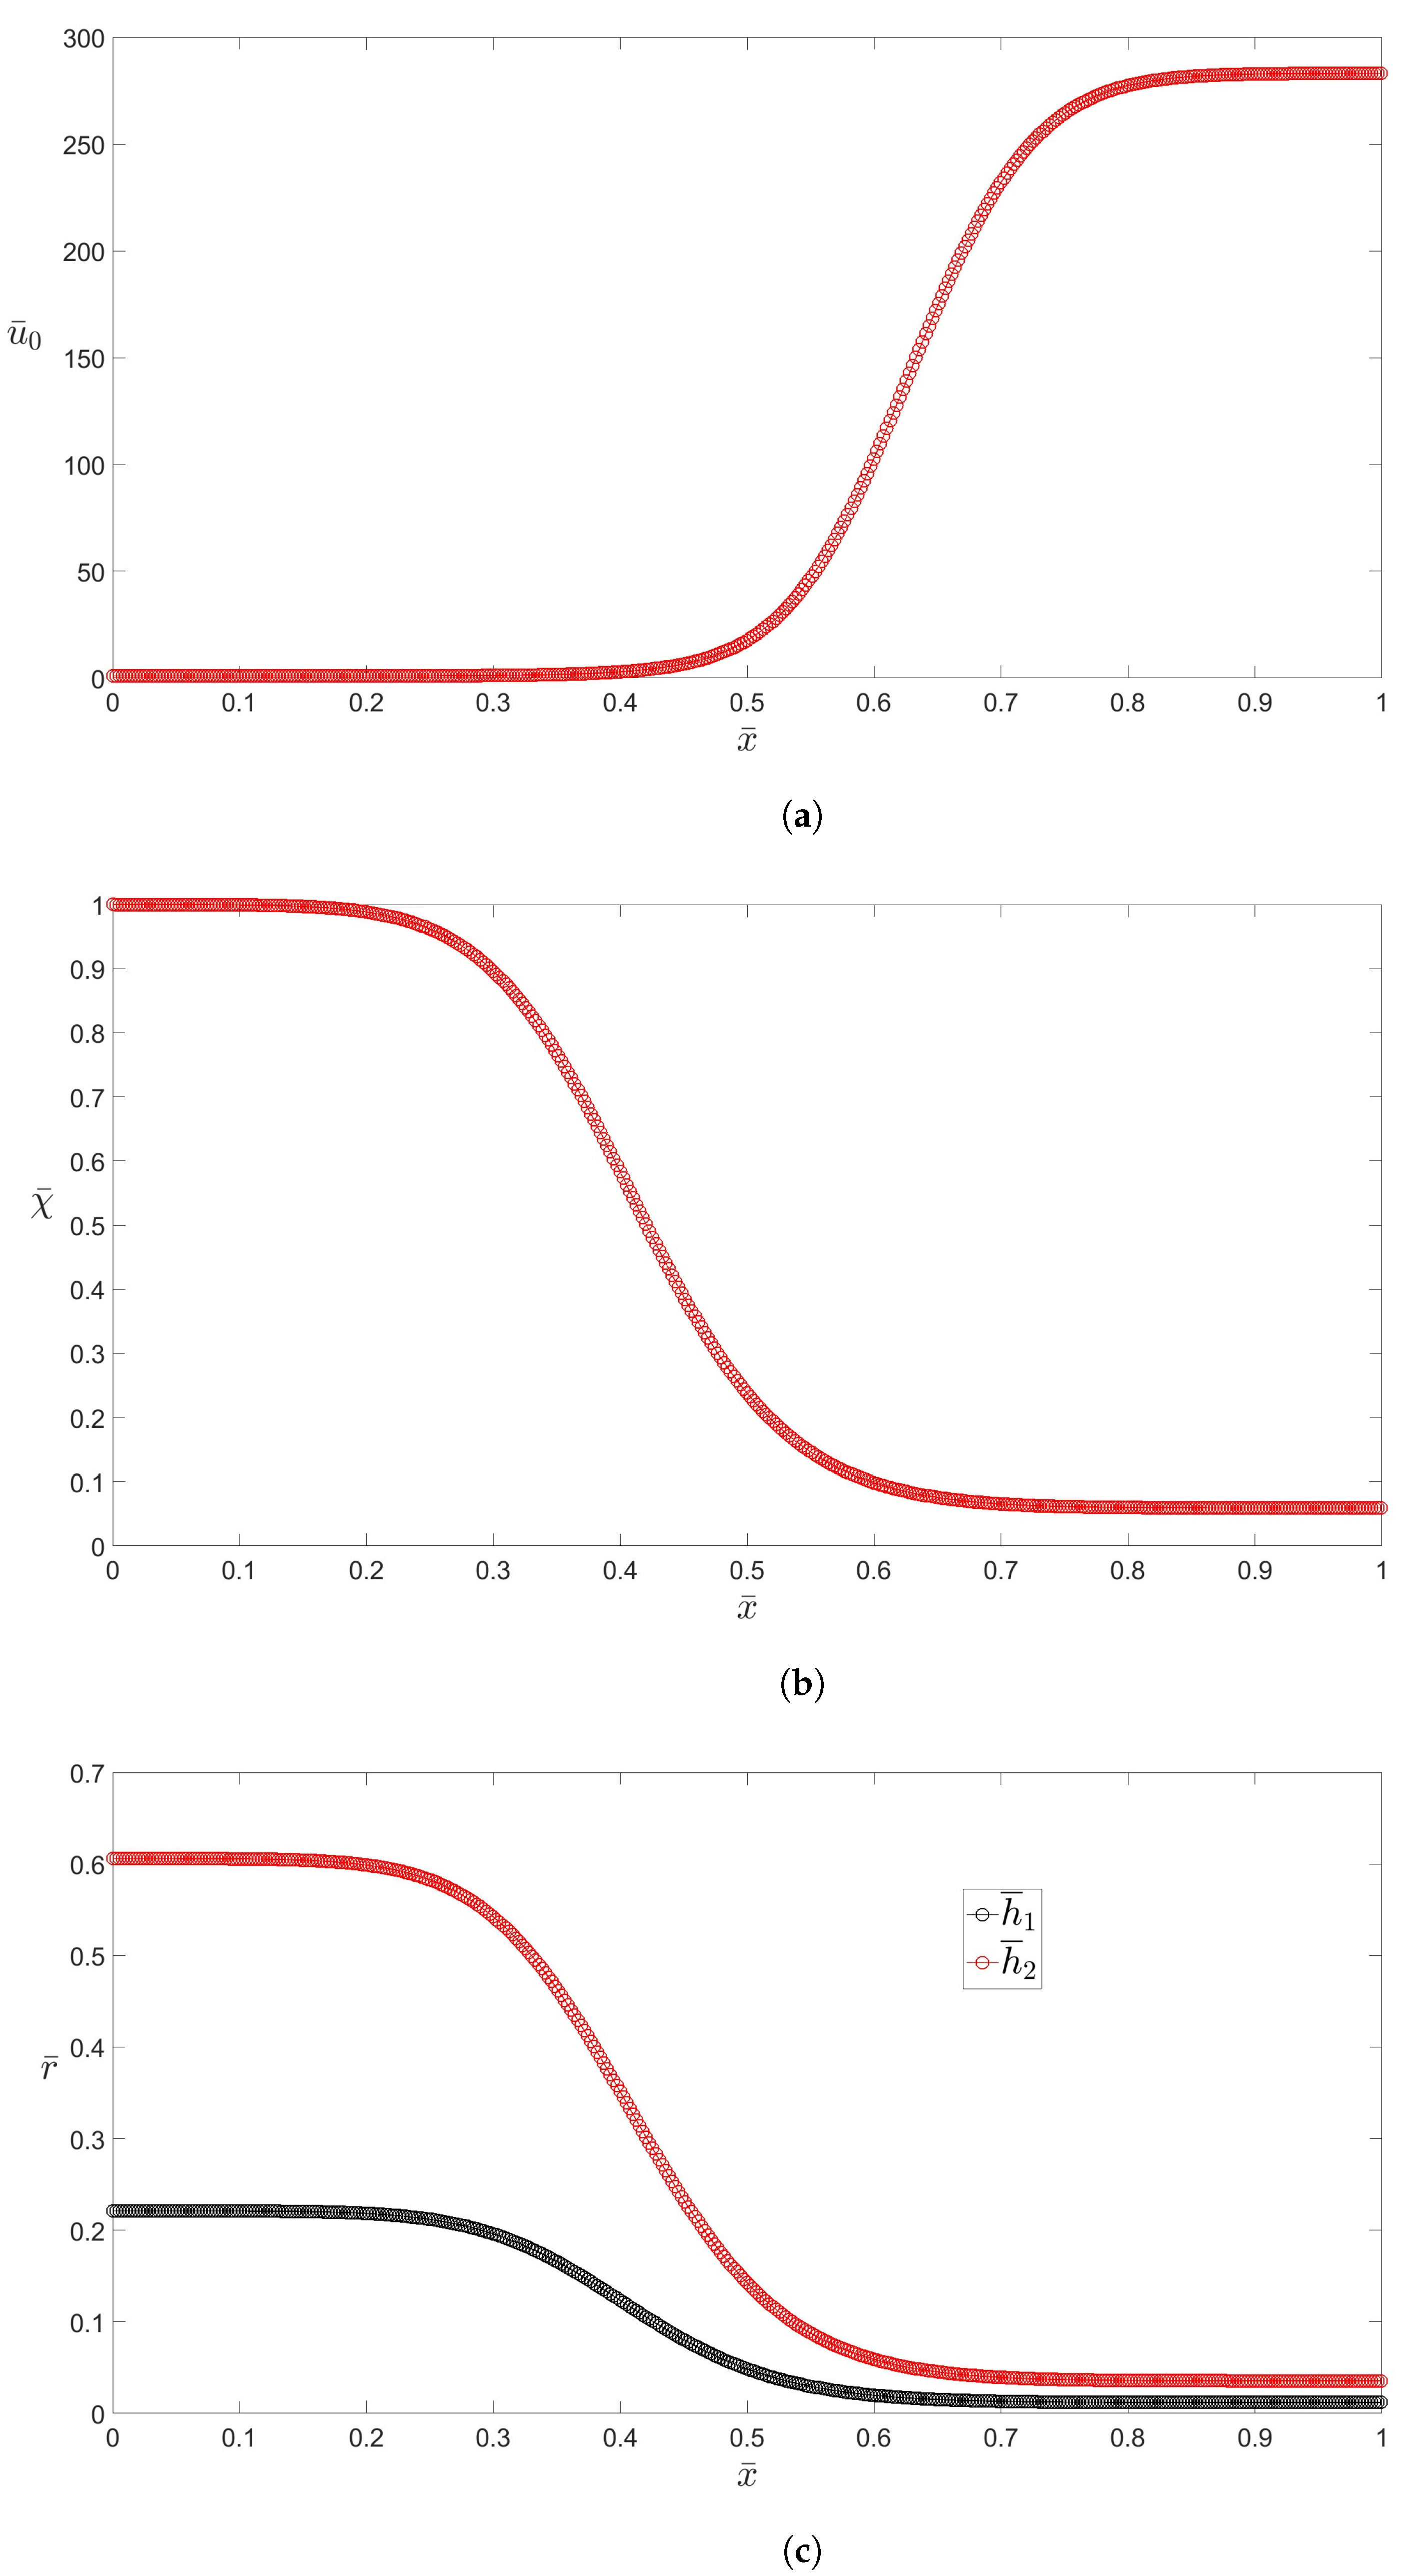
Figure 4.
Final external diameter of the capillary. Comparison between experiments and numerical simulations for (a) DR 36-1, (b) DR 54-15, and (c) DR 72-2.
Figure 4.
Final external diameter of the capillary. Comparison between experiments and numerical simulations for (a) DR 36-1, (b) DR 54-15, and (c) DR 72-2.

Figure 5.
Final air-filling fraction of the capillary. Comparison between experiments and numerical simulations for (a) DR 36-1, (b) DR 54-15, and (c) DR 72-2.
Figure 5.
Final air-filling fraction of the capillary. Comparison between experiments and numerical simulations for (a) DR 36-1, (b) DR 54-15, and (c) DR 72-2.
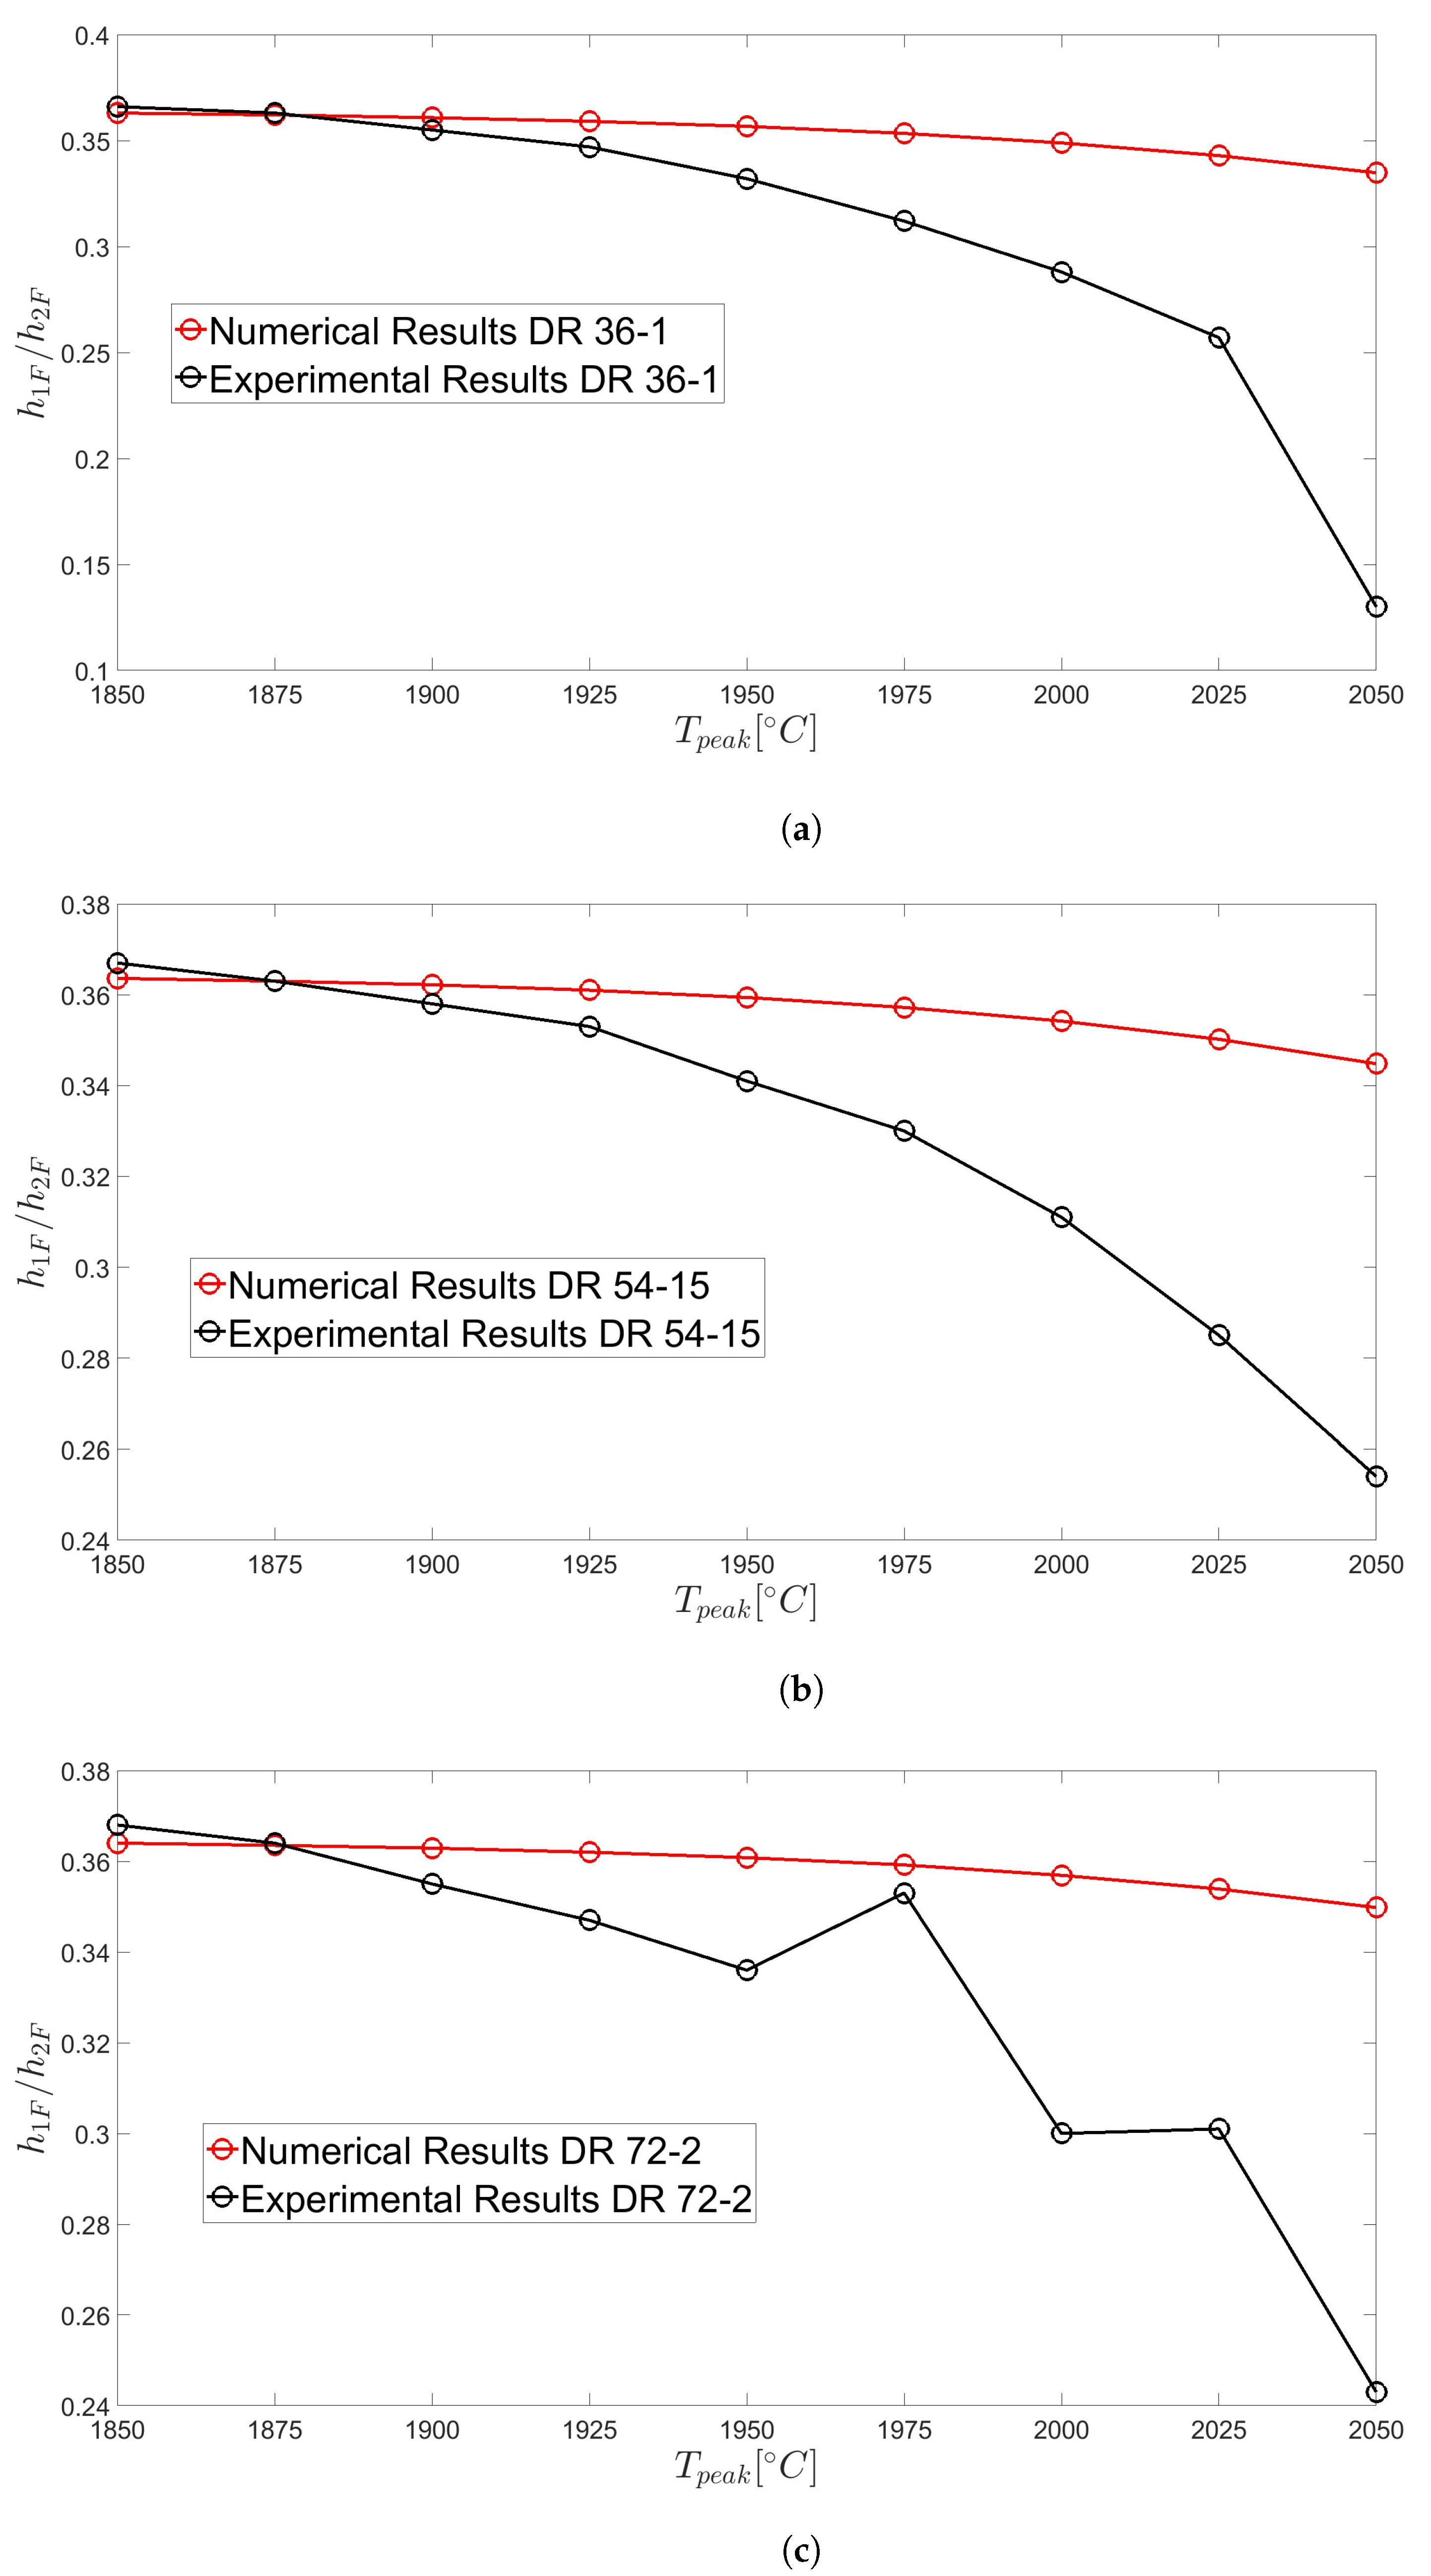
Figure 6.
(a) Final external diameter and (b) final air-filling fraction of the capillary. Comparison between experiments and numerical simulations.
Figure 6.
(a) Final external diameter and (b) final air-filling fraction of the capillary. Comparison between experiments and numerical simulations.
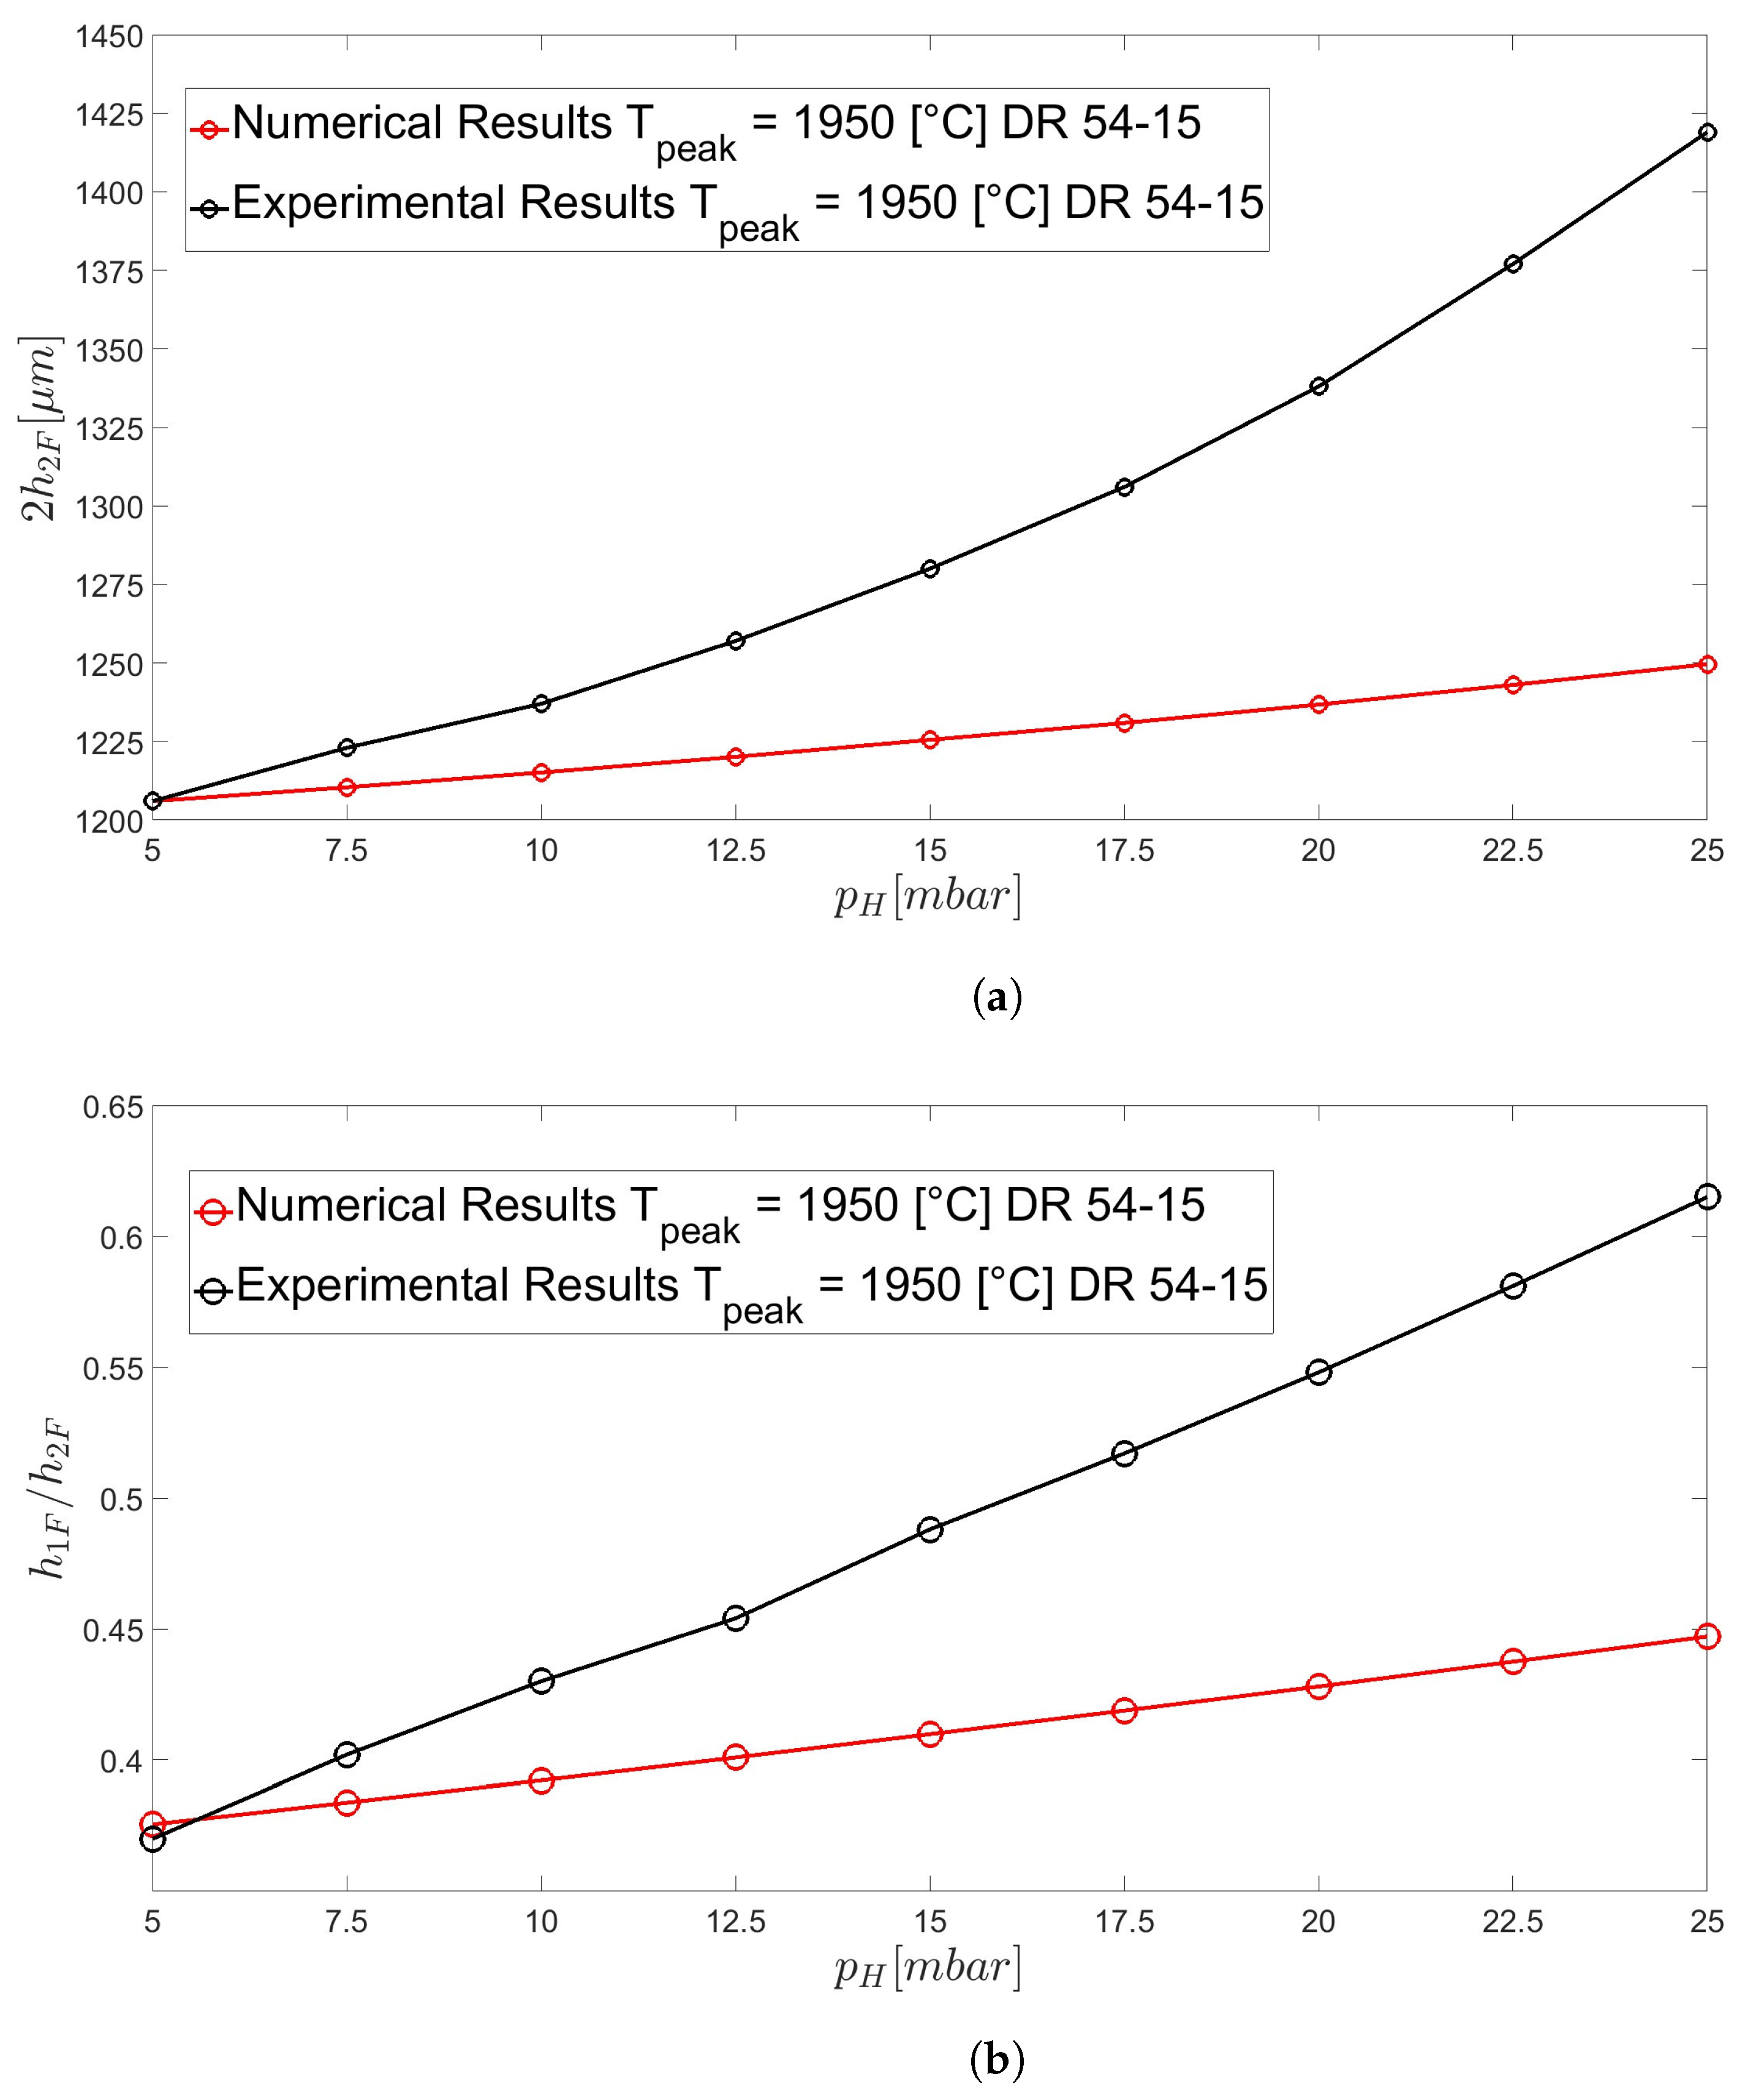
Figure 7.
Final external diameter of the capillary without inner pressurization for two different drawing ratios: (a) DR 1-102 and (b) DR 3-306. (c) Final external diameter of the capillary with inner pressurization for the drawing ratio DR 2-204.
Figure 7.
Final external diameter of the capillary without inner pressurization for two different drawing ratios: (a) DR 1-102 and (b) DR 3-306. (c) Final external diameter of the capillary with inner pressurization for the drawing ratio DR 2-204.
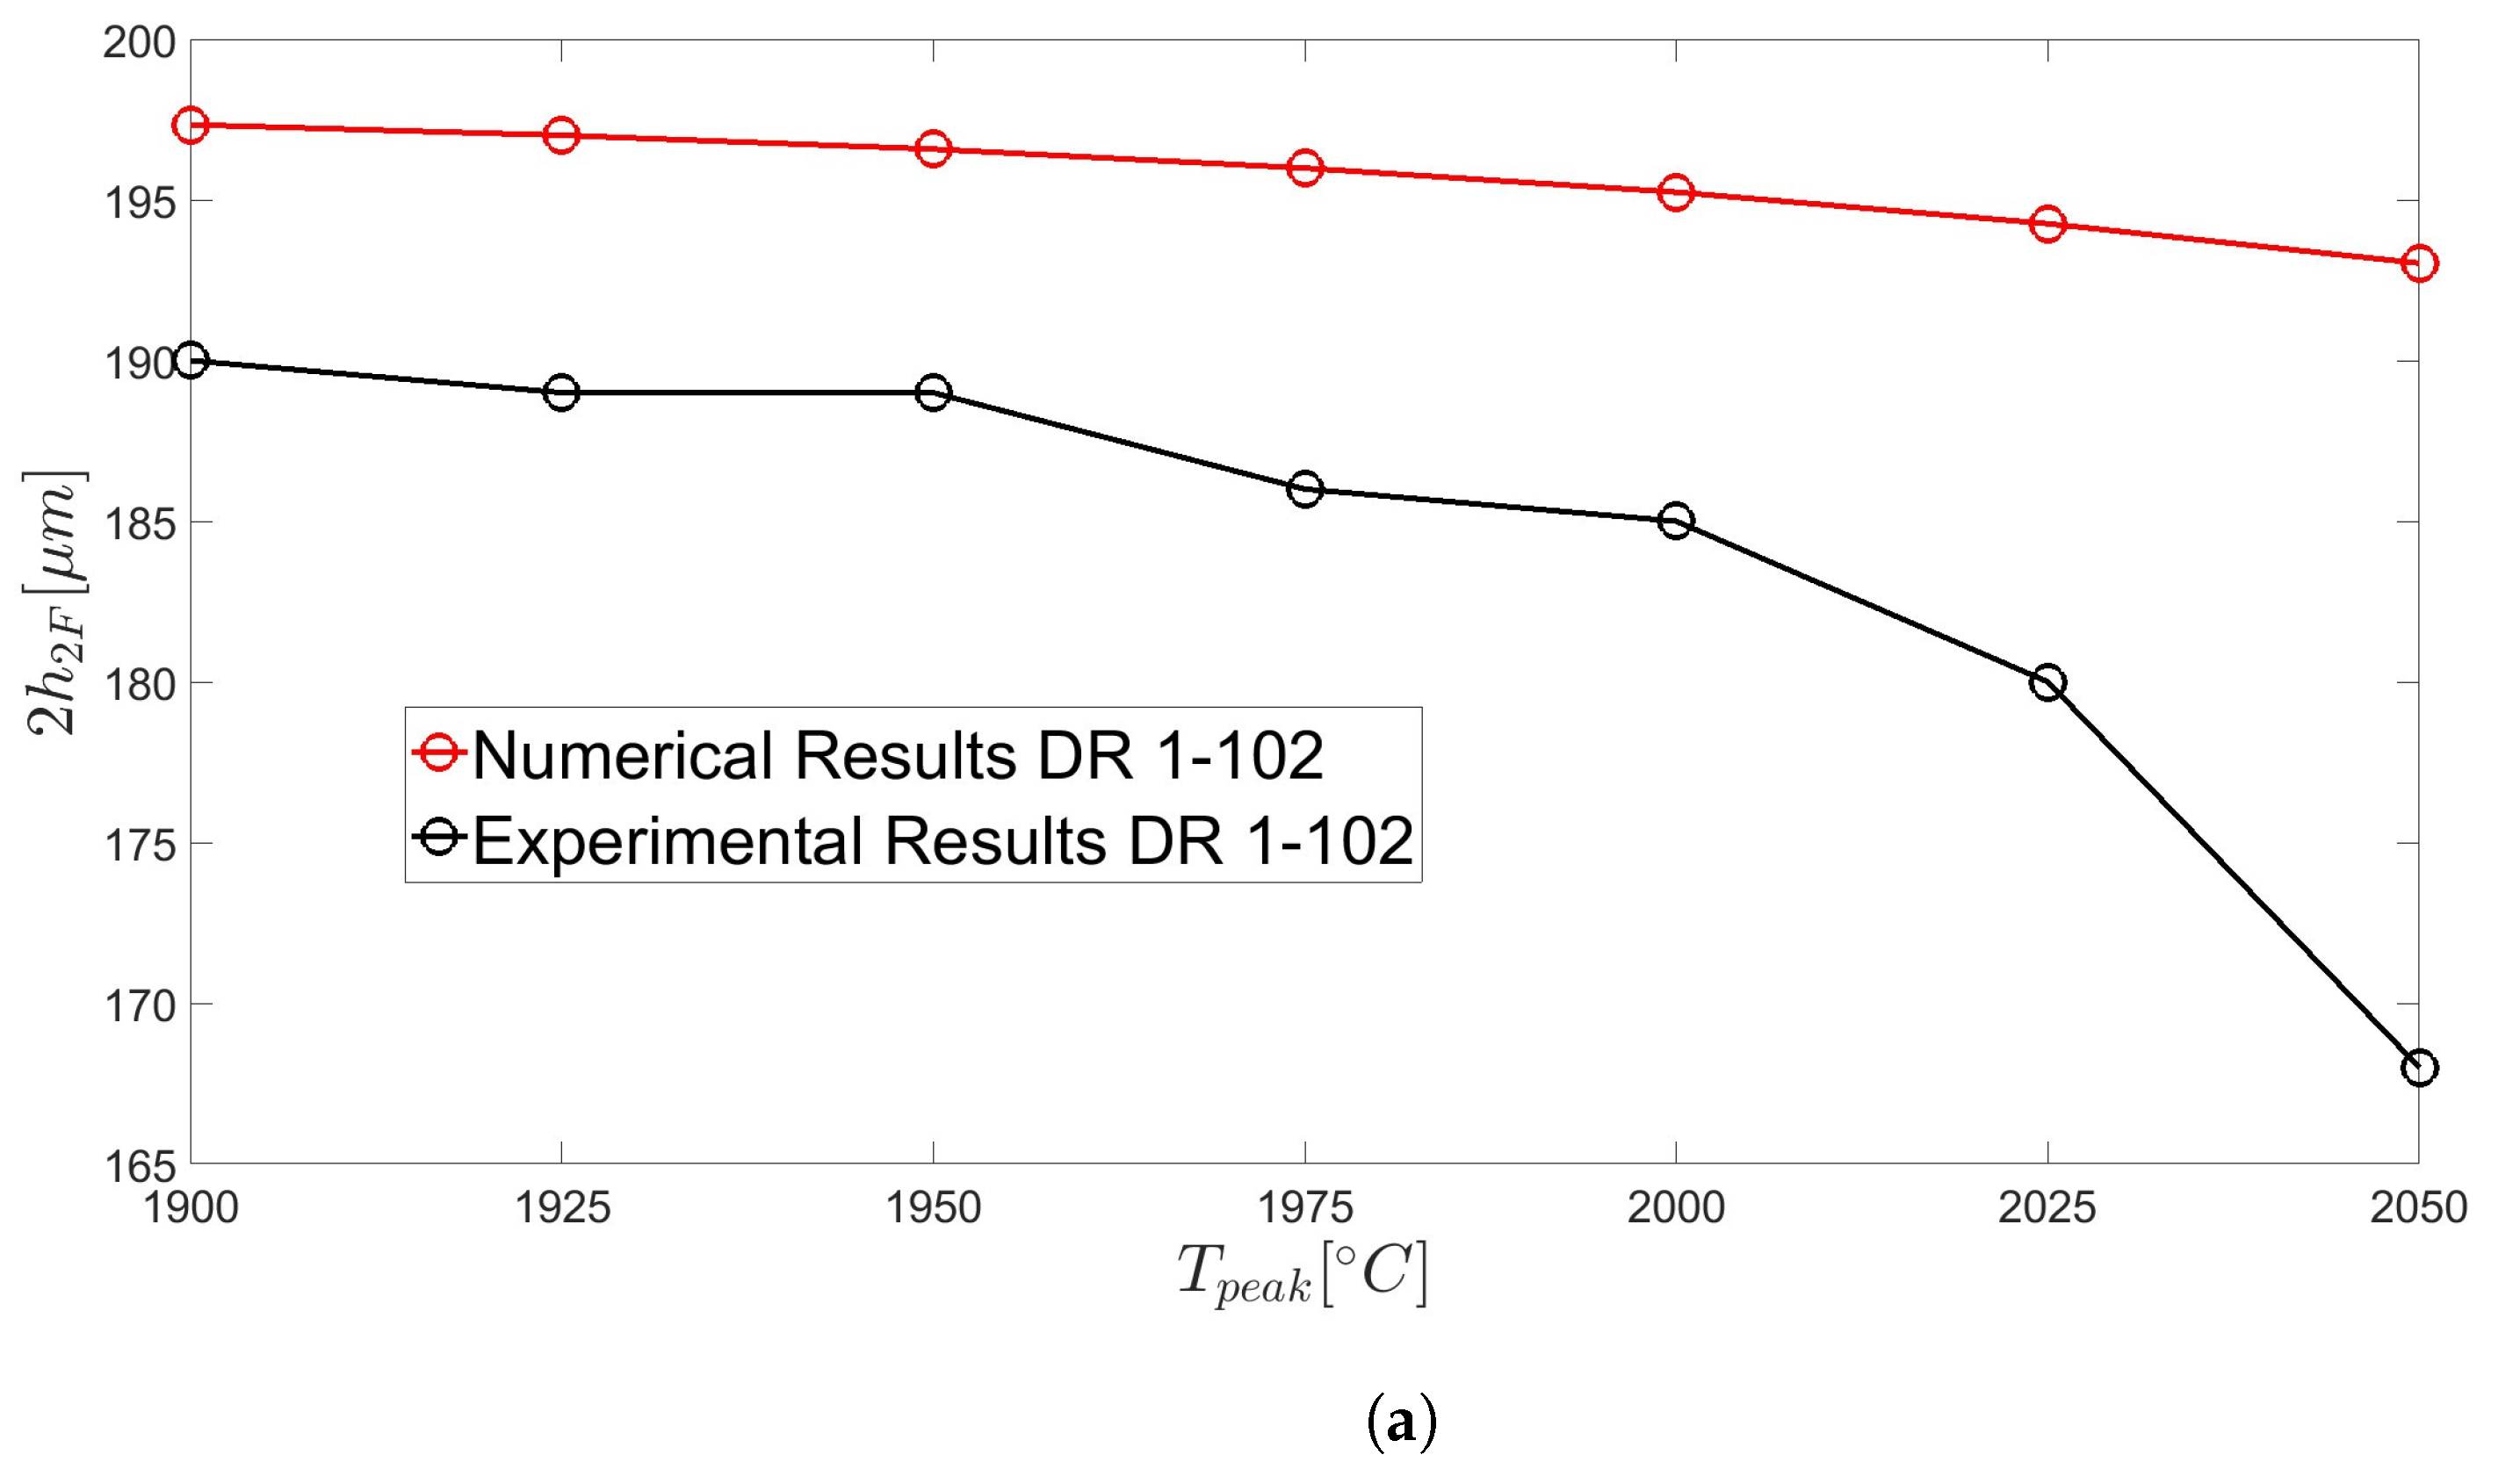

Figure 8.
Final air-filling fraction of the capillary without inner pressurization for two different drawing ratios: (a) DR 1-102 and (b) DR 3-306. (c) Final air-filling fraction of the capillary with inner pressurization for the drawing ratio DR 2-204.
Figure 8.
Final air-filling fraction of the capillary without inner pressurization for two different drawing ratios: (a) DR 1-102 and (b) DR 3-306. (c) Final air-filling fraction of the capillary with inner pressurization for the drawing ratio DR 2-204.

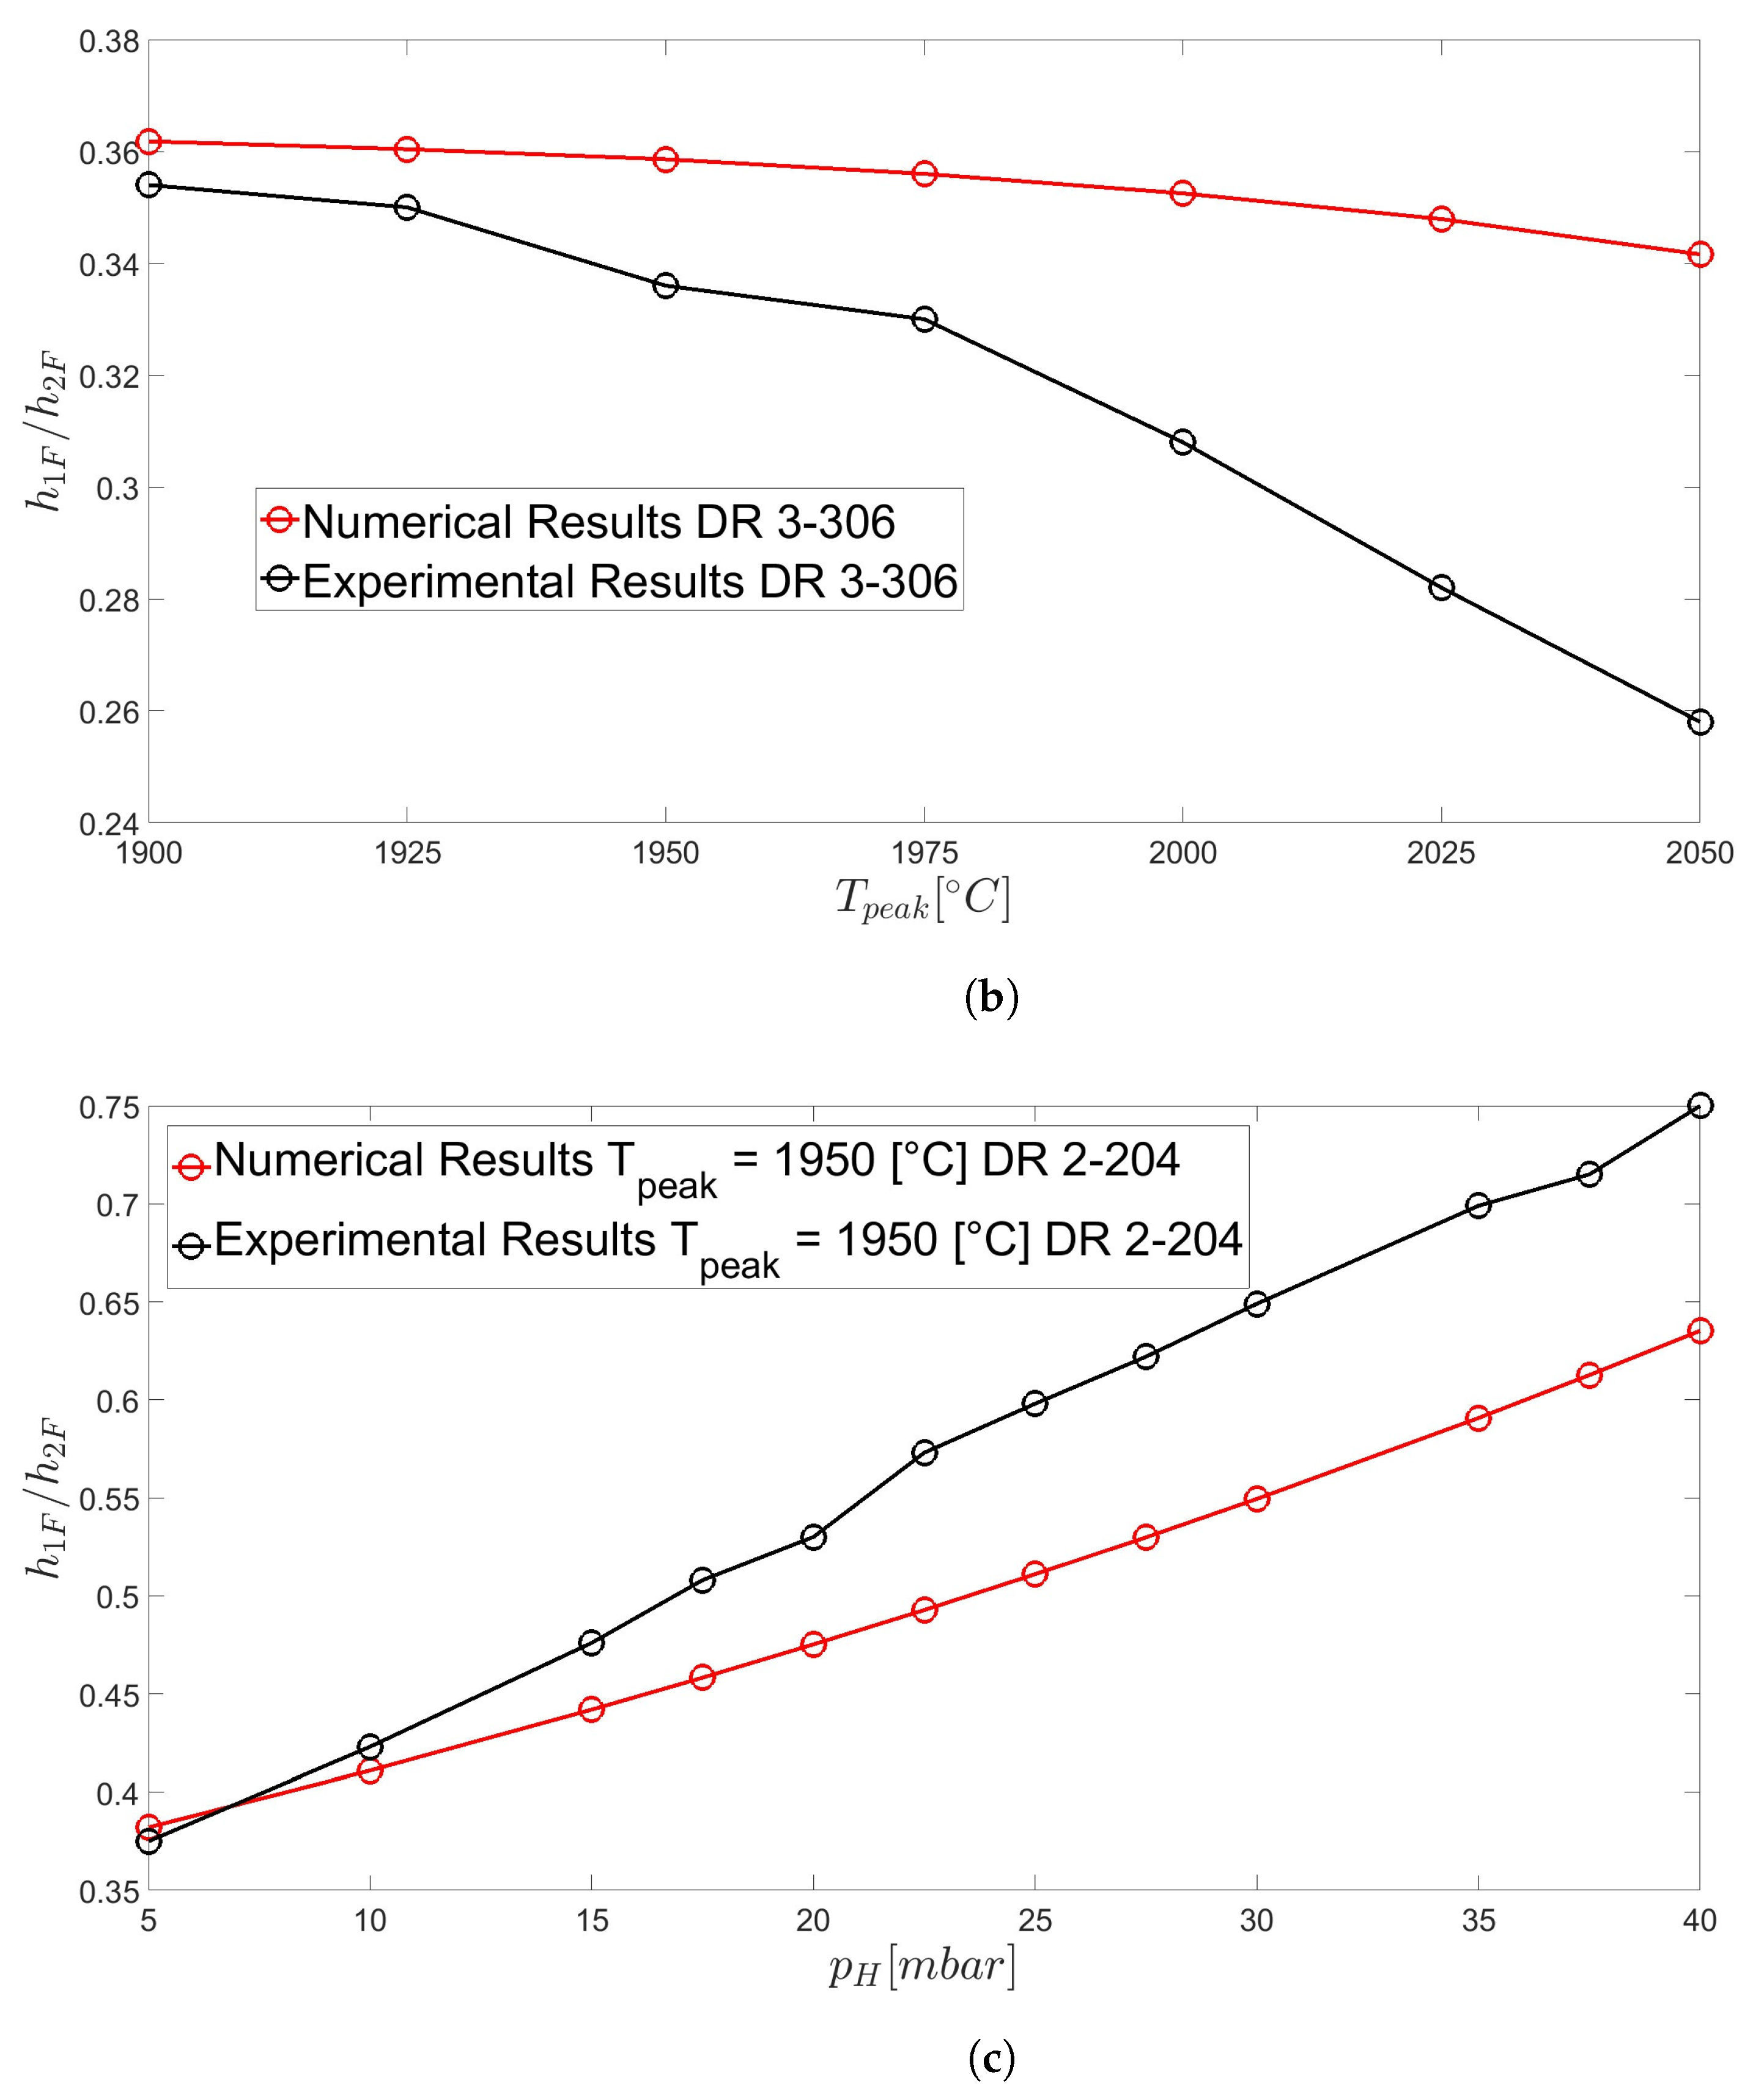
Figure 9.
(a) Overlap of the results obtained with the present model, experimental SEM image, and FEM simulations by Luzi et al. [27]. (b) Overlap of the results of the present model (red circles) and the experimental SEM image of a thirty−six−hole final cross-section by Frosz et al. [52]. The length of the scale bar is 10 (m).

Table 1.
Initial values and parameters employed in the simulations. a Voyce et al. [30], Luzi et al. [27], Luzi et al. [32], Luzi et al. [47], e Frosz et al. [52].
| Parameter | Symbol | Value | Units |
|---|---|---|---|
| Hot zone length | L | 0.12 | m |
| Density | 2200 | kg m | |
| Surface tension | 0.25 | N m | |
| Initial external radius | 1 × 10 | m | |
| Initial internal radius | 3.65 × 10 | m | |
| Drawing ratio | DR 36-1 | ||
| Feed speed | 6 × 10 | m s | |
| Draw speed | 1.67 × 10 | m s | |
| Drawing ratio | DR 54-15 | ||
| Feed speed | 9 × 10 | m s | |
| Draw speed | 2.5 × 10 | m s | |
| Drawing ratio | DR 72-2 | ||
| Feed speed | 1.2 × 10 | m s | |
| Draw speed | 3.33 × 10 | m s | |
| Drawing ratio | DR 1-102 | ||
| Feed speed | 1.67 × 10 | m s | |
| Draw speed | 1.7 × 10 | m s | |
| Drawing ratio | DR 2-204 | ||
| Feed speed | 3.33 × 10 | m s | |
| Draw speed | 3.4 × 10 | m s | |
| Drawing ratio | DR 3-306 | ||
| Feed speed | 5.00 × 10 | m s | |
| Draw speed | 5.1 × 10 | m s | |
| Drawing ratio | DR 20-187 | ||
| Feed speed | 3.33 × 10 | m s | |
| Draw speed | 3.12 × 10 | m s | |
| Drawing ratio | DR 10-42 | ||
| Feed speed | 1.67 × 10 | m s | |
| Draw speed | 7.0 × 10 | m s |
Disclaimer/Publisher’s Note: The statements, opinions and data contained in all publications are solely those of the individual author(s) and contributor(s) and not of MDPI and/or the editor(s). MDPI and/or the editor(s) disclaim responsibility for any injury to people or property resulting from any ideas, methods, instructions or products referred to in the content. |
© 2023 by the authors. Licensee MDPI, Basel, Switzerland. This article is an open access article distributed under the terms and conditions of the Creative Commons Attribution (CC BY) license (https://creativecommons.org/licenses/by/4.0/).
Share and Cite
MDPI and ACS Style
Luzi, G.; Klapper, V.; Delgado, A. Asymptotic Modeling of Optical Fibres: Annular Capillaries and Microstructured Optical Fibres. Fibers 2023, 11, 104. https://doi.org/10.3390/fib11120104
AMA Style
Luzi G, Klapper V, Delgado A. Asymptotic Modeling of Optical Fibres: Annular Capillaries and Microstructured Optical Fibres. Fibers. 2023; 11(12):104. https://doi.org/10.3390/fib11120104
Chicago/Turabian StyleLuzi, Giovanni, Vinzenz Klapper, and Antonio Delgado. 2023. "Asymptotic Modeling of Optical Fibres: Annular Capillaries and Microstructured Optical Fibres" Fibers 11, no. 12: 104. https://doi.org/10.3390/fib11120104
Note that from the first issue of 2016, this journal uses article numbers instead of page numbers. See further details here.