
Influence of the Strengthening Configuration on the Shear Capacity of Reinforced Concrete Beams Strengthened with SRG (Steel-Reinforced Grout) Composites


Department of Civil Engineering, University of Calabria, 87036 Cosenza, Italy
*
Author to whom correspondence should be addressed.
Fibers 2022, 10(7), 57; https://doi.org/10.3390/fib10070057
Submission received: 30 March 2022
/
Revised: 6 May 2022
/
Accepted: 8 June 2022
/
Published: 29 June 2022
(This article belongs to the Topic Fiber-Reinforced Cementitious Composites)
Abstract
:In this paper, the influence of the strengthening configuration on the structural response of U-wrapped SRG (Steel-Reinforced Grout) shear-strengthened reinforced concrete beams was analyzed both experimentally and theoretically. The parameters varied were the ratio sf/wf, sf being the distance between two consecutive U-shaped strips and wf the width of the strips, and the number of steel fabric layers (one and two). Two series of real-scale beams, eleven beams in total with one un-strengthened and ten strengthened, were tested up to failure (the results obtained in the first series of tests were reported in a previously published paper). The obtained results highlighted that the debonding phenomena, which occurred for all the examined strengthening configurations, strongly affected the shear capacity of strengthened beams. An analytical model found based on the “effective strain” of the SRG strips was developed to predict the shear capacity of SRG shear-strengthened reinforced concrete beams. Two analytical relationships were proposed to evaluate the “effective strain” of the SRG strips: The first one was based on a statistical analysis of results obtained by tests on FRCM (Fabric-Reinforced Cementitious Mortar) and SRG shear-strengthened reinforced concrete beams, while the second was developed through the results of single lap direct shear tests performed on SRG-to-concrete joints. The effectiveness of the proposed analytical methods was evaluated through the comparison of their predictions and available experimental results.
1. Introduction
Steel-Reinforced Grout (SRG) composite systems, which comprise unidirectional textiles of ultra-high tensile strength steel cords embedded in an inorganic matrix, developed in the last few years, represents an effective solution for strengthening existing reinforced concrete or masonry structures.
SRG systems were used in many practical applications for flexural and shear strengthening of reinforced concrete beams, the strengthening of masonry elements, and the confinement of both reinforced concrete and masonry columns. Several studies were conducted to investigate the performances of reinforced concrete structures strengthened in flexure with SRG; the obtained results available in the technical literature evidenced significant improvements in both strength and ductility of the strengthened elements [1,2,3,4,5,6]. The available results of research, both experimental and theoretical, devoted to the analysis of the bond of SRG to concrete and SRG to masonry joints are also numerous [7,8]. On the contrary, the results related to the analysis of the performances of reinforced concrete beams strengthened in shear with SRG strips are still limited. The few contributions available in the technical literature [9,10,11,12] are recent and mainly experimental.
Gonzalez-Libreros et al. [4,9] investigated the behavior of reinforced concrete beams strengthened in shear with U-shaped SRG strips. The varied parameters were the internal steel stirrups configuration and the textile installation (with and without anchors). The obtained results provide evidence of a significant increase (30% on average) in the shear capacity of the strengthened beams with respect to the un-strengthened ones, independently of the textile anchorage and a change in the failure modes in beams strengthened with anchored strips.
Thermou et al. [10] analyzed the influence of the steel fabric density (1.57 cords/cm and 4.72 cords/cm) and the number of fabric layers within the SRG strips on the shear capacity of SRG-strengthened reinforced concrete beams. The results of the investigation evidenced that the failure mode changed with the different strengthening configurations of the beams. In particular, a brittle failure in shear occurred in beams strengthened with U-shaped strips while a flexural failure occurred in fully wrapped strengthened beams. Moreover, the shear capacity increased in both U-shaped SRG (104%) and fully wrapped SRG (118% and 168% for strips with one and two textile layers, respectively) strengthened beams with respect to the unreinforced one. Through experimental results, a simple formulation for evaluating the effective strain of the SRG strips was also proposed.
A large experimental investigation was also conducted by Wakjira and Ubead [11,12] on SRG shear-strengthened reinforced concrete beams. Tests were conducted varying the steel fabric density (1.57 cords/cm and 3.14 cords/cm), the strengthening configuration (U-shaped and side-bonded SRG strips), the internal shear reinforcement ratio in the shear span, and the span-to-effective depth (a/d) ratio. Test results evidenced that (i) the failure modes that occurred in all strengthened beams were shear failure associated with SRG-to-concrete debonding; (ii) the shear capacity in strengthened beams increased up to 71% with respect to the un-strengthened ones; (iii) upon increasing the shear capacity of beams, the effectiveness of the U-shaped strengthening configuration was greater than that of the side-bonded one; (iv) the number of internal steel stirrups reduced the SRG strength gain; and (v) the a/d influenced the shear capacity of the SRG-strengthened beams, which increased for deep beams (a/d < 2) while it decreased for slender beams (a/d > 2). An analytical model found based on the simplified modified compression field theory was also developed to estimate the shear capacity of SRG-strengthened reinforced concrete beams.
The results of the above-described research, even if evidencing the improvement of shear capacity and deformability performances of SRG shear-strengthened reinforced concrete beams, are not yet sufficient for a complete and exhaustive understanding of all aspects of the mechanical behavior of the SRG-strengthened elements. Further experimental numerical and analytical studies are needed for an improvement of the technical knowledge, also aimed at wider use of the SRG as a strengthening system of existing reinforced concrete structures.
In this scenario, the authors, in a previous paper [1], reported the first results of an extensive experimental study conducted on SRG shear-strengthened reinforced concrete beams. The study focused on both the experimental performances of strengthened beams and the effectiveness of two proposed models, one analytical and the other numerical, to predict the structural behavior of beams. The results of the study evidenced that the strengthening configuration, the number of SRG layers, and the use of anchors significantly influenced the shear capacity of beams. In addition, the comparison with experimental results provides evidence that the proposed models are able to aptly predict the structural response of strengthened beams.
To complete the study, in this paper, further results of tests on SRG shear-strengthened beams (Series II) are described. A detailed and accurate analysis of all experimental results is reported, focusing on the influence of the strengthening configuration on the structural performances of strengthened beams. With this aim, the considered parameters were the sf/wf ratio, with sf being the distance between two consecutive SRG strips and wf being the width of a single strip and the number of steel fabric layers.
An analytical model to calculate the shear capacity of strengthened beams is provided. The model found based on the Mörsch truss computes the contribution of the SRG composites by values of the effective strain, i.e., the average tensile strain in the composite bridging a shear crack at the debonding.
To evaluate the “effective strain” of the SRG strips, two methods were proposed: The first based on a statistical analysis of results obtained by tests on FRCM shear-strengthened reinforced concrete beams, and the second one developed through the results analysis of single-lap direct shear tests performed on SRG-to-concrete joints. The effectiveness of the two proposed methods was evaluated by a comparison of their predictions and the available experimental results.
2. Materials and Methods
2.1. Experimental Investigation
A total of eleven simply supported reinforced concrete beams were tested in a non-symmetric three-point bending scheme. One of the beams was un-strengthened and considered as a reference, while the remaining ones were shear strengthened with U-shaped strips. All beams were 3000 mm long and had a rectangular cross-section 200 mm wide and 300 mm high. The shear span of the beams was 900 mm long; the shear span-to-height, a/h, was set to 3 for all the beams. Three 18-mm diameter steel bars on the tension side and two 18-mm diameter steel bars on the compression side were used as internal longitudinal reinforcements. The shear span of beams was designed without internal steel stirrups, while 8-mm diameter steel stirrups spaced at 310 mm were positioned in the remaining length. The clear cover of the steel reinforcing bars was 20 mm on all sides of the beams.
The SRG strengthening configuration is illustrated in Figure 1; Table 1 reports the adopted geometrical parameters.
Beams were designated as follows: B-Control identifies the control beam while the strengthened beams were identified with the notation B-nL-mS, where B indicates the beam specimen, nL is the number of fabric layers, and mS is the number of U-shaped SRG strips externally bonded to the beams in the shear span. The tested beams are subdivided into two Series: Series II groups the beams designed as B-1L-2S, B-2L-2S, B-1L-5S, and B-2L-5S while Series I groups the remaining ones [1].
2.2. The SRG Strengthening System
The SRG strengthening system consisted of steel fibers and an inorganic matrix (mineral geo-mortar). The steel fibers were in the form of a unidirectional sheet made of high-strength, galvanized, twisted steel micro-cords held together by a micro-mesh of glass fiber (Figure 2).
The system has a density of 670 g/m2 (low density); the cross-sectional area of each chord was 0.538 mm2, and the distance between two consecutive cords was equal to 0.6 mm with an equivalent thickness of tf = 0.084 mm.
2.3. Mechanical Properties of Materials
Cylindrical concrete specimens were manufactured during the casting of the beams, cured under the same environmental conditions, and tested at 28 days after the casting. Standard tests were conducted on cylinders; the average values of compressive, fcm, and tensile ftm, strength were 14.40 MPa (COV = 0.01) and 2.42 MPa (COV = 0.02), respectively.
The mechanical properties of steel bars were determined by tension tests on three samples of each bar size. The yield strength fy, the yield strain εy, and the ultimate strength fu of the 18-mm diameter bars were 617 MPa (CoV = 0.01), 0.003 mm/mm, and 751 MPa (CoV = 0.02), respectively, while they were 565 MPa (CoV = 0.02), 0.00276 mm/mm, and 644 MPa (CoV = 0.02), for the 8-mm diameter bars.
Steel fibers were characterized by tensile tests performed on five dry textile coupons according to provisions of the guidelines [13]. The obtained values of the elastic modulus, tensile stress, and ultimate strain were 197 GPa (CoV = 0.006), 3.07 GPa (CoV = 0.014), and 0.020 mm/mm (CoV = 0.08), respectively.
According to the EN 1015-11 provisions [14], flexural and compressive tests were performed to determine the mechanical properties of the matrix; the average values were 10.90 MPa (CoV = 0.07) and 55.54 MPa (CoV = 0.02), respectively.
Direct tensile tests were carried out on five SRG specimens with a nominal size of 500 × 50 × 10 mm. Two thin steel plates were glued with epoxy for a length of 100 mm to the ends of the coupon to improve the grip of the textile during testing. The tests were conducted on stroke control. Figure 3a reports a photo of the adopted test setup, while Figure 3b illustrates the stress–strain curves obtained by tests.
The stress–strain curve can be modeled by tri-linear branches, which refer to the un-cracked condition (Stage I), the crack development condition (Stage II), and the cracked condition up to failure (Stage III). Each branch of the curve is characterized by the values of the strain, ε (mm/mm), stress, σ (MPa), and tensile modulus (GPa) reported in the following: Stage I, εI = 0.2 mm/mm (C.o.V. = 0.37), σI =281 MPa (C.o.V. = 0.28), and EI = 1450 GPa (C.o.V.= 0.10); Stage II, εII = 2.0 mm/mm (C.o. V. = 0.21), σII = 533 MPa (C.o.V. = 0.17), and EII = 126 GPa (C.o.V. = 0.27); Stage III, εIII = 20.8 mm/mm (C.o. V. = 0.07), σIII =2768 MPa (C.o.V. = 0.03), and EIII = 54 GPa (C.o.V. = 0.06).
2.4. Bond Tests
Single-lap direct shear tests were performed on 9 SRG-to-concrete joints; 6 specimens were manufactured with 1 layer of steel textile while the remaining 3 were manufactured with 2 layers of textile. SRG strips 50 mm wide were bonded for a length of 260 mm on the sides of concrete prisms, which have a 150 × 200 mm rectangular cross-section as shown in Figure 4. Prior to bonding the SRG strips, the faces of concrete prisms were sandblasted and wetted. The SRG strips were bonded starting at a distance of 40 mm from the prism edge at the loaded end; the fibers were bare outside the bonded area. According to the manufacturer’s recommendations [15], the SRG strips were manufactured with two or three layers of mortar 3 mm thick when one layer or two layers of textile, respectively, were used. The SRG -to-concrete joints were manufactured with the same materials (steel fabrics, mortar, and concrete) used to build the strengthened reinforced concrete beams. The notations DS-nL-Z, where DS indicates the classic push–pull configuration, nL is the number of steel fabric, and Z is the specimen number, were used to identify the tested specimens.
The tests were executed with the setup illustrated in Figure 4; to grip the textile, two thin aluminum plates were glued with epoxy resin for a length of 100 mm to the end of the SRG strips. Concrete prisms were restrained by a steel frame bolted to the testing machine base. As illustrated in Figure 4, the load was uniformly distributed through a steel plate inserted between the steel frame and the top face of concrete prisms. Vertical displacements were measured by four LVDTs; two of them (LVDTa and LVDT b in Figure 4), measured the slip of the fibers at the beginning of the bonded area. Further details about the test setup are reported in [1]. Loads were applied to all specimens under displacement control with a rate of 0.00084 mm/s.
2.5. Specimen Preparation
The strengthening of the beams was performed in accordance with the composite manufacturer’s recommendations. To guarantee good bonding, the bottom concrete surface was wetted before applying the composite. After the application of the first matrix layer (3 mm thick) on the concrete surface, the first layer of steel fabric was applied and pressed into the matrix to assure proper impregnation. The next 3 mm mortar layer covered the steel fabric completely; the operation was repeated until all steel layers were applied and covered by mortar.
2.6. Test Setup and Procedure
After the strengthening, beams were cured at room conditions for at least 30 days before testing. Figure 1 shows the arrangement and the test setup.
A hydraulic jack was used to gradually apply the load, which was measured with a load cell. All beams were loaded until failure at a load rate of approximately 40 N/s. Four LVDTs were used to record vertical displacements during tests; they were located along the beam length. In particular, two LVDTs were located at the point load (one on each side of the beam), while the others were on each support. Figure 1 also illustrates the position of the strain gauges bonded on the concrete surface, steel bars (both longitudinal and transversal), and steel textiles. Deflections, strains, and applied loads were recorded by a data acquisition system.
3. Results
The main results of the tests are described and discussed in the following section.
3.1. Bond Tests
All tested specimens failed by the SRG debonding occurring at the internal matrix–fiber interface as a result of the matrix fracture between the fibers. In all specimens, the interfacial crack formed along the fibers (Figure 5b).
Transversal hairline cracks (Figure 5d) formed in the matrix near the loaded end of the SRG strip and are related to the slippage of the fibers at the internal matrix layer interface [16].
Figure 6 reports the experimental load–global slip curves of all specimens. The analysis of the graphs evidences an initial linear branch, which describes the elastic behavior of the fiber-to-matrix bond. Due to the occurrence of micro-damages, a slight reduction in stiffness was also observed. Once the maximum load Pmax is reached, the response of one-steel-fabric-layer-reinforced specimens was different from that provided by two-layer-reinforced specimens. In the former, the increase in global slips took place in an almost constant applied load until sudden and rapid degradation without softening response occurred; in the latter, the load degradation took place immediately.
This phenomenon was due to a different failure mode observed in specimens reinf orced with two layers of steel fabric. The interfacial crack was observed only in the most internal steel fabric (close to the substrate) due to a rapid load degradation (Figure 5c).
Table 2 summarizes the test results in terms of maximum load and stress; the stress was evaluated as σ = P/nAsy with P being the applied load, n being the number of cords of steel strips (24 in these tests), and Asy being the area of a single steel cord (0.538 mm2).
The average stress values reported in Table 2 were 20% and 15% of the tensile strength of fibers (σfu = 3070 MPa), for one- and two-layer-reinforced specimens, respectively. The average values of debonding strains were 0.31% and 0.235% for one- and two-layer-reinforced specimens, respectively; they are much lower than the fiber rupture strain εfu = 2%.
3.2. Beam Tests
All tested beams exhibited the typical behavior of shear-deficient reinforced concrete beams, with the gradual appearance of diagonal cracks in the shear span region. The un-strengthened beam, B control, failed after the formation of a main diagonal crack in the shear zone, inclined 45° to the beam axis (Figure 7). Shear failures were also observed in all strengthened beams. The failure configurations were different upon varying the sf/wf ratio (i.e., varying the number of U-shaped strips in the shear span). As illustrated in Figure 7, the main diagonal crack in the B-1L-2S beams developed similarly to that of the B Control; it was inclined almost 45° to the beam axis and crossed the U-shaped strip located under the loading point at its end.
The failure of the beam was a typical shear failure with concrete crushing at the loading point: The rupture of the steel fibers was observed in the SRG strip at the level of the diagonal crack. In the B-1L-3S beam (sf/wf = 3.50), the diagonal crack crossed the central U-shaped SRG strip; the failure occurred immediately after the sudden and simultaneous detachment of the central SRG strip from both sides of the beam.
In the B-1L-4S beam (sf/wf = 2.34), the main diagonal crack crossed all the U-shaped strips located in the shear zone; some other diagonal cracks formed and developed between the consecutive strips. At failure, debonding of the two SRG strips located in the shear zone occurred. The main crack in the B-1L-5S beam (sf/wf = 1.70) developed horizontally at the top of the beam near the point load, then it developed a strong inclination (higher than 45°) between two subsequent strips and horizontally at the bottom of the beam. All SRG strips crossed from the diagonal crack were damaged; the failure occurred due to the fiber-to-matrix debonding of the intermediate U-shaped strip. Moreover, in the B-1L-1S beam (sf/wf = 1.00) where a continuous strengthening configuration was adopted, the main diagonal crack formed at an incline of almost 40° to the beam axis. The failure occurred due to the concrete crushing without detachment of the SRG reinforcement. Upon increasing the steel fabric layers (i.e., increasing the rigidity of the SRG strips), the failure configurations of the strengthened beams changed even if shear failure occurred with the formation of the main diagonal crack.
In the B-2L-2S beam, the diagonal crack developed between the two strips; its inclination to the beam axis was almost 30°. The crack crossed the two SRG strips but was not visible; at failure, no detachment of the strips was observed. Two main diagonal cracks formed in the B-2L-3S beam; they crossed all SRG strips; at failure, the intermediate strip detached from the beam (Figure 8). A similar cracking configuration was observed in the B-2L-4S strips where shear failure occurred after the sudden and simultaneous detachment of the intermediate strips from both sides of the beam. A main diagonal crack also formed in the B-2L-5S beam; it developed only between the two U-shaped strips near the loading point.
At failure, the mid-length strip detached from the beam at the matrix-to-substrate interface together with a thin layer of the substrate (Figure 9). A similar failure mode was observed in the B-2L-1S beam in which the U-shaped strip detached completely from the beam.
3.3. Load–Deflection Responses
Figure 10 and Figure 11 report the load-deflection diagrams recorded for all beams; the former reports the curves of beams strengthened with one-layer SRG strips while those of beams strengthened with two-layer SRG strips are reported in the latter. Deflection values are determined as the average of the values measured by LVDTs at the loading point.
An almost tri-linear curve was obtained for all tested beams. The first linear branch represents the elastic behavior of the un-cracked beam. The second almost linear branch describes the behavior of the cracked beam; it ends when the maximum applied load is reached. In the majority of tested beams, the maximum load resulted lower than that corresponding to the first yielding of the steel rebars. After the peak load, the brittle behavior of the beams is described through a descending branch.
The analysis of the curves shows a slight change in stiffness in all shear-strengthened beams when compared to the control. In addition, the response of the one-layer SRG strip strengthened beams was not excessively influenced by the sf/wf ratio: The curves obtained for B-1L-2S and B-1L-3S are, in fact, coincident and similar to B-Control, while the curves of the B-1L-4S, B-1L-5S, and B-1L-1L beams present a similar trend with a slight variation in the peak load values. The response of the two-layer SRG strips was strongly influenced by the sf/wf ratio; as illustrated in Figure 10, the curves are different from each other with a wide variation in the peak loads.
Table 3 reports the load values corresponding to the attainment of the concrete cracking, Pcr, and those at the failure of the beams, Pu, together with the corresponding deflection values δcr and δu.
The data collected in Table 3 highlight the influence of both the sf/wf ratio and the rigidity, Eftf, of the SRG strips on the ultimate load of the tested beams. Figure 12 shows the experimental non-dimensional shear strength values v = Vu/Vucontrol against the sf/wf ratio varying the rigidity of the SRG U-shaped strips. Vu and Vucontrol are the shear values at failure of strengthened and control beams, respectively; they are evaluated as Vu = (l − a)/l Pu, with a being the shear span, l being the beam length, and Pu being the ultimate load. In the same Figure, the regression lines for both beams strengthened with one- and two-layer SRG strips are also reported; as previously mentioned, the R2 values indicate that the results obtained for single-layer SRG strips strengthened beams are more regular than those corresponding to two-layer SRG strips strengthened beams.
As expected, the shear capacity of strengthened beams is higher than that of the control beam; it decreased with the increase in the sf/wf values while it increased with the rigidity of the SRG strips. In particular, for beams strengthened with one-layer SRG U-shaped strips, the increase in the non-dimensional shear capacity is between 1.04 (B-1L-2S beam, sf/wf = 7.0) and 1.2 (B-1L-1S beam, sf/wf = 1.0) while it varied between 1.04 (B-2L-4S beam, sf/wf = 2.34) and 1.80 (B-2L-1S beam, sf/wf = 1.0) for beams strengthened with two-layer SRG strips.
The same value, v = 1.04, was obtained for the B-2L-4S and B-1L-3S beams, as reported in Table 3; this unforeseen result is due to the premature failures that occurred in both beams (complete detachment of the most stressed U-shaped strips).
In Table 3, for all tested beams, the load point deflection values at the cracking load, δcr, and at the ultimate load, δu, are also reported together with the ratio δu/δcr. They provide evidence of the favorable effect of the SRG shear strengthening on the deformability of beams. The δu/δcr ratio evaluated for strengthened beams was, in fact, higher than that of the un-strengthened beam; it increased both when the rigidity of the SRG strips increased and when the sf/wf ratio decreased.
3.4. Strain Analysis
Strains of steel bars and SRG strips were measured by gauges. Two electrical strain gauges were applied to the internal steel bars in tension at the mid-length of the shear zone and at the loading point, while, as illustrated in Figure 1, one strain gauge was applied to the steel fabric of each SRG U-shaped strip.
The applied load–steel bar strain curves obtained by values measured at loading points are reported in Figure 13 and Figure 14; in the same figures, the line corresponding to the yield strain of the steel bars is shown.
By analyzing strain values, it is evident that, except for the B-1L-5S and B-2L-5S beams, the failure of shear-strengthened beams occurred before the yielding of the steel bars. In addition, as shown in Figure 13 and Figure 14, failures of the strengthened beams occurred for strain values in steel bars almost equal to 50% of the yield strain value.
The variation of the steel fabric strain with the applied load is shown in Figure 15 and Figure 16 for all the tested beams. Strains were measured by electrical gauges applied to the steel fabric using an epoxy resin (as recommended by the manufacturer); after connecting the cables, a protective coating was applied to protect the gauges during casting and testing.
The curves refer to the strain measured in the most stressed SRG strips for each tested beam.
By analyzing the curves drawn in both Figures, the highest strain value was measured in the SRG strips bonded to the B-1L-4S and B-2L-1S beams. The maximum values of the measured strain in the SRG strips, εfmax, are also listed in Table 4 for each tested beam. In the table, the exploitation ratio values, εfmax/εfu, with εfu = 0.020 mm/mm, are also reported.
These values provide evidence that the steel textiles strains were very low in comparison to the ultimate strain value of dry textile at failure.
4. Analytical Modeling
The shear capacity of SRG-strengthened reinforced concrete beams can be predicted analytically through a relationship derived from the Ritter–Mörsch criteria failure. The shear capacity, VR, is expressed by Equation (1)
where Vunstr is the shear strength of the un-strengthened beam and Vf is the contribution provided by the external SRG reinforcement. Vf is analytically expressed as [13]:
where εfe and Ef are the effective strain and the elastic modulus of the SRG, respectively, nf is the number of SRG layers bonded on each side of the beam, tf is the equivalent thickness of a single layer of fibers, b and d are the width and the effective depth of the beam’s cross-section, respectively, θ is the angle of the diagonal crack (usually θ = 45°), and α is the inclination angle of the fibers with respect to the beam axis. Equation (3) is founded on the hypothesis that failure is due to the main diagonal crack, inclined as the compressed concrete strut, and the SRG on both sides of the beam furnishes the same contribution to the shear capacity of the beam.
VR = Vunstr + Vf
Vf = 2εfe Ef tf bd (ctg θ + ctg α)(wf/sf) sin2 α
The effective strain, εfe, is the average strain in the fibers crossing the shear crack at failure; its value depends on the bond between the concrete and the strengthening material.
The effective strain is the key parameter to evaluate the shear contribution Vf; its value depends on numerous parameters related to the stress transfer mechanism at the fabric-to-mortar interface and strengthening system-to-concrete substrate. As is well-known in FRCM systems, the stress transfer mechanisms are too complex and governed by many parameters both geometrical and mechanical; as a consequence, it is difficult to define analytical models able to provide a reliable prediction of the effective strain. At the same time, experimental measurements of the strain in the strengthening system are influenced by many variables and, generally, they are not reliable.
In this scenario, the procedures to determine the effective strain of the SRG strengthening systems, available in the technical literature, are based on semi-empirical models generally performed through statistical analyses of experimental results. Two methods for the evaluation of the effective strain were described in the following, and the analytical relationships of εfe were adopted in Equation (2) to calculate the shear contribution provided by the SRG U-shaped strips.
4.1. Method I-Tests on FRCM Shear-Strengthened Reinforced Concrete Beams
This method is founded on the analysis of test results of FRCM shear-strengthened reinforced concrete beams. The experimental values of the FRCM strain are calculated by Equation (3)
where Vfexp is the difference between the experimental shear capacity of strengthened beams, VRexp, and that of the un-strengthened ones, VRunstr, were collected in a database. The analysis of the data allows one to define an analytical relationship for the effective strain of FRCM shear-strengthened reinforced concrete beams. The reduced number of test results, however, makes it difficult to define a general analytical relationship to estimate the effective strain (or the effective stress) of the composite system in shear-strengthened reinforced concrete beams.
(εfe)exp = Vfexp/[2 Ef tf bd (ctg θ + ctg α)(wf/sf) sin2 α]
The Database of Beam Tests Results
The database refers to the results obtained on 64 reinforced concrete beams strengthened in shear with FRCM U-shaped strips. The experimental results were available in the literature; details are reported in [17]. Table 4 reports the range of variability for the main mechanical and geometrical parameters of the collected data (Asw and isw are the area and the spacing of internal steel stirrups, respectively, and fcm is the compressive strength of concrete).
The following analytical relationship was determined through a best-fit analysis of the data
where ρf = 2 tf/b (sf/wf) is the reinforcement ratio, and Ef (GPa) and εfu are the elastic modulus and the ultimate strain of the steel fibers, respectively.
εfe = 0.053 (fcm2/3/Efρf)0.37 εfu
4.2. Method II-Bond Tests
The stress transfer mechanisms at the composite system-to-concrete substrate interface or, for FRCM systems, at the fiber-to-matrix interface, are generally analyzed by the results of bond tests such as single- or double-lap direct shear tests.
The experimental observations of bond tests evidenced that the failure of FRCM composites may occur as debonding at different interfaces, that is, at the matrix–fiber interface with slippage of the fibers (mode A), at the matrix–fiber interface with damage of the matrix (mode B), at the matrix–substrate interface without damage to the substrate (mode C), and at the matrix–substrate interface with the detachment of a thin layer of the substrate (mode D).
As observed in this experimental investigation, the failure (mode D) of some of the SRG shear-strengthened beams (B-1L-4S, B-1L-5S, B-2L-1S, B-2L-3S, and B-2L-5S beams) occurred due to the debonding of the SRG strips following the above-described failure modes.
It is then reasonable to connect the SRG strain values achieved by direct shear tests to the effective strain in the SRG of strengthened reinforced concrete beams. Direct shear tests are commonly performed to determine the mechanical properties of the strengthening system as indicated by certain Codes and Guidelines [13]. Thus, a great number of experimental observations are available and can be adapted to estimate the effective strain of the strengthening systems. With this aim, many direct shear test results obtained on SRG-concrete joints were collected in a database. A regression analysis of the data allowed us to determine the analytical relationship of the SRG effective strain.
The Database of Direct Shear Test Results
The results of 113 direct shear tests performed on SRG-to-concrete joints were collected and analyzed. The experimental results were available in the literature [18,19,20,21]; the range of variability for the parameters characterizing the collected data are listed in Table 5 where γ (g/m2) is the density of the steel fabrics, lb (mm) is the bonded length, bf (mm) is the width of the SRG, fcm (MPa) is the compressive concrete strength, and tf and Af the equivalent thickness and the area of the steel fabric, respectively.
The analysis of the data allowed us to define the analytical relationship to predict the effective strain of the SRG system
εfe = 0.52 (fcm2/3/Eftf)0.6 εfu
4.3. Validation of the Proposed Methods
The two considered methods were validated by the comparison between their predictions and experimental results. The comparison was performed considering only beams shear strengthened with SRG U-shaped strips, which failed via the debonding of strips. The experimental effective strain values, determined by Equation (3), refer to both the results of tests reported in the present investigation and those obtained by Wakjira and Ebead [11,12], Gonzalez et al. [9], and Thermou et al. [10]. Figure 17 illustrates the results of the comparison.
The analysis of the obtained results highlights how Method I provides more accurate predictions than Method II. In fact, the last one overestimates the experimental values for high values of the Efρf/fcm2/3 ratio while it offers better predictions for low values of the Efρf/fcm2/3 ratio.
Further experimental results are, however, needed to better define the numerical coefficients of both methods that, also in this form, could still be adopted to predict the shear capacity of SRG-strengthened reinforced concrete beams.
5. Conclusions
The results of the experimental and theoretical investigation of the shear capacity of SRG-strengthened reinforced concrete beams are presented and described in the paper. The experimental results refer to eleven reinforced concrete beams, one un-strengthened and ten shear-strengthened with SRG U-shaped strips, varying the strengthening configuration (sf/wf ratio) and the rigidity of the SRG strips (Efρf). The shear capacity of the strengthened beams was analytically evaluated by a model founded on the Ritter–Mörsch criteria failure, through an “effective strain”. Two methods were proposed to analytically determine the effective strain, and their predictions were compared with experimental results. The main results of this analysis allow us to draw the following conclusions:
- The failure of strengthened beams that occurred was a shear failure, crushing the concrete and debonding the U-shaped strips.
- The shear capacity of the strengthened beams increased up to 80% of that of the un-strengthened one.
- The shear capacity of the strengthened beams increased with the reinforcement ratio (i.e., the number of steel fabric layers) of the SRG U-shaped strips and decreased with the sf/wf ratio.
- The deformability of the shear-strengthened beams, evaluated as the ratio between the deflection values at the ultimate and the cracking δu/δcr, is higher than that of the un-strengthened beam.
- The proposed analytical methods are able to calculate the effective strain and could be adopted to predict the shear capacity of SRG of strengthened reinforced concrete beams.
- Values of the maximum fiber strains at debonding (i.e., effective strain) determined by the proposed methods on the tested strengthened beams ranged from 0.24% to 0.54%. These values were lower than the ultimate fiber strain (2.0%) while their average value (0.33% and 0.34% for single and two-layer SRG strips, respectively) was in accordance with the one determined by the direct shear tests (0.31%) for single-layer SRG strips, and higher than that determined by the direct shear tests (0.235%) for two-layer SRG strips. This result confirms the validity of the proposed method to evaluate the effective strain through the analysis of the bond test results. Further experimental investigations are still needed to better estimate the numerical coefficients of the proposed analytical relationship (Equation (6)).
Author Contributions
Conceptualization, L.O. and S.V.; methodology, L.O.; software, S.V.; validation, L.O. and S.V.; formal analysis, L.O.; investigation, S.V.; writing—original draft preparation, L.O.; writing—review and editing, L.O. All authors have read and agreed to the published version of the manuscript.
Funding
This research received no external funding.
Institutional Review Board Statement
Not applicable.
Data Availability Statement
Not applicable.
Acknowledgments
The authors would like to express their appreciation to Kerakoll S.p.A. of Sassuolo, Italy, who provided the composite materials in this study.
Conflicts of Interest
The authors declare no conflict of interest.
References
- Ombres, L.; Verre, S. Shear strengthening of reinforced concrete beams with SRG (Steel Reinforced Grout) composites: Experimental investigation and modelling. J. Build. Eng. 2021, 45, 103047. [Google Scholar] [CrossRef]
- Napoli, A.; Realfonzo, R. Reinforced concrete beams strengthened with SRP/SRG systems: Experimental investigation. Constr. Build. Mater. 2015, 93, 654–677. [Google Scholar] [CrossRef]
- Sneed, L.H.; Verre, S.; Carloni, C.; Ombres, L. Flexural behavior of RC beams strengthened with steel-FRCM composite. Eng. Struct. 2016, 127, 686–699. [Google Scholar] [CrossRef]
- Gonzalez-Libreros, J.H.; Sneed, L.H.; D’Antino, T.; Pellegrino, C. Behavior of RC beams strengthened in shear with FRP and FRCM composites. Eng. Struct. 2017, 150, 830–842. [Google Scholar] [CrossRef]
- Carabba, L.; Santandrea, M.; Carloni, C.; Manzi, S.; Bignozzi, M.C. Steel fiber reinforced geopolymer matrix (S-FRGM) composites applied to reinforced concrete structures for strengthening applications: A preliminary study. Compos. Part B 2017, 128, 83–90. [Google Scholar] [CrossRef]
- Ombres, L.; Verre, S. Flexural strengthening of reinforced concrete beams with steel reinforced grout: Experimental and numerical investigation. J. Compos. Constr. 2019, 23, 04019035. [Google Scholar] [CrossRef]
- De Santis, S.; de Felice, G. Steel Reinforced Grout system for the strengthening of masonry structures. Compos. Struct. 2015, 134, 533–548. [Google Scholar] [CrossRef]
- Mazzuca, S.; Hadad, H.A.; Ombres, L.; Nanni, A. Mechanical characterization of Steel-Reinforced Grout for strengthening of existing masonry and concrete structures. J. Mater. Civ. Eng. 2018, 31, 04019037. [Google Scholar] [CrossRef]
- Gonzalez-Libreros, J.H.; Sabau, C.; Sneed, L.H.; Pellegrino, C.; Sas, G. State of the research on shear strengthening of RC beams with FRCM composites. Constr. Build. Mater. 2017, 149, 444–458. [Google Scholar] [CrossRef]
- Thermou, G.E.; Papanikolaou, V.K.; Lioupis, C.; Hajirasouliha, I. Steel-Reinforced Grout (SRG) strengthening of shear critical RC beams. Constr. Build. Mater. 2019, 216, 68–83. [Google Scholar] [CrossRef]
- Wakjira, T.G.; Ebead, U. Experimental and analytical study on strengthening of reinforced concrete T-beams in shear using steel reinforced grout (SRG). Compos. Part B 2019, 177, 107368. [Google Scholar] [CrossRef]
- Wakjira, T.G.; Ebead, U. Shear-to-depth ratio effect on steel reinforced grout strengthened reinforced concrete beams. Eng. Struct. 2020, 216, 110737. [Google Scholar] [CrossRef]
- CNR-DT 215/2018; Guide to Design and Construction of Externally Bonded Fibre Reinforced Inorganic Matrix Systems for Strengthening Existing Structures. National Research Council: Rome, Italy, 2020.
- EN 1015-11:1999; Methods of Test for Mortar for Masonry-Part 1.1. Determination of Flexural and Compressive Strength of Hardened Mortar. European Committee for Standardization: Brussels, Belgium, 2019.
- Kerakoll, S.P.A. 2017. Available online: www.kerakoll (accessed on 1 September 2018).
- Ombres, L.; Verre, S. Experimental and numerical investigation on the Steel Reinforced Grout (SRG) Composite-to-Concrete bond. J. Compos. Sci. 2020, 4, 182. [Google Scholar] [CrossRef]
- Ombres, L.; Verre, S. Shear Performance of FRCM Strengthened RC Beams. In Composites with Inorganic Matrix for Repair of Concrete and Masonry Structures; De Felice, G., Sneed, L.H., Nanni, A., Eds.; American Concrete Institute: Farmington Hills, MI, USA, 2018; pp. 7.1–7.12. [Google Scholar]
- Ascione, F.; Lamberti, M.; Napoli, A.; Realfonzo, R. Experimental bond behavior of Steel Reinforced Grout system for strengthening concrete elements. Constr. Build. Mater. 2020, 232, 117105. [Google Scholar] [CrossRef]
- Ascione, F.; Faella, C.; Lamberti, M.; Napoli, A.; Realfonzo, R. Strengthening of RC structures with SRP/SRG systems: Bond test. In Proceedings of the Durability and Sustainability of Concrete Structures (DSCS-2018) Conference, Moscow, Russia, 6–7 June 2018. [Google Scholar]
- Bencardino, F.; Condello, A.; Ashour, F.A. Single-lap shear bond tests on steel reinforced polymer matrix concrete joints. Compos. Part B 2017, 110, 62–71. [Google Scholar] [CrossRef] [Green Version]
- Ombres, L.; Verre, S. Bond performances of SRG composites: Experimental and numerical investigation. In Proceedings of the International Conference on Composites in Civil Engineering-CICE 2021, Istanbul, Turkey, 8–10 December 2021; pp. 1–11. [Google Scholar]
Figure 1.
Loading scheme and internal reinforcement; strengthening configuration of (a) four strips, (b) continuous, (c) two strips, (d) three strips and (e) five strips.
Figure 1.
Loading scheme and internal reinforcement; strengthening configuration of (a) four strips, (b) continuous, (c) two strips, (d) three strips and (e) five strips.
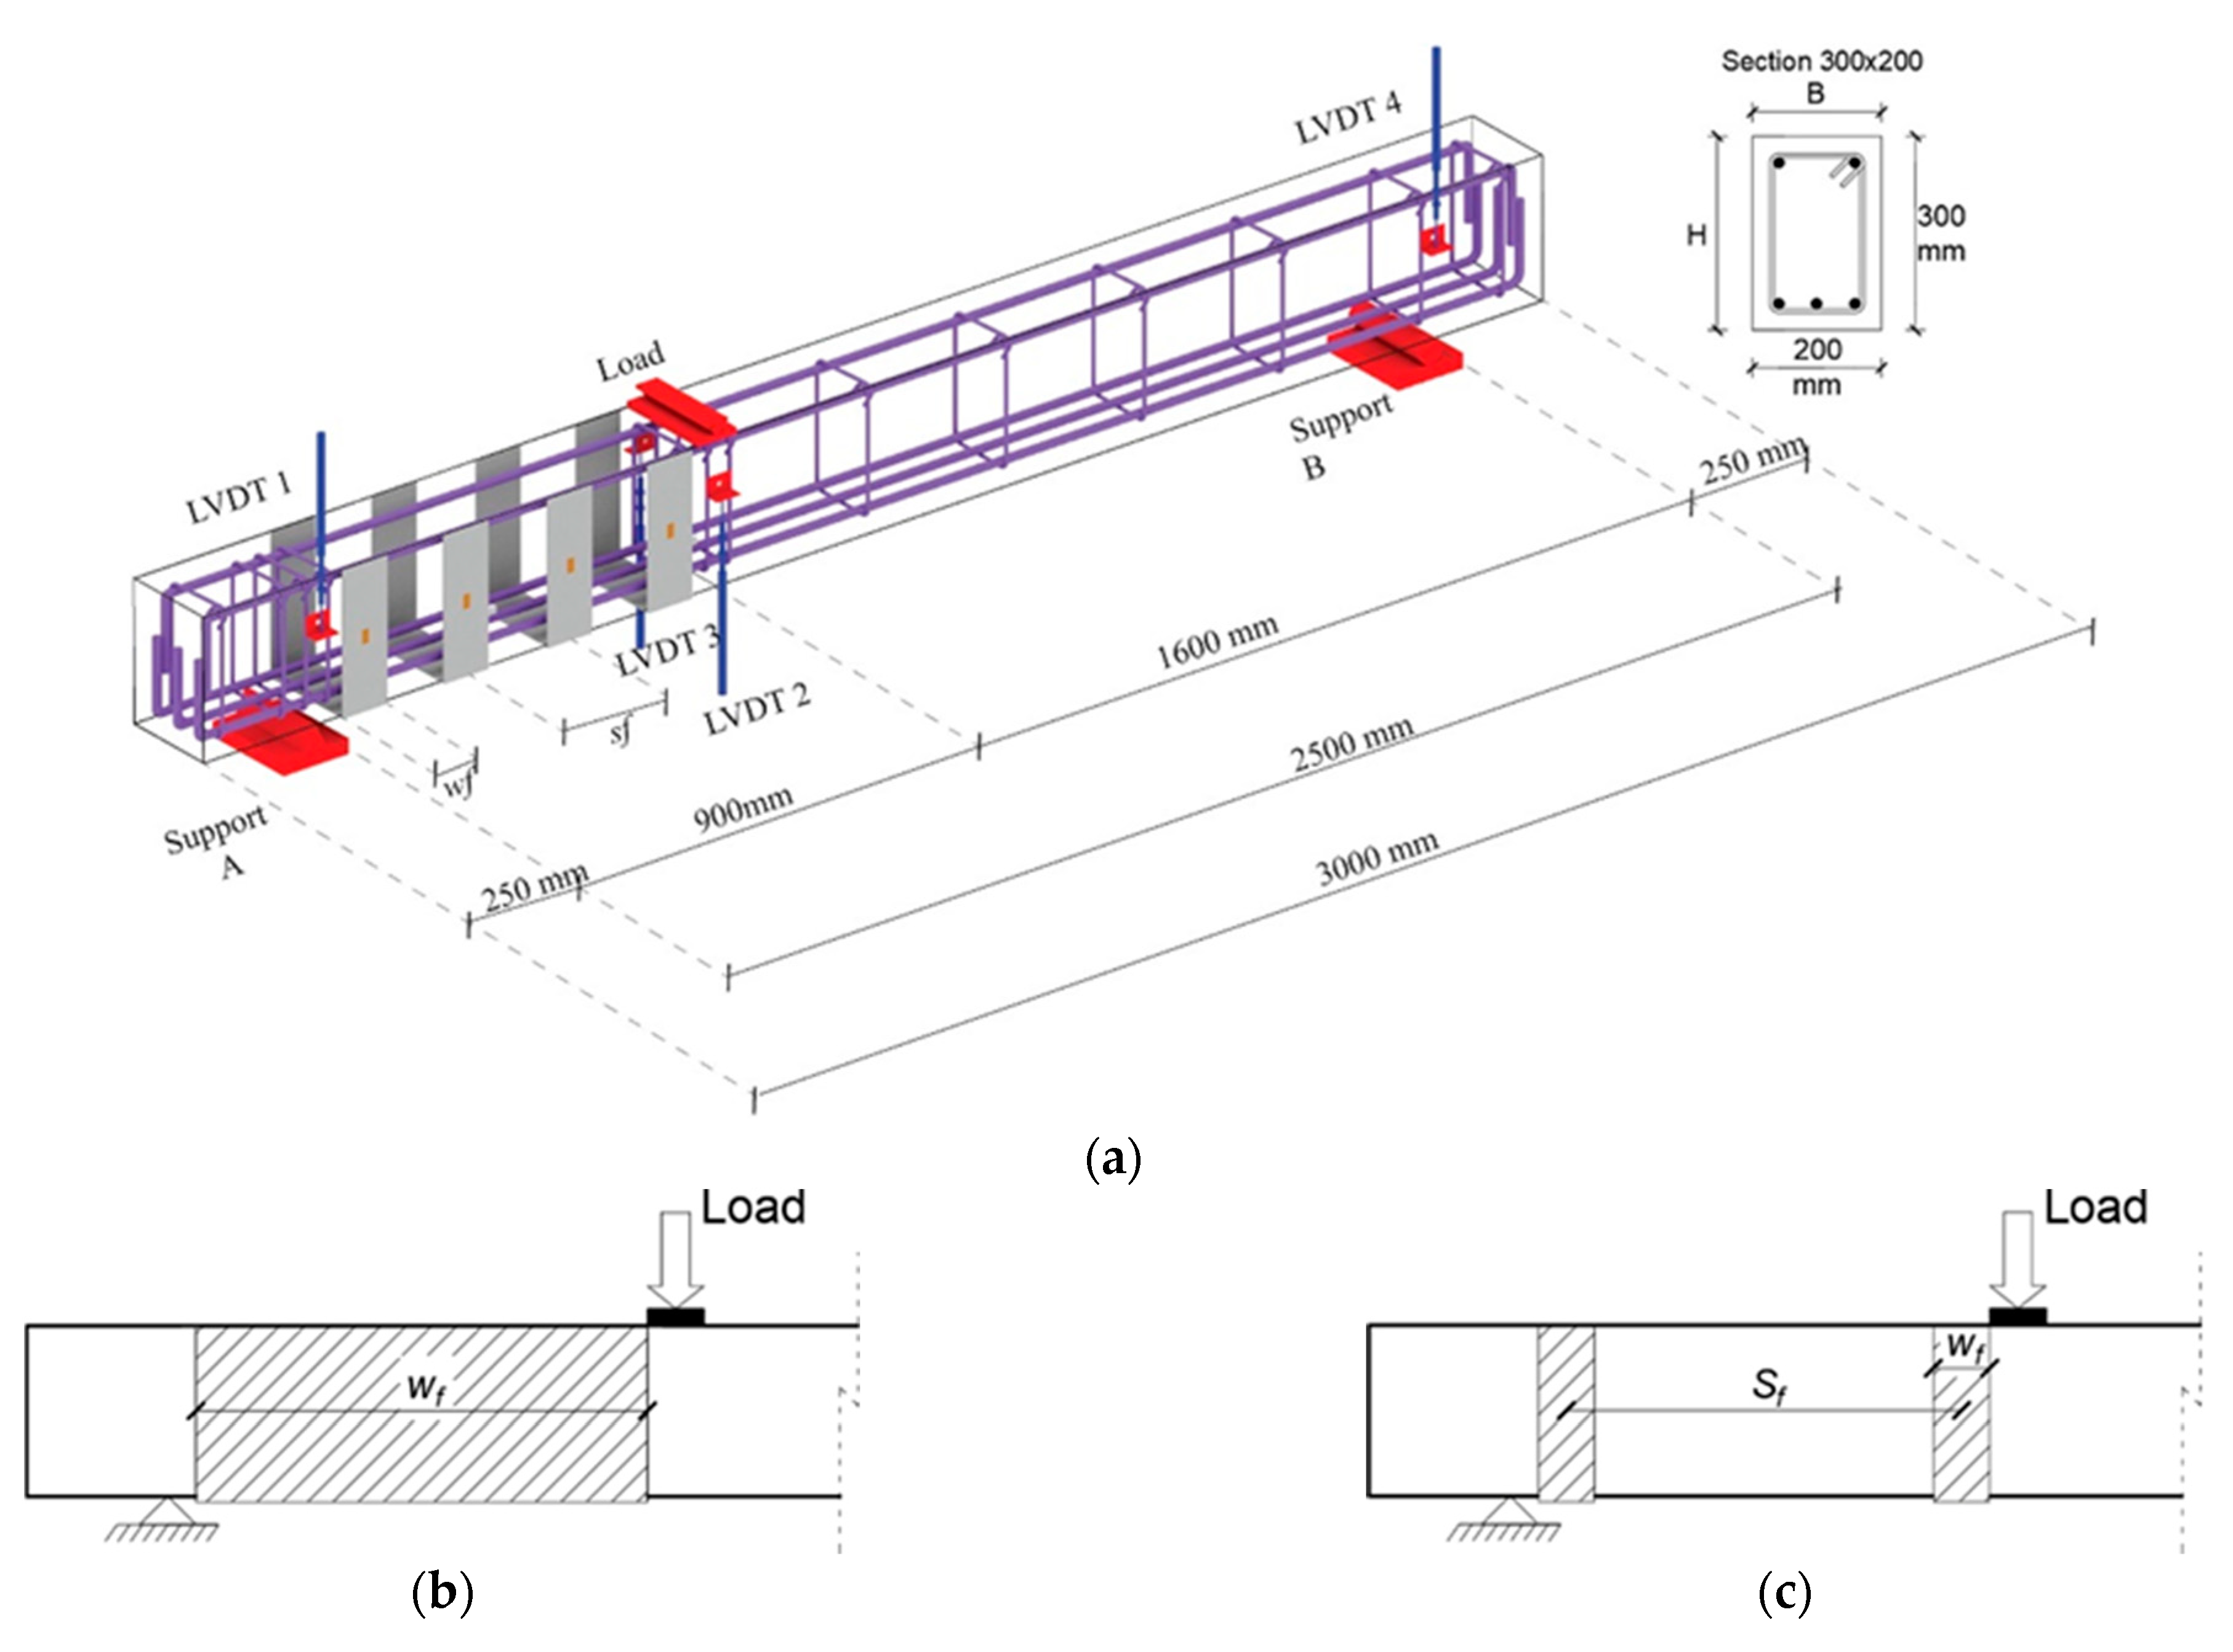

Figure 2.
Steel fabric.

Figure 3.
SRG tensile tests: (a) Test setup and (b) stress–strain curves.

Figure 4.
Direct shear test: Test setup and scheme.

Figure 5.
Direct shear test: (a) Transversal cracks of specimen with one layer of steel fabric (1L), (b) interfacial crack of specimen with one layer of steel fabric; (c) failure of specimens with one layer of steel fabric; (d) failure of specimens with two layers of steel fabric (2L).
Figure 5.
Direct shear test: (a) Transversal cracks of specimen with one layer of steel fabric (1L), (b) interfacial crack of specimen with one layer of steel fabric; (c) failure of specimens with one layer of steel fabric; (d) failure of specimens with two layers of steel fabric (2L).

Figure 6.
Load–global slip curves.

Figure 7.
Failure configurations of beams strengthened with one-layer SRG U-shaped strips.

Figure 8.
Failure configurations of beams strengthened with two-layer SRG U-shaped strips.

Figure 9.
Debonding of the U strips at failure.


Figure 10.
Load–deflection curves for beams strengthened with one layer of steel fabrics.

Figure 11.
Load–deflection curves for beams strengthened with two layers of steel fabrics.

Figure 12.
Non-dimensional shear capacity v = Vu/Vucontrol versus sf/wf.

Figure 13.
Load–steel bar strain curves for beams strengthened with one-layer SRG strips.

Figure 14.
Load–steel bar strain curves for beams strengthened with two-layer SRG strips.

Figure 15.
Load–steel fabric strain curves for beams strengthened with single-layer SRG strips.

Figure 16.
Load–steel bar strain curves for beams strengthened with two-layer SRG strips.


Table 1.
Details of tested beams.
| Beam’s Designation | wf (mm) | sf (mm) | sf/wf | nL | tf (mm) |
|---|---|---|---|---|---|
| B-control | - | - | - | - | - |
| B-1L-2S | 100 | 700 | 7.00 | 1 | 0.084 |
| B-2L-2S | 100 | 700 | 7.00 | 2 | 0.168 |
| B-1L-3S | 100 | 350 | 3.50 | 1 | 0.084 |
| B-2L-3S | 100 | 350 | 3.50 | 2 | 0.168 |
| B-1L-4S | 100 | 234 | 2.34 | 1 | 0.084 |
| B-2L-4S | 100 | 234 | 2.34 | 2 | 0.168 |
| B-1L-5S | 100 | 175 | 1.75 | 1 | 0.084 |
| B-2L-5S | 100 | 175 | 1.75 | 2 | 0.168 |
| B-1L-1S | 100 | 100 | 1.00 | 1 | 0.084 |
| B-2L-1S | 100 | 100 | 1.00 | 2 | 0.168 |
tf is the equivalent thickness of steel fabric.
Table 2.
Bond test results.
| Specimen Designation | Maximum Load (KN) | Maximum Stress (MPa) |
|---|---|---|
| DS-1L-1 | 8.21 | 635.84 |
| DS-1L-2 | 7.90 | 611.83 |
| DS-1L-3 | 7.67 | 594.02 |
| DS-1L-4 | 7.67 | 594.02 |
| DS-1L-5 | 8.12 | 628.87 |
| DS-1L-6 | 7.95 | 615.71 |
| Average | 7.92 | 613.38 |
| DS-2L-1 | 11.96 | 463.13 |
| DS-2L-2 | 11.94 | 462.36 |
| DS-2L-3 | 11.99 | 464.29 |
| Average | 11.96 | 463.13 |
Table 3.
Test results.
| Beam | sf/wf | Pcr (kN) | δcr (mm) | Pu (kN) | δu (mm) | Pu/Puc | εfmax (‰) | εfmax/εfu | Failure Mode |
|---|---|---|---|---|---|---|---|---|---|
| B-control | - | 16.10 | 1.40 | 79.80 | 6.49 | 1.00 | - | - | Shear |
| B-1L-2S | 7.00 | 23.86 | 1.33 | 83.00 | 6.76 | 1.04 | 0.14 | 0.007 | Shear |
| B-2L-2S | 7.00 | 20.84 | 1.09 | 87.37 | 7.13 | 1.09 | 0.14 | 0.007 | Shear |
| B-1L-3S | 3.50 | 24.88 | 1.06 | 83.96 | 6.32 | 1.05 | 2.11 | 0.100 | Shear * |
| B-2L-3S | 3.50 | 24.88 | 1.35 | 121.85 | 12.95 | 1.53 | 0.90 | 0.040 | Debonding |
| B-1L-4S | 2.34 | 23.80 | 1.25 | 99.50 | 8.70 | 1.25 | 7.37 | 0.367 | Debonding |
| B-2L-4S | 2.34 | 25.05 | 1.80 | 82.99 | 9.50 | 1.04 | 1.85 | 0.090 | Shear * |
| B-1L-5S | 1.75 | 26.59 | 1.33 | 105.20 | 11.20 | 1.32 | 0.17 | 0.008 | Debonding |
| B-2L-5S | 1.75 | 26.63 | 1.26 | 116.89 | 8.04 | 1.46 | 0.64 | 0.032 | Debonding |
| B-1L-1S | 1.00 | 20.10 | 1.19 | 95.20 | 8.50 | 1.20 | 2.20 | 0.104 | Shear |
| B-2L-1S | 1.00 | 19.73 | 1.30 | 143.42 | 15.87 | 1.80 | 4.04 | 0.192 | Debonding |
* Premature detachment of the U-strips.
Table 4.
Range of variability for the collected data.
| B (mm) | d (mm) | Asw (mm2) | isw (mm) | Ef (Gpa) | fcm (MPa) | tf (mm) | sf (mm) | wf (mm) | |
|---|---|---|---|---|---|---|---|---|---|
| Range | 150–300 | 177–400 | 0–100 | 0–500 | 73–270 | 14–45 | 0.042–0.254 | 50–2000 | 100–2000 |
Table 5.
Range of variability for the collected data of bond tests.
| γ (g/m2) | lb (mm) | bf (mm) | fcm (MPa) | tf (mm) | Af (mm2) | |
|---|---|---|---|---|---|---|
| Range | 370–2200 | 50–450 | 50–100 | 13–40.9 | 0.084–0.254 | 0.84–2.54 |
Publisher’s Note: MDPI stays neutral with regard to jurisdictional claims in published maps and institutional affiliations. |
© 2022 by the authors. Licensee MDPI, Basel, Switzerland. This article is an open access article distributed under the terms and conditions of the Creative Commons Attribution (CC BY) license (https://creativecommons.org/licenses/by/4.0/).
Share and Cite
MDPI and ACS Style
Ombres, L.; Verre, S. Influence of the Strengthening Configuration on the Shear Capacity of Reinforced Concrete Beams Strengthened with SRG (Steel-Reinforced Grout) Composites. Fibers 2022, 10, 57. https://doi.org/10.3390/fib10070057
AMA Style
Ombres L, Verre S. Influence of the Strengthening Configuration on the Shear Capacity of Reinforced Concrete Beams Strengthened with SRG (Steel-Reinforced Grout) Composites. Fibers. 2022; 10(7):57. https://doi.org/10.3390/fib10070057
Chicago/Turabian StyleOmbres, Luciano, and Salvatore Verre. 2022. "Influence of the Strengthening Configuration on the Shear Capacity of Reinforced Concrete Beams Strengthened with SRG (Steel-Reinforced Grout) Composites" Fibers 10, no. 7: 57. https://doi.org/10.3390/fib10070057
Note that from the first issue of 2016, this journal uses article numbers instead of page numbers. See further details here.