

Chemical Imaging of the Polylactic Acid − Wood Adhesion Interface of Bonded Veneer Products

1
Manufacturing and Bioproducts, Scion, Rotorua 3010, New Zealand
2
Thünen Institute of Wood Research, Leuschnerstrasse 91c, 21031 Hamburg, Germany
*
Author to whom correspondence should be addressed.
Fibers 2022, 10(2), 17; https://doi.org/10.3390/fib10020017
Submission received: 3 December 2021
/
Revised: 25 January 2022
/
Accepted: 27 January 2022
/
Published: 9 February 2022
Abstract
:The increasing use and potential of polylactic acid (PLA) in wood-based composite materials due to its greater performance over common polyolefins provides the justification for a closer examination of the PLA−wood adhesion performance. In PLA-bonded laminates and composites, the optical differentiation between PLA polymer and wood is not possible and necessitates complex techniques such as fluorescence microscopy to characterize the PLA adhesion interface. In this study, spatial chemical imaging via FTIR analysis has been successfully applied to directly identify PLA bondlines within PLA-bonded veneer laminates and to determine the migration of semi-crystalline and amorphous PLAs from the bondline into the wood structure. This method uses involved point contouring line spectra over the bondline area to distinguish the PLA polymer from the wood. From this quantitative analysis, it is revealed that bondline thickness and PLA penetration values depend on pressing temperature, and this has implications for the reinforcement of the adhesion interface and the bondline performance. Furthermore, in developing a methodology for this assessment, this spatial chemical imaging approach can equally be applied to other polyester, amide, and urethane systems used to bond wood laminates.
Keywords:
polylactic acid; PLA; laminates; plywood; birch; chemical imaging; FTIR; interfacial adhesion; adhesion interface1. Introduction
Sustainability and the decarbonization of products and materials are at the forefront of many sectors, including building and construction. How these materials impact the indoor living environment, carbon storage, and environmental declaration metrics must now meet consumer expectations for new and retrofit buildings. Bio-based plastics such as poly (lactic acid) (PLA) and other biodegradable plastics already enjoy a preference in packaging and consumer products due to their carbon footprint and end-of-life options [1,2,3]. In wood plastic composite (WPC) and overlay products, polyolefin plastics are typically used [3,4]. However, there is an emerging body of research, as well as some commercial applications, where PLA is being developed as a replacement for polyolefins plastics in WPC applications and products [4]. While nascent in industrial uptake, there is significant potential for PLA use in building and construction materials [5]. This is primarily WPCs, but also includes reconstituted and laminated products [6,7].
Poly (lactic acid) use to bond wood has been demonstrated in a range of product applications, including fiber-, particle-, and veneer-bonded products [6,8,9,10]. The polymer can be applied as a dry hot-melt or as an emulsion-based adhesive, and be used to achieve interior grade (Type II) property requirements for plywood, for example. The interfacial adhesion developed between wood and PLA polymer is considerably greater than for common polyolefin adhesives [11]. The adhesion of PLA-based hot melt in wood joints can further be improved using, for example, plasma treatment [12]. As an adhesive, this performance is dependent on composite processing temperatures with distinctions also apparent due to the wood species used in the composite materials [6,7]. At a fundamental level, higher temperatures are associated with lower PLA melt viscosities and the promotion of PLA migration into the wood substrate. The wood ultrastructure also dictates the extent of PLA migration, with hardwood species exhibiting greater rates of PLA ingress than softwoods. The grade of PLA employed also affects the level of ingress into the wood. Differences in adhesive performance may be attributable to the over-penetration of PLA into the wood substrate, akin to that for liquid wood adhesives use [13]. However, the techniques to observe and measure this have so far been restricted to fluorescence microscopy use with a pre-modified PLA polymer [6,7]. If the PLA could be directly analyzed, there is an opportunity to learn more about the adhesion formed at the PLA−wood interface, and the inter-dependencies of the processing variables, wood species, and PLA types on the composite and laminate performance.
Chemical imaging using FTIR has had a decades-long development and has recently become a powerful analysis technique through the wider uptake of FTIR microscopy [14,15]. In wood-based products, chemical imaging has been extended to qualitative assessments to determine the extent of wood modifications [16] and treatments [17], and the chemical interactions of wood components at the polymer interface [18]. In the current study, we develop the use of spatial chemical imaging employing FTIR microscopy to characterize the interfacial adhesion of PLA-bonded wood laminates. In employing this technique, both qualitative and quantification assessments of the PLA−wood interface have been undertaken. PLA bondline thicknesses and PLA ingress in the wood polymer matrix have been evaluated and compared to the processing parameters used to prepare PLA laminates. Ultimately, it is envisaged that spatial chemical imaging methodology can be used to rapidly assess the processing and performance attributes of PLA- and other sustainable polyester-based wood composites and products.
2. Results
2.1. Microscopy Assessments of PLA Bondlines
Initial microscopy assessments of consolidated veneer panel specimens were undertaken to determine PLA bondline morphologies of 5-ply laminates produced at differing pressing temperatures (Figure S1, Supplementary Materials). Shown in Figure 1 are examples of 5-ply laminates formed with birch veneer and PLA foils imaged by either low-resolution light microscopy or micro-computer tomography imaging. Evident in these images is that the PLA and wood matrix cannot be easily distinguished due to PLA being colourless or definitively identified due to grey-scale use. Nonetheless, images show differences in the bondline thickness across the pressing temperatures employed. These visual distinctions also extend to differences between the outer, surface and inner, core bondline thicknesses together with microscopy assessments of failed regions of tested specimens (Supplementary Materials).
Shown in Table 1 are the bondline thickness values obtained from low resolution microscopy images of five-ply laminate sections. Generally, bondline thickness values tend to reduce with a higher pressing temperature, a trend previously observed for in situ-bonded two-ply veneer PLA foil laminates [6]. It was also evident across samples there were distinctions between outer (surface) and inner (core) laminate bondlines at each pressing temperature. For example, the birch samples bonded with amorphous PLA showed a stepwise reduction in outer bondline thickness values from 130 μm (140 °C) to 40 μm (180 °C). This trend was also reflected in the inner bondlines thickness values, which were found to be thicker (170 μm) at a lower pressing temperature, but similarly decreased to ca. 40 μm at 180 °C. For the semi-crystalline PLA, the trends in decreasing bondline thickness were comparable. For example, at 140 °C, the inner bondline thickness was ca. 160 μm, with this reducing to 30 μm at 180 °C. For analogous spruce−PLA samples provided for comparison, bondline thickness values ranged between 30 to 170 μm across the outer and inner bondlines, and similarly reduced with greater pressing temperatures. Furthermore, with this series of spruce samples, the bondline thickness values were generally equivalent to those established with birch veneer. Complementary microscopy assessments of the tensile strength bondline failures for tested birch and spruce laminated samples are provided in the Supplementary Materials. Across all samples there was a range of wood failure rates. While high, this variability was likely a combination of wood degradation resulting from the higher pressing temperature regimes employed and degree of PLA migration away from the bondline into the wood ultrastructure.
While inferred in previous work [6,7,19], in this study, it was found that bondline thickness values for samples pressed with differing PLA types and temperatures (140–180 °C) could be related to their tensile strength and failure modes of the tested bondlines (Supplementary Materials). Tensile strength values correlated well with bondline thickness values (R2 > 0.74) for each PLA type. Specifically, strong correlations were found for birch bondlines formed with amorphous PLA for both outer (R2 = 0.93) and inner bondlines (R2 = 0.79). In the case of bondline wood failures, despite their apparent variability, a comparison of values confirmed a relationship (R2 = 0.59) between outer bondline thickness values and tensile testing wood failure rates. Moreover, a higher correlation (R2 = 0.70) was found with wood failure for outer bondlines formed with amorphous PLA across 140–180 °C. In contrast, no correlation was evident with semi-crystalline PLA (R2 = 0.42), which had greater variability in wood failures across the pressing temperatures. In the case of inner bondline comparisons, contrasting results were found for amorphous (R2 = 0.53) and semi-crystalline PLA (R2 = 0.97), indicative of other factors contributing to bonding strength, such as panel internal temperature profiles, PLA polymer properties and flow away from bondlines into the wood ultrastructure and the complexity of each contributing to the PLA-wood adhesion interface [6,7].
2.2. Qualitative Assessment of PLA Adhesion Interface Using Chemical Imaging
Utilizing qualitative methodology, chemical imaging of the representative bondlines was undertaken to develop information on the PLA bondline and PLA interphase within the wood matrix. Shown in Figure 2 is a cross-section of an inner bondline formed with amorphous PLA at 160 °C. Firstly, apparent in this image is the varying thickness of this bondline, which ranged between 90 μm and 200 μm. Additionally, presented within this image are a series of FTIR spectra at several points extending across the bondline and image cross-section (Figure 2B). Each point spectrum will be a composite of the polyester polymer and the chemical components present in wood. The PLA polymer ester carbonyl ν(C=O) peak at ca. 1750 cm−1 is a distinctive absorption and separated from peaks of key wood components such as the lignin aryl ν(C=C) peak at ca. 1650 cm−1. Evident in the point spectra across the image is the dominance of this PLA ester carbonyl absorption in contrast to the lignin aryl peak, making it possible to readily distinguish PLA from the wood matrix. As shown in Figure 2B, the PLA carbonyl peak was observed with varying intensities in different point spectra, indicative of differing PLA concentrations across the bondline and within the wood ultrastructure. By quantifying the ester carbonyl peak intensity, a contour plot can be produced defining the presence and concentration of PLA across the bondline and within the wood ultrastructure of both veneers (Figure 3). Moreover, from these contour plots, it is possible to define the PLA bondline thickness and estimate the extent of PLA migration away from the bondline into the wood.
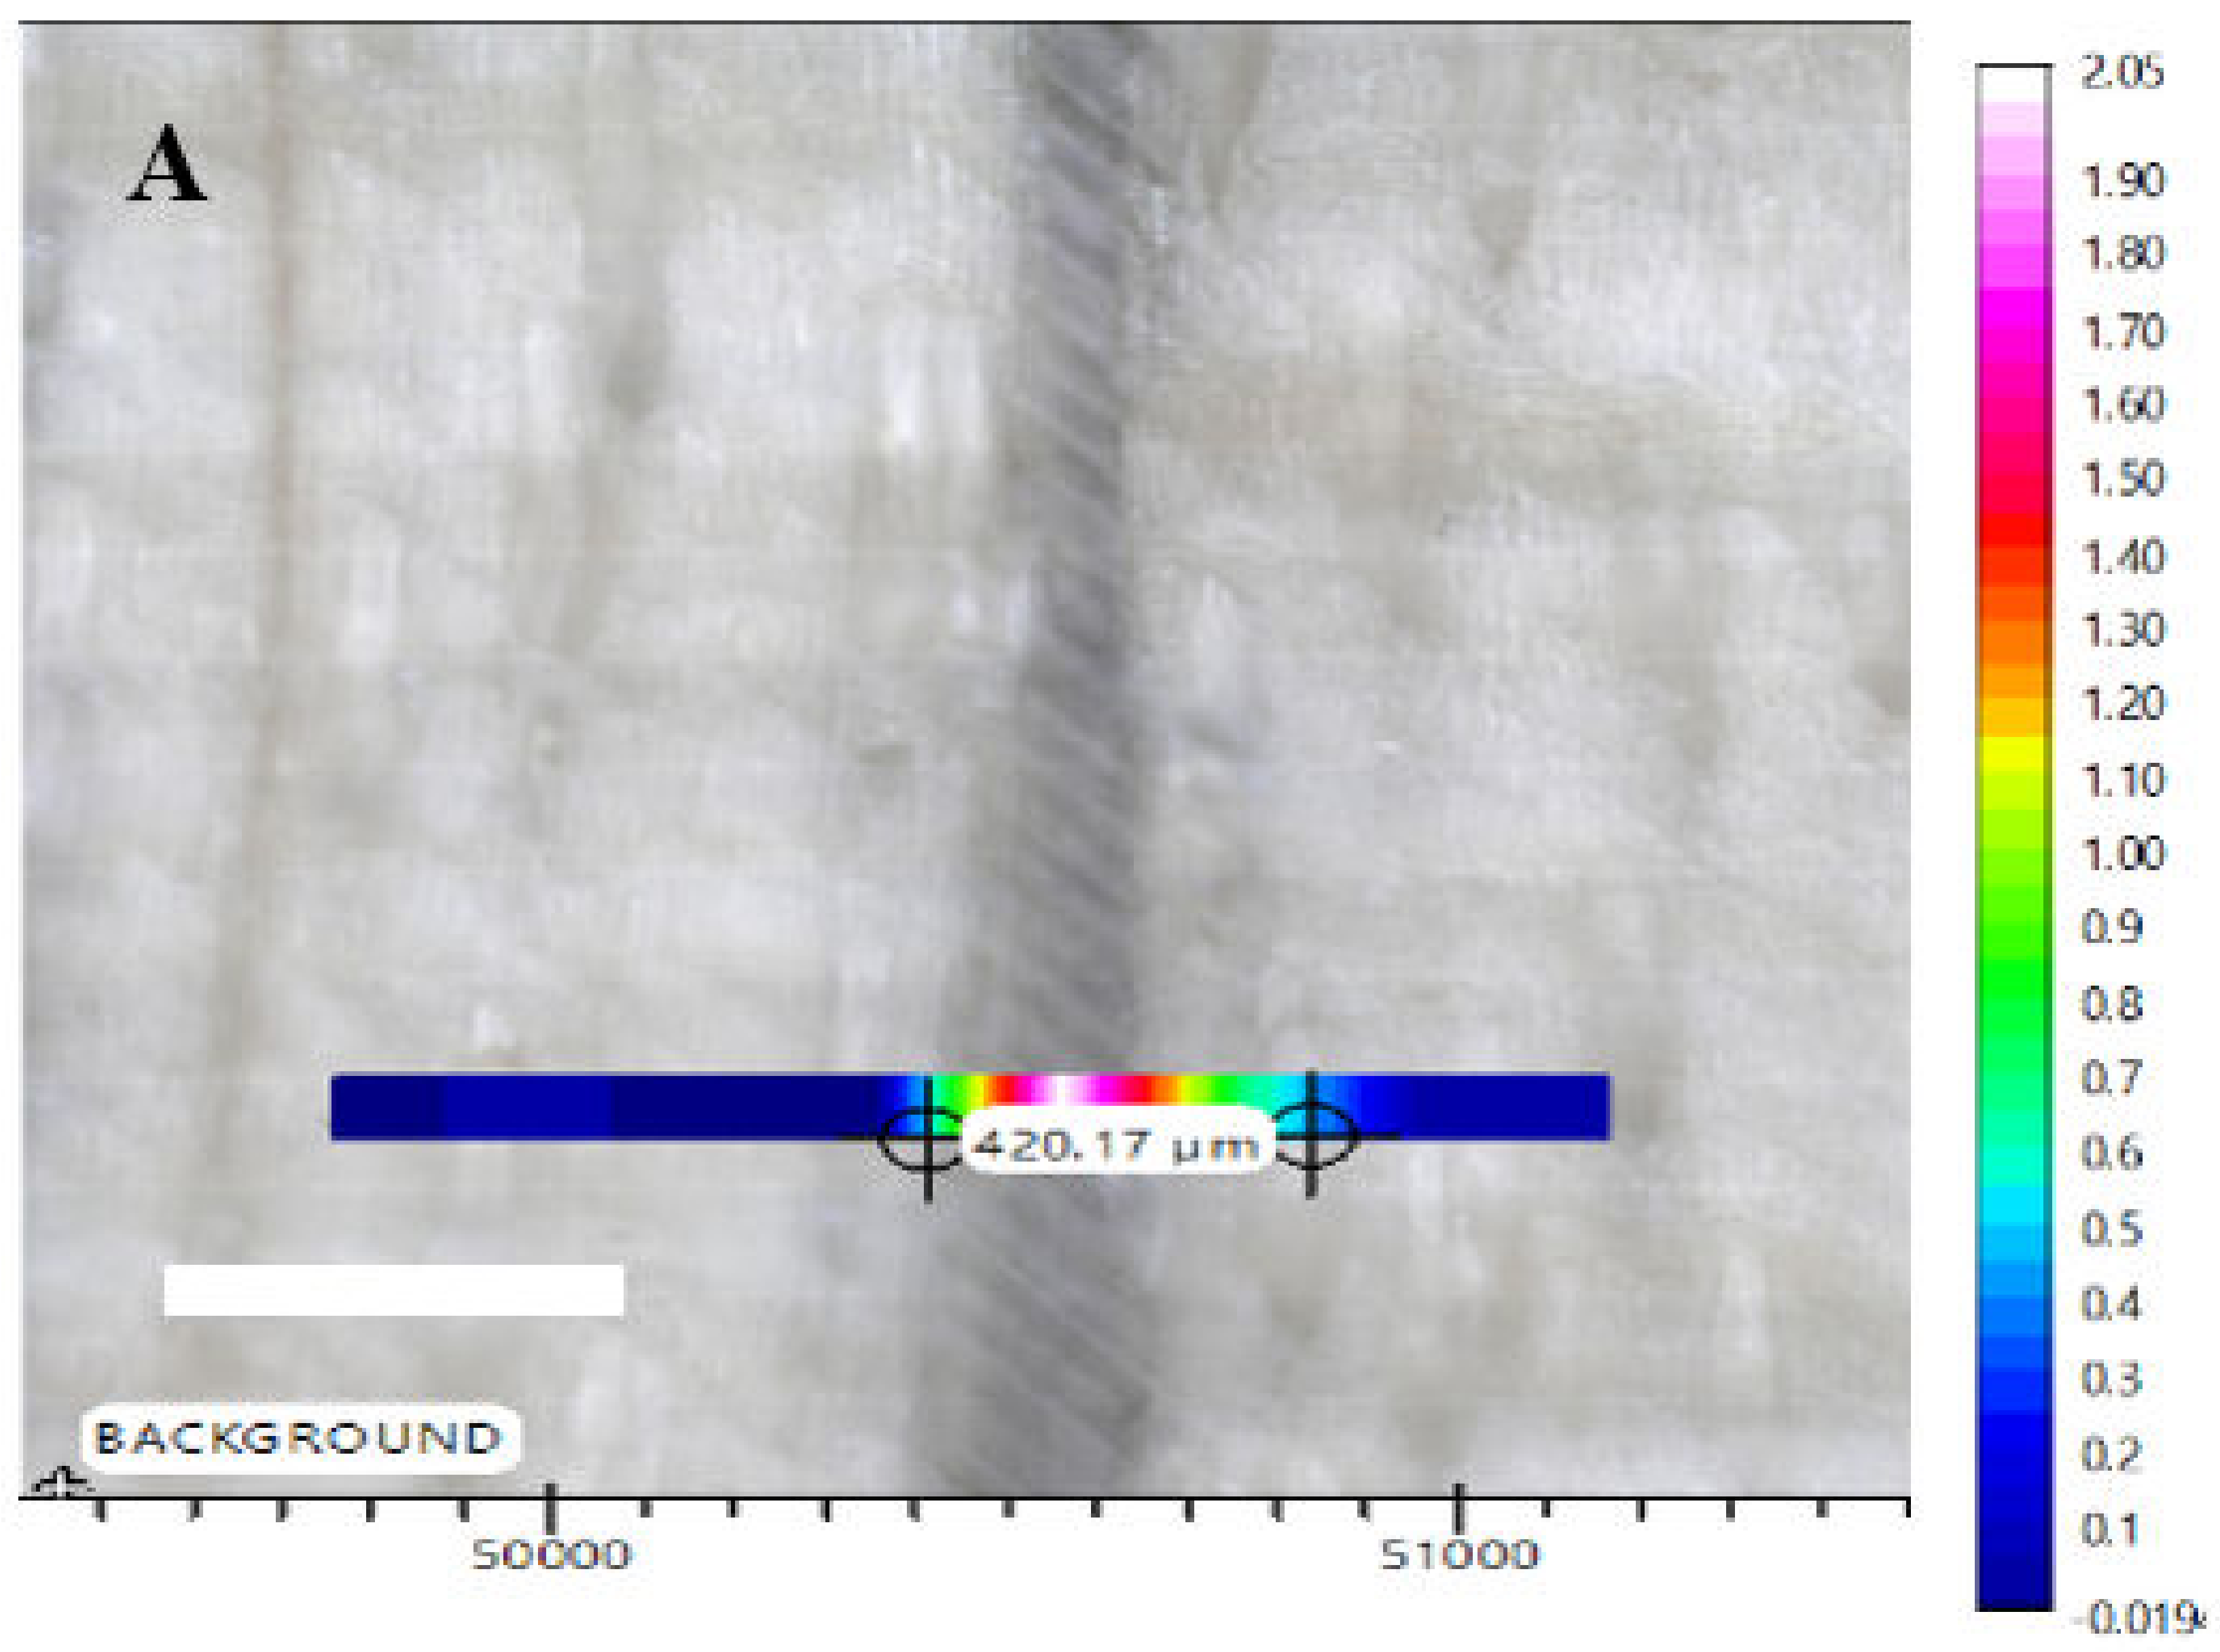
Using the spatial chemical imaging of the PLA carbonyl peak, this may be used to determine the presence and concentration of PLA across the adhesion interface (Figure 3). The projection of this PLA carbonyl peak represents both the PLA-only bondline between the two wood veneers (bondline thickness) and the PLA component, which has migrated from the bondline to form an interphase within the wood ultrastructure (penetration). Collectively, this defines the PLA−wood adhesion interface. Furthermore, this spatial chemical imaging of the PLA is comparable to qualitative images established with fluorescence microscopy approaches to visualizing the PLA−wood interface (Supplementary Materials) [6]. To demonstrate the spatial chemical imaging methodology, two examples of amorphous PLA bondlines formed at 160 °C are presented in Figure 3. In the first, spatial chemical imaging projected from Figure 3A showed the average bondline thickness was ca. 122 μm, with this thickness observed to vary up to 200 μm across this image. This variation in PLA bondline thickness can be attributed to both the surface roughness and the local wood ultrastructure of the veneer as established in assessing other PLA−bonded veneer substrates [6,7]. In plotting the extent of PLA migration from the bondline, the carbonyl peak intensity extended 420 μm with the PLA concentration decreasing to the margins across this width. This migration of PLA from the bondline will be a function of the PLA flow into the wood substrate and the PLA polymer properties at the temperatures achieved on hot-pressing. Based on these measurements, the average PLA migration into each veneer was ca. 150 μm (penetration) and is visually evident in Figure 3A.
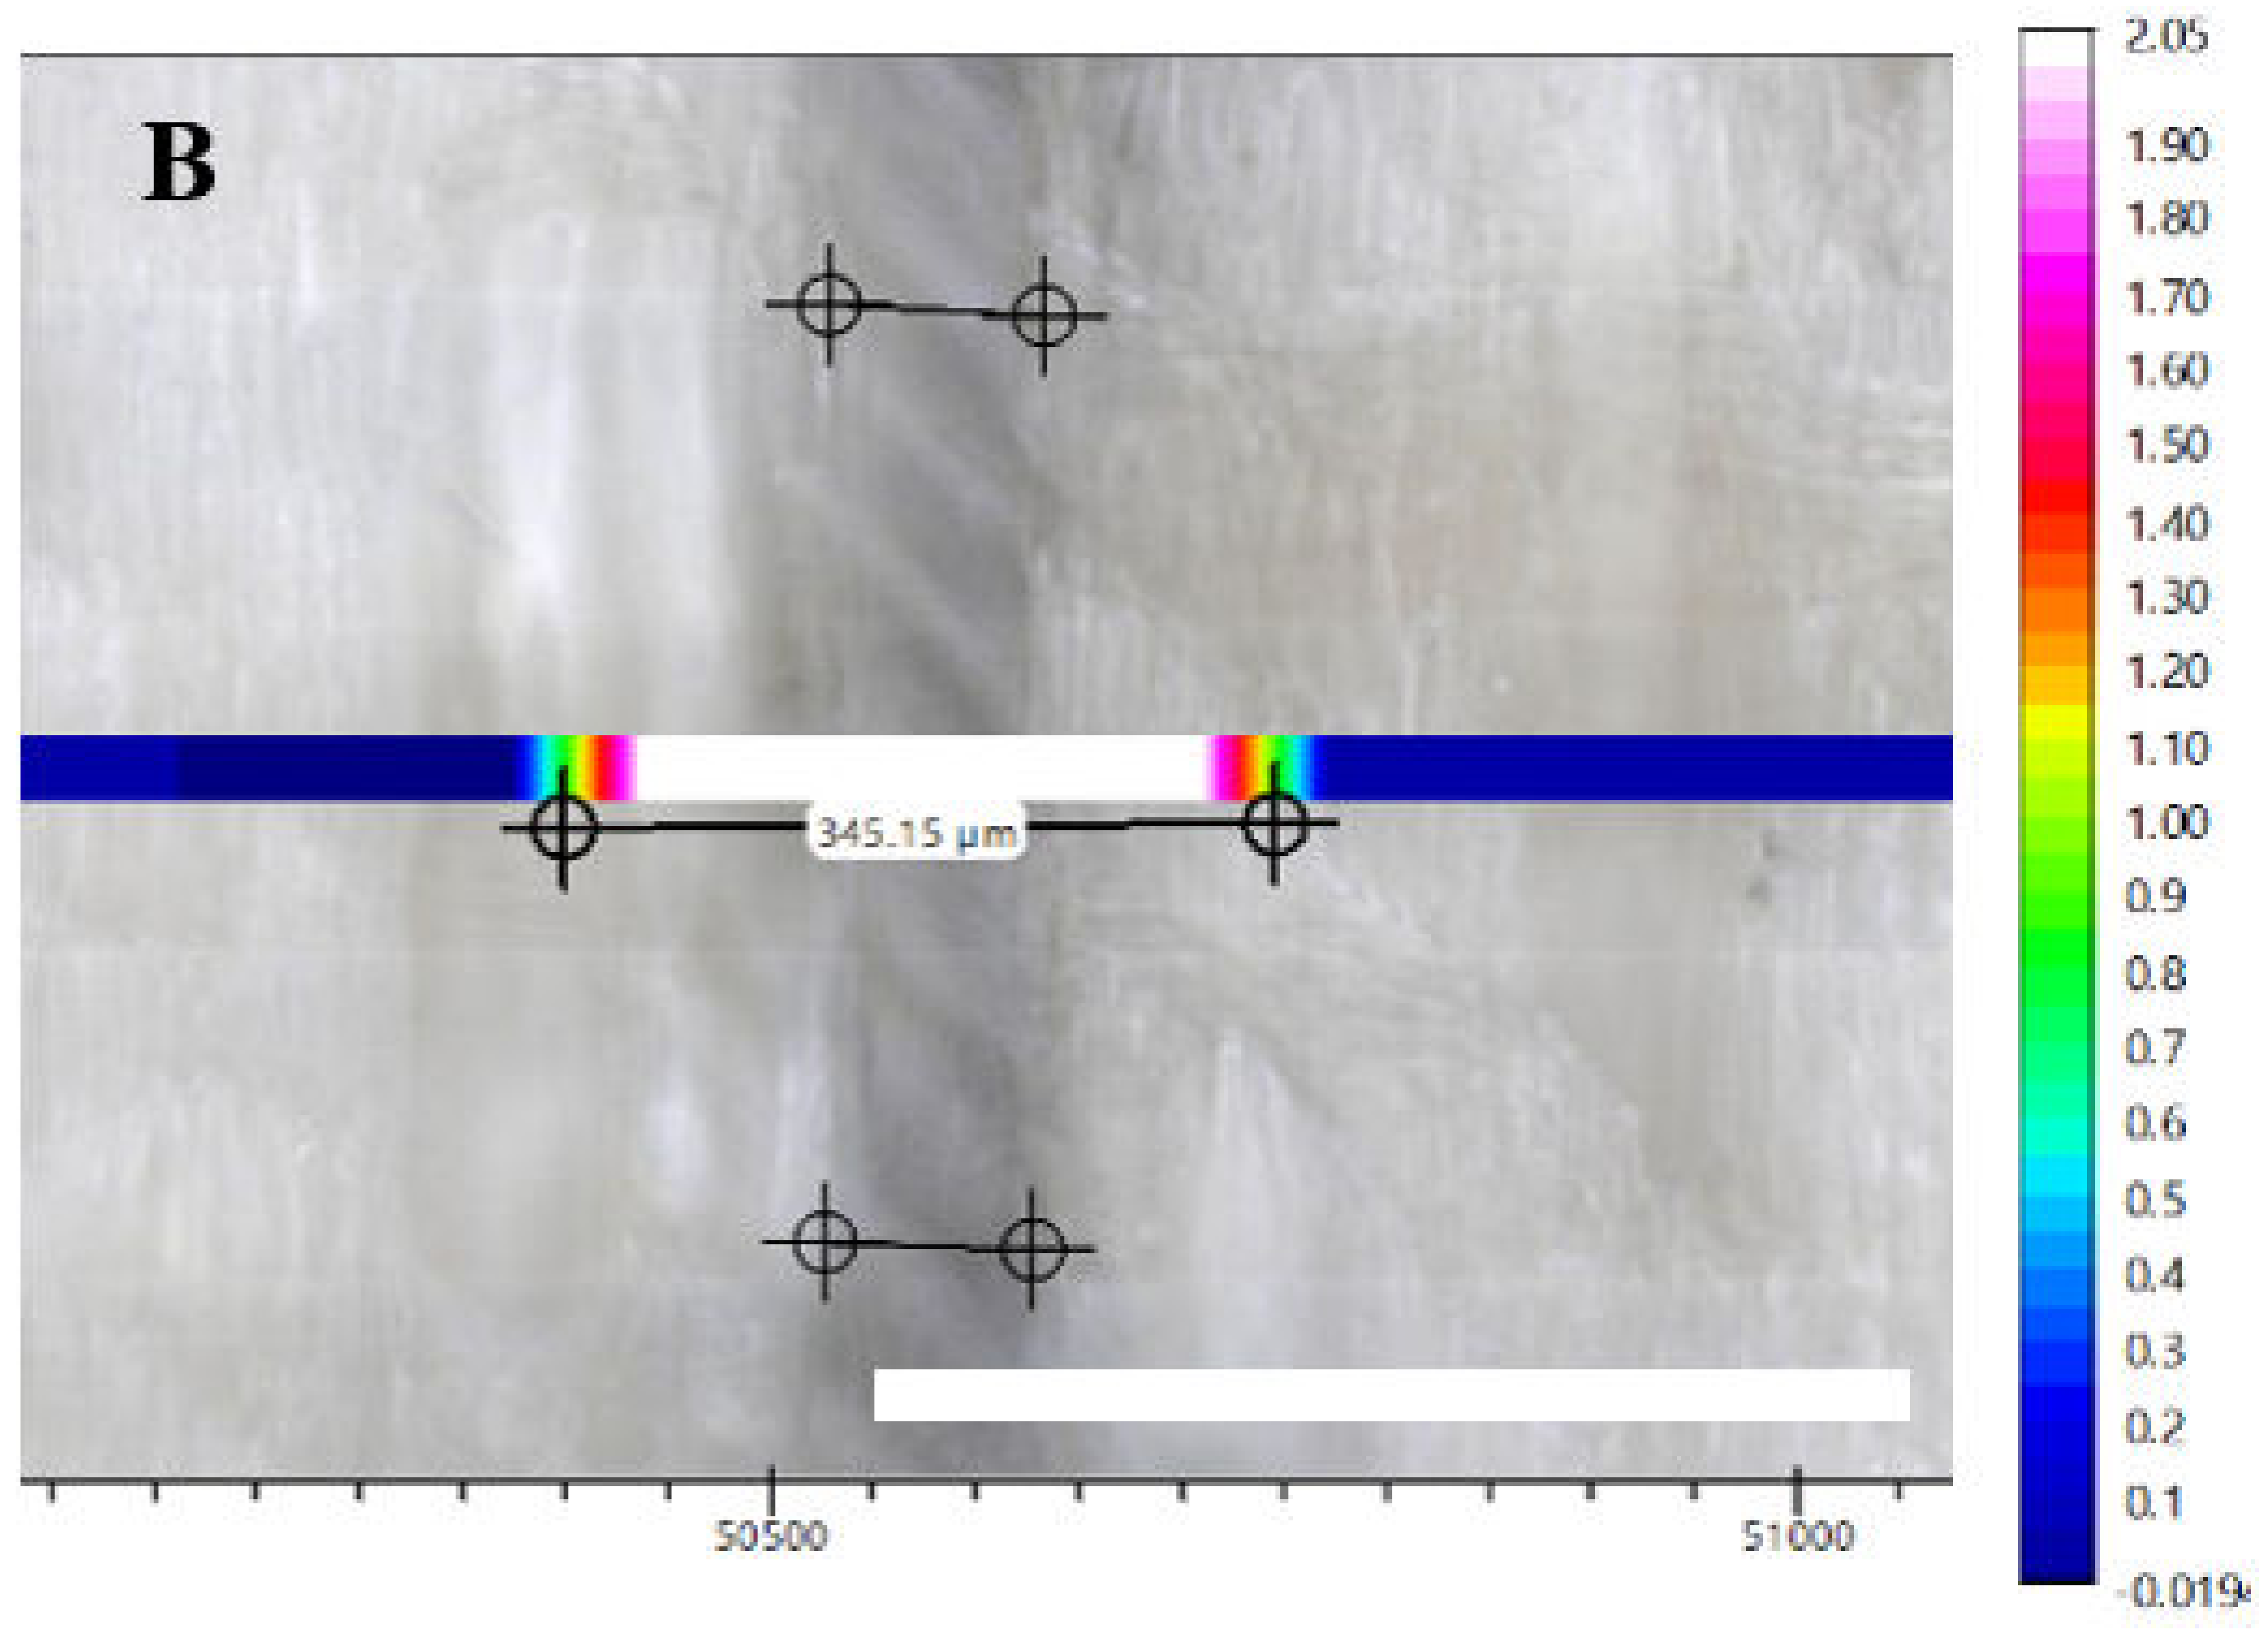
For the second imaged bondline of an amorphous PLA sample formed at 160 °C (Figure 3B), the measurements show an average bondline thickness of ca. 105 μm for this specimen cross-section. As above, plotting the PLA carbonyl peak intensity revealed the extent of PLA migration across the bondline to be ca. 345 μm at this position with the PLA concentration only decreasing at the margins. Based on these values, the extent of PLA flow and migration into the wood ultrastructure, evident in Figure 3B, was calculated to be ca. 120 μm. Furthermore, from the PLA profiles presented in both images (and Supplementary Materials), it was also evident the PLA concentrations could be asymmetric across the bondline, indicating the PLA was not uniformly distributed across the PLA−wood interface. This may suggest that the PLA polymer properties and temperatures achieved during composite consolidation, together with the local wood ultrastructure and porosity of each veneer region likely contributes to the extent of this migration away from the bondline. Overall, from this assessment, spatial chemical imaging can define both the local PLA bondline thickness and the extent of PLA migration away from the bondline into the wood.
Using spatial chemical imaging, PLA bondline thickness and penetration measurements were undertaken for inner bondlines of the panels prepared at differing pressing temperatures and PLA types (Table 2). As above, this assessment revealed pressing temperature to primarily impact the PLA−wood interphase. For those inner bondlines formed with amorphous PLA, spatial chemical imaging generally corroborated the light microscopy evaluations (Table 1), with thickness values found to decrease with a greater pressing temperature. For example, at 140 °C, the average inner bondline thickness was 110 μm, with this decreasing to ca. 60 μm for pressing at 180 °C, respectively. This trend in decreasing PLA bondline thickness with temperature is also consistent with that established in previous studies [6,7]. Furthermore, chemical imaging revealed the PLA profile across the PLA−wood interphase ranged between 230 and 420 μm, reflecting the sum of both the bondline thickness and PLA ingress into the wood matrix at these temperatures. Accordingly, the calculated values for amorphous PLA penetration into the wood ultrastructure increased with temperature. The average PLA penetration at 140 °C was ca. 60 μm and extended to 180 μm at 180 °C. These penetration values at 140 °C and 180 °C were consistent with the PLA migration into the wood vesicular structures reported from qualitative confocal fluorescence microscopy evaluations of PLA-bonded maple composites [6].
Bondline thickness and penetration values for the semi-crystalline PLA were also dependent on the pressing temperatures employed (Table 2). At 140 °C, the average inner bondline thickness (ca. 160 μm) was comparable to that found for amorphous PLA use. At a higher pressing temperature, the PLA bondline thickness was also observed to decrease (ca. 140 μm). However, the extent of this decrease was smaller than with amorphous PLA, but was also consistent with previous results obtained for bonding veneers with semi-crystalline PLA [6]. Moreover, the average penetration value for the semi-crystalline PLA was ca. 80 μm at 140 °C with PLA ingress into the wood ultrastructure increasing to >180 μm at a greater temperature. In this study, the similar rates of PLA ingress into the wood matrix found for both semi-crystalline and amorphous may reflect the pressing times used in the sample preparation, which were optimized for each temperature and combination of birch veneer and PLA type [19].
3. Conclusions
This study has established that FTIR microscopy and spatial chemical imaging can be readily employed to assess the morphology and interfacial adhesion of PLA bondlines formed with wood veneers. This methodology has enabled a simple, rapid assessment of PLA bondline thickness and PLA distributed (penetration) within the wood matrix across bondline cross-sections. The spatial chemical imaging methodology complements other analysis techniques for distinguishing and describing polymer−wood adhesion interfaces without the need for additives or contrast agents such as fluorescent-tagging [6] to visualise the PLA polymer. Moreover, this methodology can be extended more generally to other polyester-, polyamide-, and polyurethane-based polymers; adhesives; and resins used as films, coatings, and bonding wood and other natural fiber materials.
In applying this methodology, the results corroborate earlier findings from our wider study employing other microscopy methodologies to determine and quantify the PLA interfacial adhesion of wood veneers [6,7]. Higher panel pressing temperatures were associated with lower bondline thickness and greater PLA penetration into the wood ultrastructure. This increased PLA ingress was not unexpected as the extent of PLA migration into the wood reflects the greater mobility and flow of PLA at higher temperatures [7]. Furthermore, the bonding of birch veneers with PLA has established a relationship between PLA bondline thickness with tensile strength and wood failure rates of the tested samples. This underpins wider study understandings [6,7] regarding how greater bondline strength and wood failures result from greater PLA polymer ingress into the wood matrix, which acts to reinforce the wood and provide a greater cohesive strength of the PLA−wood bondline.
Supplementary Materials
The following are available online at https://www.mdpi.com/article/10.3390/fib10020017/s1. Materials and Methods for the preparation and testing of PLA−wood veneer laminates, and methodology for spatial chemical imaging using FTIR. Figure S1: Internal panel core temperature profiles and indicative pressing times for consolidated panels birch-PLA 5-ply panels. Figure S2: Tensile strength values of 5-ply birch and spruce laminates prepared with amorphous and semi-crystalline PLA. Figure S3: Examples of failed tensile testing specimens profiling modes of wood failure. Figure S4: Average %wood failures of samples produced with differing PLA types and pressing temperatures. Figure S5: Results of low resolution light microscopy assessments of bondline thickness values for birch and spruce samples produced with different PLA types and pressing temperatures. Figure S6: Original, full FTIR microscope image (software generated) of the birch amorphous PLA bondline formed at 160 °C prior to image cropping. Figure S7: Comparisons of PLA bondline thickness, PLA interphase migration, and calculated PLA penetration values from spatial chemical imaging inner bondlines of birch-PLA panels. Figure S8. A representative confocal fluorescence microscopy image of a PLA bondline formed with maple veneer and PLA foil in which a fluorescence contrast agent had been grafted to the PLA polymer. Table S1: Representative light microscopy images of 5-ply laminates formed with birch and spruce veneer and PLA foils at differing temperatures. Table S2: Comparisons of correlation values between average bondline thickness values and either average sample tensile strength or %wood failure values. Table S3. Selected examples of chemical spatial imaging projections of 5-ply laminate inner bondlines formed with birch veneer and PLA foils at differing temperatures.
Author Contributions
Conceptualization, W.J.G., D.T., M.G., J.L. and A.K.; formal analysis, W.J.G., D.T. and M.G.; investigation, supervision, W.J.G. and M.G.; project administration W.J.G. and M.G.; writing—original draft preparation, W.J.G.; writing—review W.J.G., M.G., J.L. and A.K. and funding acquisition, W.J.G., M.G., J.L. and A.K. All authors have read and agreed to the published version of the manuscript.
Funding
This research was contributed by funding by the New Zealand Royal Society (FRG-FRI1402) and the Bundesministerium für Landwirtschaft und Ernährung (02/14-15-NZL).
Institutional Review Board Statement
Not applicable.
Informed Consent Statement
Not applicable.
Data Availability Statement
Not applicable.
Acknowledgments
The authors are grateful to the following organizations for assistance with funding for the New Zealand−Germany Science and Technology Program. This was contributed to by the New Zealand Royal Society Catalyst Seed funding [FRG-FRI1402] and the Bundesministerium für Landwirtschaft und Ernährung (Federal Ministry of Food and Agriculture) (02/14-15-NZL), together with resourcing provided by the Thünen Institute of Wood Research and Scion. D.T. was a recipient of a Toi Ohomai Institute of Technology summer internship and placement supported by Scion. We also acknowledge the input and review of this manuscript by Nick Engehausen (Thünen Institute of Wood Research).
Conflicts of Interest
The authors declare no conflict of interest. The funders had no role in the design of the study; in the collection, analyses, or interpretation of data; in the writing of the manuscript; or in the decision to publish the results.
References
- Bishop, G.; Styles, D.; Lens, P.N.L. Environmental performance comparison of bioplastics and petrochemical plastics: A review of life cycle assessment (LCA) methodological decisions. Resour. Conserv. Recycl. 2021, 168, 105451. [Google Scholar] [CrossRef]
- Nagarajan, V.; Mohanty, A.K.; Misra, M. Perspective on Polylactic Acid (PLA) based Sustainable Materials for Durable Applications: Focus on Toughness and Heat Resistance. ACS Sustain. Chem. Eng. 2016, 4, 2899–2916. [Google Scholar] [CrossRef]
- Sin, L.T.; Tueen, B.S. (Eds.) 2—Synthesis and Production of Poly(Lactic Acid). In Polylactic Acid, 2nd ed.; William Andrew Publishing: Norwich, NY, USA, 2019; pp. 53–95. [Google Scholar]
- Chan, C.M.; Vandi, L.J.; Pratt, S.; Halley, P.; Richardson, D.; Werker, A.; Laycock, B. Composites of Wood and Biodegradable Thermoplastics: A Review. Polym. Rev. 2018, 58, 444–494. [Google Scholar] [CrossRef]
- Hubbe, M.A.; Grigsby, W. From Nanocellulose to Wood Particles: A Review of Particle Size vs. the Properties of Plastic Composites Reinforced with Cellulose-based Entities. Bioresources 2019, 15, 52. [Google Scholar] [CrossRef]
- Grigsby, W.; Gager, V.; Recabar, K.; Krause, A.; Gaugler, M.; Luedtke, J. Quantitative Assessment and Visualisation of the Wood and Poly(Lactic Acid) Interface in Sandwich Laminate Composites. Fibers 2019, 7, 15. [Google Scholar] [CrossRef] [Green Version]
- Luedtke, J.; Gaugler, M.; Grigsby, W.J.; Krause, A. Understanding the development of interfacial bonding within PLA/wood-based thermoplastic sandwich composites. Ind. Crops Prod. 2019, 127, 129–134. [Google Scholar] [CrossRef]
- Bakken, A.C.; Taleyarkhan, R.P. Plywood wood based composites using crystalline/amorphous PLA polymer adhesives. Int. J. Adhes. Adhes. 2020, 99, 102581. [Google Scholar] [CrossRef]
- Peltola, H.; Pääkkönen, E.; Jetsu, P.; Heinemann, S. Wood based PLA and PP composites: Effect of fibre type and matrix polymer on fibre morphology, dispersion and composite properties. Compos. Part A Appl. Sci. Manuf. 2014, 61, 13–22. [Google Scholar] [CrossRef]
- Tao, Y.; Wang, H.; Li, Z.; Li, P.; Shi, S.Q. Development and application of wood flour-filled polylactic acid composite filament for 3d printing. Materials 2017, 10, 339. [Google Scholar] [CrossRef] [PubMed] [Green Version]
- Gaugler, M.; Luedtke, J.; Grigsby, W.J.; Krause, A. A new methodology for rapidly assessing interfacial bonding within fibre-reinforced thermoplastic composites. Int. J. Adhes. Adhes. 2019, 89, 66–71. [Google Scholar] [CrossRef]
- Mamiński, M.Ł.; Novák, I.; Mičušík, M.; Małolepszy, A.; Toczyłowska-Mamińska, R. Discharge Plasma Treatment as an Efficient Tool for Improved Poly(lactide) Adhesive–Wood Interactions. Materials 2021, 14, 3672. [Google Scholar] [CrossRef] [PubMed]
- Kamke, F.A.; Lee, J.N. Adhesive penetration in wood—A review. Wood Fiber Sci. 2007, 39, 205–220. [Google Scholar]
- Gowen, A.A.; Feng, Y.; Gaston, E.; Valdramidis, V. Recent applications of hyperspectral imaging in microbiology. Talanta 2015, 137, 43–54. [Google Scholar] [CrossRef] [PubMed]
- Kazarian, S.G.; Chan, K.L.A. ATR-FTIR spectroscopic imaging: Recent advances and applications to biological systems. Analyst 2013, 138, 1940–1951. [Google Scholar] [CrossRef] [PubMed]
- Bonifazi, G.; Calienno, L.; Capobianco, G.; Monaco, A.L.; Pelosi, C.; Picchio, R.; Serranti, S. A new approach for the modelling of chestnut wood photo-degradation monitored by different spectroscopic techniques. Environ. Sci. Pollut. Res. 2017, 24, 13874–13884. [Google Scholar] [CrossRef] [PubMed]
- Mäkelä, M.; Altgen, M.; Belt, T.; Rautkari, L. Hyperspectral imaging and chemometrics reveal wood acetylation on different spatial scales. J. Mater. Sci. 2021, 56, 5053–5066. [Google Scholar] [CrossRef]
- Gaugler, M.; Grigsby, W.; Harper, D.; Rials, T. Chemical imaging of the spatial distribution and interactions of tannin dispersal in bioplastic systems. Adv. Mater. Process. IV 2007, 29–30, 173–176. [Google Scholar]
- Grigsby, W.J.; Puri, A.; Gaugler, M.; Lüedtke, J.; Krause, A. Bonding Wood Veneer with Biobased Poly(Lactic Acid) Thermoplastic Polyesters: Potential Applications for Consolidated Wood Veneer and Overlay Products. Fibers 2020, 8, 50. [Google Scholar] [CrossRef]
Figure 1.
Selected images of five-ply laminated birch veneer panels bonded with PLA. Light microscopy images of (a) amorphous PLA pressed at 140 °C (left, scale bar 3 mm), (b) semi-crystalline PLA pressed at 180 °C (center) with aligned veneers, and (c) micro-computer tomography imaging of semi-crystalline PLA pressed at 140 °C with cross-banded veneer (also see Supplementary Materials). Outer bondlines are defined as bonding surface veneers, with the inner bondlines in the center, bonding the core veneer of the five-ply laminate.
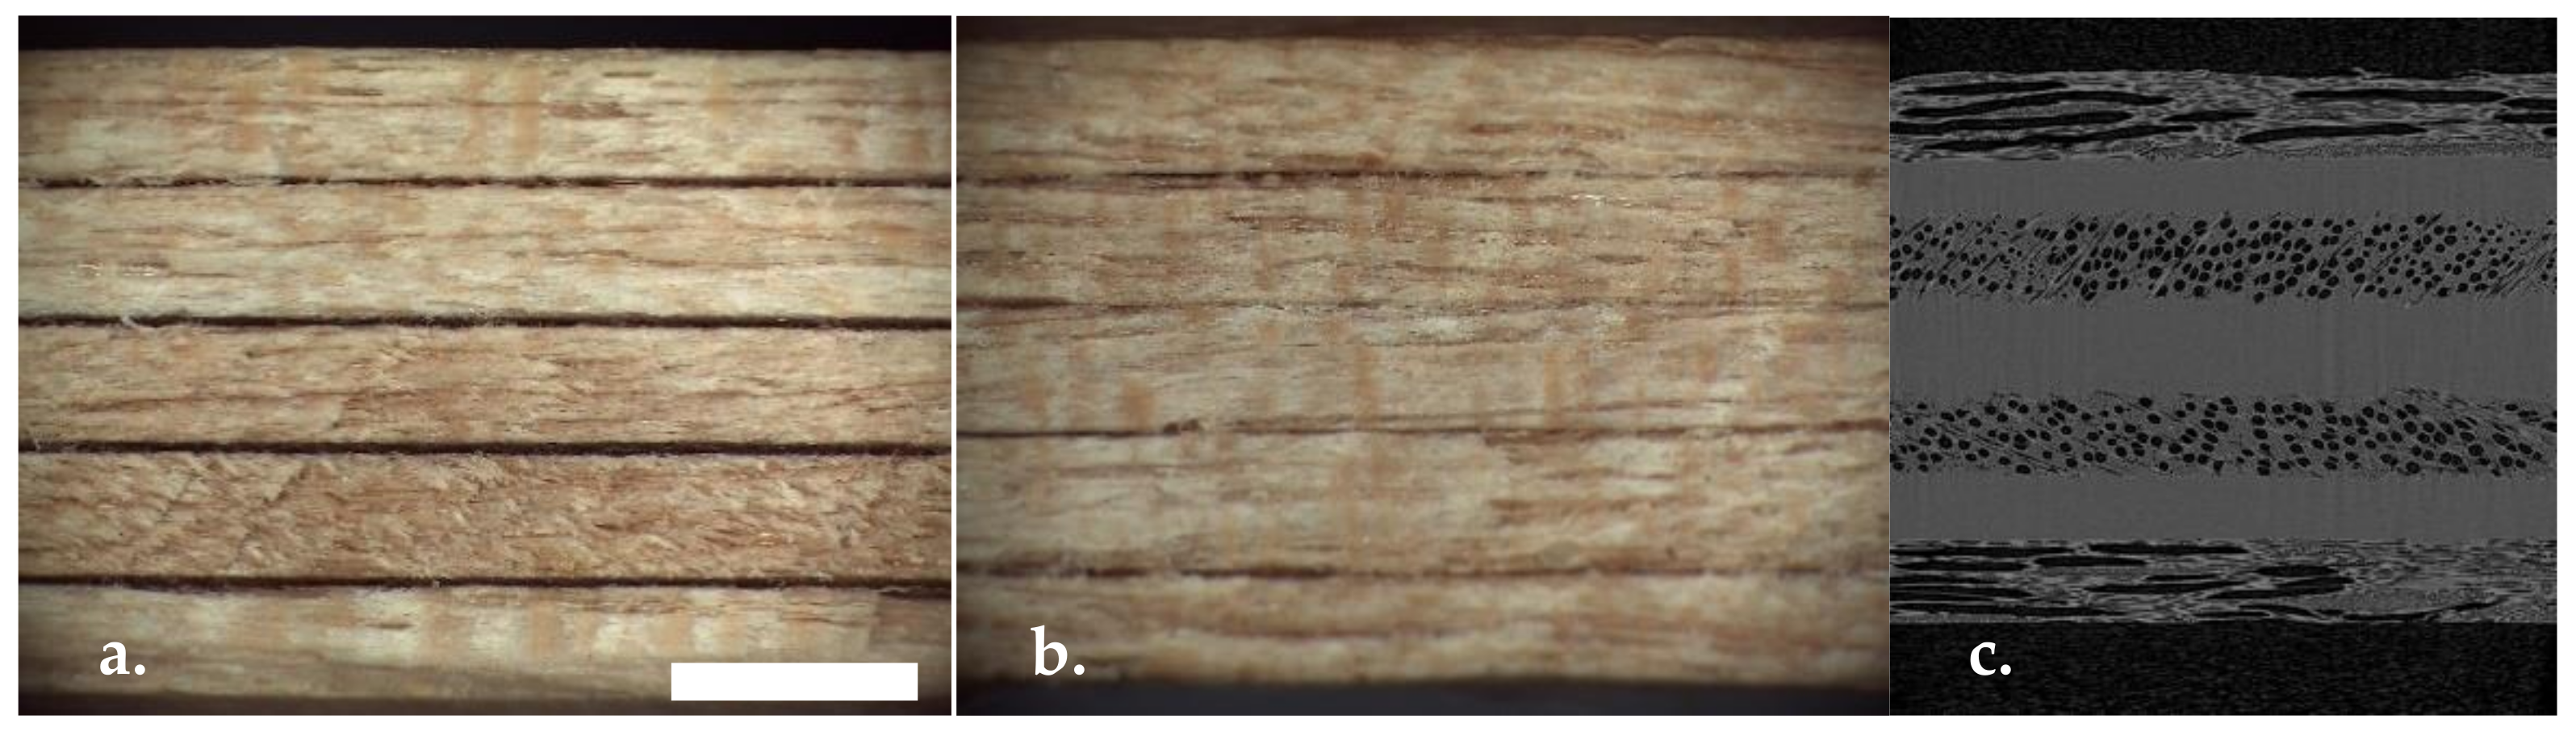
Figure 2.
A representative FTIR microscope image of the birch amorphous PLA bondline formed at 160 °C (top, (A)). Each FTIR spectrum (400 to 4000 cm−1, bottom, (C)) is colored to match defined points across this image. PLA carbonyl peak (ca. 1750 cm−1) and lignin peak (ca. 1650 cm−1) profiled between 1550 to 1800 cm−1 (middle, (B)). Full FTIR microscope image available in Supplementary Materials.
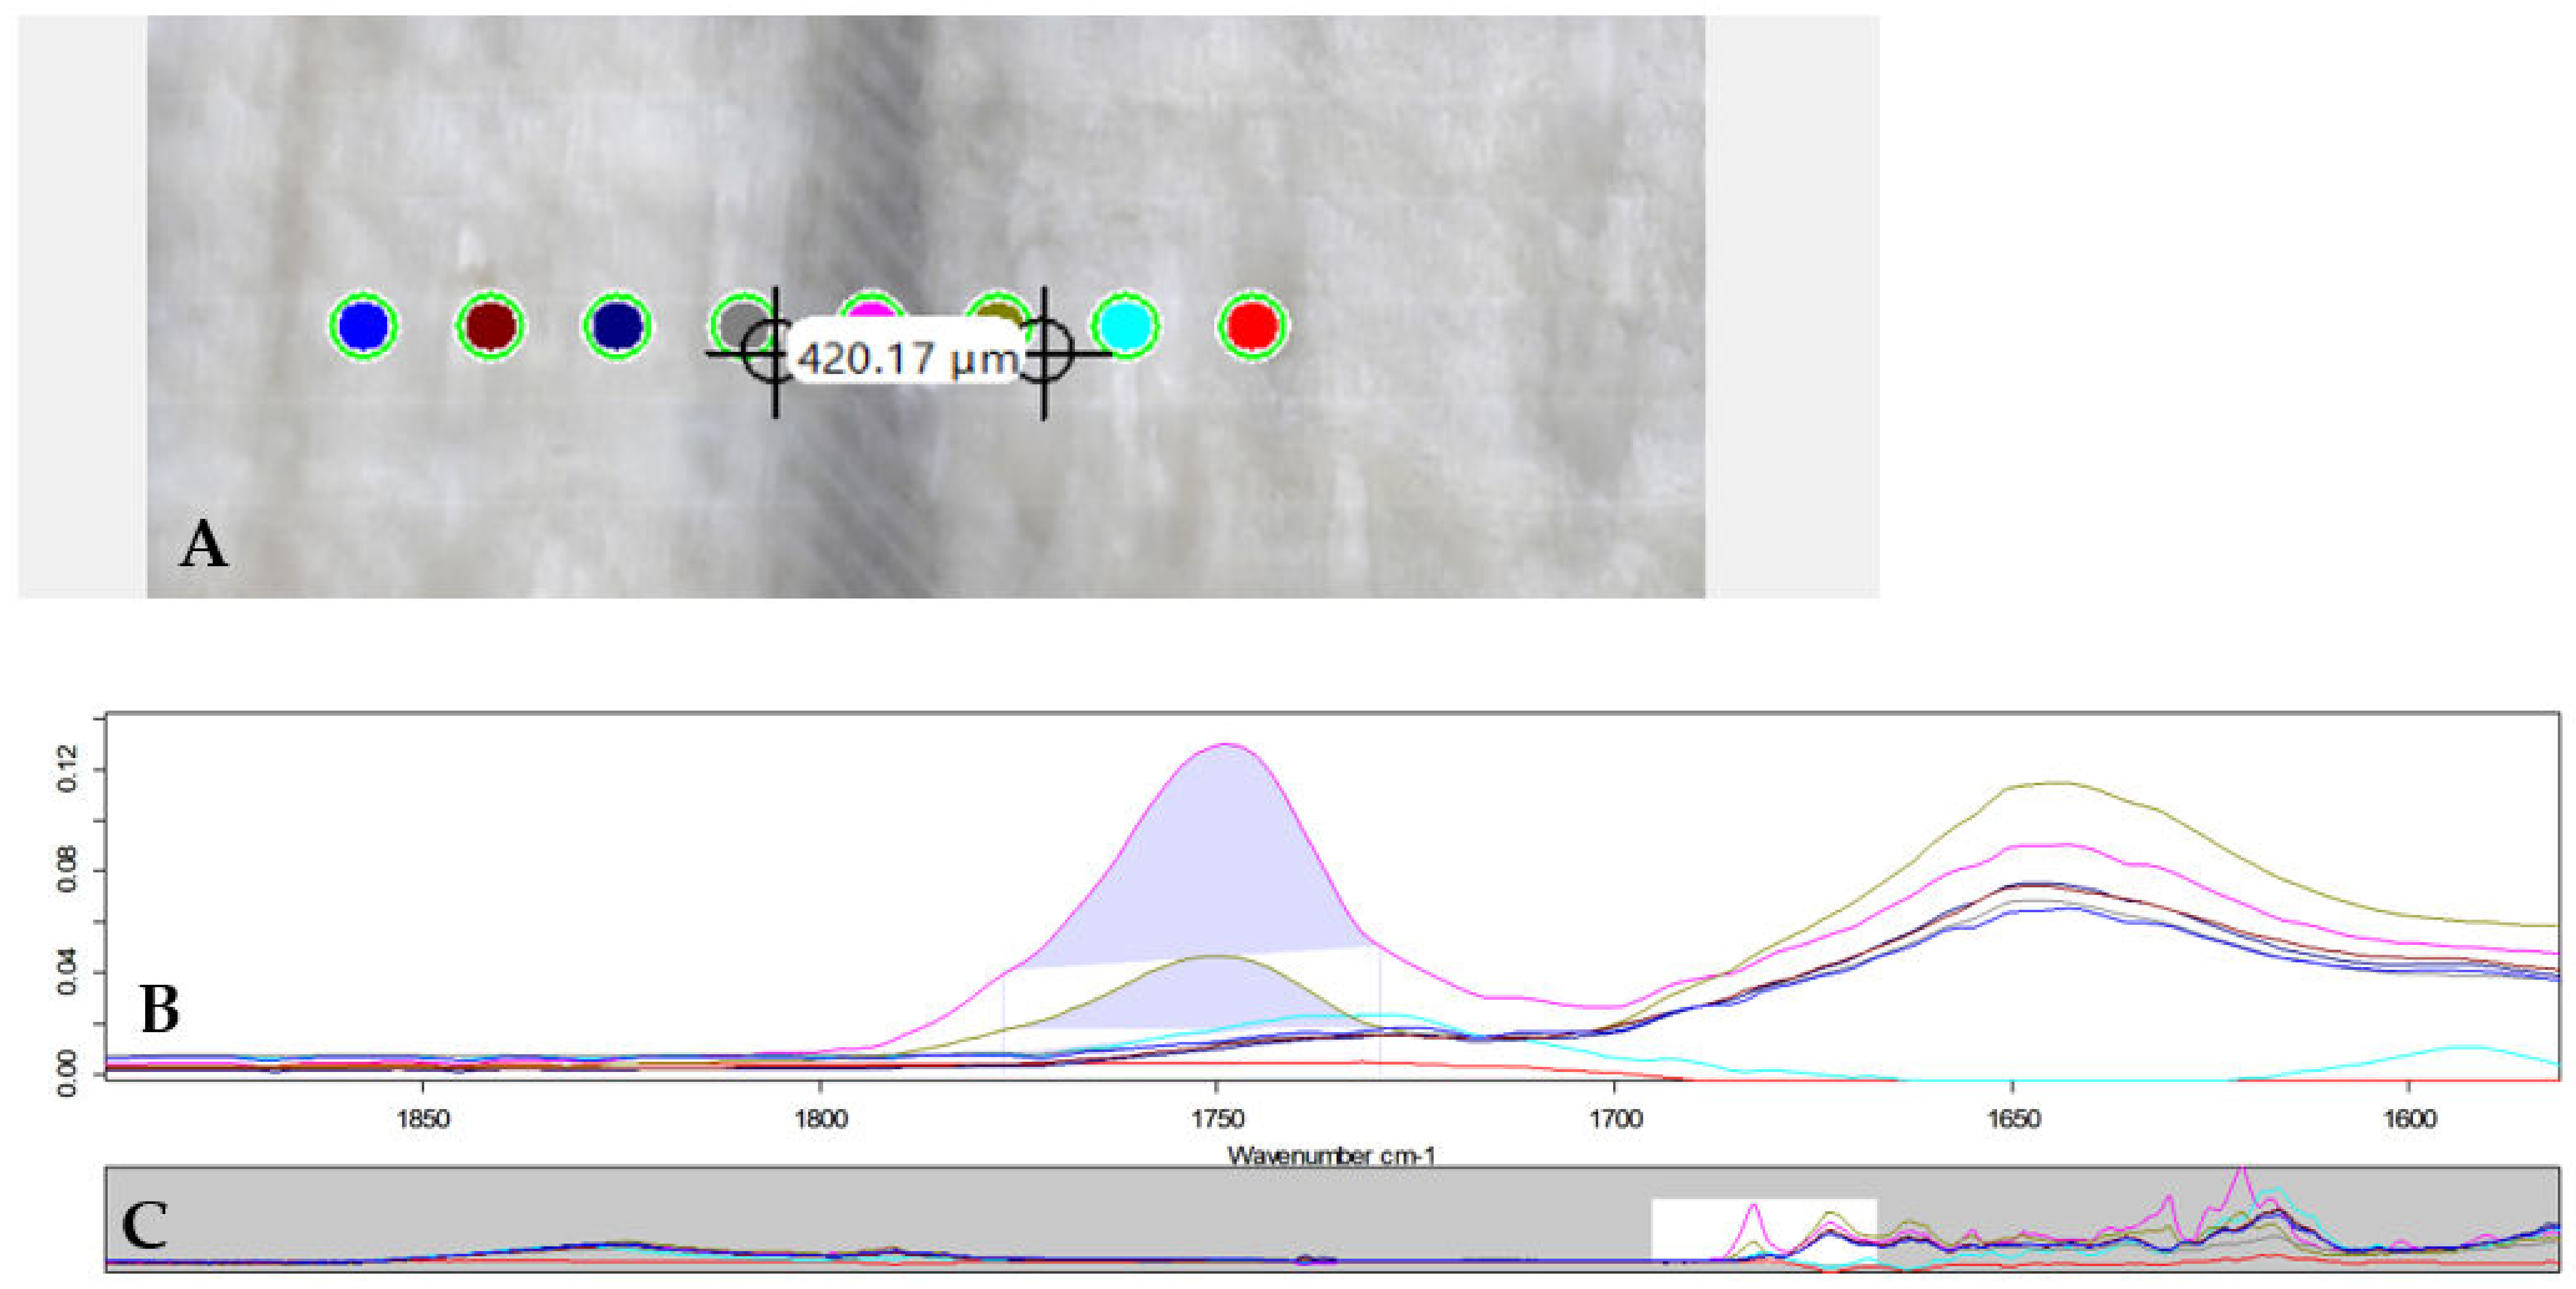
Figure 3.
Selected examples of spatial chemical images profiling carbonyl peak intensity to determine the measurements of PLA bondlines and polymer migration into the wood ultrastructure. Both top (A) and bottom (B) images are of inner bondlines from a five-ply panel formed with amorphous PLA and birch veneer at 160 °C (scale bar is 500 μm).

Table 1.
Results of low-resolution light microscopy assessments of bondline thickness values for birch and spruce laminated veneer samples produced with different PLA types and pressing temperatures.
Table 1.
Results of low-resolution light microscopy assessments of bondline thickness values for birch and spruce laminated veneer samples produced with different PLA types and pressing temperatures.
| PLA | Pressing Temperature | Outer Bondlines Thickness | Inner Bondline Thickness | ||
|---|---|---|---|---|---|
| Type | (°C) | Average (μm) | Std. Dev. | Average (μm) | Std. Dev. |
| Birch Samples | |||||
| Amorphous | 140 | 130 | 23 | 167 | 15 |
| 160 | 79 | 17 | 80 | 11 | |
| 180 | 42 | 14 | 42 | 10 | |
| Semi-Crystalline | 140 | 193 | 32 | 161 | 26 |
| 160 | 54 | 18 | 42 | 13 | |
| 180 | 31 | 10 | 30 | 4 | |
| Spruce Samples | |||||
| Amorphous | 140 | 85 | 21 | 112 | 35 |
| 160 | 51 | 15 | 56 | 18 | |
| 180 | 27 | 13 | 39 | 21 | |
| Semi-Crystalline | 140 | 163 | 21 | 171 | 15 |
| 160 | 27 | 2 | 35 | 7 | |
| 180 | 26 | 13 | 27 | 9 | |
Note: Bondlines are distinguished as outer bondlines bonding surface veneers and the inner bondlines bonding the core veneer of five-ply laminates. At least three images were acquired, from which five measurements of each bondline were made per image.
Table 2.
Summary of PLA bondline thickness, PLA interphase migration, and calculated PLA penetration values from spatial chemical imaging inner bondlines of five-ply birch-PLA panels.
Table 2.
Summary of PLA bondline thickness, PLA interphase migration, and calculated PLA penetration values from spatial chemical imaging inner bondlines of five-ply birch-PLA panels.
| PLA Type | Pressing Temperature (°C) | Light Microscopy Bondline (μm) | FTIR Bondline (μm) | PLA Interphase (μm) | Calc. PLA Penetration (μm) | |||
|---|---|---|---|---|---|---|---|---|
| Average | Std. Dev. | Average | Std. Dev. | Average | Std. Dev. | Average | ||
| Amorphous | 140 | 167 | 15 | 110 | 7 | 233 | - | 62 |
| 160 | 80 | 11 | 122 | 33 | 383 | 53 | 130 | |
| 180 | 42 | 10 | 61 | 4 | 422 | 17 | 181 | |
| Semi-Crystalline | 140 | 161 | 26 | 159 | 20 | 315 | - | 78 |
| 160 | 52 | 13 | 143 | 32 | 515 | - | 186 | |
Publisher’s Note: MDPI stays neutral with regard to jurisdictional claims in published maps and institutional affiliations. |
© 2022 by the authors. Licensee MDPI, Basel, Switzerland. This article is an open access article distributed under the terms and conditions of the Creative Commons Attribution (CC BY) license (https://creativecommons.org/licenses/by/4.0/).
Share and Cite
MDPI and ACS Style
Grigsby, W.J.; Torayno, D.; Gaugler, M.; Luedtke, J.; Krause, A. Chemical Imaging of the Polylactic Acid − Wood Adhesion Interface of Bonded Veneer Products. Fibers 2022, 10, 17. https://doi.org/10.3390/fib10020017
AMA Style
Grigsby WJ, Torayno D, Gaugler M, Luedtke J, Krause A. Chemical Imaging of the Polylactic Acid − Wood Adhesion Interface of Bonded Veneer Products. Fibers. 2022; 10(2):17. https://doi.org/10.3390/fib10020017
Chicago/Turabian StyleGrigsby, Warren J., Desiree Torayno, Marc Gaugler, Jan Luedtke, and Andreas Krause. 2022. "Chemical Imaging of the Polylactic Acid − Wood Adhesion Interface of Bonded Veneer Products" Fibers 10, no. 2: 17. https://doi.org/10.3390/fib10020017
Note that from the first issue of 2016, this journal uses article numbers instead of page numbers. See further details here.