
Mechanical, Durability and Corrosion Properties of Basalt Fiber Concrete


Department of Civil and Environmental Engineering, University of Idaho, Moscow, ID 83844, USA
*
Author to whom correspondence should be addressed.
Fibers 2022, 10(2), 10; https://doi.org/10.3390/fib10020010
Submission received: 31 October 2021
/
Revised: 7 January 2022
/
Accepted: 13 January 2022
/
Published: 21 January 2022
(This article belongs to the Special Issue Sustainable High Performance Fiber-Reinforced Cementitious Composites (HPFRCCs) and Fiber-Reinforced Polymers (FRPs))
Abstract
:The effect of using basalt fibers on the fresh, mechanical, durability, and corrosion properties of reinforced concrete was investigated in this study. The study was performed using different basalt fiber volume fractions of 0.15%, 0.30%, 0.45%, and 0.50%, while two different water/cement (w/c) ratios of 0.35 and 0.40 were utilized. The results were compared to conventional concrete (PC) as well as steel fiber concrete (SFC) with 0.30% and 0.50% steel fibers volume fractions. An extensive experimental program of 336 samples was conducted in four stages as follows: testing for fresh properties included slump and unit weight tests; mechanical properties testing included compressive strength tests, split tensile strength tests, flexural strength tests, and average residual strength tests; durability testing included unrestrained shrinkage and surface resistivity tests; and a Rapid Macrocell corrosion evaluation test for corrosion properties. The test results showed that the use of basalt fibers reduces slump values as the fiber volume fraction increases; however, with the use of the appropriate amount of High Range Water Admixture (HRWA), target slump values can be achieved. Moreover, a considerable improvement in the compressive, tensile, flexural, average residual strength and durability properties was achieved in case of using basalt fibers. On the other hand, corrosion rates increased with the increase in fiber volumes. However, it can be concluded that utilizing a 0.30% fibers volume fraction is the optimum ratio with an overall acceptable performance with respect to mechanical and corrosion properties.
1. Introduction
Concrete is a composite material with high compressive strength but relatively low tensile strength and a low energy absorption capacity. Improving the properties of concrete has become one of the most important challenges over the last decades. Implementing fibers into a concrete mixture, in general, improves mechanical properties such as tensile, flexural, and improved toughness strength as well as reducing the brittleness of the concrete. There are various commercially available fibers for use, such as steel, glass, synthetic and natural materials. Steel fibers are the most common type of fibers being utilized (50% of the total used fibers), followed by polypropylene (PP) fibers (20% of total used fibers), glass fibers (5% of total used fibers) and lastly other types of fibers (25% of total used fibers) [1].
Many research works [2,3,4,5,6,7,8,9] have been carried out to investigate the effect of using fibers on the behavior of reinforced concrete. These studies brought awareness of the improvement in mechanical properties, durability, and fracture resistance of the concrete composite from the addition of fibers. Studies have shown that Fiber-Reinforced Concrete (FRC) is primarily dependent on the properties and dispersion of the fibers in the concrete matrix [10,11,12,13]. The main characteristics to be considered are: the fiber material properties, fiber geometry, fiber distribution/orientation and fiber concentration [14,15,16]. The properties of the fiber material being used, such as: modulus of elasticity, tensile strength, and strain at failure, are crucial when developing an FRC mix. Fibers with high modulus, such as steel fibers, have been shown to simultaneously improve both flexural and impact resistance. On the other hand, fibers with low modulus, such as polypropylene, have been shown to improve toughness and early age cracking, but do not contribute much to concrete flexural strength.
Fiber geometry is another important fiber characteristic to take into account. This includes properties such as: fiber length, diameter, aspect ratio (L/D), cross section shape and presence or absence of hooks at the ends of the fibers [17,18,19]. Fiber lengths may range from 6 mm to 150 mm (0.25 inch. to 6 inch.) and thicknesses ranging from 0.005 mm to 0.75 mm. (0.0002 inch. to 0.03 inch.). The literature has shown that longer fibers tends to bridge cracks better and improved flexural strength can be obtained by increasing the aspect ratio [20]. However, utilizing a high aspect ratio fiber increases the potential for balling of the fibers creating further workability problems within the mix. Microfibers, on the other hand, have been shown to be most effective at increasing performance parameters, such as plastic shrinkage, during early stages of crack formation [21,22].
Fiber concentration is another fiber characteristic that affects the effectiveness of the fibers in the cement matrix, and it is measured as a percentage of the total volume of the composite (concrete and fibers). Low fiber volumes (<1%) are typically used to control plastic shrinkage, crack propagation control and crack width reduction but displays no significant improvement in strength [23,24]. Medium fiber volumes (1–2%) have been shown to be applicable to supplement the main reinforcement in the member in order to provide improved mechanical properties such as toughness and crack control, and they are typically used in cast-in-place or precast FRC members [25,26,27,28]. High fiber volumes (>2%) are mainly used for structures that require improved toughness, enhanced ductility, and improved fracture energy [29,30]. Although the fiber volume changes with the type of application, the main use of fibers is to improve the brittleness of the concrete, toughness, crack propagation and reduction in crack width. However, the use of fibers is not to replace the main reinforcement in the members, but rather enhance certain mechanical characteristics within the member utilizing the fibers as a bridging mechanism.
Iyer et al. [11] investigated the effect of using basalt fibers with volume fractions between 0.1 and 0.5%. The results showed that, increasing fiber content significantly decreases the workability. Therefore, it is recommended that the fiber content remains below 0.5%. Similarly, the mechanical properties of basalt fibers concrete BFC, with fiber content between 0.25% and 0.75%, have been investigated by Yang et al. [12]. The results showed that the optimum strength is produced by fiber volumes between 0.3% and 0.5%. In return, in this study, basalt fibers have been used with volume fractions between 0.15% and 0.5%.
In the literature, it has been reported that steel fibers are the most common type of fibers used due to its high modulus of elasticity; in addition, it improves the different mechanical properties of concrete mixtures [4,9]. Moreover, Eisa et al. [9] found that, including steel fibers, with a 1% volume fraction, into conventional concrete improved the modulus of elasticity by 30%, the modulus of rupture by 26%, and the splitting tensile strength by 96%. In addition, using steel fibers did not show a considerable improvement on the compressive strength of the concrete. Studies [31,32] have shown that the optimum steel fiber content, to improve the mechanical properties of concrete, is between 0.25% and 1.00%. In return, in this study, steel fiber was incorporated into BFC with volume fractions of 0.3% and 0.5% to maintain the total volume of fibers at less than 1%.
Fibers made from steel, polypropylene and glass are currently the most common fiber types used to produce fiber-reinforced concrete and they have been investigated and used for decades. However, these types of fibers may exhibit weight problems, corrosion, chemical durability, fatigue and increased cost in many applications. This has led the industry to focus on the development and investigation of other types of fibers as alternatives for reinforcement in polymer composites. A relatively new type of fiber that has been suggested for use in FRC is basalt fibers [33,34]. These fibers are an inorganic material produced from volcanic rock called basalt. The production of basalt fibers does not create any environmental waste, is nontoxic and requires less energy to produce when compared to glass or carbon fibers. In addition, Basalt fibers exhibit excellent structural properties such as high tensile strength, high thermal stability, light weight, non-corrosive and good chemical resistance, which makes it a potential alternative to common FRC fiber types [35,36,37]. Due to the nature of basalt rock, its chemical composition can vary depending on the geographical location and conditions of the source [38,39]. The chemical structure of basalt rock is closely related to glass with the most important components being: SiO2, Al2O3, CaO, MgO, Fe2O3 and FeO [39,40]. However, due to the abundant supply of basalt rock available and recent development in fiber production technology, basalt fiber displays significant potential and is considered as a viable alternative to traditional fibers [41,42]. A list of typical commercially available fibers and their properties can be seen in Table 1 [43,44].
Previous studies have found that, in proper proportions, basalt fibers have been shown to improve mechanical properties. Specifically, Patil et al. [45] found that a fiber percentage of 0.50% per volume produced the highest compressive and flexural strengths among three different types of fibers tested (basalt, glass and steel), where Basalt Fiber Concrete (BFC) obtained the highest strengths. Similarly, a study done by Yakhlaf et al. [1] showed that a fiber dosage of 0.30% per volume provided an optimal concrete mixture. While the mechanical properties tend to increase due to the addition of basalt fibers, studies have shown that the slump of concrete decreases. A study conducted by Jiang et al. [46] observed the effects of basalt fiber on the workability of BFC containing different fiber proportions by total volume of concrete. Results demonstrated that the increase in fiber volume decreased the slump of the concrete. Kirthika et al. [47] conducted a similar study utilizing different basalt fiber volumes where the results also displayed a reduction in workability with the increase in fiber content. The main reason for the reduction in slump is due to the increase in surface area of the fiber which causes concrete to agglomerate around the fibers. In addition to the coarse aggregate, the mortar must also coat the fibers and so, if the mortar fraction is insufficient, then a reduction in slump will be observed. In order to increase the slump of the concrete, additives such as plasticizers must be introduced into the mix. The durability properties of the concrete have also been shown to be affected by the addition of BF into concrete mixtures. A study conducted by Singh et al. [48] investigated the durability of BFC in chemical solutions, carbonation, rapid chloride penetration (RCPT) and fire. The study showed that BFC performed better than normal concrete. BFC displayed significantly less carbonation, whereas normal concrete showed increased ion permeability at 56 days.
The bridging mechanism of fibers is best utilized in preventing or controlling the propagation of cracks in the composite. Cracks in concrete is a multiscale process that starts at a micro scale and eventually propagates into a large macro crack. Crack development stages are best described by Figure 1 and explained in more in-depth by Ingemar Löfgren (2005) [44]. Hung et al. [49] found that the inclusion of steel fibers transfers the failure mode from multiple cracking into limited localized cracks. In addition, a study conducted by Kytinou et al. [50] concluded that the addition of steel fibers significantly improves the cracking and post-cracking performance of reinforced concrete.
Overall, it has been found that basalt fibers increase split tensile strength, flexural strength and toughness of concrete, but do not have a significant effect on compressive strength. The addition of basalt fibers may also have a negative effect on the workability of the concrete which may limit the application of the fibers. Furthermore, the published research provides only limited data on the post-cracking and durability characteristics of BFC. Therefore, to promote the use of basalt fibers, more research in Basalt Fiber Concrete (BFC) mixtures is needed to further understand the benefits of implementing basalt fibers into concrete. The aim of this paper is to assess the effectiveness of including basalt fibers in concrete with respect to fresh, mechanical, durability and corrosion properties. Therefore, an extensive experimental program of 336 samples was conducted to evaluate the behavior of concrete using different basalt fiber volumes (0.00%, 0.15%, 0.30%, 0.45%, and 0.50%), utilizing two water-to-cement ratios (w/c) (0.35 and 0.40). Additionally, a comparison between steel and basalt fibers was performed to, assess which of the two fibers provides a better overall performance.
2. Experimental Program
An extensive experimental program of 336 samples was carried out to investigate the fresh, mechanical and durability properties of concrete mixtures using basalt fibers. The study was performed with varying basalt fiber volumes of 0.15%, 0.30%, 0.45% and 0.50% by total concrete volume; utilizing two different water-to-cement ratios (w/c) of 0.35, and 0.40 and the results were compared to conventional concrete PC as well as steel fibers concrete SFC mixtures with 0.30% and 0.50% steel fibers volume fractions.
2.1. Materials Used
Crushed basalt with a nominal particle size of 19 mm (0.75 inch) was used as coarse aggregate (CA). Natural sand was used as fine aggregate (FA). Moisture absorption and specific gravity for the coarse and fine aggregate were determined in accordance to ASTM C127 [51] and ASTM C128 [52]. In the development of all mixtures, a Type II Portland cement with a specific gravity of 3.15 and conforming to the requirements of the ASTM C150 [53] was used. A high-range water reducing admixture (HRWA) utilizing Sika’s ‘ViscoCrete®4100’ confirming the requirements for ASTM C494 [54] Types A and F was also used in the concrete mixtures. The recommended dosages are between 325 and 780 mL/100 kg (5–12 fl oz./100 lbs) of cementitious materials. The basalt and steel fibers were provided by Deutsche Basalt Faser GmbH, Sangerhausen, Germany, and Sika Corporation, Lyndhurst New Jersey, NJ, USA, respectively. Figure 2 shows the basalt and steel fibers used in the mixtures. Table 2 shows material properties.
2.2. Mixture Proportions
A total of 14 concrete mixtures were designed based on typical mixtures used by the ITD (Idaho Transportation Department) for bridge constructions. Fiber volume guidelines were taken from the literature as well as the ACI 544.1R-96 Report on Fiber Reinforced Concrete [56] and the ACI 544.4R-18 “Design Considerations for Steel Fiber Reinforced Concrete” [57]. Fiber volumes were not to surpass 1% by volume, as this research does not aim to investigate high fiber volumes and is aimed more towards typical fiber volumes used (<1%). The dosages of superplasticizer were adjusted for each fiber volume content to achieve the desired slump of 6 inch ± 2 inch.
The mixtures were divided into two groups: Group I (labeled MA = Mixtures A) consisted of a control mixture (PC), Basalt Fibers Concrete (BFC), and Steel Fibers Concrete (SFC) mixtures with w/c ratio of 0.35. Group II (labeled MB = Mixtures B) consisted of the same mix proportions but with a w/c ratio of 0.40. For each group, BFC mixtures were prepared by varying basalt fiber volumes of 0.15%, 0.30%, 0.45% and 0.50% by total concrete volume, while two volume fractions of 0.30% and 0.50% were used for SFC mixtures. The mixtures were designated as BFC x, which indicates “Basalt Fibers Concrete” with “x”, which indicates the percentage of basalt fibers by volume; SFC x, which indicates “Steel Fibers Concrete” with “x”, which indicates the percentage of steel fibers by volume; and PC is used for the plain concrete, which refers to the control mix. Table 3 shows the mix design for this experimental program.
2.3. Mixing, Casting, and Testing
A rotary mixer was used to mix all concrete materials in accordance with ASTM C192 [58]. First, the coarse and fine aggregates were added to the rotating mixer and mixed for 30 s. The aggregates were brought to the Saturated Surface Dry (SSD) condition by adding a small amount of water. After the SSD, aggregates were kept mixing for more 30 s. Then, the cement was added to the mixer and continued to mix for another 30 s. Next, 60% of the water was poured over the mix, and the mixing continued for another 30 s. After that, the remaining 40% of water was added to the mix and allowed to mix for another 60 s. The admixture, if included, was added when adding the remaining 40% of water. The fibers, if included, were then added by 50% at a time in order to prevent the fibers from clumping together. Then, the mixing was continued until the homogenous mixture was produced. Generally, the total time for mixing ranged from 10 to 15 min.
From each concrete mixture, a total of nine 100 × 200 mm (4 × 8 inch) concrete cylinders, three 150 × 300 mm (6 × 12 inch) concrete cylinders, three 150 × 150 × 500 mm (6 × 6 × 20 in.) concrete beams, and three 50 × 50 × 300 mm (2 × 2 ×12 inch) concrete prisms were prepared. Three specimens were prepared for each test as follows, then the average was used. The nine cylinders were used to measure the compressive strength at 7, 14, and 28 days; the 150 × 300 mm cylinders were used to measure the tensile strength at 28 days; the 150 × 150 × 500 mm beams were used to measure the flexural strength at 28 days; and the 50 × 50 × 250 mm prisms were used for average residual strength test. In addition, three 50 × 50 × 300 mm (2 × 2 ×10 inch) concrete prisms and three 100 × 200 mm (4 × 8 inch) concrete cylinders were prepared for durability testing.
All prepared concrete cylinders and prisms were covered and left in plastic molds undisturbed for 24 h. Subsequently, they were unmolded and stored in 95% or higher humidity until the day of testing. All the moist-cured samples were tested within one hour after removal from curing. Figure 3 shows the prepared concrete specimens.
The experimental tests were performed in four stages: testing for fresh properties, mechanical properties testing, durability testing, and corrosion properties testing. First, the fresh properties of concrete mixtures were evaluated to ensure that the concrete met the desired mix design workability (slump) and to evaluate concrete unit weight differences within each mix. Then, the mechanical properties (compressive strength, tensile strength, flexural strength and average residual strength) of all the prepared concrete mixtures were evaluated. The durability of all concrete mixtures was assessed by measuring the unrestrained shrinkage and surface resistivity. Finally, Rapid Macrocell corrosion evaluation test was performed to measure the corrosion properties. The tests performed, the number of specimens per test and the standard testing methods followed are presented in Table 4. A brief description of the tests performed in this study are presented in the following sections.
2.3.1. Fresh Properties Testing
The workability of all concrete mixtures was measured by the slump test in accordance with ASTM C143 [59]. The cone mold is placed on top of a flat surface, filled with freshly mixed concrete in three layers and rodded 25 times per layer uniformly over the cross section with the rounded end of the tamping rod, as shown in Figure 4a. The unit weight of each concrete mix was measured by the unit weight test in accordance with ASTM C138 [60]. The freshly mixed concrete is placed in three layers and rodded 25 times per layer in a cylindrical container made of steel to measure the concrete unit weight, Figure 4b.
2.3.2. Mechanical Properties Testing
The compressive strength of all concrete mixtures was determined, in accordance with ASTM C39 [61], using the concrete cylinders at 7, 14, and 28 days. The average compressive strength of three cylinders was taken as the compressive strength of that mixture. Cylinders were capped using neoprene caps and tested using a compression machine with 300,000 lbs (300 kip) capacity. During testing, the load was applied continuously and without shock at a loading rate of 0.15 to 0.35 MPa/s (20 to 50 psi/s) until failure. The compressive strength was recorded from the compression machine reading. Figure 5 shows the compressive strength test set-up and a typical failure mode of a concrete cylinder.
The splitting tensile strength of all concrete mixtures was determined using the concrete cylinders at 28 days, in accordance with ASTM C496 [62]. The cylinders were placed longitudinally on the loading machine similar to the compression test. A plywood strip at the top and bottom of the specimen was placed along the center of the lower bearing block of the loading machine and the specimen. Then, a supplementary bearing plate was placed on top of the plywood strip and centered on the line marked on the specimen and the thrust of the spherical block. The load was applied continuously and without shock at a loading rate of 0.7 to 1.4 MPa/min (100 to 200 psi/min) until failure. The tensile strength was recorded from the compression machine reading. Figure 6 shows the splitting tensile strength test set-up and a typical failure mode of a concrete cylinder.
The flexural strength of all concrete mixtures was measured using the concrete beams at 28 days, in accordance with ASTM C78 [63]. The beam was placed longitudinally on the support frame with a clear span of 450 mm. The support frame along with the beam were placed on the loading machine and positioned in the center. The load-applying blocks were then placed on the marked lines. The load was applied continuously and without shock at a loading rate of 0.86 to 1.21 MPa/min (125 to 175 psi/min) until failure. The flexural strength was recorded from the compression machine reading. Figure 7 shows the flexural strength test set-up and a typical failure mode of a concrete beam.
The average residual strength of all concrete mixtures was determined using the concrete beams at 28 days, in accordance with ASTM C1399 [64]. The beams were placed on top of a stainless-steel plate for the first part of the test, longitudinally on the support frame with a clear span of 250 mm. The support frame, steel plate and the beam were placed on the loading machine and positioned on the center plate. The loading head was then placed on the marked lines. An LVDT was placed at the side of the specimen to measure deflection. The load cell and LVDT were connected to a data acquisition system that recorded the load applied (kN) and net deflection (mm) of the test beam at mid-span at different intervals. The load rate was applied continuously and without shock at a loading movement rate of 0.65 ± 0.15 mm/min (0.025 ± 0.005 inch/min) until a net deflection of 0.20 mm (0.008 inch) was reached. The test was stopped and data were recorded as the initial loading (load–deflection) curve. Then, the test was resumed by removing the steel plate, zeroing data acquisition devices and reloading the cracked beam at a loading rate of 0.65 ± 0.15 mm/min (0.025 ± 0.005 inch/min) until a net deflection of 1.25 mm (0.050 inch.) was obtained. Figure 8 shows the average residual strength test set-up and a typical failure mode of a concrete beam. The average residual strength (ARS) for each beam was calculated using the following equation:
where k = L/bd2, mm−2 (inch−2); ARS = Average residual strength, MPa (psi); PA = Recorded load at deflection of 0.50 mm (0.020 inch.), N (lbf); PB = Recorded load at deflection of 0.75 mm (0.030 inch.), N (lbf); PC = Recorded load at deflection of 1.00 mm (0.040 inch.), N (lbf); PD = Recorded load at deflection of 1.25 mm (0.050 inch.), N (lbf); L = Span length, mm (inch.); b = Average width of beam, mm (inch.); d = Average depth of beam, mm (inch.)
2.3.3. Durability Properties Testing
The surface resistivity of all concrete mixtures was determined using the concrete cylinders at 28 days with a 4-pin Wenner Probe, shown in Figure 9. The sample preparation was conducted as per ASTM C39 [65], and the test was performed as per AASHTO T358 [66]. The cylinders were removed from the curing and marked with four circumferential marks at 0, 90, 180, and 270 degrees, counterclockwise. The cylinders were also marked longitudinally at the center for use as a visual reference during testing. Once the beams were marked, they were placed back in the curing room until the time of testing. The cylinders were then removed and transported to the specimen holder and cleaned with a saturated towel to maintain a saturated wet surface during testing. The 4-pin Wenner Probe was then used to take measurements along the longitudinal side of the sample while making sure the longitudinal center mark was equidistant between the two inner probe pins. Readings were taken at each circumferential mark by rotating the specimen counterclockwise. A total of eight readings (two per mark) were taken and an average was taken for each mark. Three-cylinder specimens were used for each test and the average of all three was taken as the surface resistivity value for each mix. Figure 9 shows the surface resistivity 4-pin Wenner Probe used and a typical test being performed.
The unrestrained (free) shrinkage for all concrete mixtures was measured using the digital comparator test set-up as shown in Figure 10. The test consists of a sturdy upright support with a digital indicator gauge mounted on the top and a reference bar. The digital indicator has a range of 12.7 mm (0.5 inch) and 0.00127 mm (0.00005 inch) divisions. The unrestrained shrinkage of all concrete mixtures was measured using the concrete prisms. The change in length for prisms was measured in accordance with ASTM C490 [65]. The change in length for each prism was recorded after 7 days of casting and once a week thereafter for 91 days.
2.3.4. Corrosion Properties Testing
Corrosion of concrete reinforcement has been a major problem for concrete structures, especially concrete bridges that are continuously exposed to deicing chemicals. Various methods have been developed to reduce the damage caused by corrosion such as: implementing epoxy coated bars, galvanized bars, and implementing metal claddings to provide protection to the reinforcing steel members against corrosion. Corrosion performance evaluation of reinforcing steel embedded in concrete has typically been investigated by ASTM G109 [67], but this test is labor intensive and time consuming. To address such problems, an experimental corrosion evaluation test was developed at the University of Kansas, under the Strategic Highway Research Program (SHRP), called the rapid macrocell test. The test consists of a galvanic cell, which is made up of two electrodes, the anode and the cathode, placed in two separate containers immersed in simulated concrete pore solution to simulate the top and bottom reinforcement mats of a bridge deck. The potential difference between the anode and cathode causes current flow and corrosion to occur. The current flow through the containers is measured by measuring voltage drop through resistors and is used to calculate the rate of metal loss using Faraday’s law, see Equation (2).
where m = Corrosion rate (μm/yr); i = Current density of the macrocell (mA/cm2); a = Atomic weight of the metal (55.84 g/gram-atom, for iron); n = number of ion equivalents exchanged (for iron n = 2; ); F = Faraday’s constant (96,500 coulombs/equivalent); D = Density of the metal (7.87 g/cm3, for iron).
The way a galvanic cell works is through a shift in energy, called the potential, between electrodes. This shift in energy initiates the electrochemical process of oxidation and reduction reactions. Oxidation occurs at the positively charged electrode, called the anode; reduction occurs at the cathode, where electrons flow through due to the potential drop occurring at the anode. The voltage drop reading taken through this electrochemical process is used to monitor the corrosion rate of the macrocell. Aside from measuring the corrosion rate, a second reading is also used to evaluate the corrosion state of the steel. This reading is the open circuit potential and is measured with respect to a standard reference electrode; in this study it is a saturated calomel electrode (SCE). The corrosion state of the reinforcement can be classified as passive, active, or indeterminate, depending on the difference in potential between the reinforcement and the reference electrode. The output current potential is measured with a voltmeter, measuring the voltage drop between the reference electrode and the reinforcement at the half-cell.
A steel reinforcement was cut to obtain 5-in (127 mm) long specimens which were cleaned in preparation to casting. A 0.6 inch (15.24 mm) band of a two-part high viscosity epoxy was applied on the steel reinforcement centered on the protruding steel section. This coating was applied to prevent accelerated corrosion of steel specimens due to galvanic corrosion at the section where they protrude from the mortar, See Figure 11.
Three mortar specimens were cast with a No.5 (No.16M) steel reinforcement bar protruding from the center of the mold with a bottom cover of 1 inch (2.54 mm) A rotatory drum mixer was used to mix all mortar ingredients in accordance with the ASTM C305 [68]. Molds were cast with three additional containers of mortar mix, which was pre-cut to dimensions of <2 inch to serve as mortar fill, see Figure 11. All prepared mortar samples were covered and left in plastic molds undisturbed for 24 h. Subsequently, they were unmolded and stored in 95% or higher humidity until the day of testing. Once samples were cured, the samples were taken out from the curing room, dried, labeled and connected electrically as shown in Figure 12. Samples were also covered with protective tape for protective purposes, both electrically and to limit corrosion from other sources.
The macrocell electrical set-up consists of Cathode Top Connection, Cathode to switch, Switch to Resistor, and Resistor to Anode Top Connection. Once the electrical set-up was complete, the concrete pore solutions were prepared as follows:
- Anode macrocell: 18.81 g KOH, 17.87 g NaOH, 974.8 g distilled water, 45.6 g NaCl;
- Cathode macrocell: 18.81 g KOH, 17.87 g NaOH, 974.8 g distilled water;
- All solutions were per 1L of solution with anode containers having a 1.6 M NaCl solution and were made to fill the containers to a height of 3.72 inches. Alongside the pore solutions, the scrubbed air was also set-up with the following set-up and solutions:
- Container: length of 330 mm (13 inch) × height of 150 mm (6 inch);
- Bubbler: 127 mm (5 inch) air bubble stone disc bubble diffuser;
- Connections: plastic tubing, between cathodes about 25.4 mm (1 inch) connections;
- Solution: 1 M NaOH (40 g NaOH per 1000 g distilled water);
- Air Supply: pressurized air at 40–60 KPa (10–15 psi).
The container was filled about ¾ full of solution and required maintenance of materials as well as replenishing of solution as water evaporated over time. A salt bridge was required to maintain electrical neutrality in the cell. Without a salt bridge, the solution of the half-cells would become imbalanced, and the cell voltage would eventually drop to zero. The salt bridge allowed for ions to migrate between the solutions to maintain an equal charge within the cell. The anode in the electrical circuit loses electrons, while the cathode gains electrons, and so a salt bridge was added to maintain electrical neutrality within the cell. The salt bridge acts as a pathway for ions to migrate from one solution to the other which allows for the redox reactions to continue. The salt bridge was made of a salt solution, usually KCL (Potassium Chloride) or NaCL (Sodium Chloride). The following materials were used to create the salt bridges in this study:
- A 100 mm long u-shaped glass tube
- 4.5 g of agar (used to create semisolid gel);
- 30 g of KCL (potassium chloride);
- 100 g distilled water
All the materials were heated on a hot plate and stirred continuously until solution was melted. After melting, agar solution was placed into the tubes, keeping the ends higher than the center of the tube to prevent discharge. Tubes were placed in boiling water for 4 h, keeping the ends of the tubes out of the water. After removal from boiling water and after samples cooled, the salt bridge was inspected for air bubbles and tested for conductivity using a (DC) power source connected to two beakers filled with a chloride solution. Typical life span of a salt bridge is three weeks, after which the tubes are cleaned and another set of salt bridges is made. If the gel solution starts to flow out into the test containers, then the test specimens must be removed, cleaned and replaced with new solutions.
The test was performed by taking two readings, the voltage drop between anode and cathode and the voltage drop between the reference electrode and anode, also known as the open current potential (OCP). Data were collected three times a week for a minimum of 100 days. Macro cell corrosion current was determined by measuring the voltage drop across the resistor by connecting the positive lead of a voltmeter to the anode sample and the negative lead to the cathode sample. After taking the voltage drop readings, the switches were turned off and a waiting period of two hours was suggested. After the waiting period, the OCP readings were taken using the voltmeter and saturated calomel electrode. After collection of the OCP readings, the switches were turned back on until the next set of readings.
3. Experimental Results and Discussions
This section discusses the outcomes of the experimental program. Table 5 shows a summary of the results obtained from the experimental work. For the tests that were conducted using more than one specimen, the average was calculated and used for the analysis. Standard deviations and variances are introduced in Table 6, and it can be seen that the specimens’ results tend to be very close to one another.
3.1. Fresh Properties
3.1.1. Workability
Slump of a concrete mixture is used as a monitor technique for the consistency and workability of unhardened concrete. As expected from the literature [9,11], it is known that slump values tend to decrease with the addition of fibers and thus HRWA are added to the mix in order to achieve the desired slump value.
Results of the slump test are shown in Table 5. In general, the use of fibers increases the cohesion of the concrete mixtures, then slump values decrease. However, as can be seen from Figure 13, slump values were kept within the target range of 6 inch ± 2 inch by compensating for the loss in workability by adding the appropriate amount of HRWA. The HRWA values reached a maximum of 92.32 mL for mixture BFC 0.50 (MA), which provided a slump of 5.0 inch. The control mixtures did not require any HRWA as no fibers were used. The steel fiber mixtures required less HRWA when compared to the basalt fiber mixtures at the same fiber content. This can be attributed to the surface area covered by the steel fibers, being less than that of the basalt fibers which would provide a lower slump and as such required less HRWA to achieve the target slump range. In addition, the difference in the physical and chemical properties between steel and basalt fibers plays a role in this. For instance, basalt fibers have a rough surface compared to steel fibers and this will increase the interparticle friction resistance, which reduces the workability. Overall, the results indicate that, as fiber volume increases and as w/c ratio decreases, slump decreases and thus HRWA amounts required increases.
3.1.2. Unit Weights
The unit weight of the mix was used as a monitor technique for volume of mix, and air content values. Unit weight was affected by the air content within the mix, which also affects the slump of the mix. As expected from the literature [9,11], when slump decreases, the air content generally increases which should reduce the unit weight value.
The concrete unit weight values can be seen in Table 5. As can be seen in Figure 14, the results correlate closely with slump values obtained from the slump test, where a higher fiber volume obtained a higher concrete unit weight with BFC 0.50 (MB) obtaining the highest unit weight of 2520 kg/m3 (157.32 lb./ft3) and a unit weight of 2573 kg/m3 (160.62 lb./ft3) for SFC 0.50 (MB). Moreover, steel fibers showed higher unit weight results compared to basalt fiber results, due to the higher density of steel fibers.
3.2. Mechanical Properties
3.2.1. Compressive Strength
Results of compressive strength are shown in Table 5. The compressive strength was measured at different ages (7, 14, and 28 days) to determine the early age effect of fibers on the mechanical properties as well as standard 28-day curing period, Figure 15. Three specimens were prepared for each mix and then the average was used. From the literature [9,11,33,69], it is known that the addition of fibers at low dosages (<1% volume fraction) has been shown to produce a good contribution to the compressive strength. On the other hand, increasing the w/c ratio is known to decrease the strength of the concrete and so Group II (MB) is expected to experience a reduction in the compressive strength.
As can be seen from Figure 15, the early age (7 days, and 14 days) compressive strength tends to increase with the addition of fibers for MA and MB samples. The reference PC (MA) mix gained 58% of its final compressive strength after 7 days and this percent increases with the increase in fibers until 0.30%, as can be seen from BFC 0.30 (MA) which gained 80% of its compressive strength after 7 days. However, mixes with fibers more than 0.30% showed a reduction in early age compressive strength compared to 0.30% fibers, as shown in BFC 0.45 and BFC 0.50 which gained 77% and 75%, respectively, of their final compressive strength after 7 days. On the other hand, steel fibers mixes showed better early age results compared to the same basalt fibers volume mixes, as can be observed from SFC 0.30 and SFC 0.50, which gained 82% and 78%, respectively, of their final compressive strength after 7 days. Increasing w/c ratio did not show a considerable influence on early age results. Moreover, the same trend was obtained for 14-day results.
The addition of fiber bridges the microcracks of concrete at early ages and increases its overall stiffness, which increases the compressive strength at 28 days for both MA and MB samples. Figure 16 shows the compressive strength results normalized to the control mix PC (MA). As expected, MA compressive values are significantly higher than those of MB and the use of steel fibers showed higher strengths when compared to the same basalt fiber volume utilized for both mix groups. This can be attributed to the higher stiffness of steel fibers compared to basalt fibers. In addition, it has been observed that, due to the lower specific gravity of basalt fibers, compared to steel fibers, the fibers tend to move upward during the compacting process, and this non-uniformity could cause a reduction in the strength. However, we tried to overcome this by minimizing the use of the vibrator and using the temping rod instead. For Group I (MA samples), increasing basalt fiber volume by 0.15%, 0.30%, 0.45%, and 0.50% increased the compressive strength by 5%, 9%, 11%, and 12%, respectively, compared to the control mix PC. In addition, using steel fibers gave higher strengths compared to the same basalt fibers volume, as can be seen from SFC 0.30 and SFC 0.50 where the compressive strength is increased by 13% and 15%, respectively. On the other hand, MB samples showed the same trend as MA samples. However, as expected, increasing w/c from 0.35 (MA mixes) to 0.40 (MB mixes) decreased the compressive strength by around 8–11%.
3.2.2. Split Tensile Strength
The addition of fibers in concrete has shown to improve the tensile strength of concrete, as the fiber volumes tend to increase, the ductility of the material is improved and provides resistance against longitudinal crack growths [9,11,33,69]. From the literature, it was found that the addition of fibers would increase the 28-day tensile strength with the increase in fiber volume [9,11,33,69]. This may be attributed to the bridging interaction produced by the fibers, which prevents further crack growth. The increase in the w/c ratio is known to decrease the strength of the concrete and so Group II (MB) is expected to show a reduction in tensile strength. Three specimens were prepared for each mix and then the average was used. The results for the split tensile strength of the mixtures are shown in Table 5. Figure 17 shows the split tensile strength results normalized to the control mix PC (MA).
As can be seen from Figure 17, the addition of fibers shows an increase in split tensile strength with the increase in fiber volumes for both MA and MB samples. For Group I (MA samples), increasing basalt fiber volume by 0.15%, 0.30%, 0.45%, and 0.50% increased the splitting tensile strength by 18%, 21%, 25%, and 29%, respectively, compared to the control mix PC. In addition, the use of steel fibers showed a higher splitting tensile strength when compared to the same basalt fiber volume, because of the higher tensile strength property of steel fibers compared to basalt fibers, as can be seen from SFC 0.30 and SFC 0.50 where the splitting tensile strength is increased by 33% and 30%, respectively. On the other hand, MB samples showed the same trend as MA samples. However, as expected, increasing w/c from 0.35 (MA mixes) to 0.40 (MB mixes) decreased the split tensile strength by around 8–20%.
3.2.3. Modulus of Rupture
The flexural strength of concrete is one measure of the tensile strength of concrete and is used to measure the ability of concrete to resist failure under bending. The addition of fibers has been shown to improve the flexural strength of concrete, as the fibers increase the ductility of the material. This increase in ductility offers resistance against micro and macro-cracks propagating, allowing the concrete to continue to sustain considerable loads, which provides higher flexural values [9,11,33,69]. Three specimens were prepared for each mix and then the average was used. The results for the flexural strength (modulus of rupture MR) of the mixtures are shown in Table 5. Figure 18 shows the modulus of rupture results normalized to the control mix PC (MA).
As can be seen from Figure 18, the addition of fibers showed an increase in flexural strength with the increase in fiber content, up to a fiber volume of 0.30% for MA and up to a fiber volume of 0.45% for MB samples. The reason as to why 0.50% by volume did not provide higher values may be attributed to the inefficiency of fibers at that volume. Although balling of fibers was not experienced, higher fiber volumes require more cementitious material to coat both the fiber and aggregates. This in return may explain the reduction in strength of the materials and would indicate that, at lower fiber volumes (<1%), a fiber volume of around 0.30–0.45% would optimize the efficiency of the fibers. For Group I (MA samples), increasing basalt fiber volume by 0.15%, 0.30%, 0.45%, and 0.50% increased the flexural strength by 6%, 25%, 17%, and 12%, respectively, compared to the control mix PC. In addition, the use of steel fibers showed a higher flexural strength when compared to the same basalt fiber volume, because of the higher tensile strength property of steel fibers compared to basalt fibers, as can be seen from SFC 0.30 and SFC 0.50 where the modulus of rupture is increased by 28% and 24%, respectively. On the other hand, MB samples showed the same trend as MA samples. However, as expected, increasing w/c from 0.35 (MA mixes) to 0.40 (MB mixes) decreased the flexural strength by around 5–12%.
3.2.4. Average Residual Strength
The average residual strength is a measure of the post-cracking tensile strength of concrete. Concrete prism specimens are typically casted and cured for 28 days to attain the 28-day average residual strength (ARS) of the concrete, which may be used to evaluate the performance of fiber-reinforced concrete and to optimize the FRC mix proportions.
The addition of fibers has been shown to improve the residual strength of concrete, as the fibers increase the ductility of the material and act as a bridging mechanism preventing further crack growth. This improved ductility improves the capacity of the concrete to absorb energy during fracture which allows the concrete to sustain higher loads post-cracking where normal concrete would fail. This ability to absorb energy during fracture is referred to as toughness and is one of the most important benefits of the incorporation of fibers into plain concrete. From the literature [70,71], it was found that the addition of fibers would increase the 28-day average residual strength with the increase in fiber volume. As for fiber types, the mixtures with steel fibers should see higher ARS values since steel fibers have higher tensile strength compared to basalt fibers. Three specimens were prepared for each mix and then the average was used. The results for the average residual strength (ARS) of the mixtures can be seen in Table 5 as well as in Figure 19.
As can be seen from Figure 19, the addition of fibers increases the ARS of all mixtures with the increase in fiber volume. As expected, a fiber volume of 0.50% by volume provided the highest ARS for basalt fibers and overall SFC mixtures provided higher results. The control samples displayed no residual strength due to the samples not being able to be reloaded for the second part of the test. As can be seen in Figure 20a and Figure 21a, the load required to start crack propagation increases with the increase in fiber volume. Once the first crack was observed, the test was stopped, and the reloading part of the test was conducted. As can be seen in Figure 20b and Figure 21b, the increase in fiber volume provides an improved toughness in the mixtures, which results in higher ARS values.
Overall, the test shows SFC to be more effective in improving ARS. This may be attributed to the material properties of steel fibers being able to withstand more load (higher modulus of elasticity) and may also be attributed to the surface area covered by the fibers. The highest BFC ARS experienced by Group I (MA samples) was BFC 0.50 with an ARS of 1.04 Mpa (149.0 psi) and for Group II (MB samples) was BFC 0.50 with an ARS of 0.66 MPA (95.7 psi) and, as expected, MA samples showed ARS values significantly higher than those for MB samples. On the other hand, the use of steel fibers showed an improved ARS when compared to the same basalt fiber volume. The highest ARS experienced by steel fibers in Group I (MA samples) was SFC 0.50 with an ARS of 1.14 MPA (165.3 psi) and for Group II (MB samples) was SFC 0.50 with an ARS of 1.06 Mpa (153.7 psi).
3.3. Durability Properties
3.3.1. Unrestrained Shrinkage
The unrestrained shrinkage of all concrete mixtures in this study was measured using the comparator test set-up explained earlier. It is known that, during the hardening process of concrete, there is a reduction in concrete volume due to the effects of cement hydration and water loss. With the addition of fibers, shrinkage values should theoretically see a decrease with increased fiber volume as the fibers will restrain the cementitious matrix from contracting. The increase in w/c ratio should see a decrease in shrinkage strain values as the concrete will have more water to be used in the cement hydration process, allowing the concrete to not shrink for a longer period of time. The usage of steel fibers should see the most improvement in preventing shrinkage, as the literature has shown steel fibers to be effective in this characteristic [69,72,73]. The results for the unrestrained shrinkage can be seen in Figure 22.
As can be seen from Figure 22, the addition of fibers shows reduced shrinkage strain in relation to the increase in fiber volumes. The graph shows expansion of all mixtures in the first 14 days which is attributed to the 7-day period of the samples being immersed in the curing tank before being air-dried. This allowed the samples to absorb water and increase their overall dimensions. All fiber samples followed a similar trend of decreased shrinkage strain values with the increase in fibers content. In addition, the use of steel fibers showed a significantly lower shrinkage strain when compared to the same basalt fiber volume utilized for both mix groups.
3.3.2. Surface Resistivity
The surface resistivity test is a measure of the chloride ion penetrability of concrete. The test determines the electrical resistivity of water-saturated concrete to provide a rapid indication of its resistance to the penetration of chloride ions. The results for the chloride ion penetrability of the concrete can be seen in Figure 23.
As can be seen from Figure 23, the addition of basalt fibers shows a decrease in chloride ion penetrability (>12 kΩ/cm) for all MA mixtures and a decrease in chloride ion penetrability up to a fiber volume of 0.30% for MB samples. The reason as to why 0.45 and 0.50% BF by volume did not provide higher values for MB samples may be attributed to the higher porosity attained from the increase in w/c ratio as well as fibers; increasing voids during mixing and distribution of fibers may have been affected due to the higher fiber volume. Although balling of fibers was not experienced, higher fiber volumes affect distribution of fibers which decreases its efficiency. The highest improvement was for Group I (MA samples) which was BFC 0.30 with an increase of 61% chloride ion penetration resistance and for Group II (MB samples) it was BFC 0.45 with an increase of 47% chloride ion penetration resistance. As expected, MA values are higher than those of MB due to the increase in w/c ratio and, as can be seen, a fiber volume of 0.30% provides the highest improvement for BFC samples. On the other hand, the use of steel fibers increased the chloride ion penetration resistance. This is due to the material properties of steel fibers and the interaction of steel fibers, becoming more susceptible to chloride attacks. The highest decrease in chloride ion penetrability resistance for SFC was experienced by SFC 0.50 (MB) with a decrease of 48.45%.
3.4. Corrosion Properties
Rapid Macrocell Corrosion Evaluation Test
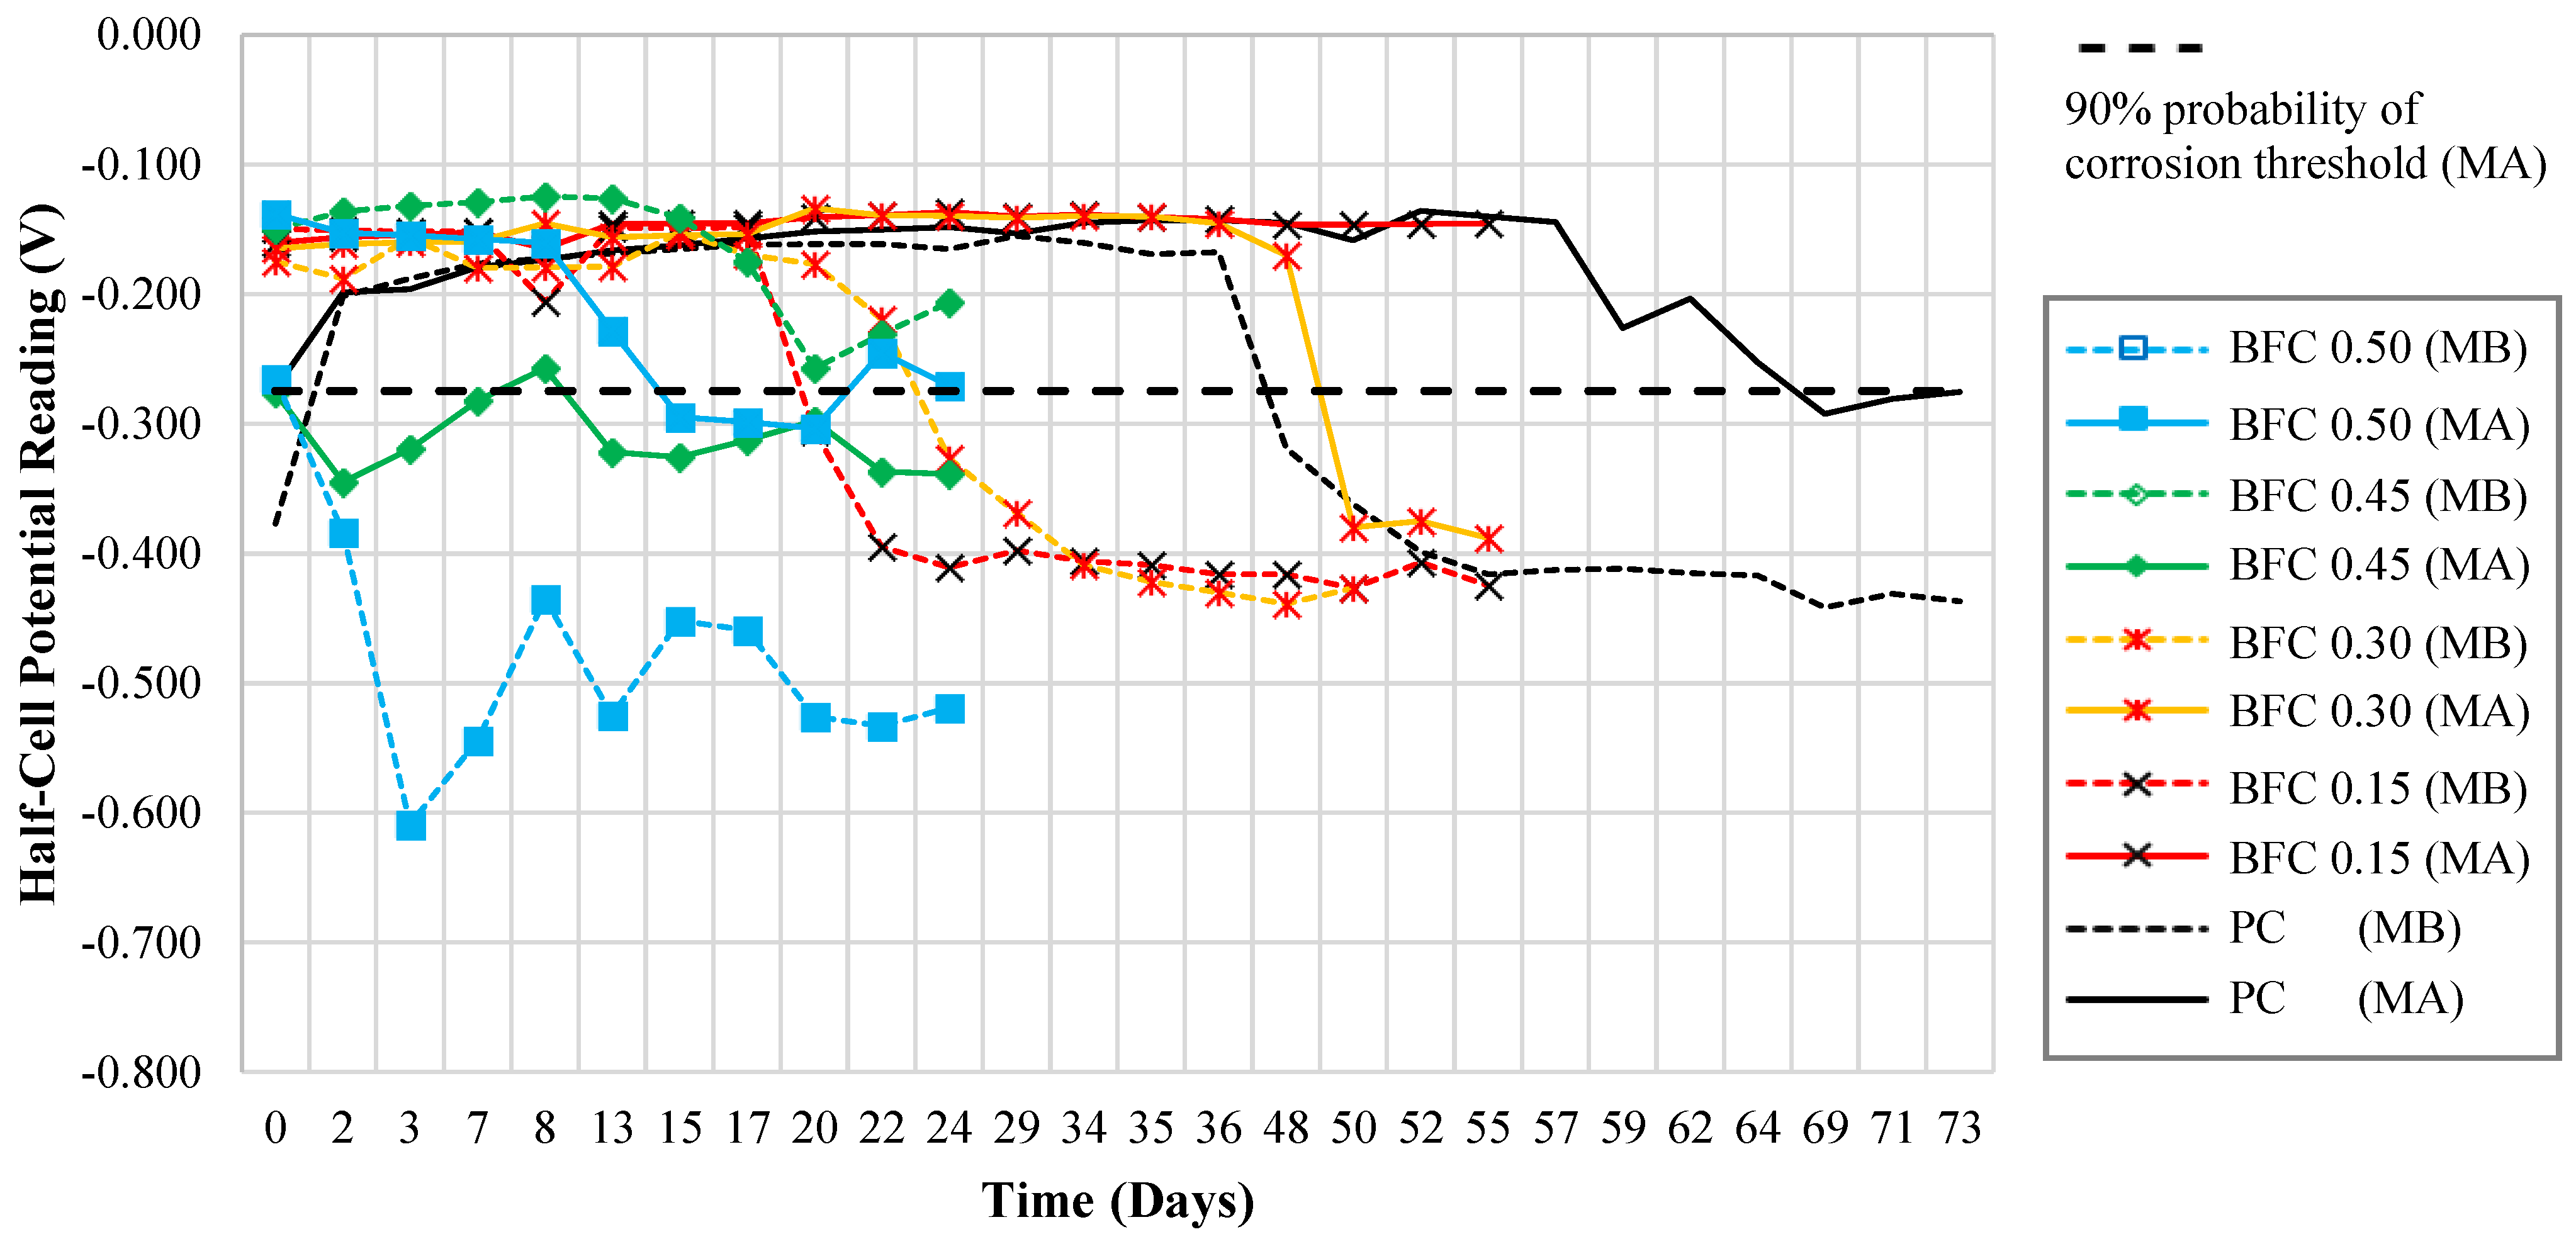
Previous studies on the chloride penetration resistance of BFC provided an unclear answer as to the effect BF have on the corrosion performance of BFC. Some studies showed that the addition of BF improved the resistance to chloride penetration, in case of the addition of cementitious materials such as fly ash or silica fume [74,75,76]. Other studies have shown that the addition of fibers decreases resistance to chloride penetration and can even increase internal microcracks and pores within the matrix, which accelerate corrosion activity [77,78]. The test in this study is important, since no supplementary cementitious materials were included, and the effects of basalt fiber have not been tested with the rapid macrocell test. The results for the corrosion rate of the study and open circuit potential are shown in Figure 24 and Figure 25.
As can be seen from Figure 24, the addition of fibers into the mix increases corrosion rates. The maximum corrosion rate exhibited is around 14 μm/yr by BFC 0.50 (MB) and varies around 8 and 12 μm/yr. The rates for the control samples maintain a corrosion rate close to 0 for about 57 days for MA and 36 days for MB, after which rates increase to around 2 to 4 μm/yr for MA and around 5 to 8 μm/yr for MB. Results show that BFC 0.15 (MA) maintains a relatively low corrosion rate, close to 0 μm/yr, for around 55 days, but due to insufficient data it is not clear if the trend would continue as low or if it would follow the trend of MA control, as BFC 0.15 (MB) followed the trend of MB control at a shorter time period. Moreover, it can be seen that MB samples tend to stabilize around 8 and 10 μm/yr, with the exception of BFC 0.50, whereas MA samples stabilize around 6 to 4 μm/year.
OCP readings indicate that the addition of basalt fibers increases the potential for corrosion with the increase in fiber volume. As can be seen from Figure 25, BFC 0.50 (MB) OCP readings drop below −0.275 V and maintain a reading of around −0.500 V, indicating a potential for corrosion within the first three weeks. BFC 0.45 (MA) is another sample that displays a similar corrosion potential, with OCP values dropping below −0.275 V within the first three weeks. On the other hand, MA control samples stay around −0.150 V for about eight weeks before dropping to around −0.275 V. A similar trend is seen for MB control samples, but with corrosion potential dropping below −0.275 V after six weeks period. Moreover, it can be seen that the addition of fibers reduces the time period at which samples experience corrosion potentials below −0.275 V. As explained with corrosion rate results, OCP results are also difficult to interpret as the testing period was not adequate and not enough data were gathered for all samples.
4. Conclusions
An extensive experimental program was conducted to investigate the effect of using basalt fibers on the fresh, mechanical, durability and corrosion properties of concrete mixtures. The study was performed using different basalt fiber volume fractions of 0.15%, 0.30%, 0.45%, and 0.50%, while two different water/cement (w/c) ratios of 0.35 and 0.40 were utilized, and the results were compared to conventional concrete PC as well as steel fibers concrete SFC mixtures with 0.30% and 0.50% of steel fibers by volume. The specific conclusions that can be drawn from this study are as follows:
- The use of fibers increases the cohesion of concrete mixtures, and this reduces its workability and thus high range water admixture has to be added to the mix in order to achieve the desired slump.
- Due to the rough surface of basalt fibers compared to steel fibers, interparticle friction increases and this reduces the BFC workability compared to SFC.
- The unit weight increases with the increase in fibers, due to the higher density of fibers. In addition, basalt fiber mixes provide lighter concrete compared to steel fiber mixes.
- The addition of fibers bridges the microcracks of concrete at early ages and this increases its overall stiffness, which increases the compressive strength. In addition, due to the lower specific gravity of basalt fibers compared to steel fibers, the fibers tend to move upward during compacting process and this non-uniformity could cause a reduction in the strength. However, we tried to overcome this by minimizing the use of vibrator and using the temping rod instead.
- It was found that increasing basalt fiber volume by 0.15%, 0.30%, 0.45%, and 0.50% increased the compressive strength by 5%, 9%, 11%, and 12%, respectively; increased the splitting tensile strength by 18%, 21%, 25%, and 29%, respectively; and increased the flexural strength by 6%, 25%, 17%, and 12%, respectively, compared to the control mix PC.
- Utilizing a 0.30% fibers volume fraction is the optimum ratio with an overall acceptable performance with respect to mechanical and corrosion properties.
- Increasing w/c from 0.35 to 0.40 decreased the compressive strength by around 8–11%, decreased the split tensile strength by around 8–20%, and decreased the flexural strength by around 5–12%.
- Unrestrained shrinkage decreased with the increase in fiber content. However, steel fibers show lower shrinkage compared to basalt fibers. Moreover, the addition of fibers up to 0.30% shows a decrease in chloride-ion penetrability.
- Steel fibers concrete showed better performance compared to the same basalt fibers volume, except for corrosion properties. However, the other results obtained for BFC are still competitive.
Author Contributions
Conceptualization, A.I., K.R.; methodology, K.R.; validation, K.R., A.I., M.B.; formal analysis, K.R.; investigation, K.R.; resources, A.I.; data curation, K.R.; writing—original draft preparation, M.T.E., A.I; writing—review and editing, M.T.E., A.I.; supervision, A.I., M.B; project administration, A.I.; funding acquisition, A.I. All authors have read and agreed to the published version of the manuscript.
Funding
Publication of this article was funded by the University of Idaho—Open Access Publishing Fund.
Institutional Review Board Statement
Not applicable.
Informed Consent Statement
Informed consent was obtained from all subjects involved in the study.
Data Availability Statement
The data presented in this study are available on request from the corresponding author. All data generated from this study is included in this paper.
Conflicts of Interest
The authors declare no conflict of interest.
References
- Yakhlaf, M. Fresh and Mechanical Properties of Basalt Fiber Reinforced Concrete; University of Tripoli: Tripoli, Libya, 2015. [Google Scholar]
- Torrents, J.M.; Blanco, A.; Pujadas, P.; Aguado, A.; Juan-García, P.; Sánchez-Moragues, M. Inductive method for assessing the amount and orientation of steel fibers in concrete. Mater. Struc. 2012, 45, 1577–1592. [Google Scholar] [CrossRef] [Green Version]
- Oh, B.H. Flexural analysis of reinforced concrete beams containing steel fibers. J. Struc. Eng. 1992, 118, 2821–2835. [Google Scholar] [CrossRef]
- Guerini, V.; Conforti, A.; Plizzari, G.; Kawashima, S. Influence of steel and macro-synthetic fibers on concrete properties. Fibers 2018, 6, 47. [Google Scholar] [CrossRef] [Green Version]
- Naaman, A.E.; Najm, H. Bond-slip mechanisms of steel fibers in concrete. Mater. J. 1991, 88, 135–145. [Google Scholar]
- Di Ludovico, M.; Prota, A.; Manfredi, G. Structural upgrade using basalt fibers for concrete confinement. J. Compos. Constr. 2010, 14, 541–552. [Google Scholar] [CrossRef]
- Pelisser, F.; Montedo, O.R.K.; Gleize, P.; Roman, H.R. Mechanical properties of recycled PET fibers in concrete. Mater. Res. 2012, 15, 679–686. [Google Scholar] [CrossRef]
- Naaman, A.E.; Shah, S.P.; Throne, J.L. Some developments in polypropylene fibers for concrete. Spec. Publ. 1984, 81, 375–396. [Google Scholar]
- Eisa, A.S.; Elshazli, M.T.; Nawar, M.T. Experimental investigation on the effect of using crumb rubber and steel fibers on the structural behavior of reinforced concrete beams. Constr. Build. Mater. 2020, 252, 119078. [Google Scholar] [CrossRef]
- Sim, J.; Park, C.; Moon, D.Y. Characteristics of basalt fiber as a strengthening material for concrete structures. Compos. Part B Eng. 2005, 36, 504–512. [Google Scholar] [CrossRef]
- Iyer, P.; Kenno, S.Y.; Das, S. Mechanical Properties of Fiber-Reinforced Concrete Made with Basalt Filament Fibers. J. Mater. Civ. Eng. 2015, 27, 04015015. [Google Scholar] [CrossRef]
- Yang, Y.X.; Lian, J. Basalt fiber reinforced concrete. Adv. Materi. Res. 2011, 194–196, 1103–1108. [Google Scholar] [CrossRef]
- Yao, W.; Li, J.; Wu, K. Mechanical properties of hybrid fiber-reinforced concrete at low fiber volume fraction. Cem. Concr. Res. 2003, 33, 27–30. [Google Scholar] [CrossRef]
- Abbas, U. Materials Development of Steel-and Basalt Fiber-Reinforced Concretes; Institutt for Konstruksjonsteknikk: Oslo, Norway, 2013. [Google Scholar]
- Halvaei, M.; Jamshidi, M.; Latifi, M. Effect of fiber geometry and tenacity on the mechanical properties of fine aggregates concrete. J. Ind. Text. 2014, 45, 1083–1099. [Google Scholar] [CrossRef]
- Gettu, R.; Gardner, D.R.; Saldivar, H.; Barragan, B.E. Study of the distribution and orientation of fibers in SFRC specimens. Mater. Struc. 2005, 38, 31–37. [Google Scholar] [CrossRef]
- Kılınç, A.Ç.; Durmuşkahya, C.; Seydibeyoğlu, M.Ö. Natural fibers. In Fiber Technology for Fiber-Reinforced Composites; Elsevier: Amsterdam, The Netherlands, 2017; pp. 209–235. [Google Scholar]
- Zīle, E.; Zīle, O. Effect of the fiber geometry on the pullout response of mechanically deformed steel fibers. Cem. Concr. Res. 2013, 44, 18–24. [Google Scholar] [CrossRef]
- Khamees, S.S.; Kadhum, M.M.; Nameer, A.A. Effects of Steel Fibers Geometry on the Mechanical Properties of SIFCON Concrete. Civ. Eng. J. 2020, 6, 21–33. [Google Scholar] [CrossRef]
- Yazıcı, Ş.; İnan, G.; Tabak, V. Effect of aspect ratio and volume fraction of steel fiber on the mechanical properties of SFRC. Constr. Build. Mater. 2007, 21, 1250–1253. [Google Scholar] [CrossRef]
- Kang, S.-T.; Choi, J.-I.; Koh, K.-T.; Lee, K.S.; Lee, B.Y. Hybrid effects of steel fiber and microfiber on the tensile behavior of ultra-high performance concrete. Compos. Struct. 2016, 145, 37–42. [Google Scholar] [CrossRef]
- Soliman, A.; Nehdi, M. Effects of shrinkage reducing admixture and wollastonite microfiber on early-age behavior of ultra-high performance concrete. Cem. Concr. Compos. 2013, 46, 81–89. [Google Scholar] [CrossRef]
- Branston, J.; Das, S.; Kenno, S.; Taylor, C. Influence of basalt fibres on free and restrained plastic shrinkage. Cem. Concr. Compos. 2016, 74, 182–190. [Google Scholar] [CrossRef]
- Gali, S.; Subramaniam, K.V. Evaluation of Crack Propagation and Post-cracking Hinge-type Behavior in the Flexural Response of Steel Fiber Reinforced Concrete. Int. J. Concr. Struct. Mater. 2017, 11, 365–375. [Google Scholar] [CrossRef] [Green Version]
- Barluenga, G.; Hernández-Olivares, F. Cracking control of concretes modified with short AR-glass fibers at early age. Experimental results on standard concrete and SCC. Cem. Concr. Res. 2007, 37, 1624–1638. [Google Scholar] [CrossRef]
- Ramakrishnan, V.; Wu, G.Y.; Hosalli, G. Flexural behavior and toughness of fiber reinforced concretes. Transp. Res. Rec. 1989, 1226, 69–77. [Google Scholar]
- Hao, Y.; Hao, H. Dynamic compressive behaviour of spiral steel fibre reinforced concrete in split Hopkinson pressure bar tests. Constr. Build. Mater. 2013, 48, 521–532. [Google Scholar] [CrossRef]
- Song, P.S.; Hwang, S. Mechanical properties of high-strength steel fiber-reinforced concrete. Constr. Build. Mater. 2004, 18, 669–673. [Google Scholar] [CrossRef]
- Maalej, M.; Hashida, T.; Li, V.C. Effect of Fiber Volume Fraction on the Off-Crack-Plane Fracture Energy in Strain -Hardening Engineered Cementitious Composites. J. Am. Ceram. Soc. 1995, 78, 3369–3375. [Google Scholar] [CrossRef] [Green Version]
- Aydin, A.C. Self compactability of high volume hybrid fiber reinforced concrete. Constr. Build. Mater. 2007, 21, 1149–1154. [Google Scholar] [CrossRef]
- Atiş, C.D.; Karahan, O. Properties of steel fiber reinforced fly ash concrete. Constr. Build. Mater. 2007, 23, 392–399. [Google Scholar] [CrossRef]
- Thomas, J.; Ramaswamy, A. Mechanical Properties of Steel Fiber-Reinforced Concrete. J. Mater. Civ. Eng. 2007, 19, 385–392. [Google Scholar] [CrossRef]
- High, C.; Seliem, H.M.; El-Safty, A.; Rizkalla, S.H. Use of basalt fibers for concrete structures. Constr. Build. Mater. 2015, 96, 37–46. [Google Scholar] [CrossRef]
- Ross, A. Basalt fibers: Alternative to glass? Compos. Technol. 2006, 12, 44–48. [Google Scholar]
- Deák, T.; Czigány, T. Chemical Composition and Mechanical Properties of Basalt and Glass Fibers: A Comparison. Text. Res. J. 2009, 79, 645–651. [Google Scholar] [CrossRef]
- Greco, A.; Maffezzoli, A.; Casciaro, G.; Caretto, F. Mechanical properties of basalt fibers and their adhesion to polypropylene matrices. Compos. Part B Eng. 2014, 67, 233–238. [Google Scholar] [CrossRef]
- Wu, G.; Wang, X.; Wu, Z.; Dong, Z.; Zhang, G. Durability of basalt fibers and composites in corrosive environments. J. Compos. Mater. 2014, 49, 873–887. [Google Scholar] [CrossRef]
- Rabiaa, E.; Mohamed, R.A.S.; Sofi, W.H.; Tawfik, T.A. Developing Geopolymer Concrete Properties by Using Nanomaterials and Steel Fibers. Adv. Mater. Sci. Eng. 2020, 2020, 1–12. [Google Scholar] [CrossRef]
- Ganesh, A.C.; Sowmiya, K.; Muthukannan, M. Investigation on the effect of steel fibers in geopolymer concrete. IOP Conf. Series: Mater. Sci. Eng. 2020, 872, 012156. [Google Scholar] [CrossRef]
- Pareek, K.; Saha, P. Basalt fiber and its composites: An overview. In Advances in Structural Technologies (CoAST-2019); Adhikari, S., Dutta, A., Choudhury, S., Eds.; Springer: Berlin/Heidelberg, Germany, 2019; Volume 1. [Google Scholar]
- Ralph, C.; Lemoine, P.; Summerscales, J.; Archer, E.; McIlhagger, A. The relationship between the chemical, mechanical and geometrical properties of basalt fibre. Tex. Res. J. 2019, 89, 3056–3066. [Google Scholar] [CrossRef]
- Kumbhar, V.P. An overview: Basalt rock fibers-new construction material. Acta Eng. Int. 2014, 2, 11–18. [Google Scholar]
- Fiore, V.; Scalici, T.; Di Bella, G.; Valenza, A. A review on basalt fibre and its composites. Compos. Part B Eng. 2015, 74, 74–94. [Google Scholar] [CrossRef]
- Ma, W.; Qin, Y.; Li, Y.; Chai, J.; Zhang, X.; Ma, Y.; Liu, H. Mechanical properties and engineering application of cellulose fiber-reinforced concrete. Mater. Today Commun. 2019, 22, 100818. [Google Scholar] [CrossRef]
- Patil, R.K.; Kulkarni, D. Comparative study of effect of basalt, glass and steel fiber on compressive and flexural strength of concrete. Int. J. Res. Eng. Technol. 2014, 3, 436–438. [Google Scholar]
- Jiang, C.; Fan, K.; Wu, F.; Chen, D. Experimental study on the mechanical properties and microstructure of chopped basalt fibre reinforced concrete. Mater. Des. 2014, 58, 187–193. [Google Scholar] [CrossRef]
- Kirthika, S.; Singh, S. Experimental Investigations on Basalt Fibre-Reinforced Concrete. J. Inst. Eng. Ser. A 2018, 99, 661–670. [Google Scholar] [CrossRef]
- Kirthika, S.; Singh, S.; Surya, M. Durability studies on basalt fiber reinforced concrete. Indian Concr. 2018, 92, 45–55. [Google Scholar]
- Hung, C.C.; Lee, H.S.; Chan, S.N. Tension-stiffening effect in steel-reinforced UHPC composites: Constitutive model and effects of steel fibers, loading patterns, and rebar sizes. Compos. Part B Eng. 2019, 158, 269–278. [Google Scholar] [CrossRef]
- Kytinou, V.K.; Chalioris, C.E.; Karayannis, C.G. Analysis of residual flexural stiffness of steel fiber-reinforced concrete beams with steel reinforcement. Materials 2020, 13, 2698. [Google Scholar] [CrossRef]
- ASTM C127-15; Standard Test Method for Relative Density (Specific Gravity) and Absorption of Coarse Aggregate. ASTM International: West Conshohocken, PA, USA, 2015.
- ASTM C128-15; Standard Test Method for Relative Density (Specific Gravity) and Absorption of Fine Aggregate. ASTM International: West Conshohocken, PA, USA, 2015.
- ASTM C150/C150M-21; Standard Specification for Portland Cement. ASTM International: West Conshohocken, PA, USA, 2021.
- ASTM C494/C494M-19; Standard Specification for Chemical Admixtures for Concrete. ASTM International: West Conshohocken, PA, USA, 2019.
- ASTM C33/C33M-18; Standard Specification for Concrete Aggregates. ASTM International: West Conshohocken, PA, USA, 2018.
- ACI Committee 544. State-of-the-Art Report on Fiber Reinforced Concrete (ACI 544.1R-96); American Concrete Institute: Farmington Hills, MI, USA, 2002; p. 66. [Google Scholar]
- ACI Committee 544. Guide to Design with Fiber-Reinforced Concrete (ACI 544.4R-18); American Concrete Institute: Farmington Hills, MI, USA, 2018; p. 44. [Google Scholar]
- ASTM C192/C192M-19; Standard Practice for Making and Curing Concrete Test Specimens in the Laboratory. ASTM International: West Conshohocken, PA, USA, 2019.
- ASTM C143/C143M-20; Standard Test Method for Slump of Hydraulic-Cement Concrete. ASTM International: West Conshohocken, PA, USA, 2020.
- ASTM C138/C138M-17a; Standard Test Method for Density (Unit Weight), Yield, and Air Content (Gravimetric) of Concrete. ASTM International: West Conshohocken, PA, USA, 2017.
- ASTM C39/C39M-21; Standard Test Method for Compressive Strength of Cylindrical Concrete Specimens. ASTM International: West Conshohocken, PA, USA, 2021.
- ASTM C496/C496M-17; Standard Test Method for Splitting Tensile Strength of Cylindrical Concrete Specimens. ASTM International: West Conshohocken, PA, USA, 2017.
- ASTM C78/C78M-21; Standard Test Method for Flexural Strength of Concrete (Using Simple Beam with Third-Point Loading). ASTM International: West Conshohocken, PA, USA, 2021.
- ASTM C1399/C1399M-10(2015); Standard Test Method for Obtaining Average Residual-Strength of Fiber-Reinforced Concrete. ASTM International: West Conshohocken, PA, USA, 2015.
- ASTM C490/C490M-17; Standard Practice for Use of Apparatus for the Determination of Length Change of Hardened Cement Paste, Mortar, and Concrete. ASTM International: West Conshohocken, PA, USA, 2017.
- AASHTO T358-19; Method of Test for Surface Resistivity Indication of Concrete’s Ability to Resist Chloride Ion Penetration. American Association of State Highway and Transportation Officials: Washington, DC, USA, 2019.
- ASTM G109-07(2013); Standard Test Method for Determining Effects of Chemical Admixtures on Corrosion of Embedded Steel Reinforcement in Concrete Exposed to Chloride Environments. ASTM International: West Conshohocken, PA, USA, 2013.
- ASTM C305-20; Standard Practice for Mechanical Mixing of Hydraulic Cement Pastes and Mortars of Plastic Consistency. ASTM International: West Conshohocken, PA, USA, 2020.
- Kachouh, N.; El-Hassan, H.; El Maaddawy, T. The use of steel fibers to enhance the performance of concrete made with recycled aggregate. In Proceedings of the Fifth International Conference on Sustainable Construction Materials and Technologies (SCMT5), London, UK, 14 July 2019; pp. 15–17. [Google Scholar]
- Liu, J.; Chen, M.; Yang, J.; Wu, Z. Study on Mechanical Properties of Basalt Fibers Superior to E-glass Fibers. J. Nat. Fibers 2020, 1–13. [Google Scholar] [CrossRef]
- Asadi, A.; Baaij, F.; Mainka, H.; Rademacher, M.; Thompson, J.; Kalaitzidou, K. Basalt fibers as a sustainable and cost-effective alternative to glass fibers in sheet molding compound (SMC). Compos. Part B Eng. 2017, 123, 210–218. [Google Scholar] [CrossRef]
- Wang, X.; Shi, J.; Liu, J.; Yang, L.; Wu, Z. Creep behavior of basalt fiber reinforced polymer tendons for prestressing application. Mater. Des. 2014, 59, 558–564. [Google Scholar] [CrossRef]
- Jalasutram, S.; Sahoo, D.R.; Matsagar, V. Experimental investigation of the mechanical properties of basalt fiber-reinforced concrete. Struct. Concr. 2017, 18, 292–302. [Google Scholar] [CrossRef]
- Mohamed, O.A.; Al Hawat, W. Influence of Fly Ash and Basalt Fibers on Strength and Chloride Penetration Resistance of Self-Consolidating Concrete. Mater. Sci. Forum 2016, 866, 3–8. [Google Scholar] [CrossRef]
- Huang, Q.; Shi, X.S.; Wang, Q.Y.; Tang, L.; Zhang, H.E. The influence of fiber on the resistance to chloride-ion penetration of concrete under the environment of carbonation. Mater Rev. 2015, 2, 546–549. [Google Scholar]
- Guo, Y.; Hu, X.; Lv, J. Experimental study on the resistance of basalt fibre-reinforced concrete to chloride penetration. Constr. Build. Mater. 2019, 223, 142–155. [Google Scholar] [CrossRef]
- Weige, C.; Zhu, H.; He, Z.; Yang, L.; Zhao, L.; Wen, C. Experimental investigation on chloride-ion penetration resistance of slag containing fiber-reinforced concrete under drying-wetting cycles. Constr. Build. Mater. 2020, 274, 121829. [Google Scholar] [CrossRef]
- Lövgren, I. Fibre-Reinforced Concrete for Industrial Construction–A fracture Mechanics Approach to Material Testing and Structural Analysis; Chalmers Tekniska Hogskola: Stockholm, Sweden, 2005. [Google Scholar]
Figure 1.
Schematic of the crack development process ([44], 2019, Elsevier).
Figure 1.
Schematic of the crack development process ([44], 2019, Elsevier).
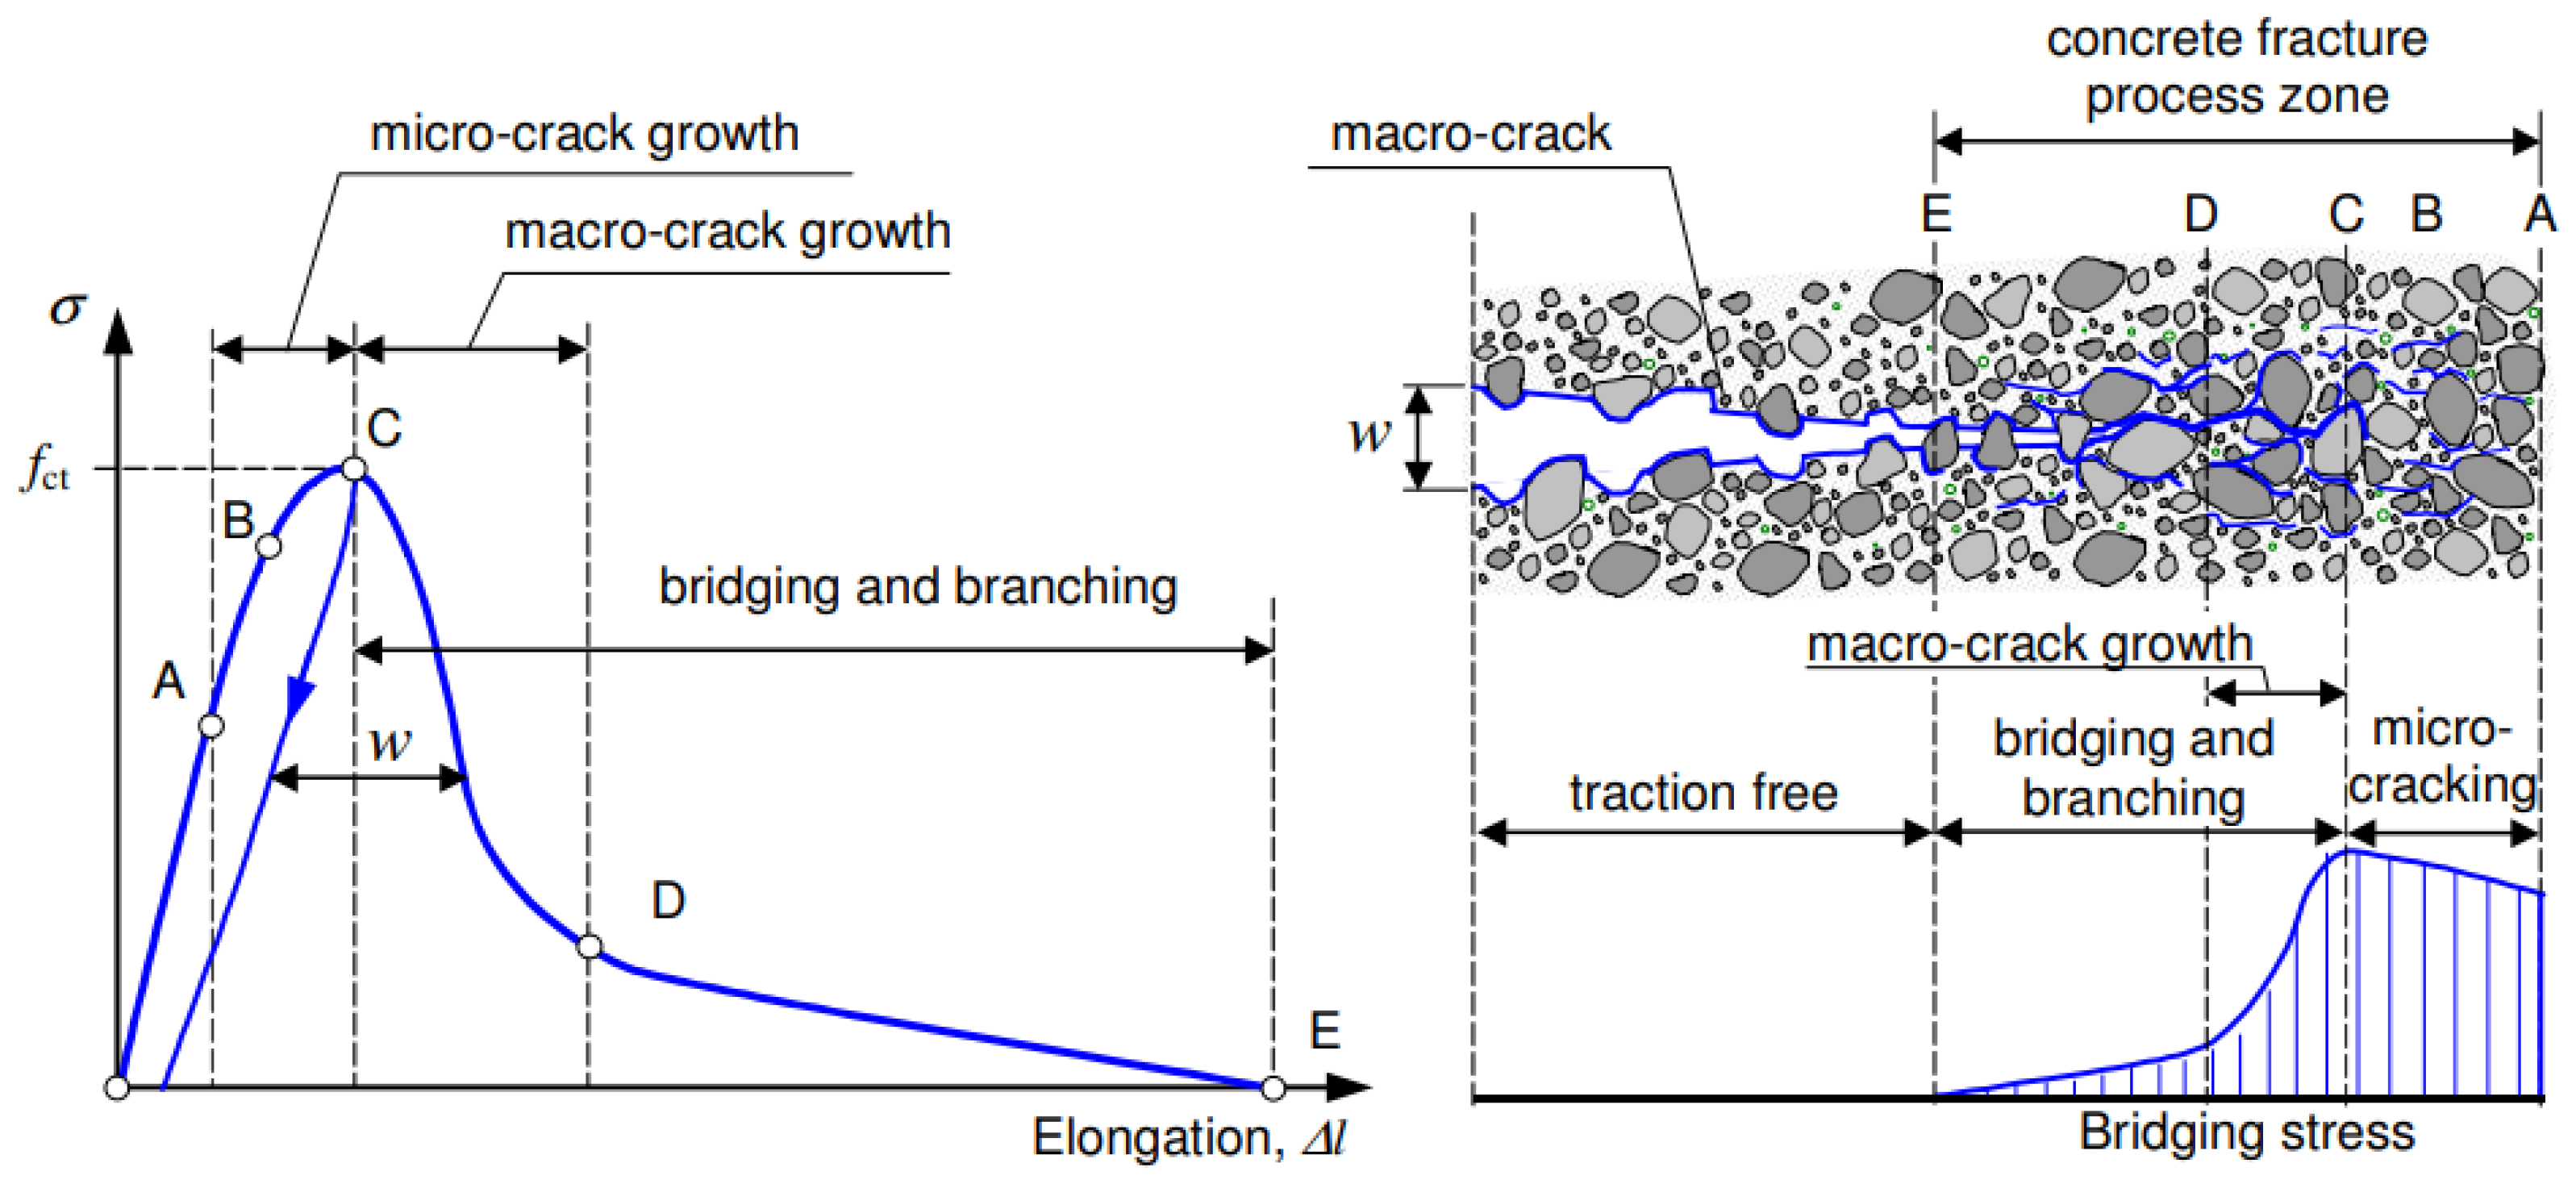
Figure 2.
(Left) basalt fiber, (Right) steel fiber.
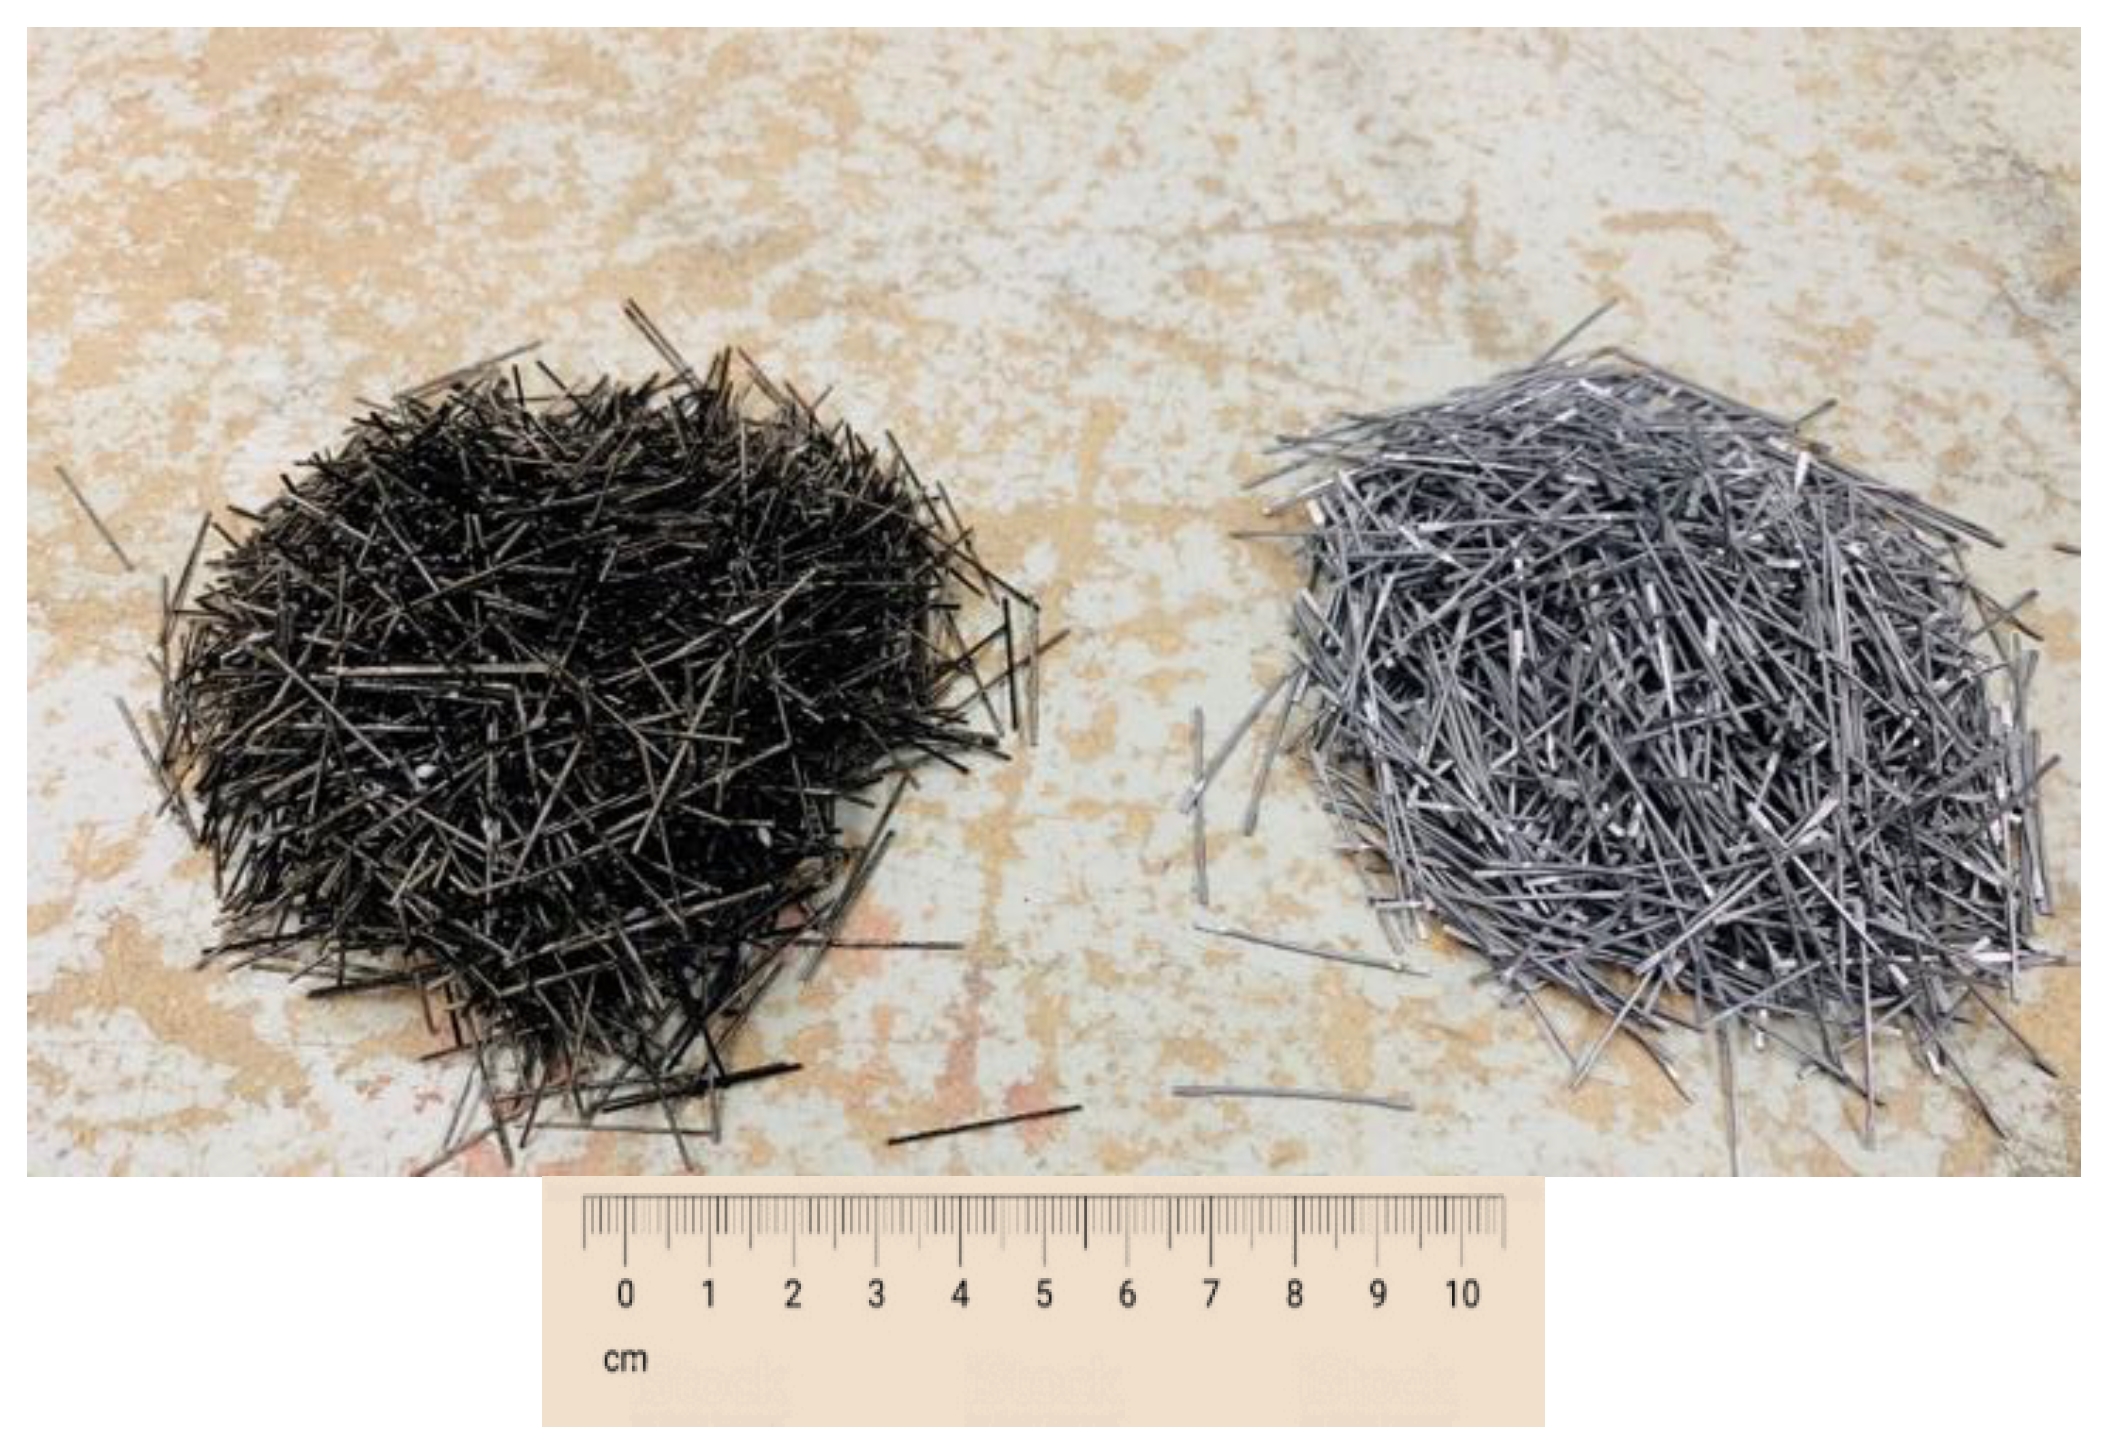
Figure 3.
Concrete specimens: (a) concrete cylinders and beams, (b) concrete prisms.
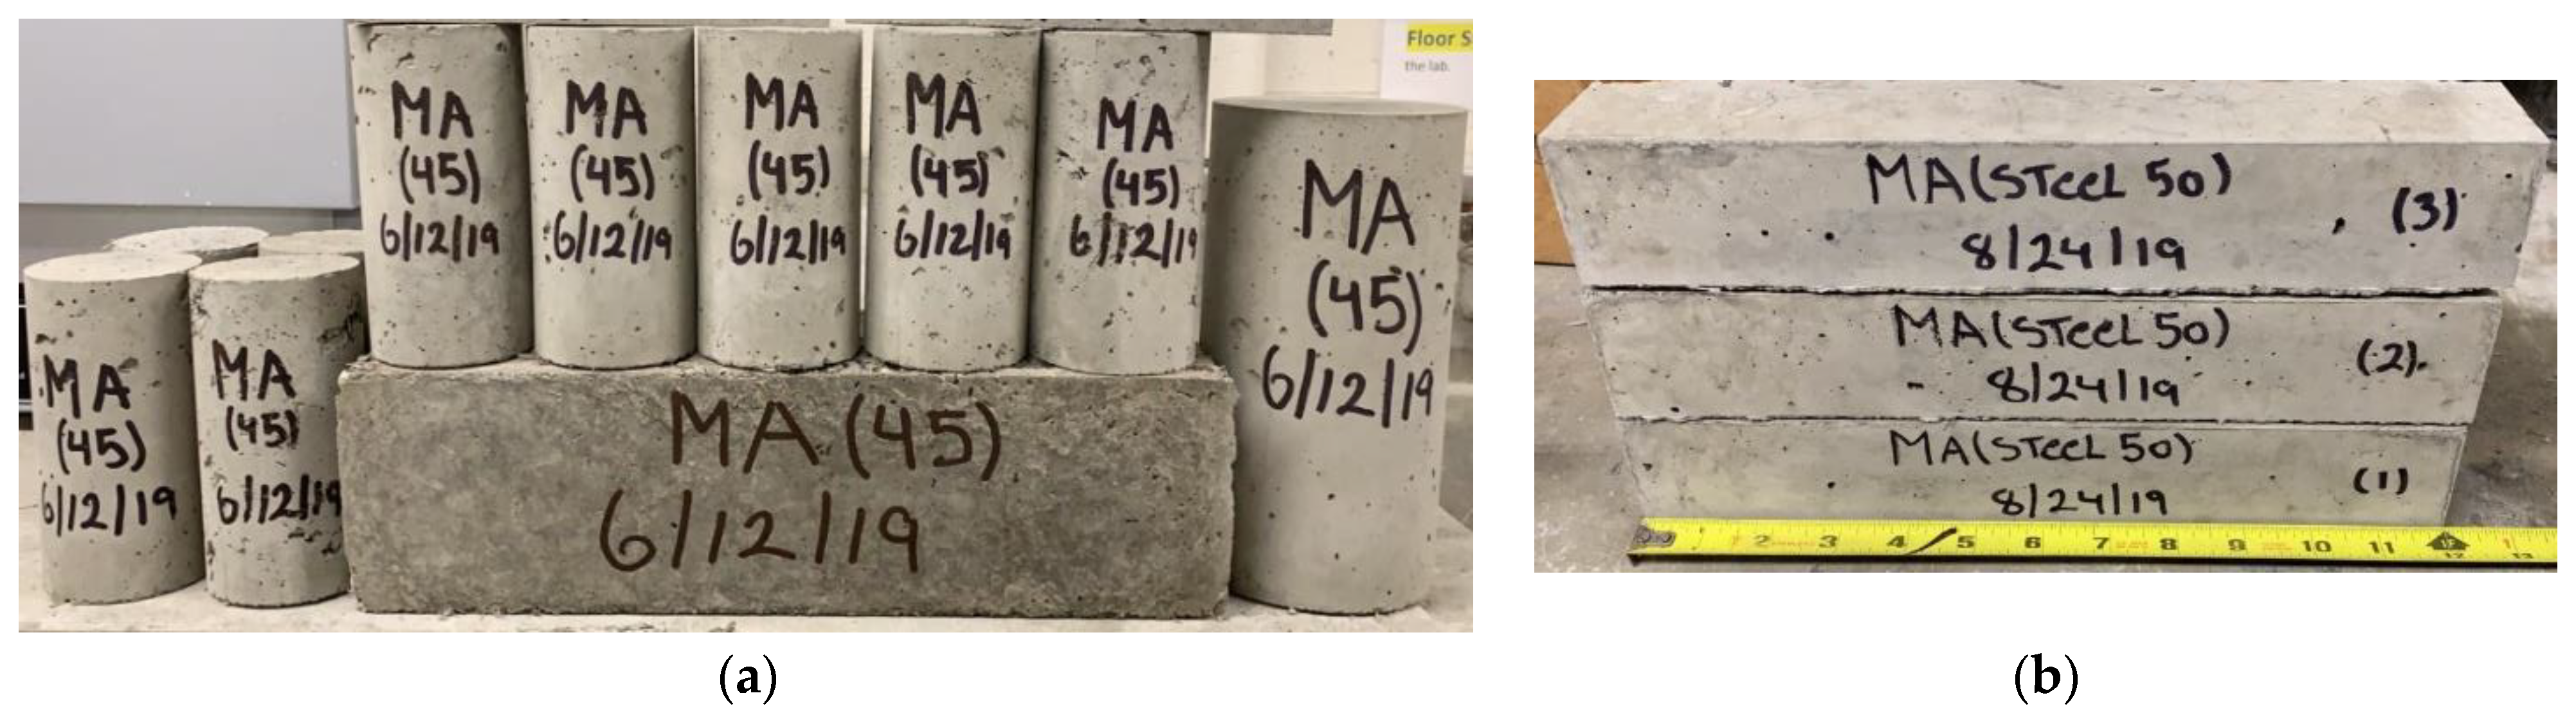
Figure 4.
Fresh properties testing: (a) slump test, (b) unit weight test.

Figure 5.
Compressive strength test set-up.

Figure 6.
Splitting tensile test set-up.

Figure 7.
Flexural strength test set-up.

Figure 8.
ARS test set-up.
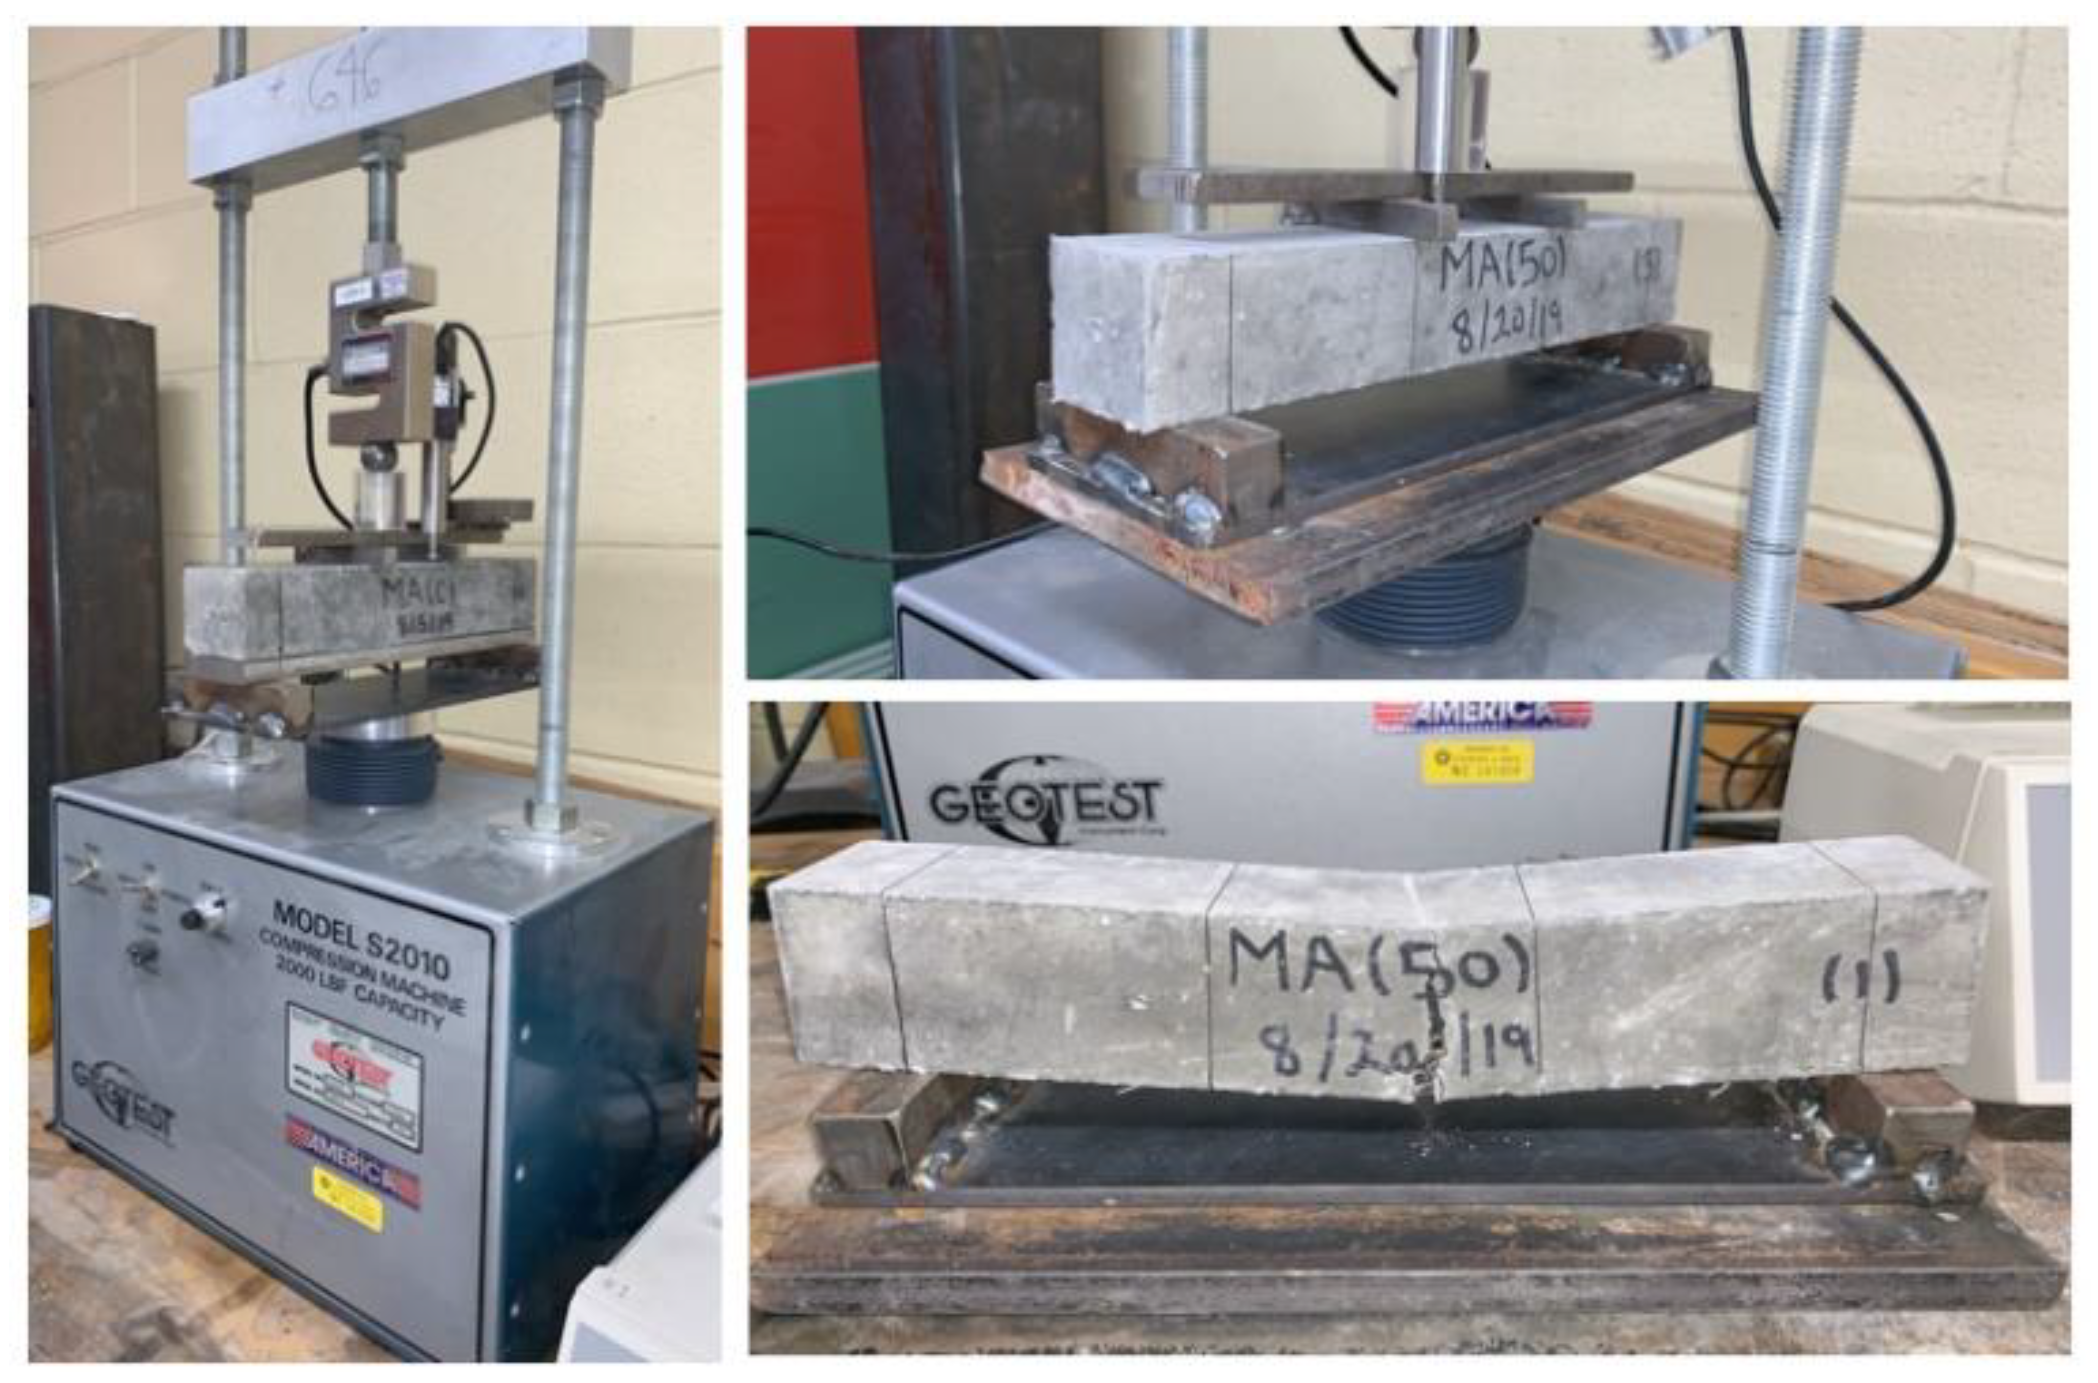
Figure 9.
Surface resistivity test set-up.
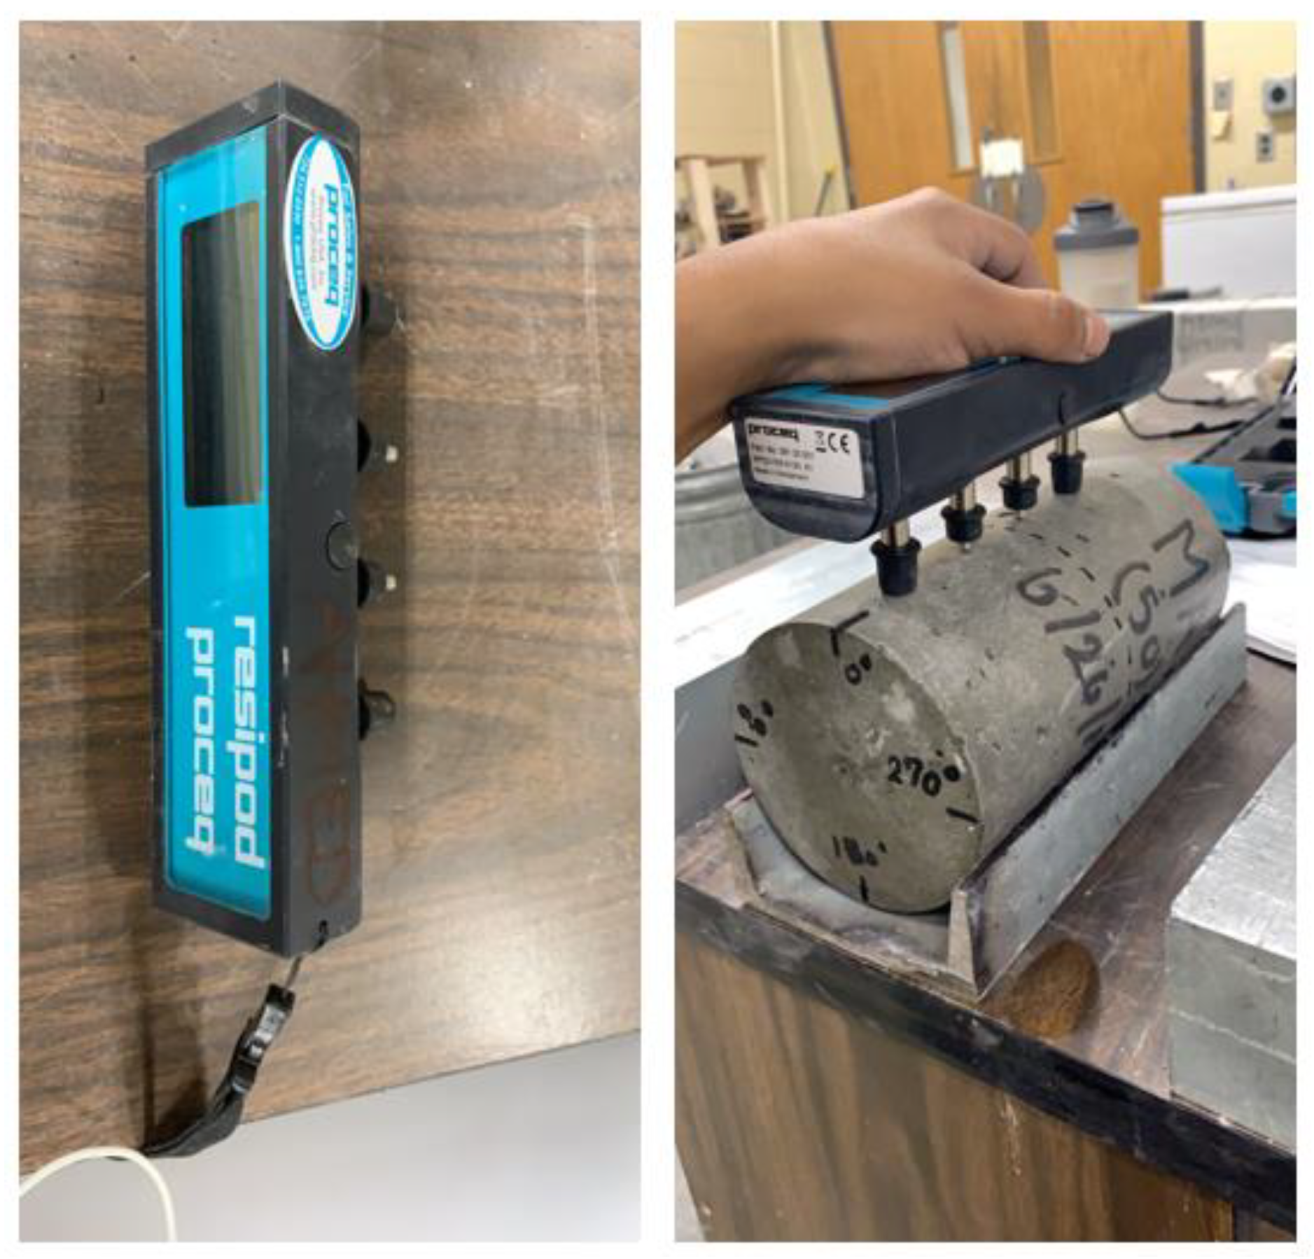
Figure 10.
Unrestrained drying strength test set-up.
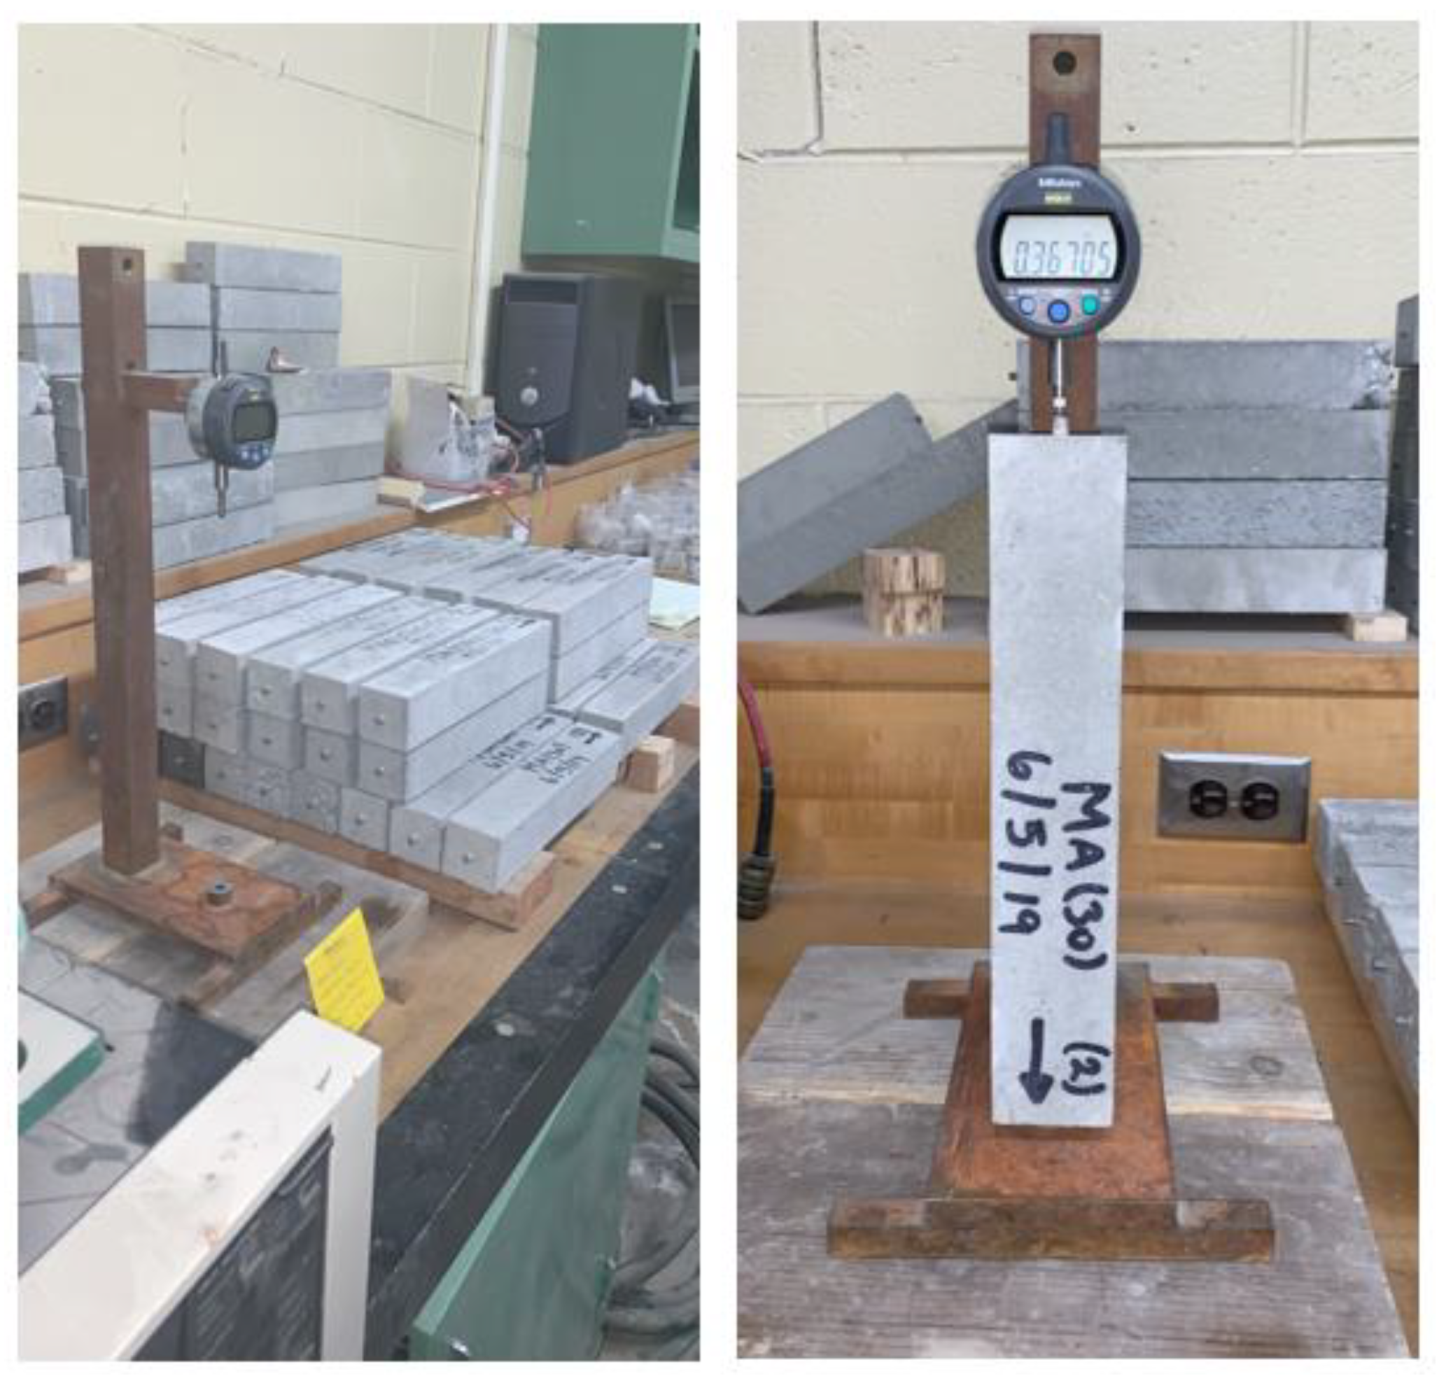
Figure 11.
(a) Steel reinforcement, (b) demolded macrocell sample.
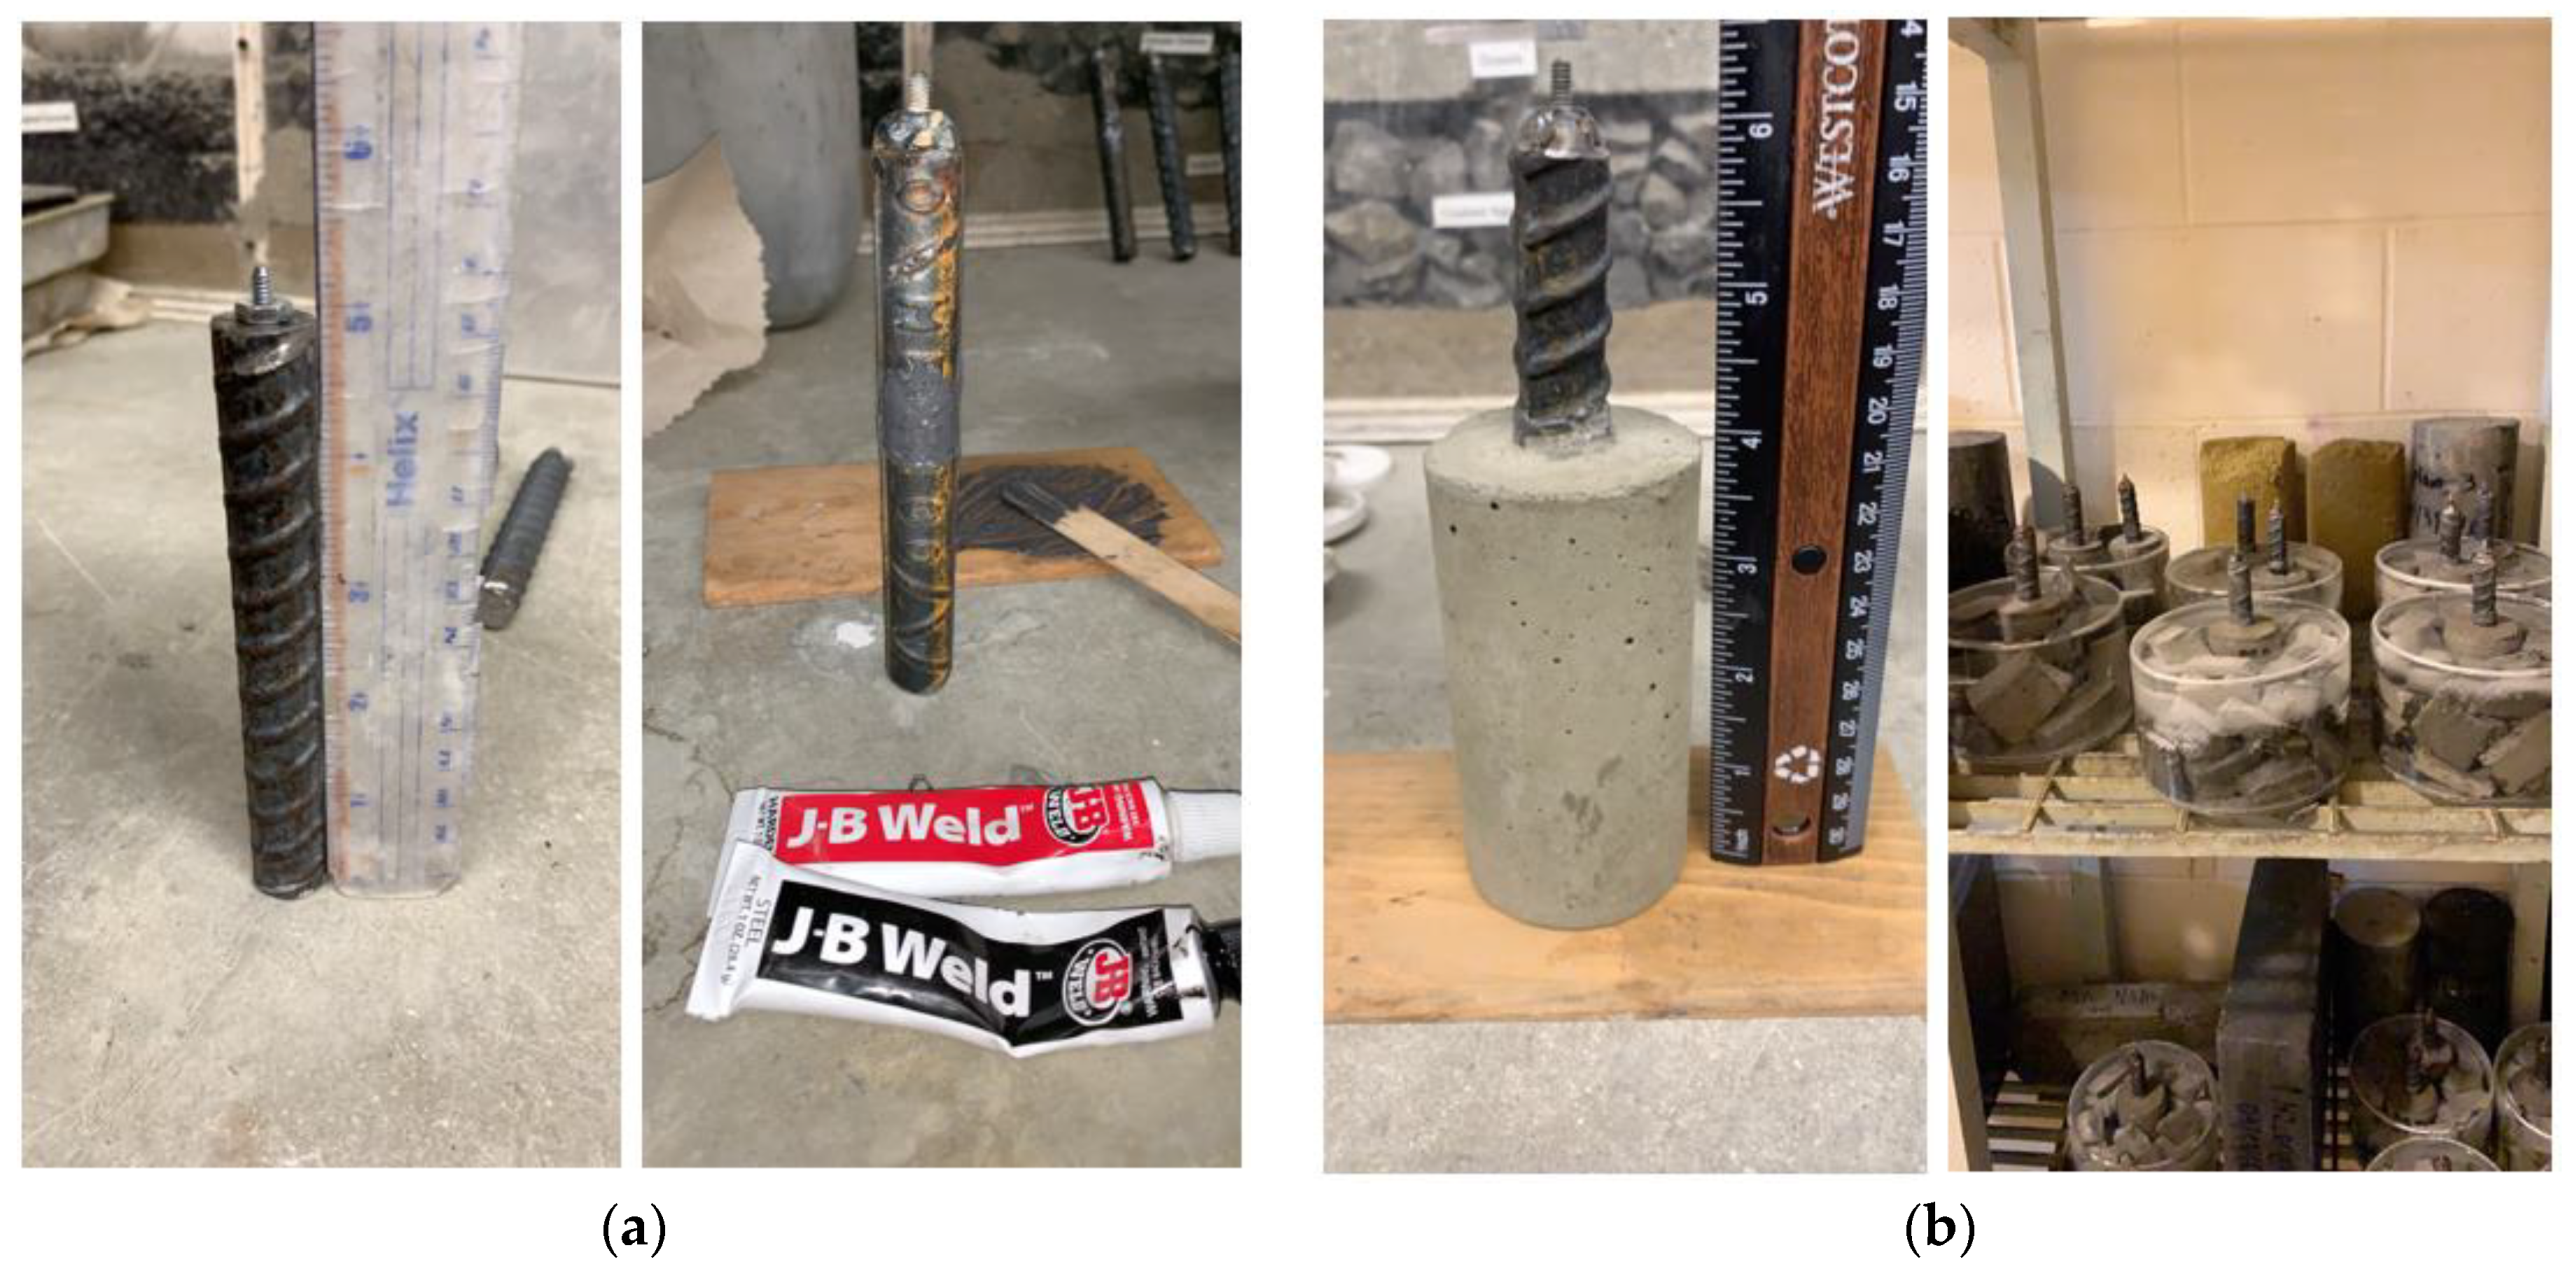
Figure 12.
Macrocell electrical set-up.

Figure 13.
Slump test results.
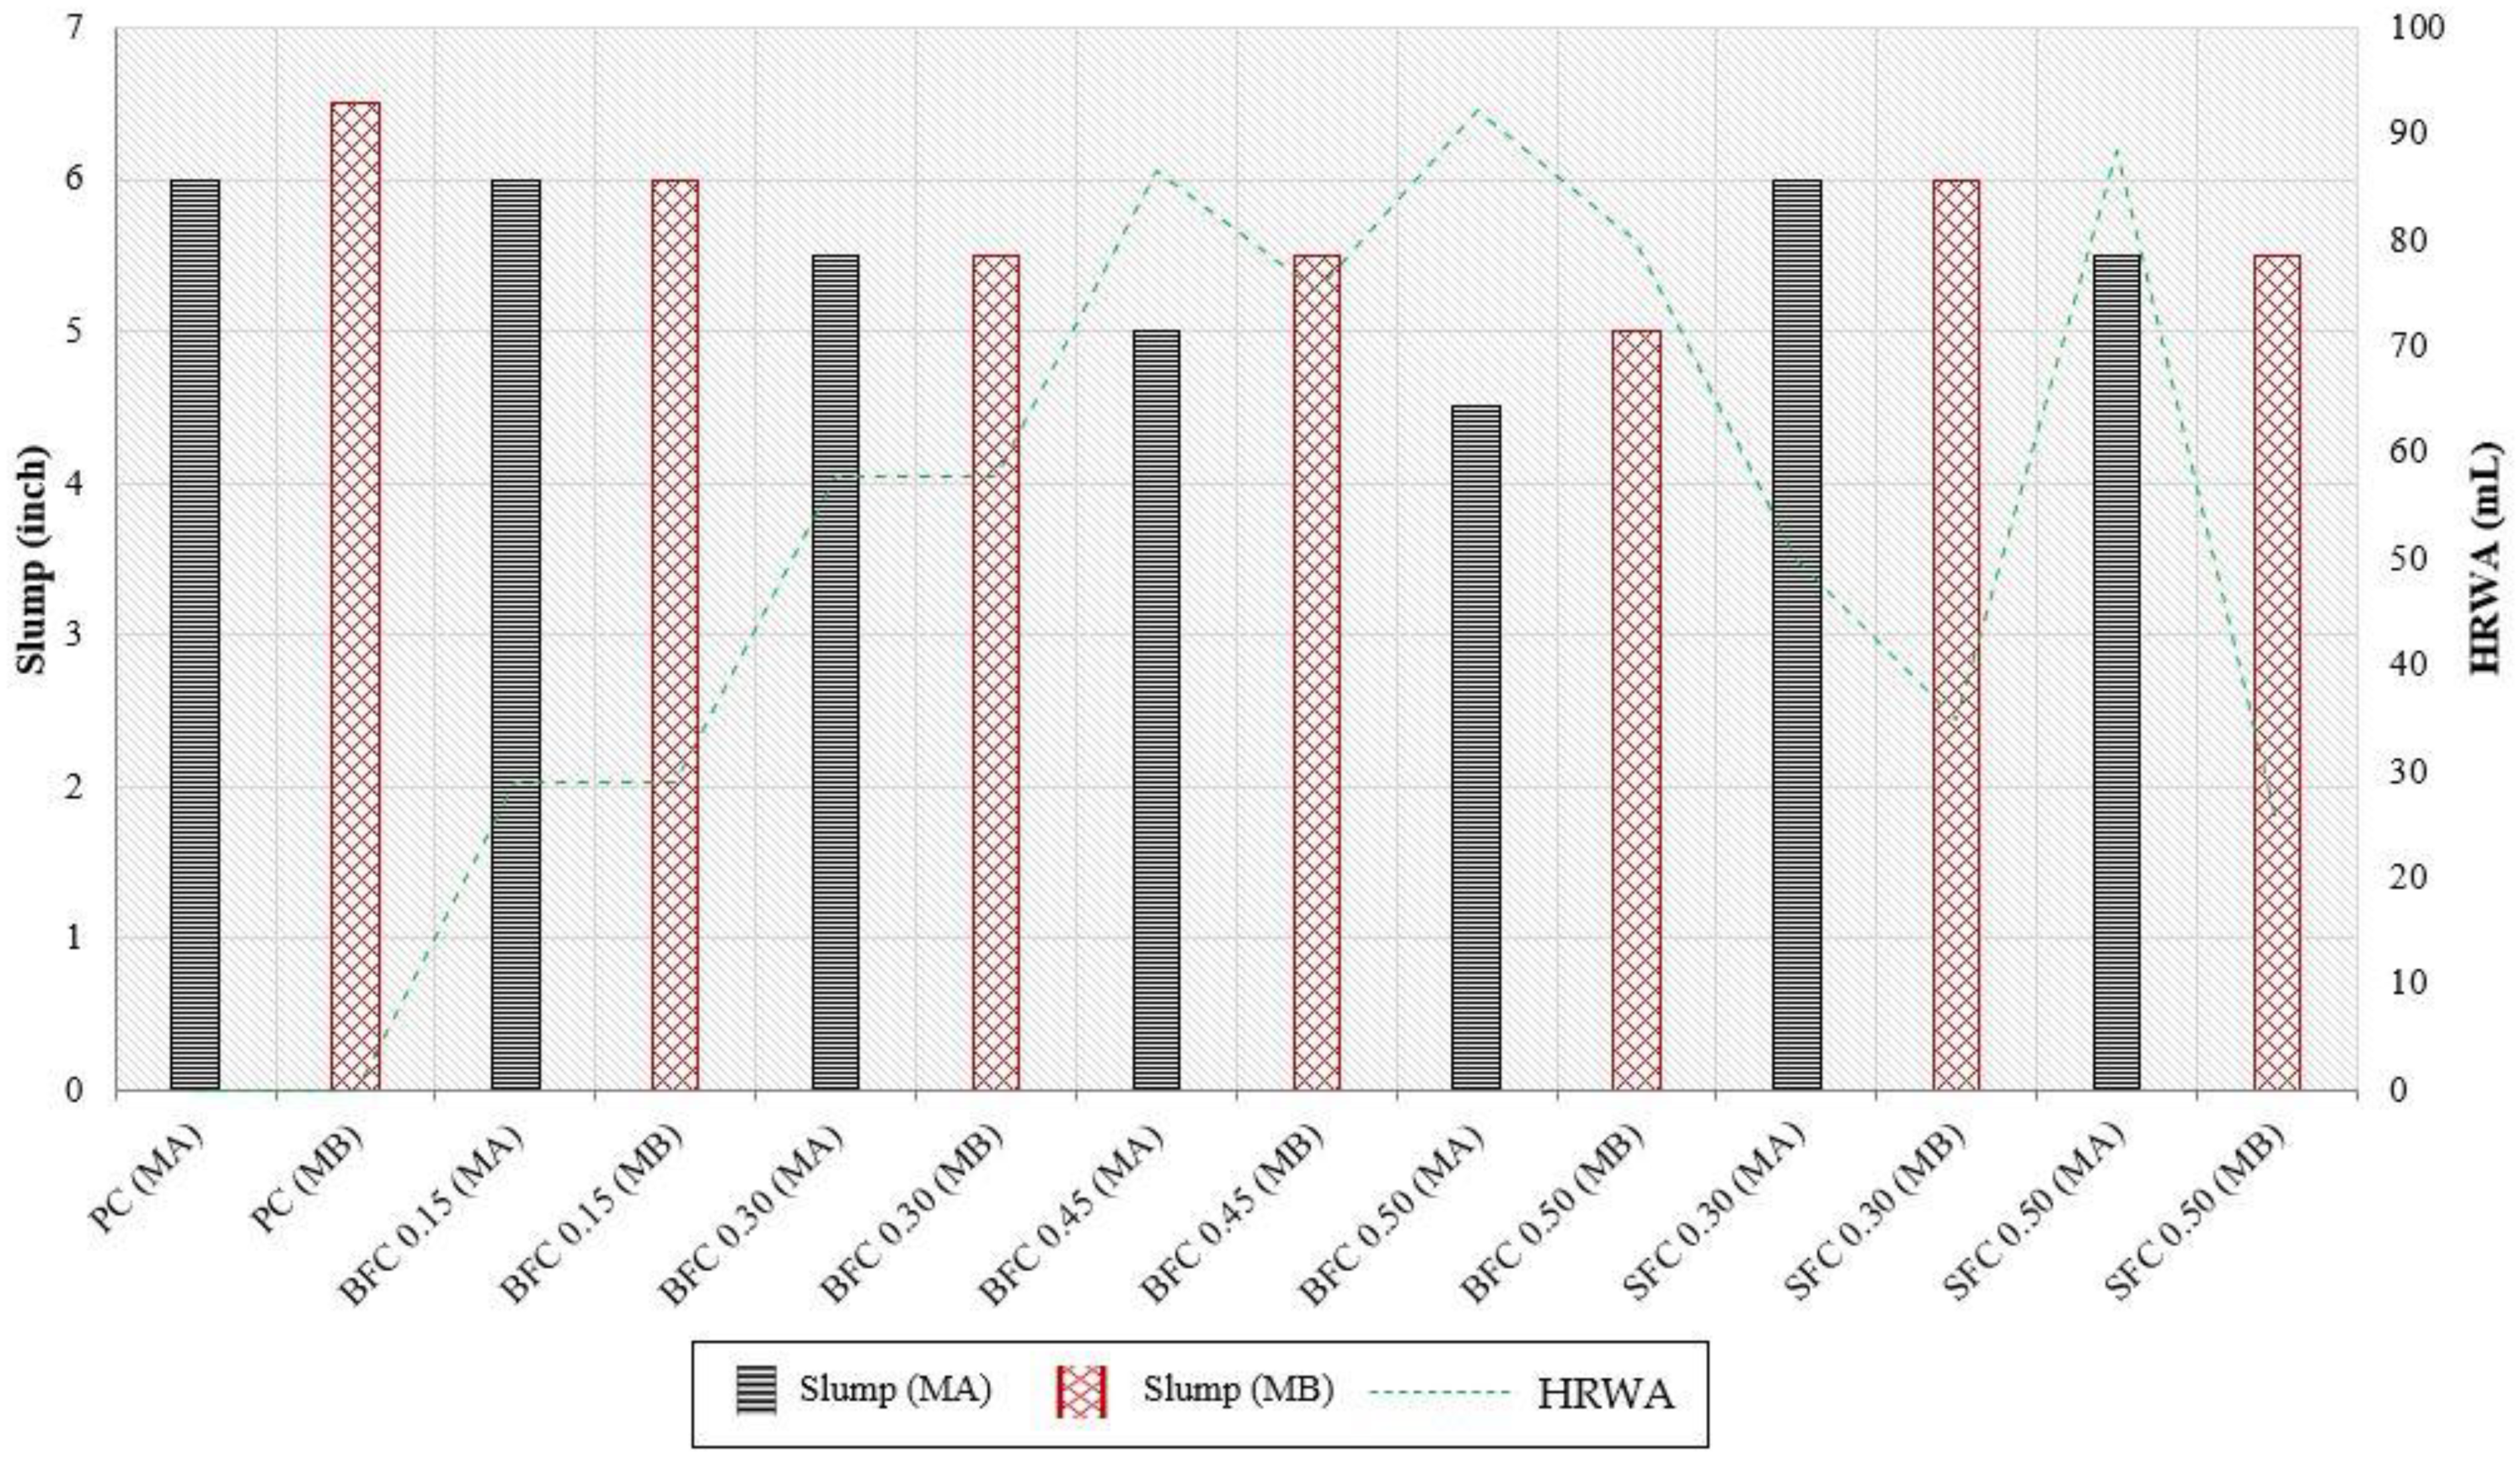
Figure 14.
Unit weight results.
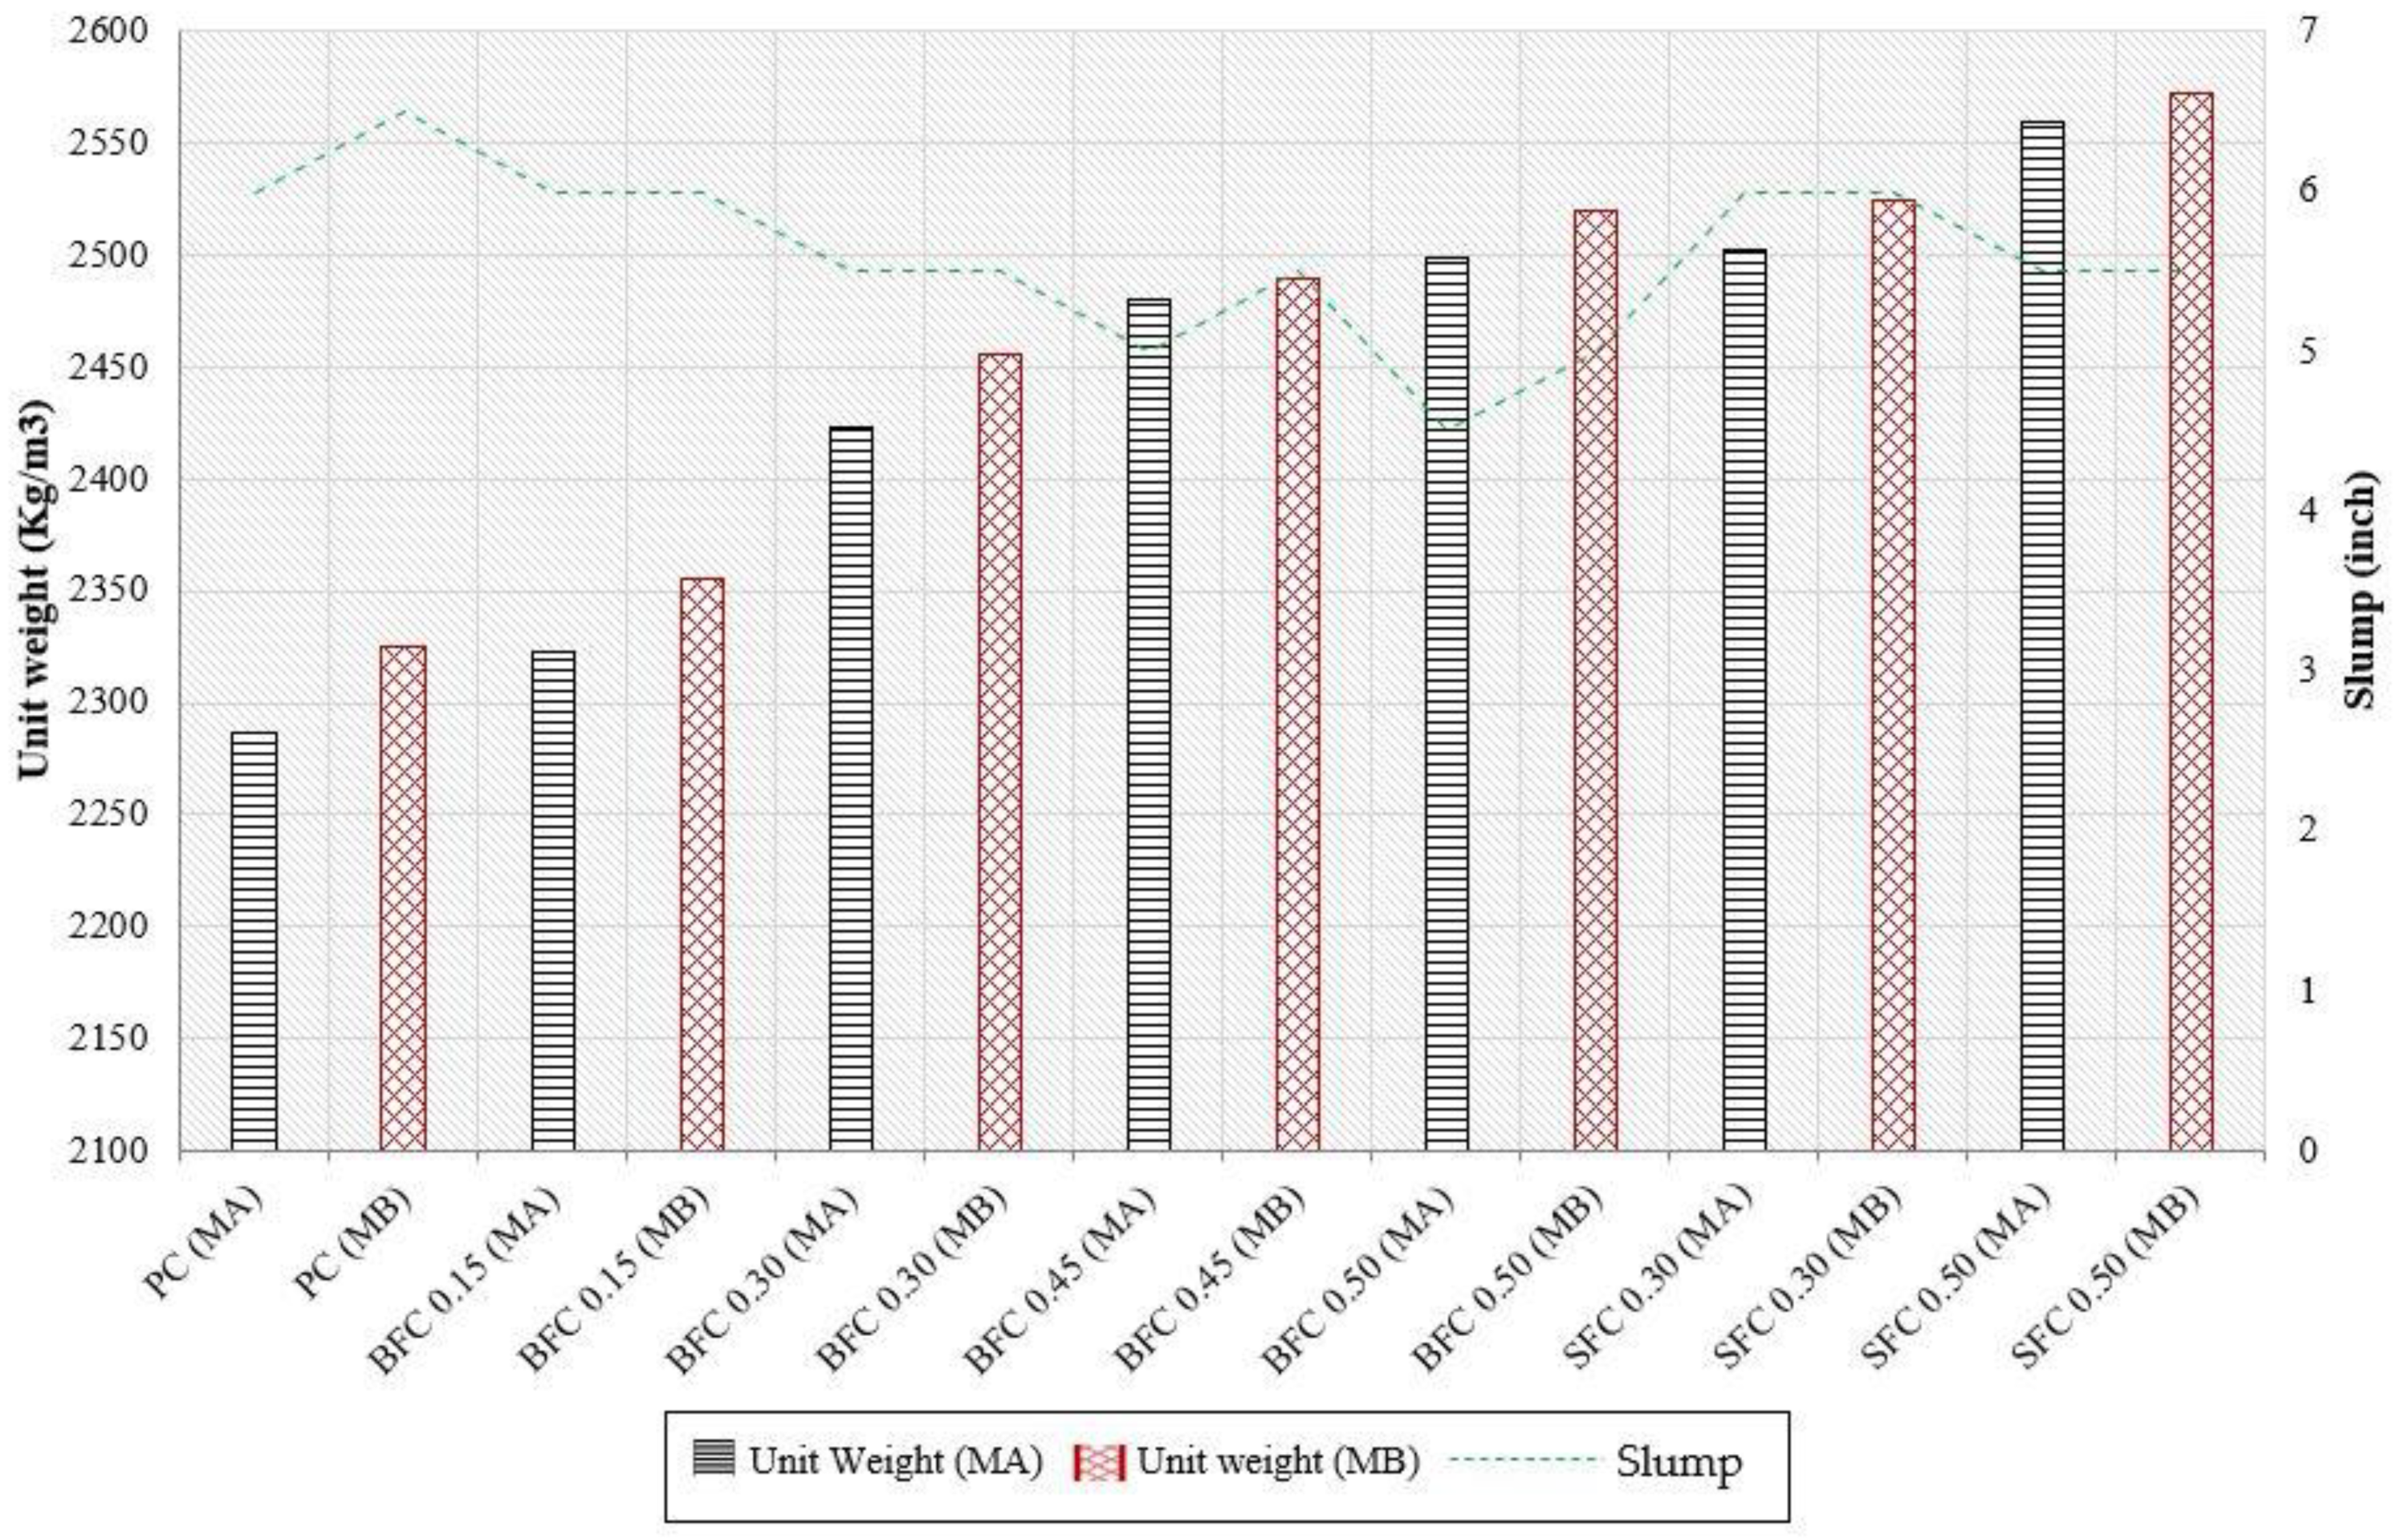
Figure 15.
Compressive strength results at 7, 14, and 28 days.
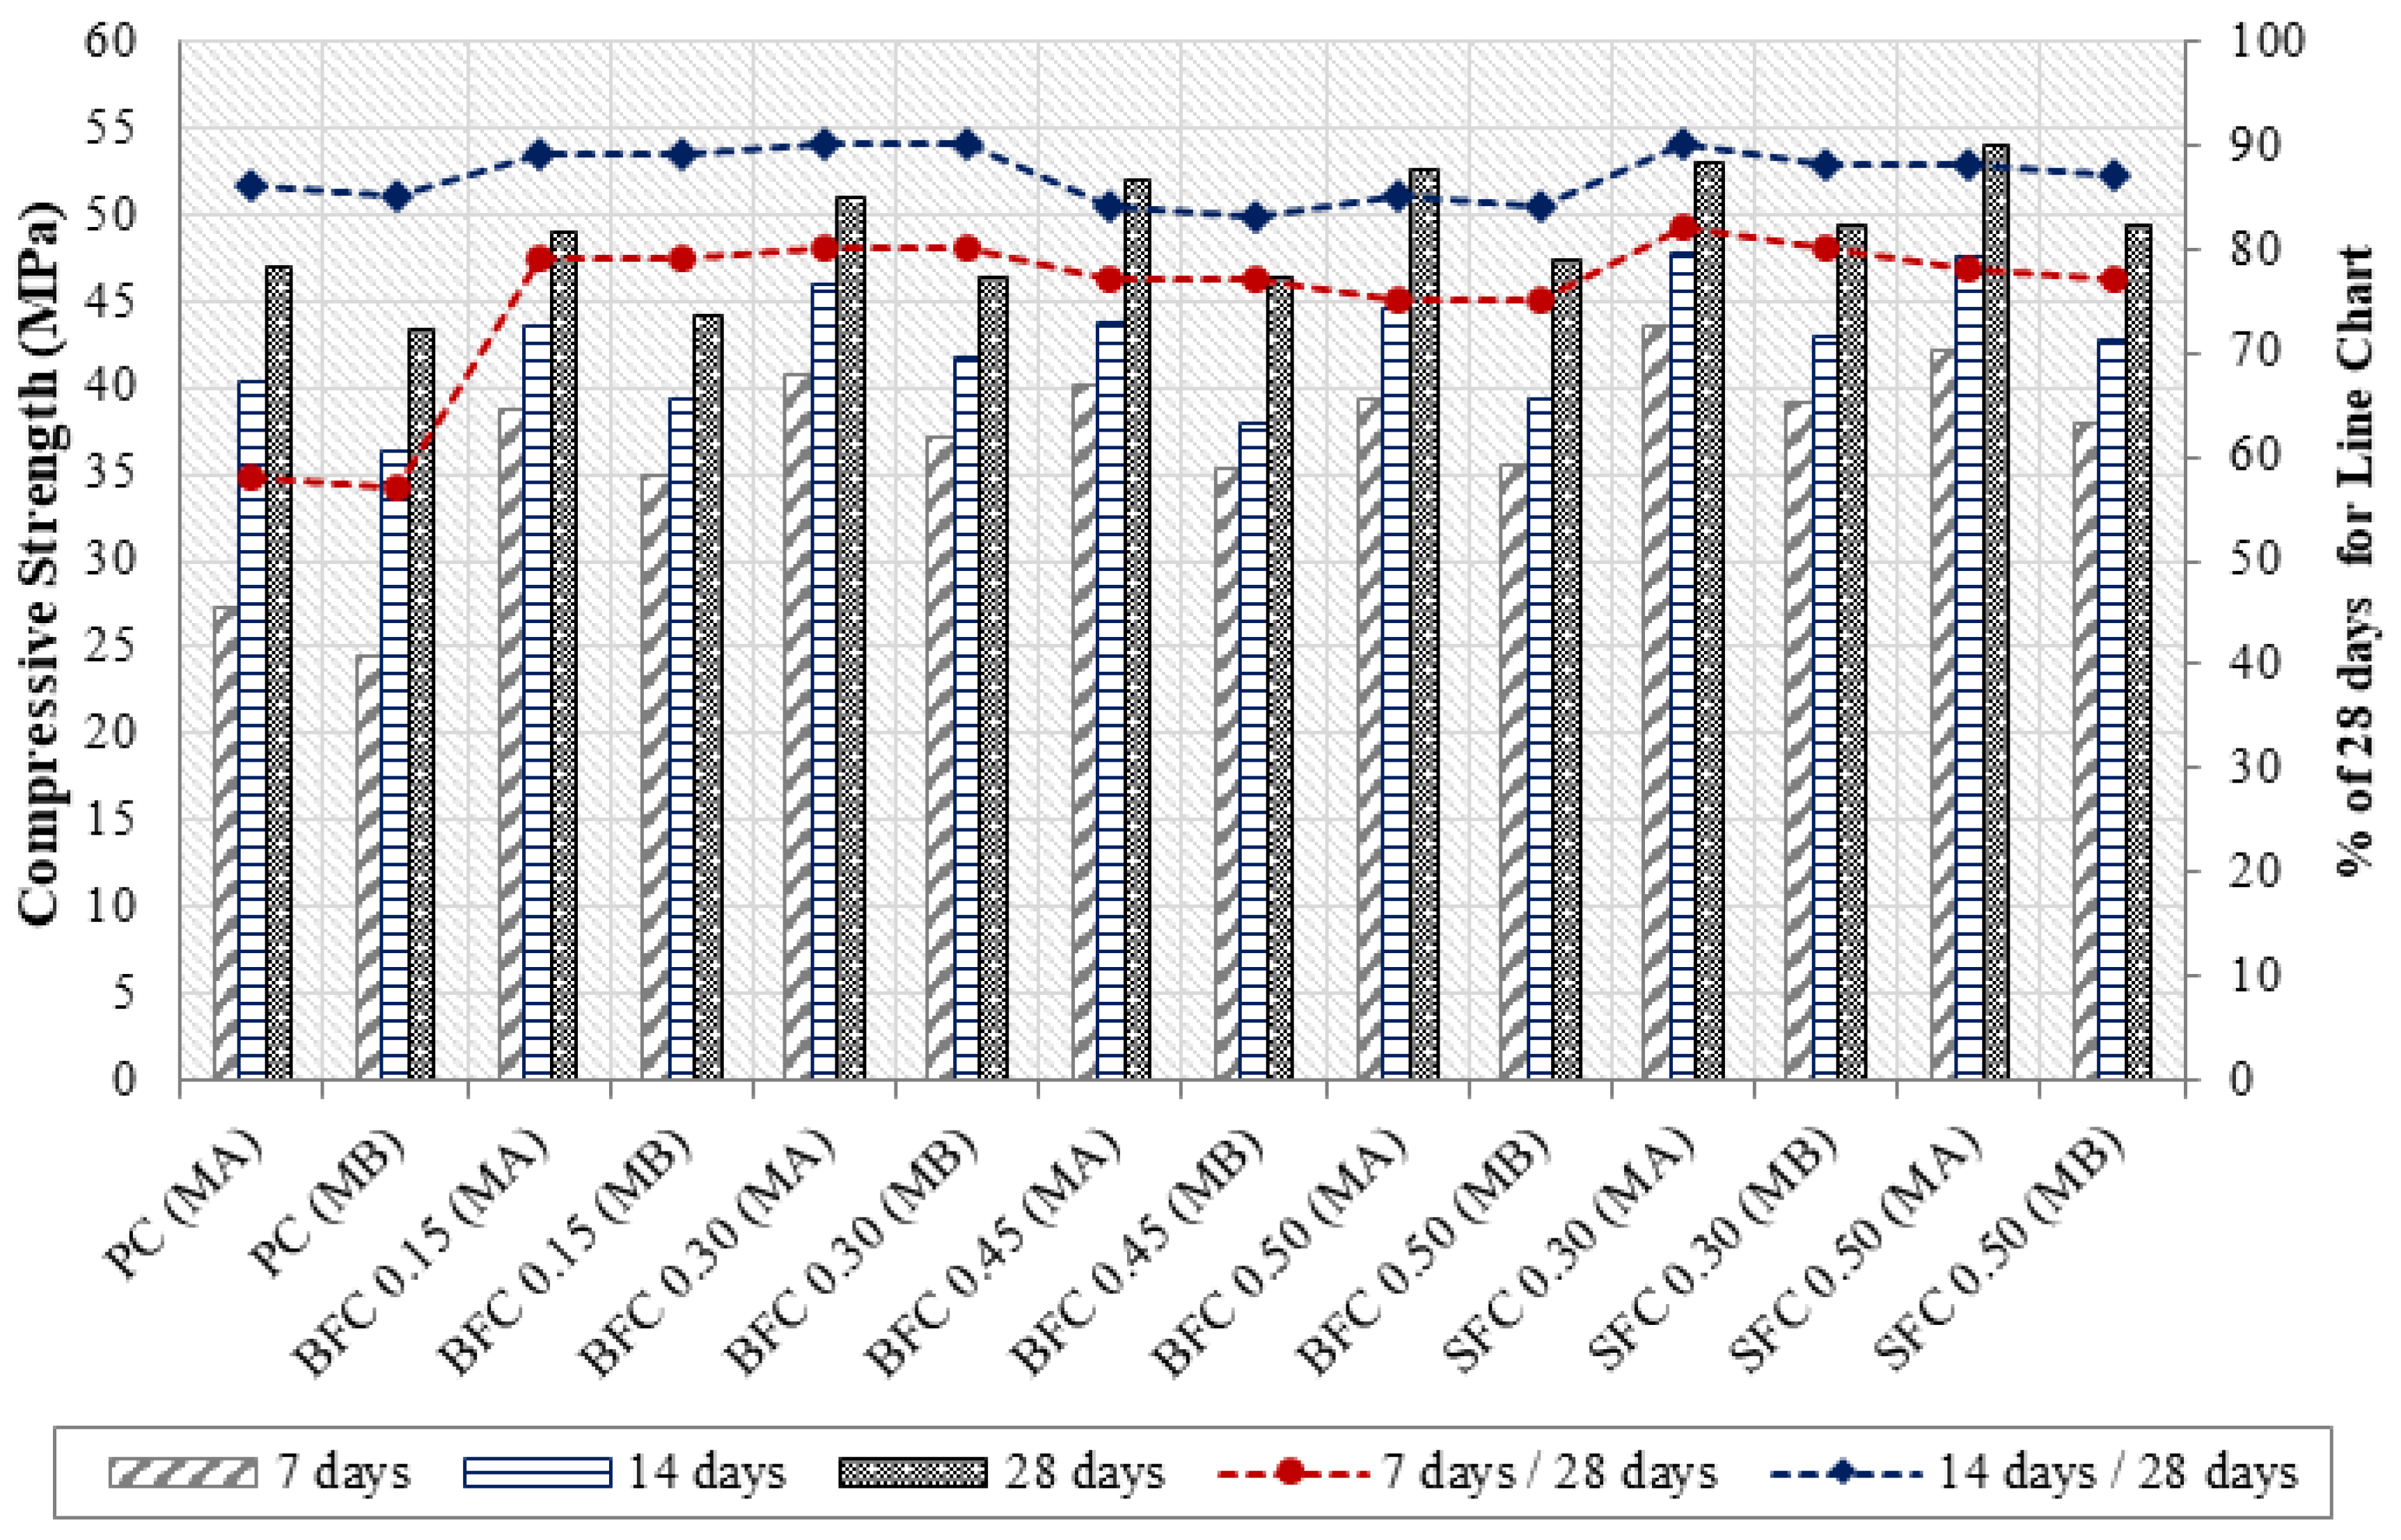
Figure 16.
Compressive strength results normalized to the control mix PC (MA).

Figure 17.
Split tensile strength results normalized to the control mix PC (MA).

Figure 18.
Modulus of rupture results normalized to the control mix PC (MA).
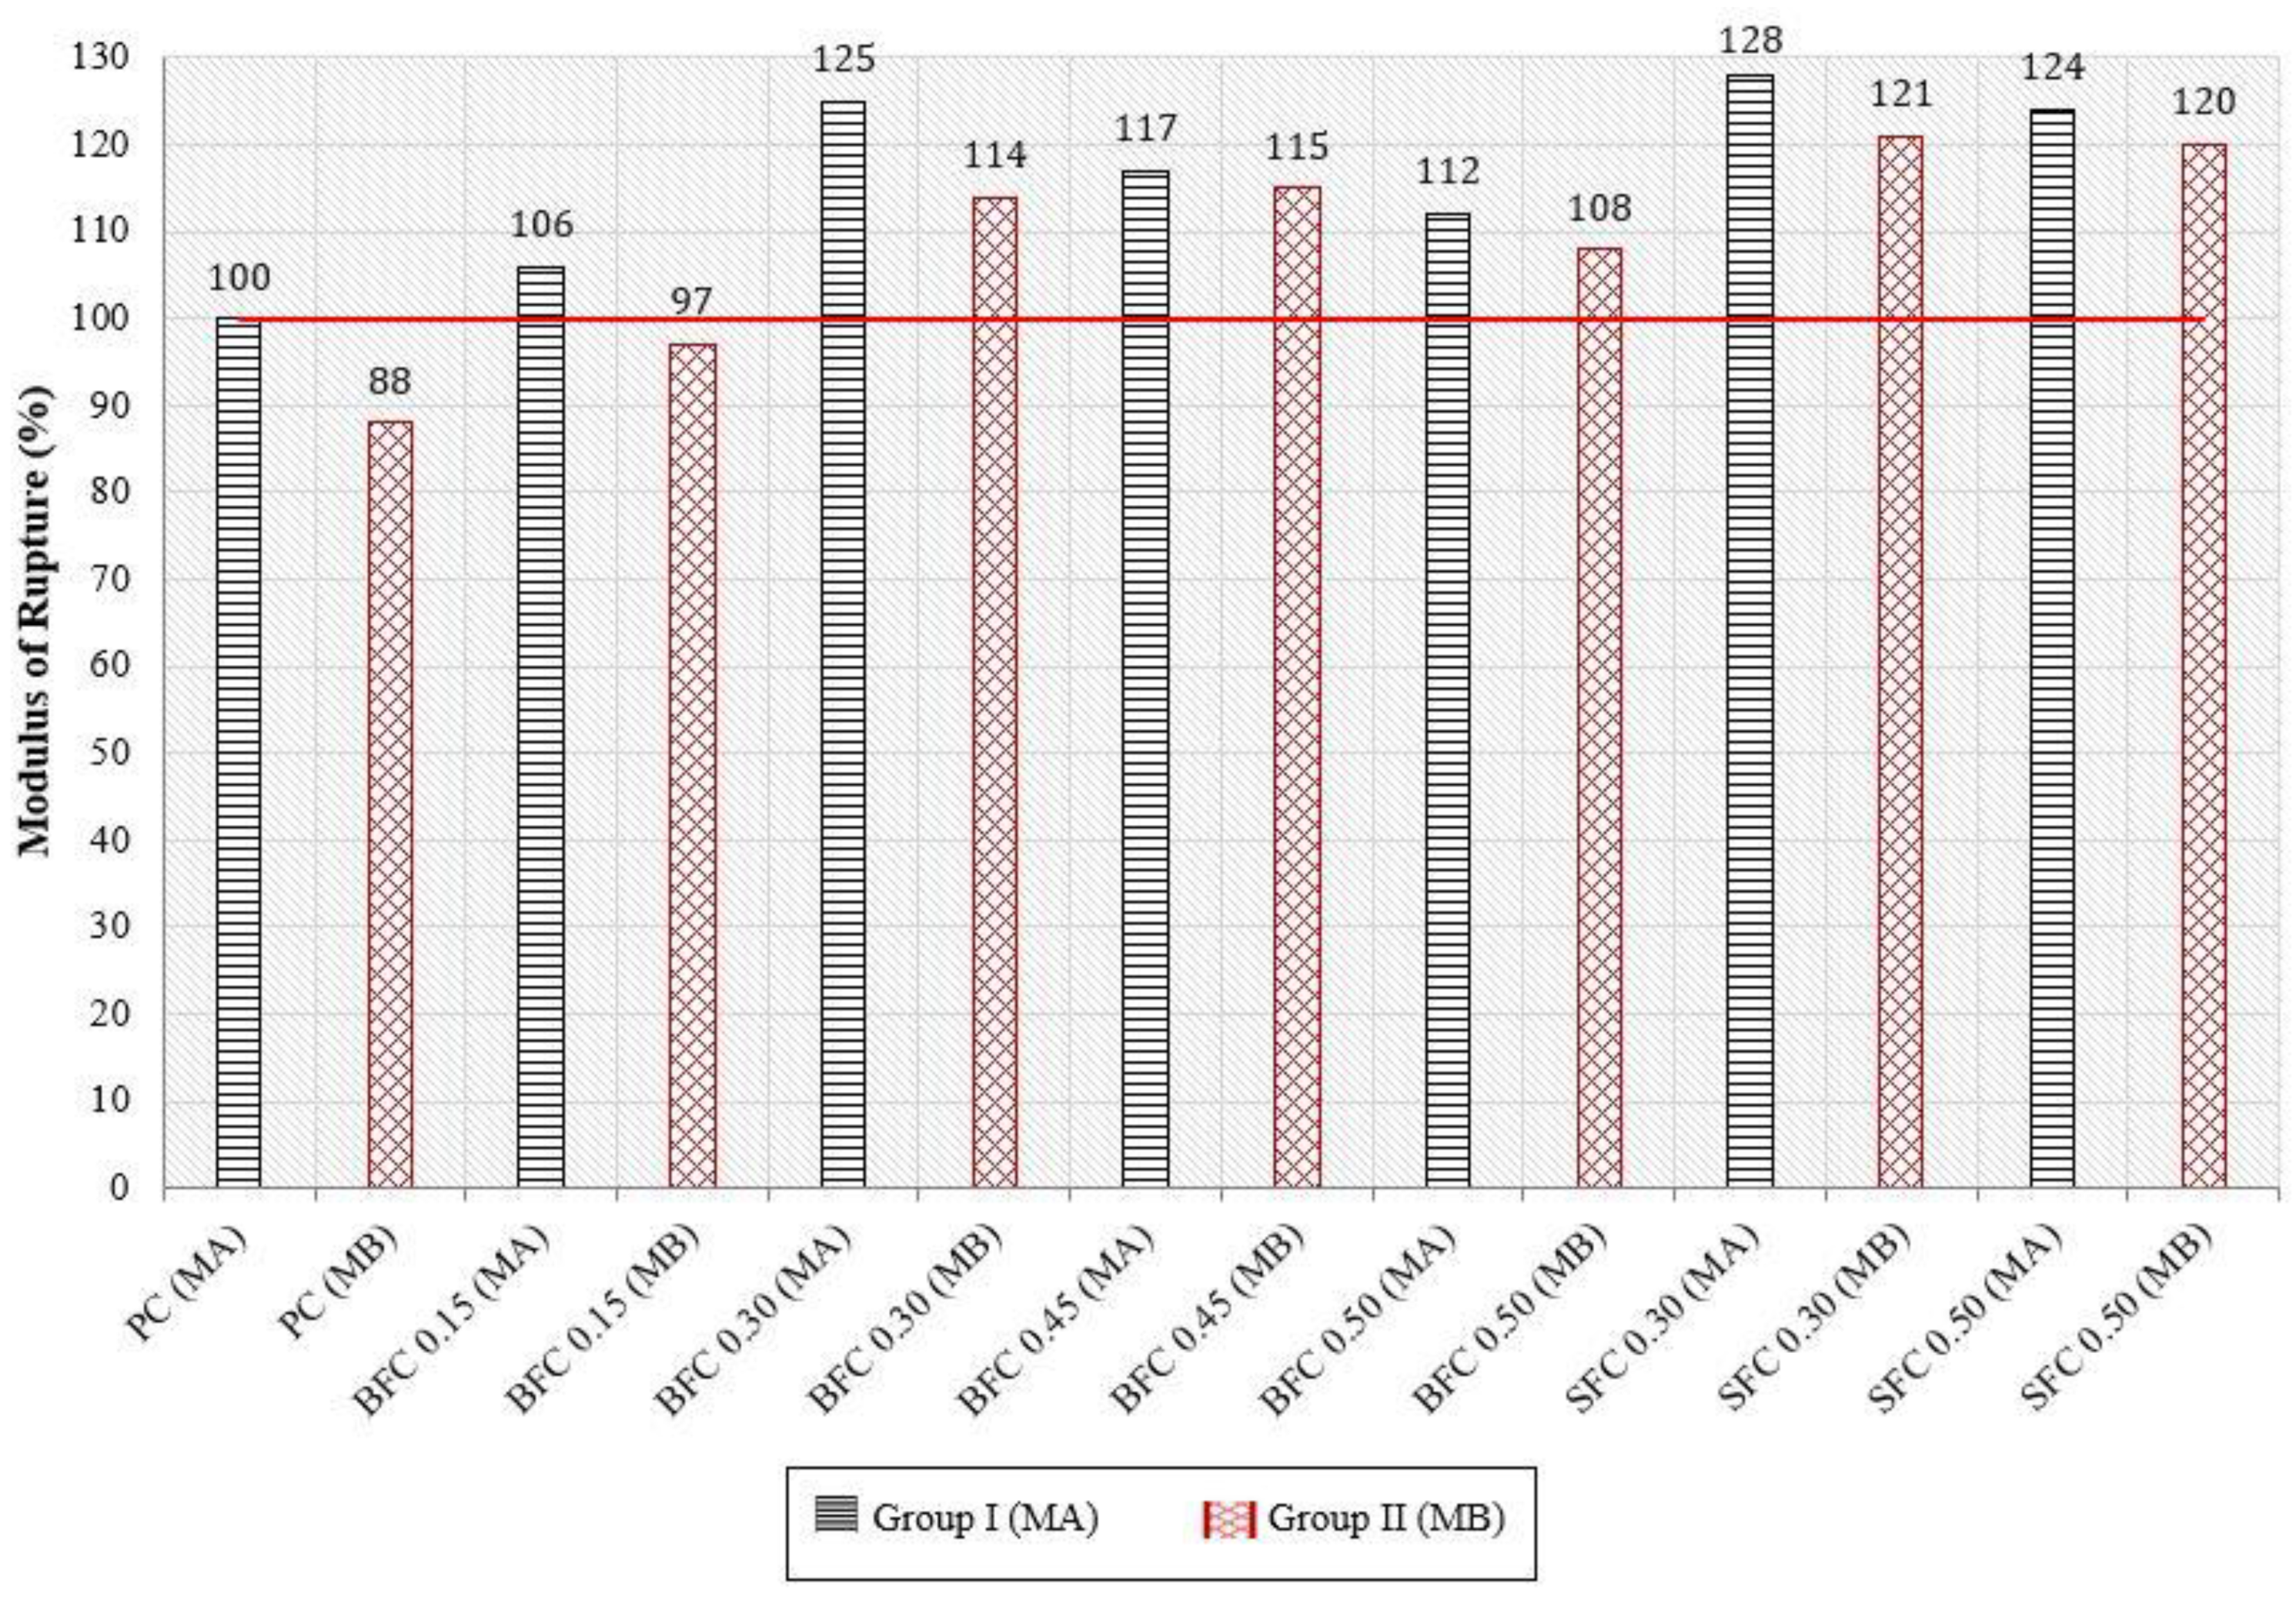
Figure 19.
Average residual strength (ARS) results.

Figure 20.
Initial and reloading load-deflection curves for MA mixtures. (a) Initial Load-Deflection Curves for MA Mixtures. (b) Reloading Load-Deflection Curves for MA Mixtures.
Figure 20.
Initial and reloading load-deflection curves for MA mixtures. (a) Initial Load-Deflection Curves for MA Mixtures. (b) Reloading Load-Deflection Curves for MA Mixtures.
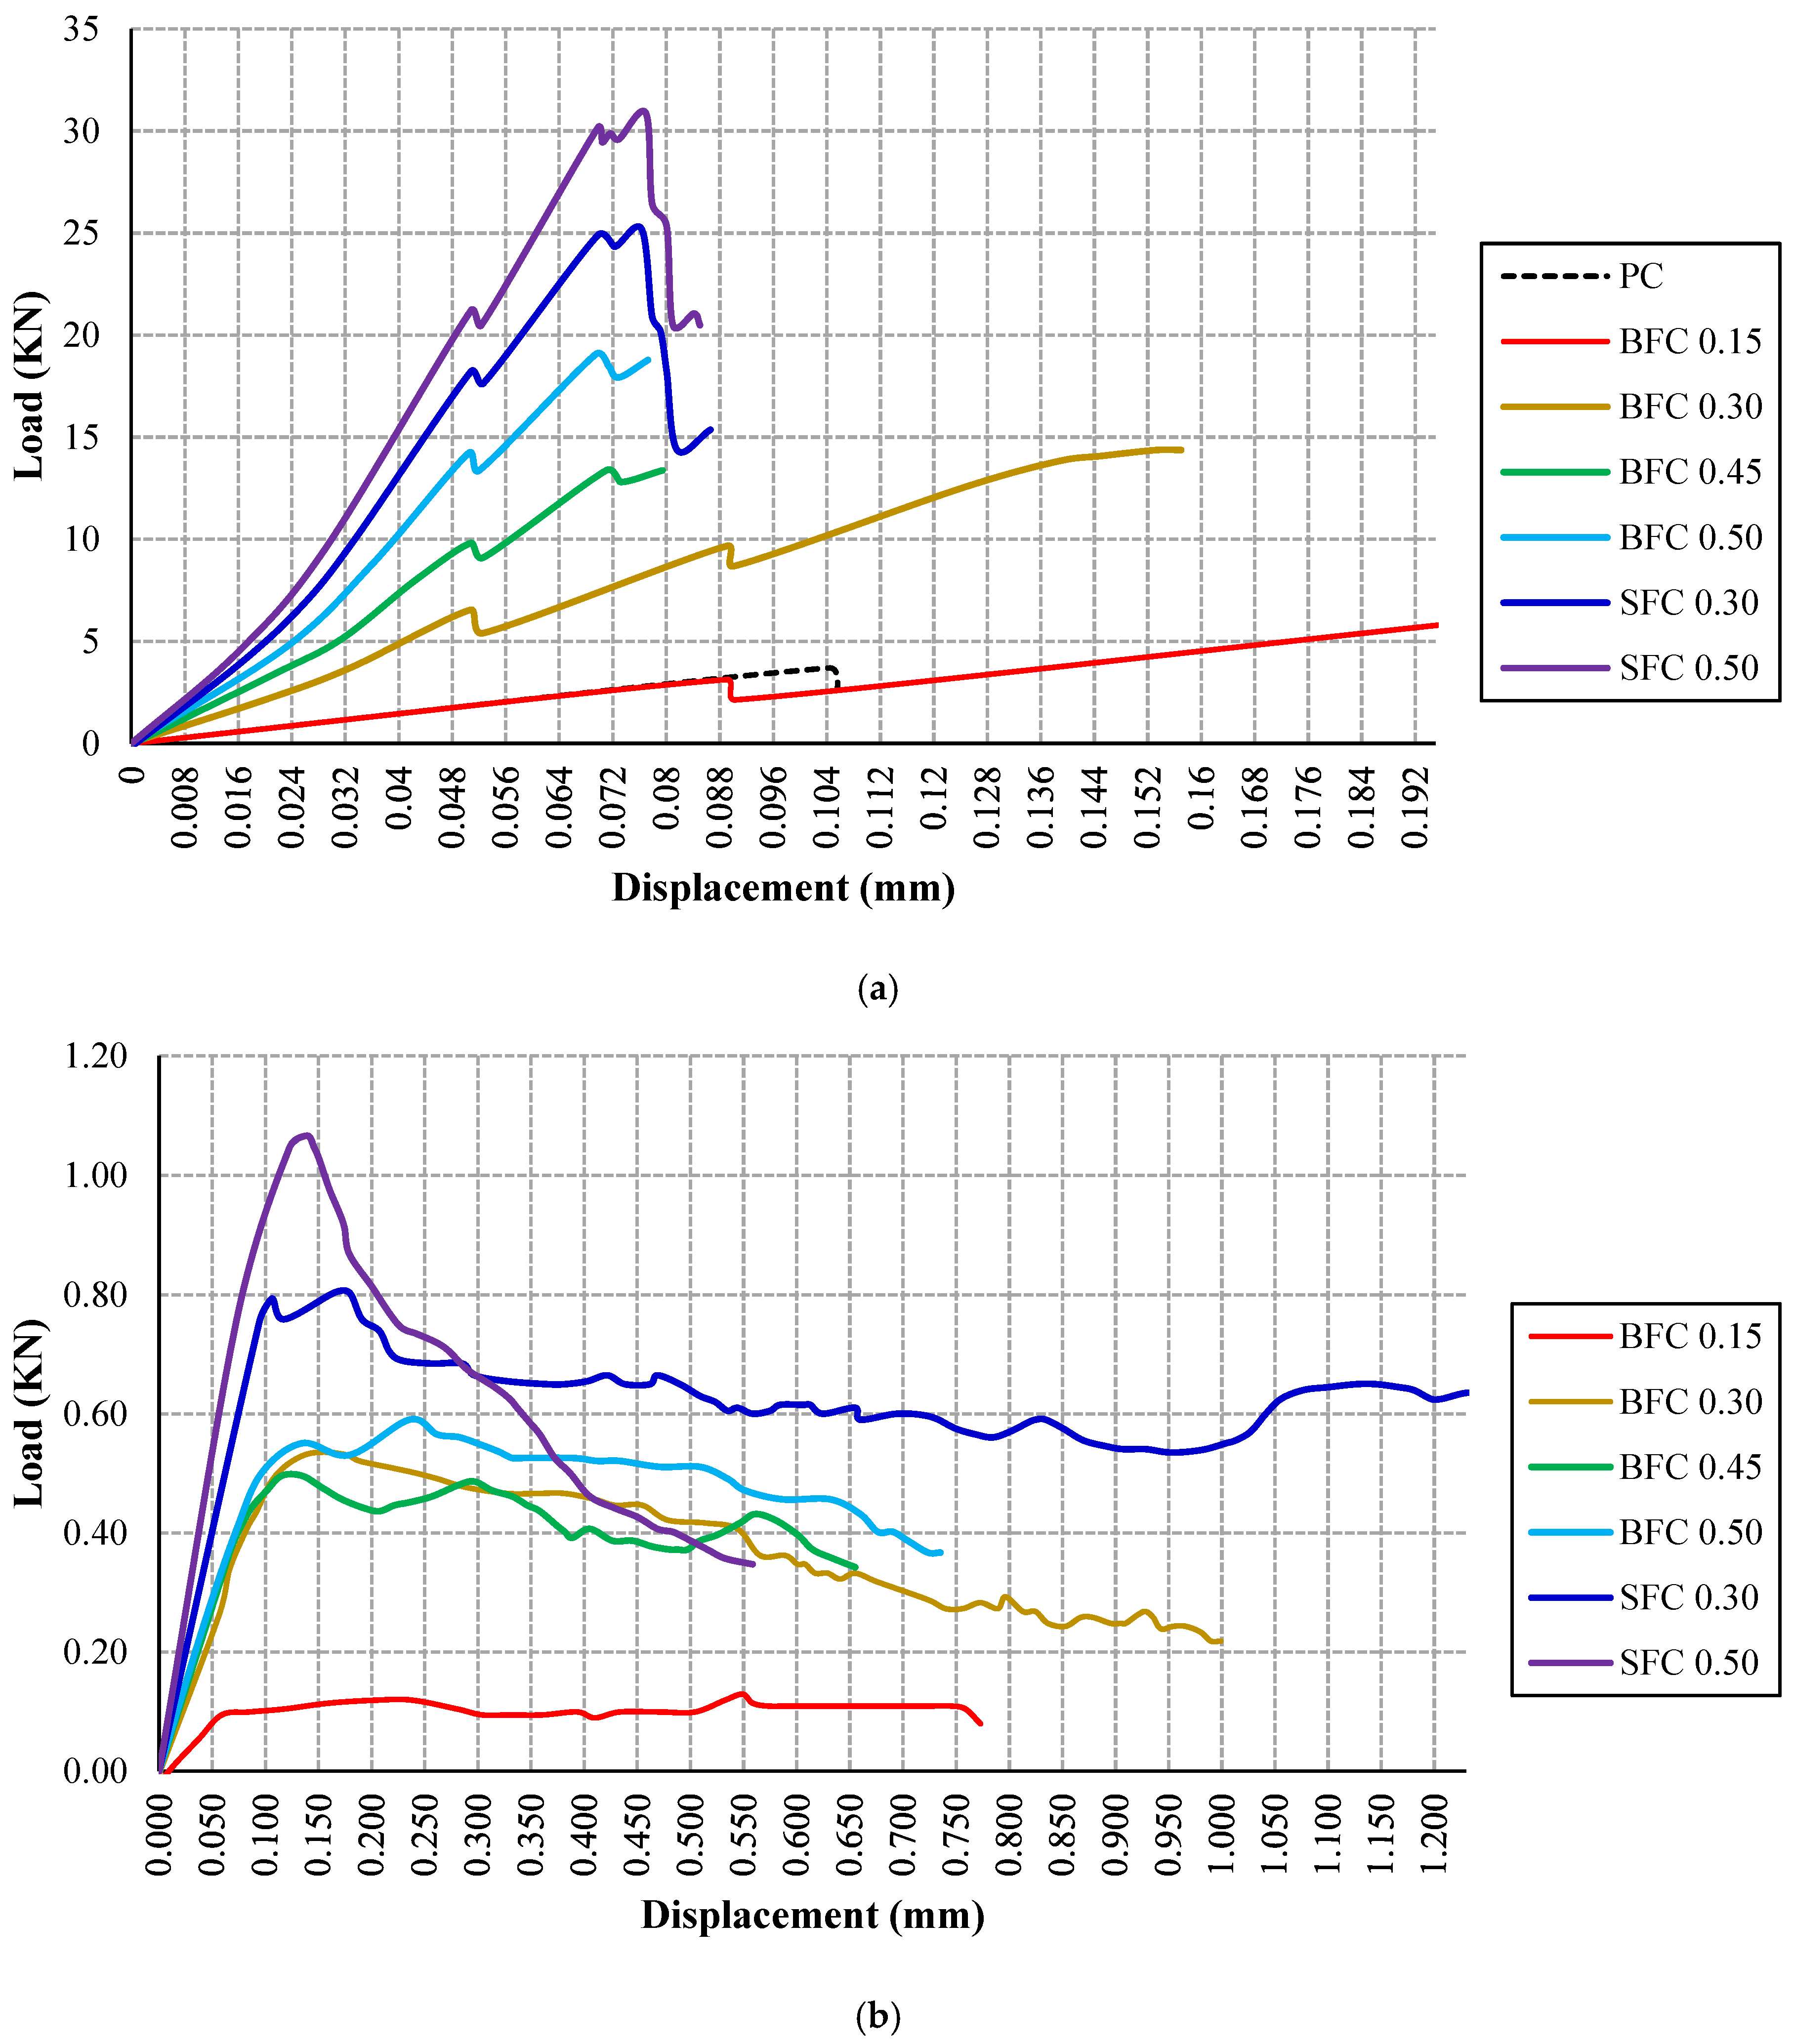
Figure 21.
Initial and reloading load-deflection curves for MA mixtures. (a) Initial Load-Deflection Curves for MA Mixtures. (b) Reloading Load-Deflection Curves for MA Mixtures.
Figure 21.
Initial and reloading load-deflection curves for MA mixtures. (a) Initial Load-Deflection Curves for MA Mixtures. (b) Reloading Load-Deflection Curves for MA Mixtures.
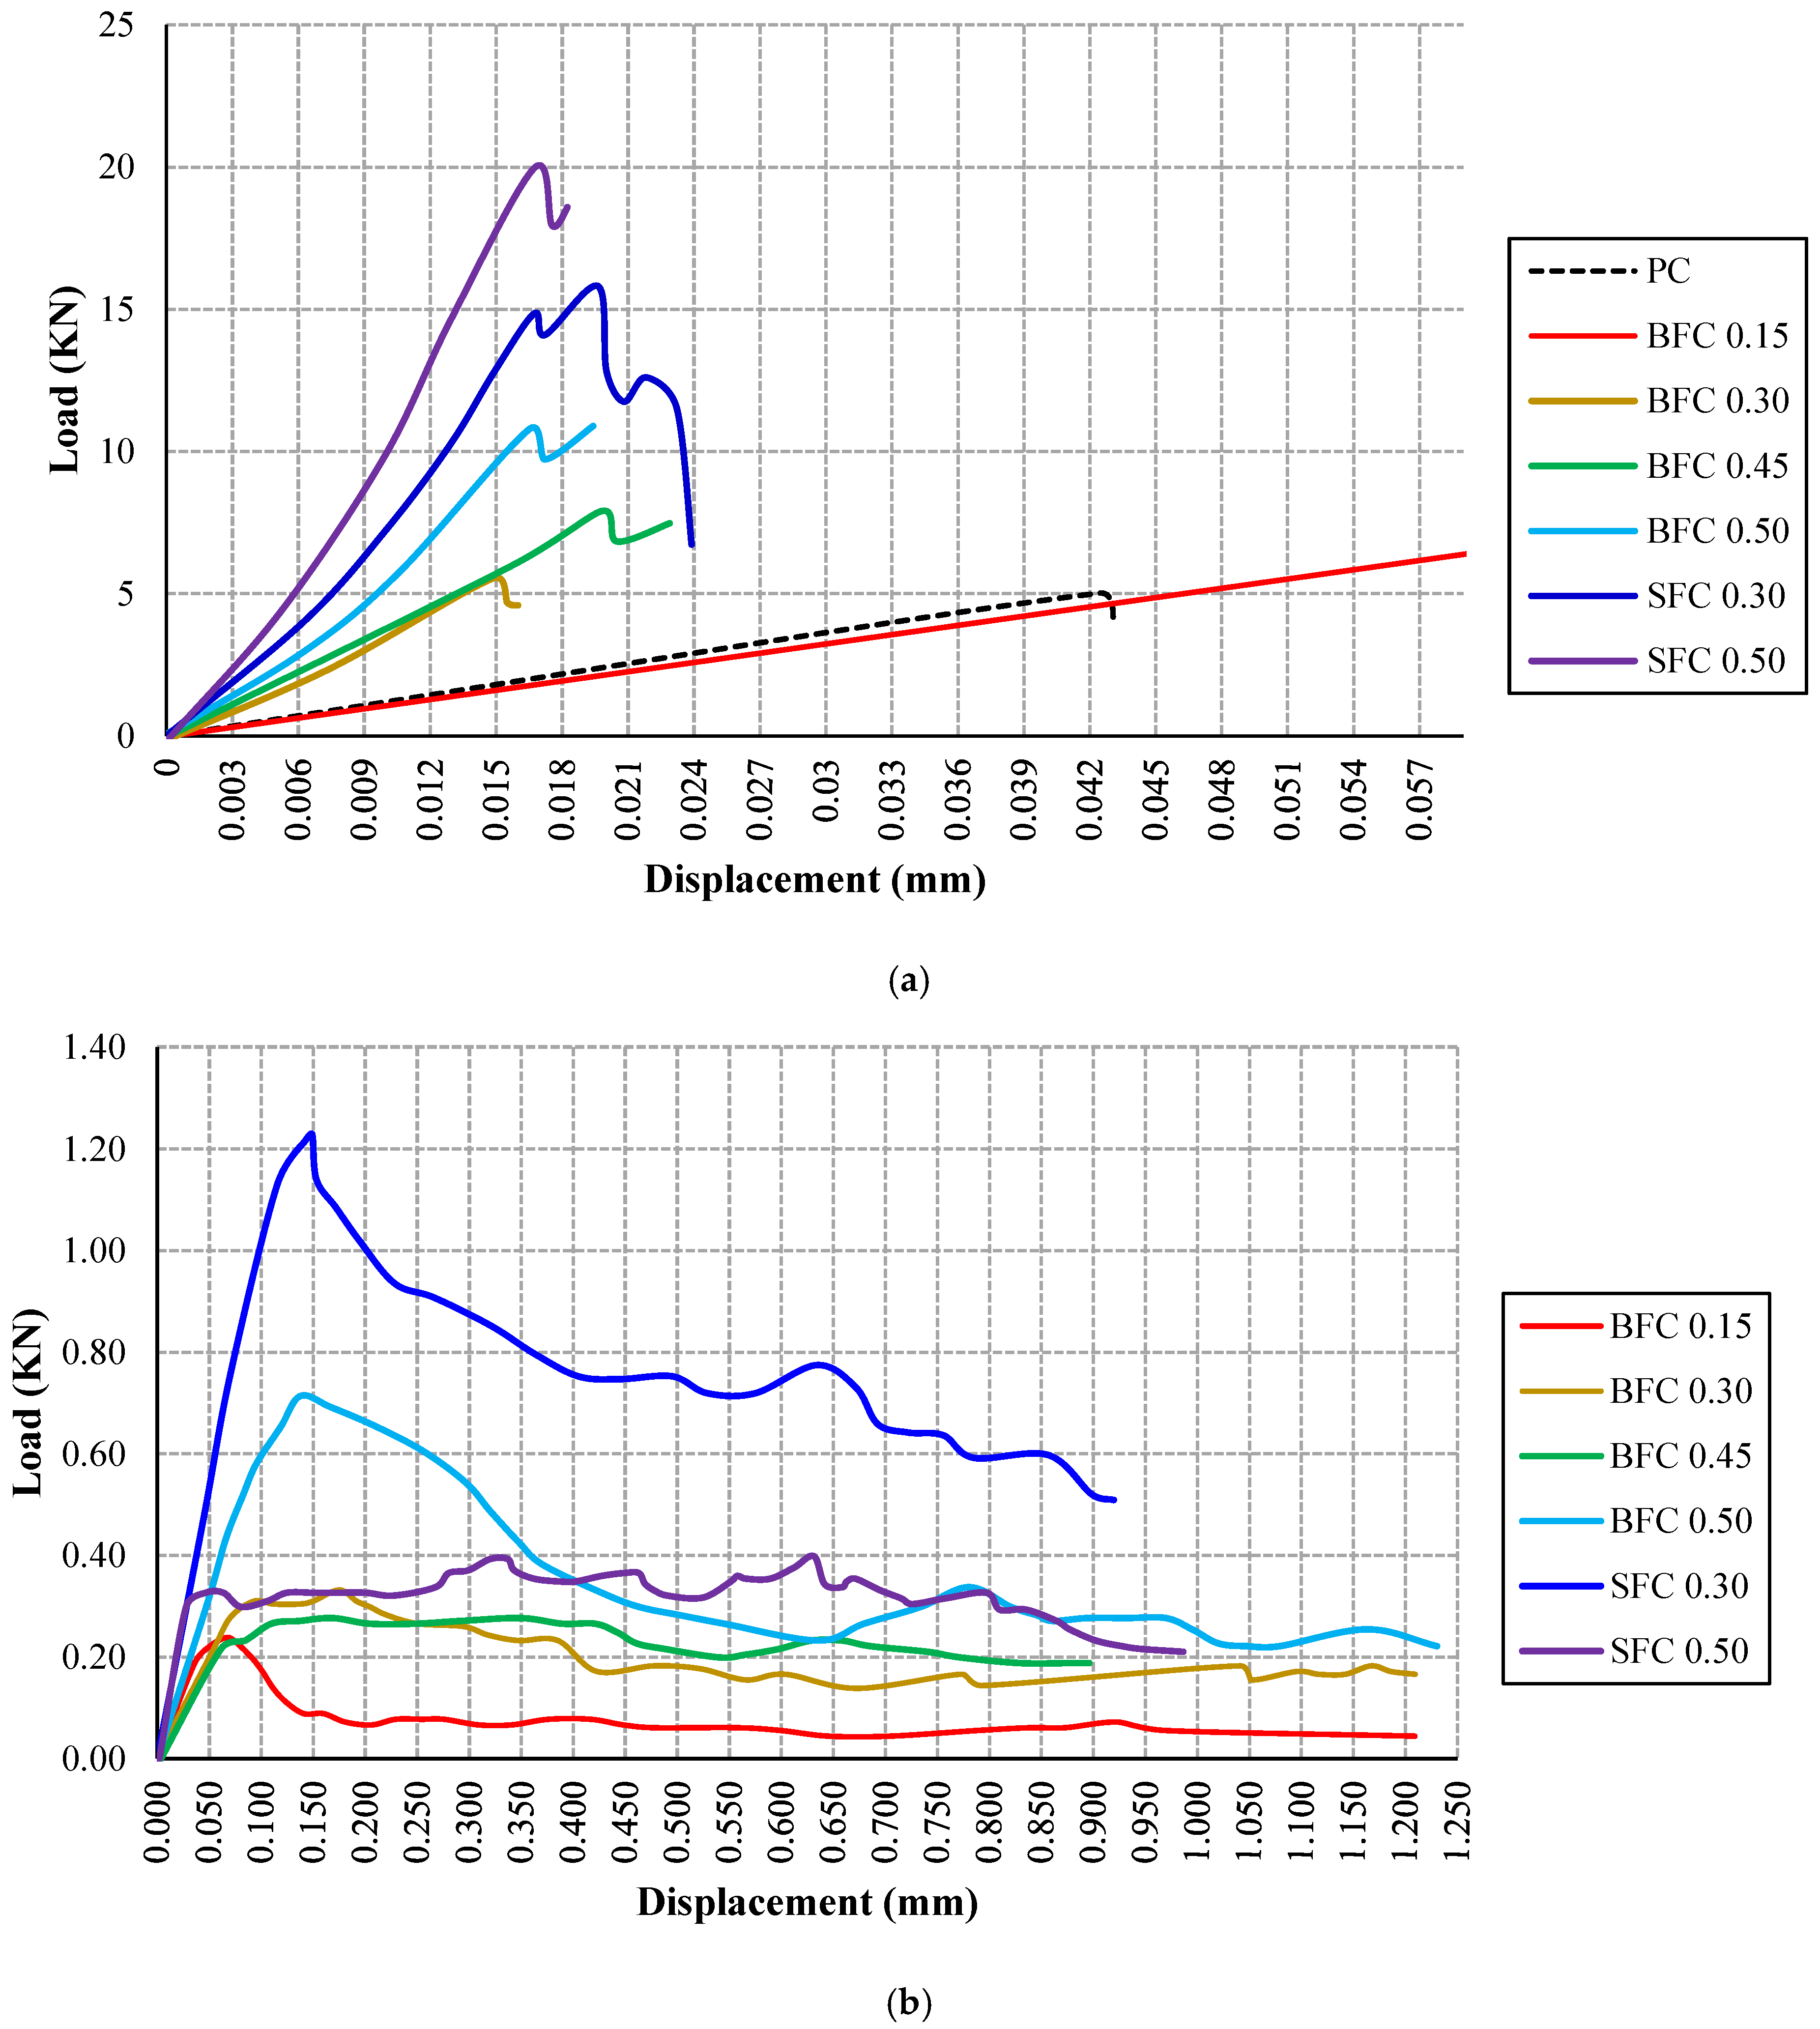
Figure 22.
Unrestrained shrinkage results.

Figure 23.
Surface resistivity results.
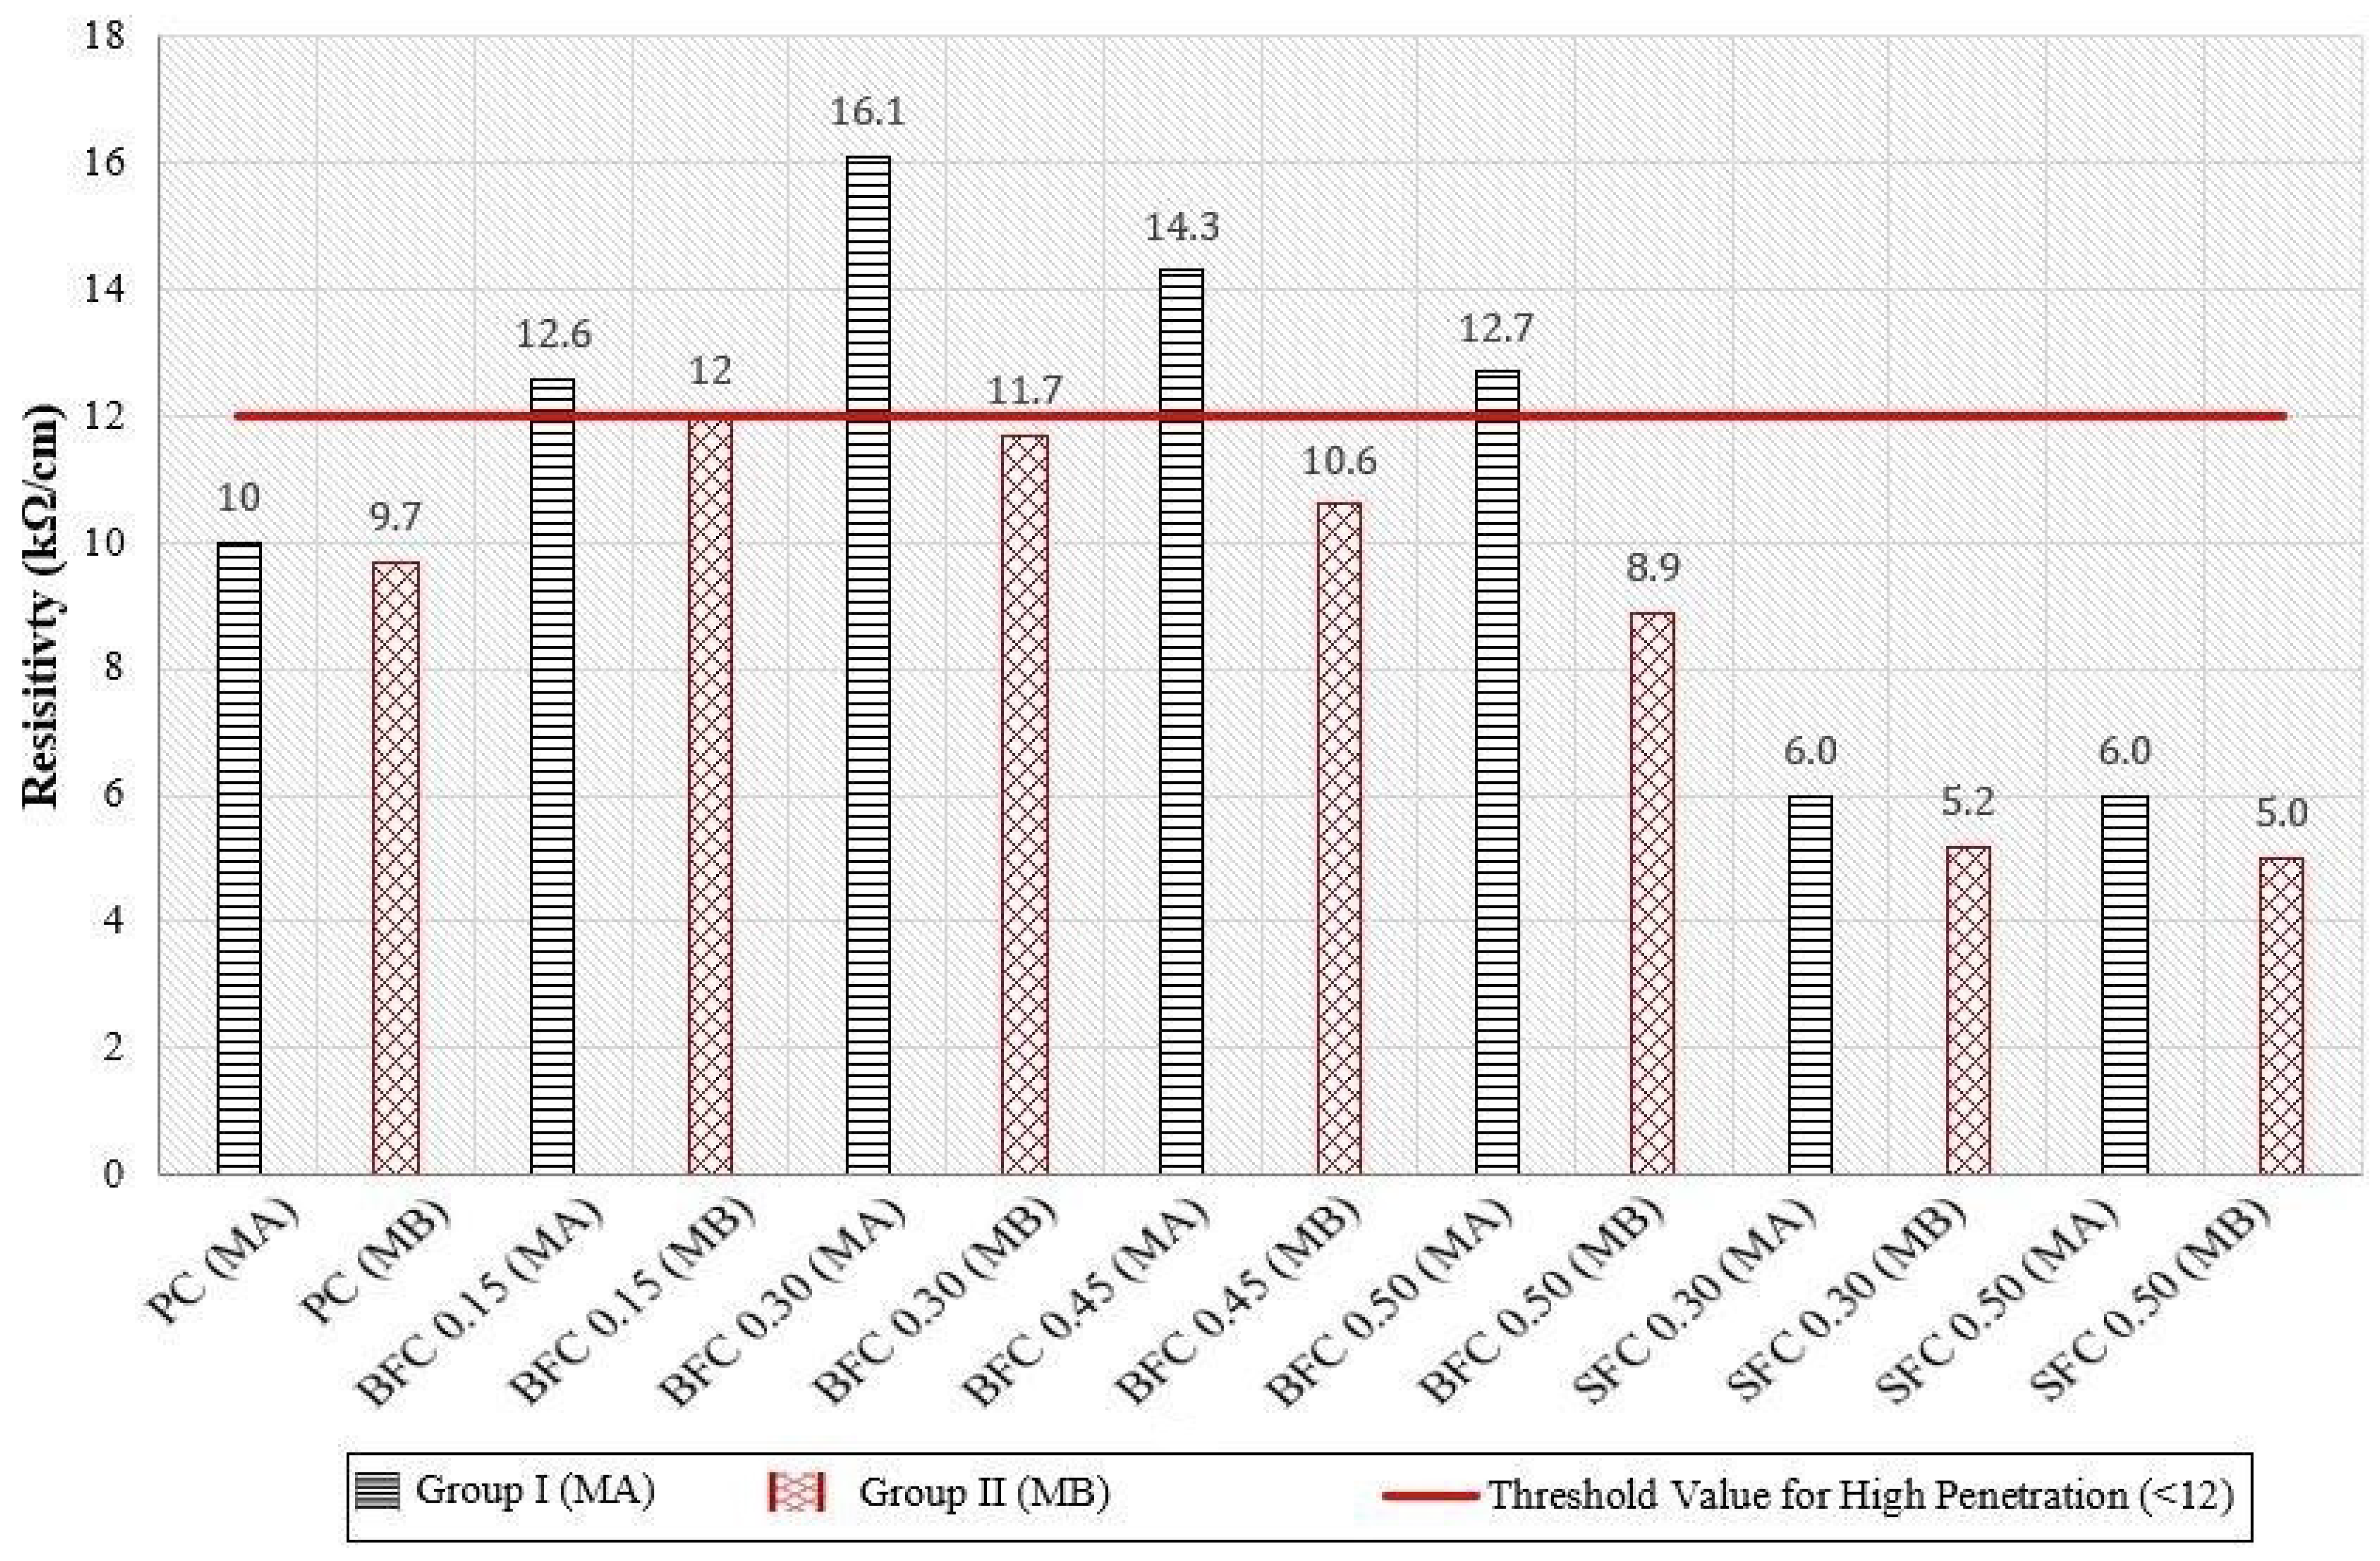
Figure 24.
Corrosion rate (μm/year) results.
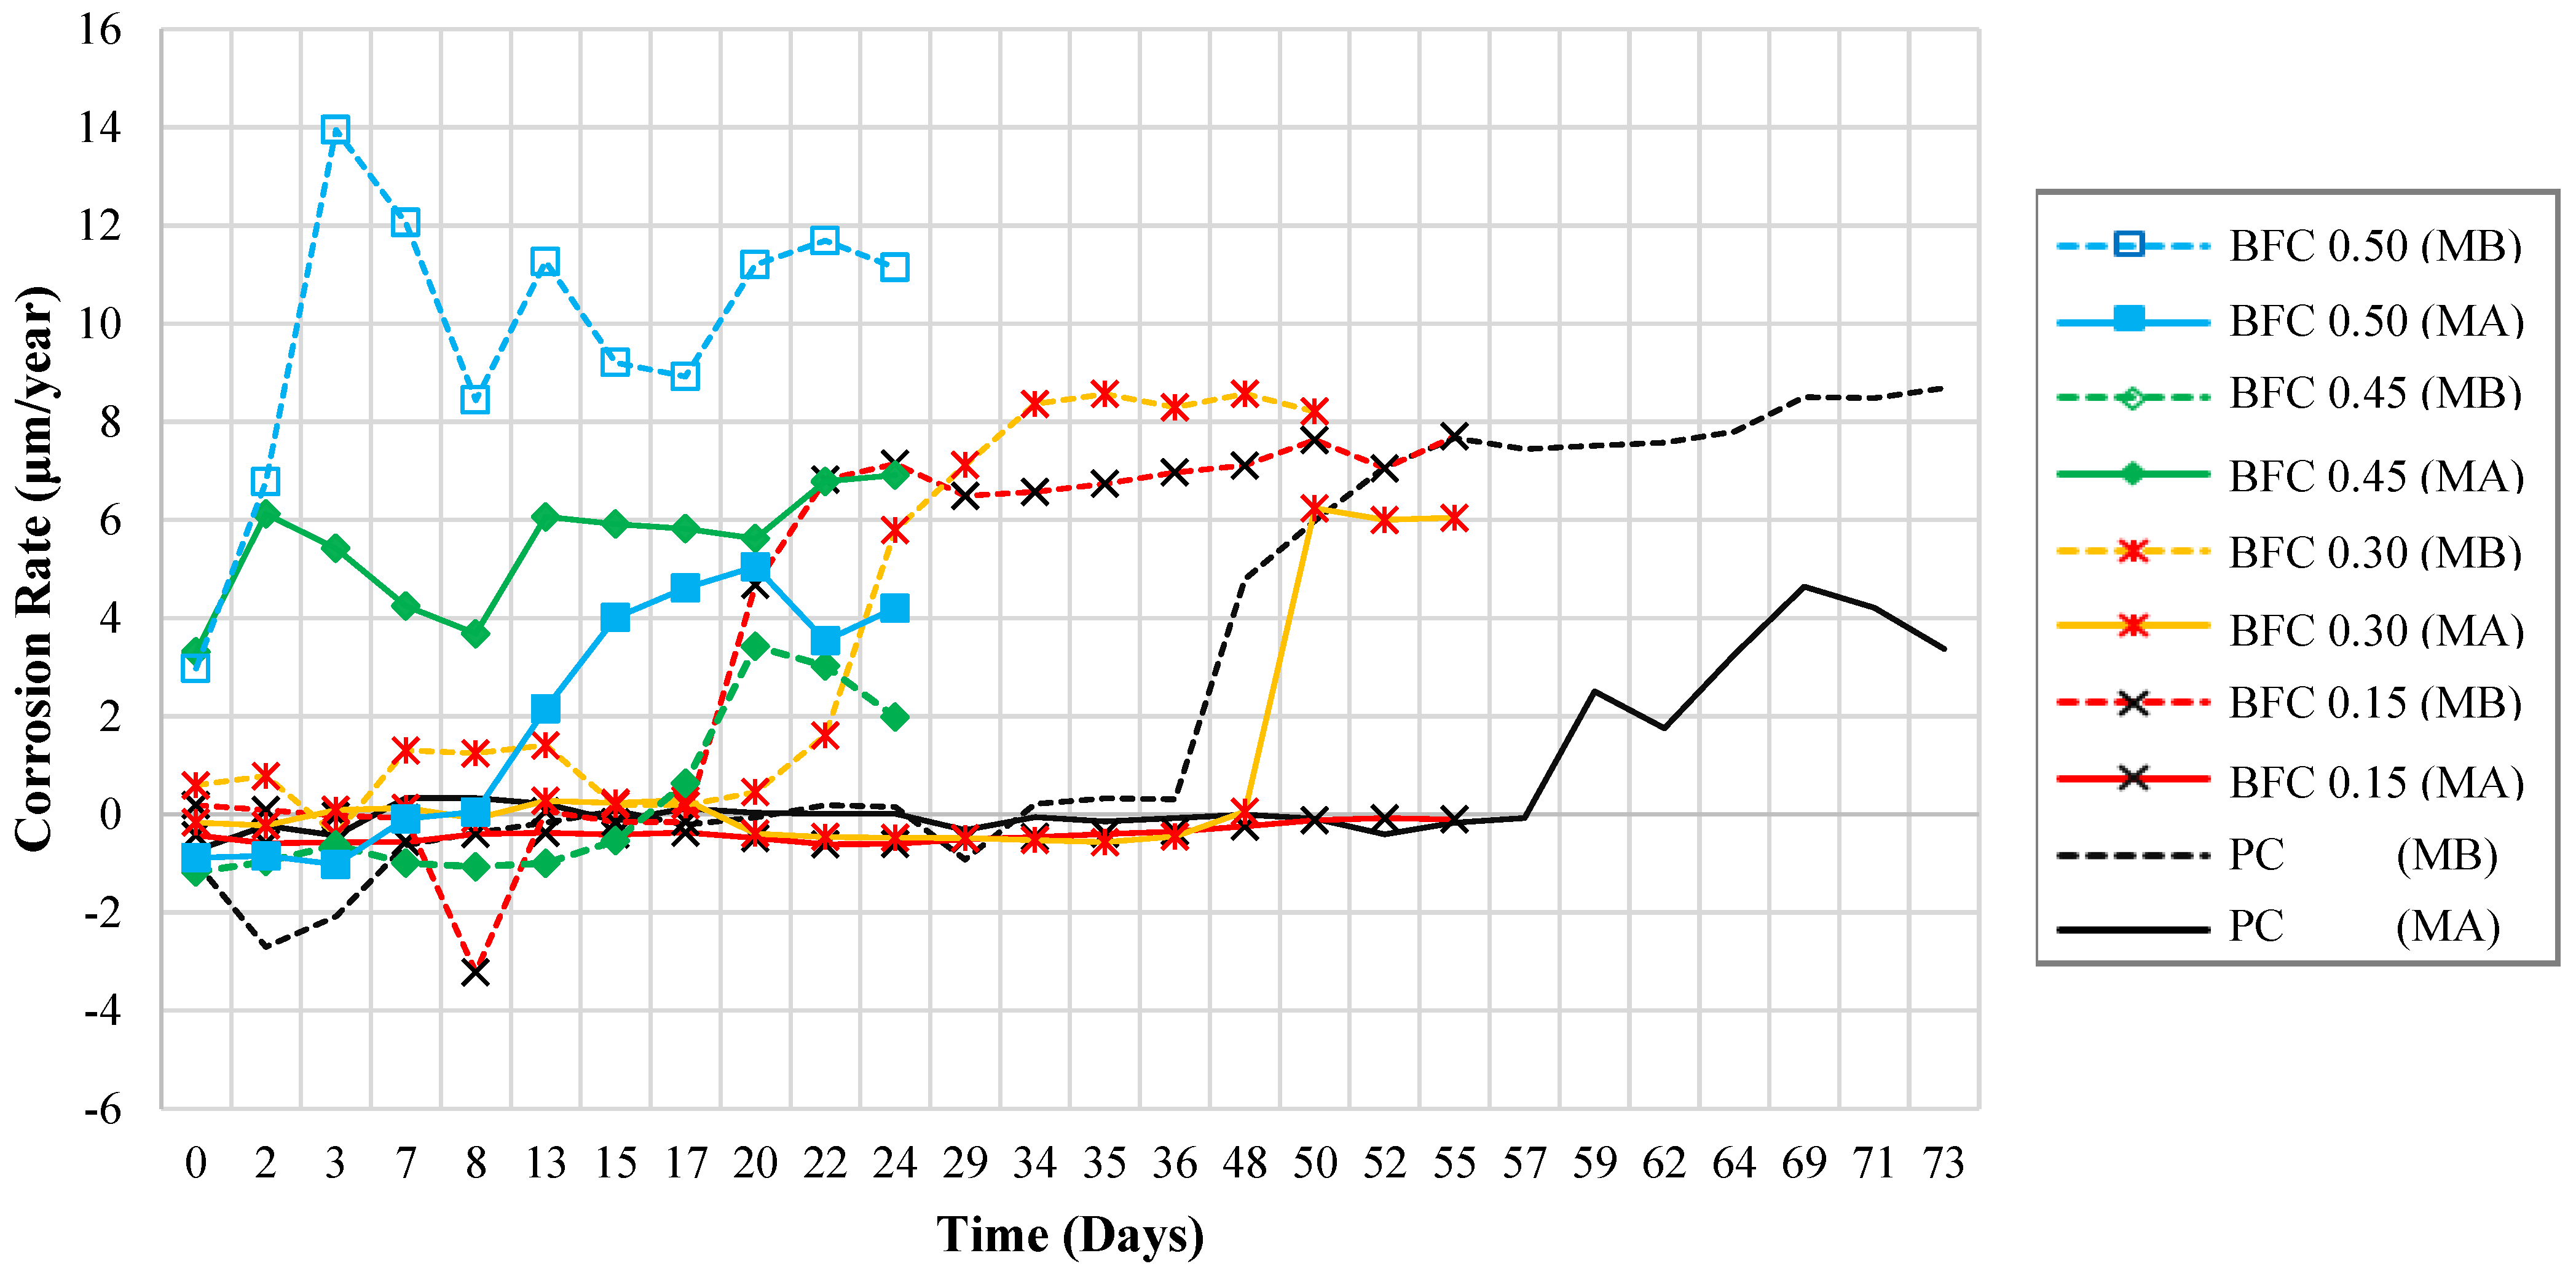
Figure 25.
Open circuit potential results.

| Fiber Type | Specific Gravity (g/cm3) | Tensile Strength (MPa) | Elastic Modulus (Gpa) | Elongation at Break (%) |
|---|---|---|---|---|
| Steel | 7.86 | 280–2800 | 210 | 0.5–35 |
| E-Glass | 2.56 | 1400–2500 | 76 | 1.8–3.2 |
| AR-Glass | 2.68 | 3700 | 74 | 2.5 |
| PAN-based Carbon | 1.77–1.79 | 5500–5800 | 354–375 | NA |
| Pitch-based Carbon | 2.20 | 3100 | 965 | NA |
| Polypropylene | 0.91 | 628–760 | 3.5–8 | 25 |
| Polyethylene | 0.97 | 2588–2900 | 117 | 10 |
| Basalt | 2.8 | 2800 | 89 | 3.15 |
| Cellulose | 1.10–1.50 | 600–1000 | 10–50 | 3.5 |
Table 2.
Material properties.
| Material | Properties | |
|---|---|---|
| Portland Cement | Relative Density | 3.15 |
| Basalt Coarse Aggregate (CA) | Maximum Aggregate Size | 19 mm (3/4″) |
| Specific Gravity | 2.729 | |
| % Absorption | 2.73 | |
| Graded in Accordance with ASTM C33 [55] | ||
| Natural Sand (FA) | Specific Gravity | 2.683 |
| % Absorption | 4.03 | |
| Fineness Modulus | 2.93 | |
| Graded in Accordance with ASTM C33 [55] | ||
| Basalt Fibers (BF) | Specific Gravity | 2.70 |
| Fiber Length | 24.13 mm (0.950″) | |
| Diameter | 0.60 mm (0.0235″) | |
| Aspect Ratio (L/D) | 40 | |
| Steel Fiber (SF) | Specific Gravity | 7.85 |
| Fiber length | 38 mm (1.5″) | |
| Diameter | 1.14 mm (0.045″) | |
| Aspect Ratio (L/D) | 34 | |
| Tensile Strength | 966–1242 Mpa (140–180 ksi) | |
| Elastic Modulus | 205 Gpa (29,700 ksi) | |
| High-Range Water Admixture | Specific Gravity | 1.08 |
| Normal Tap Water | Density at 24 °C (75.2 °F): 997.28 kg/m3 (62.3 lb./ft3) | |
Table 3.
Concrete mix design.
| Group | No. | Mix | Cement kg/m3 (lbs/yd3) | Water L/m3 (lbs/yd3) | Fine Agg. kg/m3 (lbs/yd3) | Coarse Agg. kg/m3 (lbs/yd3) | Basalt F. kg/m3 (lbs/yd3) | Steel F. kg/m3 (lbs/yd3) | HRWA L/m3 (gal./yd3) |
|---|---|---|---|---|---|---|---|---|---|
| MA (w/c = 0.35) | 1 | PC | 371 (625) | 130 (219) | 804 (1355) | 985 (1660) | 0.00 | 0.00 | 0.00 |
| 2 | BFC 0.15% | 371 (625) | 130 (219) | 804 (1355) | 985 (1660) | 4.05 (6.83) | 0.00 | 0.60 (0.12) | |
| 3 | BFC 0.30% | 371 (625) | 130 (219) | 804 (1355) | 985 (1660) | 8.10 (13.65) | 0.00 | 0.60 (0.12) | |
| 4 | BFC 0.45% | 371 (625) | 130 (219) | 804 (1355) | 985 (1660) | 12.15 (20.48) | 0.00 | 0.60 (0.12) | |
| 5 | BFC 0.50% | 371 (625) | 130 (219) | 804 (1355) | 985 (1660) | 13.50 (22.75) | 0.00 | 0.62 (0.13) | |
| 6 | SFC 0.30% | 371 (625) | 130 (219) | 804 (1355) | 985 (1660) | 0.00 | 23.55 (39.69) | 1.04 (0.21) | |
| 7 | SFC 0.50% | 371 (625) | 130 (219) | 804 (1355) | 985 (1660) | 0.00 | 39.25 (66.15) | 0.83 (0.17) | |
| MB (w/c = 0.40) | 8 | PC | 371 (625) | 148 (250) | 804 (1355) | 985 (1660) | 0.00 | 0.00 | 0.00 |
| 9 | BFC 0.15% | 371 (625) | 148 (250) | 804 (1355) | 985 (1660) | 4.05 (6.83) | 0.00 | 0.50 (0.10) | |
| 10 | BFC 0.30% | 371 (625) | 148 (250) | 804 (1355) | 985 (1660) | 8.10 (13.65) | 0.00 | 0.50 (0.10) | |
| 11 | BFC 0.45% | 371 (625) | 148 (250) | 804 (1355) | 985 (1660) | 12.15 (20.48) | 0.00 | 0.50 (0.10) | |
| 12 | BFC 0.50% | 371 (625) | 148 (250) | 804 (1355) | 985 (1660) | 13.50 (22.75) | 0.00 | 0.62 (0.13) | |
| 13 | SFC 0.30% | 371 (625) | 148 (250) | 804 (1355) | 985 (1660) | 0.00 | 23.55 (39.69) | 0.73 (0.15) | |
| 14 | SFC 0.50% | 371 (625) | 148 (250) | 804 (1355) | 985 (1660) | 0.00 | 39.25 (66.15) | 0.52 (0.11) |
Table 4.
Experimental test details.
| Property | Test | Standard | Specimen Dimensions | Number of Specimens |
|---|---|---|---|---|
| Fresh Properties | Concrete Slump (Workability) | ASTM C143 [59] | N/A | N/A |
| Fresh Density | ASTM C138 [60] | N/A | N/A | |
| Mechanical Properties | Compressive Strength | ASTM C39 [61] | 100Ø × 200 mm (4Ø × 8″) | 126 |
| Splitting Tensile Strength | ASTM C496 [62] | 150Ø × 300 mm (6Ø × 12″) | 42 | |
| Flexural Strength (MOR) | ASTM C78 [63] | 150 × 150 × 500 mm (6 × 6 × 20″) | 42 | |
| Average Residual Strength (ARS) | ASTM C1399 [64] | 50 × 50 × 300 mm (2 × 2 × 12″) | 42 | |
| Durability Properties | Unrestrained Drying Shrinkage | ASTM C490 [65] | 50 × 50 × 300 mm (2 × 2 × 10″) | 42 |
| Surface Resistivity | AASHTO TP-95 [66] | 100Ø × 200 mm (4Ø × 8″) | 42 |
Table 5.
Fresh and mechanical properties of the concrete mixtures.
| Fresh Properties | 28 Days Mechanical Properties | |||||||
|---|---|---|---|---|---|---|---|---|
| No. | Mix | Slump mm (inch) | Unit Weight kg/m3 (Ib/ft3) | Compressive Strength MPa (Psi) | Split-Tensile Strength MPa (Psi) | MR MPa (Psi) | ARS MPa (Psi) | |
| MA (W/C = 0.35) | 1 | PC | 152 (6.0) | 2286.38 (142.73) | 47.0 (6815.00) | 3.41 (494.45) | 4.01 (581.45) | N/A |
| 2 | BFC 15% | 152 (6.0) | 2322.90 (145.01) | 49.0 (7105.00) | 4.02 (582.90) | 4.22 (611.90) | 0.29 (42.1) | |
| 3 | BFC 30% | 140 (5.5) | 2423.62 (151.30) | 51.0 (7395.00) | 4.10 (594.50) | 4.99 (723.55) | 0.57 (82.7) | |
| 4 | BFC 45% | 127 (5.0) | 2480.85 (154.87) | 52.0 (7540.00) | 4.23 (613.35) | 4.69 (680.05) | 0.76 (110.2) | |
| 5 | BFC 50% | 114 (4.5) | 2499.40 (156.03) | 52.5 (7613.00) | 4.39 (636.55) | 4.49 (651.05) | 1.03 (149.4) | |
| 6 | SFC 30% | 152 (6.0) | 2502.00 (156.19) | 53.0 (7685.00) | 4.52 (655.40) | 5.12 (742.40) | 0.90 (130.5) | |
| 7 | SFC 50% | 140 (5.5) | 2560.00 (159.82) | 54.0 (7830.00) | 4.41 (639.45) | 4.95 (717.75) | 1.14 (165.3) | |
| MB (W/C = 0.40) | 8 | PC | 165 (6.5) | 2325.00 (145.15) | 43.2 (6269.80) | 3.23 (468.35) | 3.52 (510.40) | N/A |
| 9 | BFC 15% | 152 (6.0) | 2355.00 (147.01) | 44.1 (6394.50) | 3.38 (490.10) | 3.86 (559.70) | 0.10 (14.5) | |
| 10 | BFC 30% | 140 (5.5) | 2455.42 (153.29) | 46.4 (6729.45) | 3.83 (555.35) | 4.54 (658.30) | 0.35 (50.8) | |
| 11 | BFC 45% | 140 (5.5) | 2490.00 (155.45) | 46.3 (6710.60) | 3.91 (566.95) | 4.6 (667.00) | 0.43 (62.4) | |
| 12 | BFC 50% | 127 (5.0) | 2520.00 (157.32) | 47.3 (6851.70) | 3.99 (578.55) | 4.3 (623.50) | 0.66 (95.7) | |
| 13 | SFC 30% | 152 (6.0) | 2525.00 (157.63) | 49.3 (7147.05) | 4.24 (614.80) | 4.85 (703.25) | 0.61 (88.5) | |
| 14 | SFC 50% | 140 (5.5) | 2573.00 (160.63) | 49.4 (7164.45) | 4.12 (597.40) | 4.78 (693.10) | 1.06 (153.7) | |
S2: Variance = ∑ (xi – mean)2/no. of samples. S: Standard deviation = .
Table 6.
Analysis of variance.
| No. | Mix | Compressive Test | Split-Tensile Test | Flexural Test | |||||||
|---|---|---|---|---|---|---|---|---|---|---|---|
| Mean | S2 | S | Mean | S2 | S | Mean | S2 | S | |||
| MA (W/C = 0.35) | 1 | PC | 47.0 (6815.00) | 2.00 | 1.42 | 3.41 (494.45) | 1.67 | 1.30 | 4.01 (581.45) | 1.25 | 1.12 |
| 2 | BFC 15% | 49.0 (7105.00) | 2.67 | 1.64 | 4.02 (582.90) | 2.21 | 1.49 | 4.22 (611.90) | 0.99 | 1.00 | |
| 3 | BFC 30% | 51.0 (7395.00) | 0.67 | 0.82 | 4.10 (594.50) | 1.25 | 1.12 | 4.99 (723.55) | 1.12 | 1.06 | |
| 4 | BFC 45% | 52.0 (7540.00) | 2.00 | 1.42 | 4.23 (613.35) | 2.00 | 1.42 | 4.69 (680.05) | 2.30 | 1.52 | |
| 5 | BFC 50% | 52.5 (7613.00) | 1.59 | 1.27 | 4.39 (636.55) | 0.82 | 0.91 | 4.49 (651.05) | 1.28 | 1.14 | |
| 6 | SFC 30% | 53.0 (7685.00) | 2.00 | 1.42 | 4.52 (655.40) | 1.12 | 1.06 | 5.12 (742.40) | 0.87 | 0.94 | |
| 7 | SFC 50% | 54.0 (7830.00) | 2.00 | 1.42 | 4.41 (639.45) | 2.00 | 1.42 | 4.95 (717.75) | 1.12 | 1.06 | |
| MB (W/C = 0.40) | 8 | PC | 43.2 (6269.80) | 0.91 | 0.96 | 3.23 (468.35) | 2.00 | 1.42 | 3.52 (510.40) | 0.95 | 0.98 |
| 9 | BFC 15% | 44.1 (6394.50) | 2.95 | 1.72 | 3.38 (490.10) | 2.23 | 1.50 | 3.86 (559.70) | 1.35 | 1.17 | |
| 10 | BFC 30% | 46.4 (6729.45) | 1.63 | 1.28 | 3.83 (555.35) | 1.35 | 1.17 | 4.54 (658.30) | 1.2 | 1.10 | |
| 11 | BFC 45% | 46.3 (6710.60) | 0.89 | 0.95 | 3.91 (566.95) | 1.12 | 1.06 | 4.6 (667.00) | 1.89 | 1.38 | |
| 12 | BFC 50% | 47.3 (6851.70) | 0.89 | 0.95 | 3.99 (578.55) | 0.87 | 0.94 | 4.3 (623.50) | 2.00 | 1.42 | |
| 13 | SFC 30% | 49.3 (7147.05) | 2.89 | 1.7 | 4.24 (614.80) | 1.30 | 1.15 | 4.8 (703.25) | 2.87 | 1.70 | |
| 14 | SFC 50% | 49.4 (7164.45) | 1.63 | 1.28 | 4.12 (597.40) | 2.50 | 1.59 | 4.78 (693.10) | 1.59 | 1.27 | |
Publisher’s Note: MDPI stays neutral with regard to jurisdictional claims in published maps and institutional affiliations. |
© 2022 by the authors. Licensee MDPI, Basel, Switzerland. This article is an open access article distributed under the terms and conditions of the Creative Commons Attribution (CC BY) license (https://creativecommons.org/licenses/by/4.0/).
Share and Cite
MDPI and ACS Style
Elshazli, M.T.; Ramirez, K.; Ibrahim, A.; Badran, M. Mechanical, Durability and Corrosion Properties of Basalt Fiber Concrete. Fibers 2022, 10, 10. https://doi.org/10.3390/fib10020010
AMA Style
Elshazli MT, Ramirez K, Ibrahim A, Badran M. Mechanical, Durability and Corrosion Properties of Basalt Fiber Concrete. Fibers. 2022; 10(2):10. https://doi.org/10.3390/fib10020010
Chicago/Turabian StyleElshazli, Mohamed T., Kevin Ramirez, Ahmed Ibrahim, and Mohamed Badran. 2022. "Mechanical, Durability and Corrosion Properties of Basalt Fiber Concrete" Fibers 10, no. 2: 10. https://doi.org/10.3390/fib10020010
Note that from the first issue of 2016, this journal uses article numbers instead of page numbers. See further details here.