

Influence of Abaca Fiber Inclusion on the Unconfined Compressive Strength of Reconstituted Sandy Silts

 ,
,
Abstract
:
1. Introduction
2. Materials and Methods
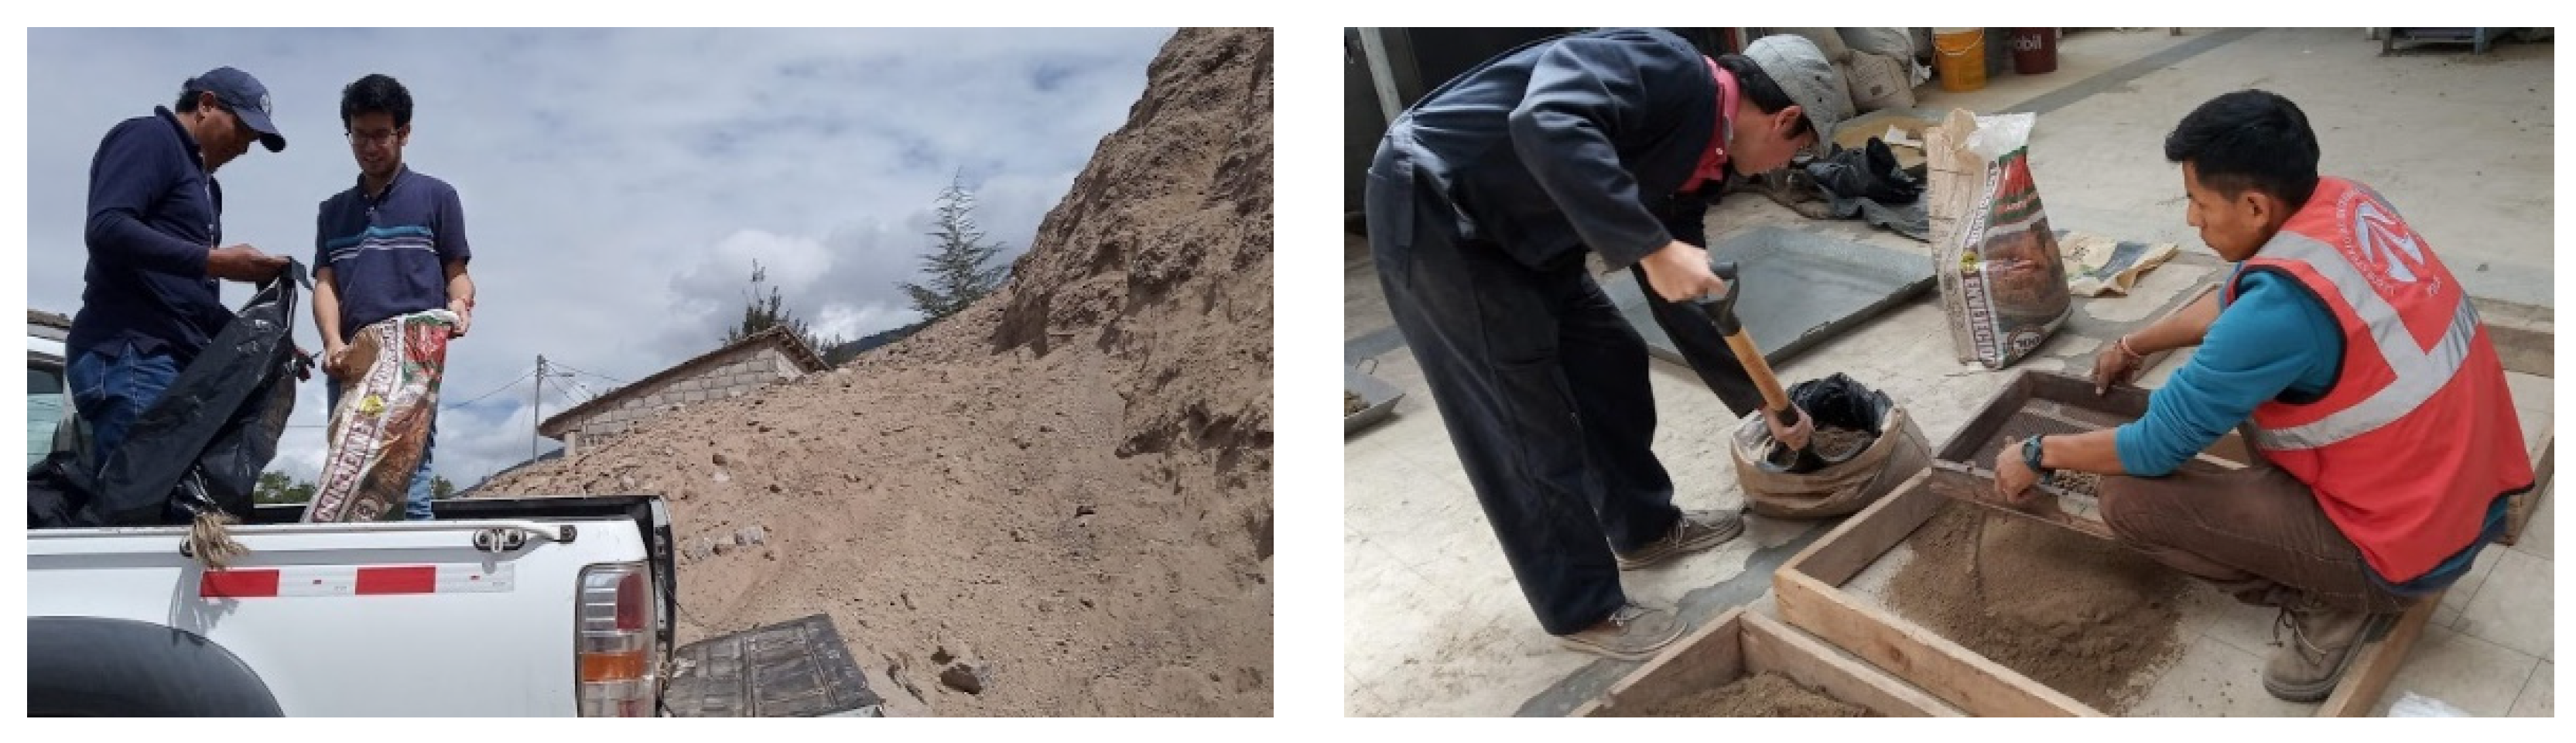
2.1. Soil
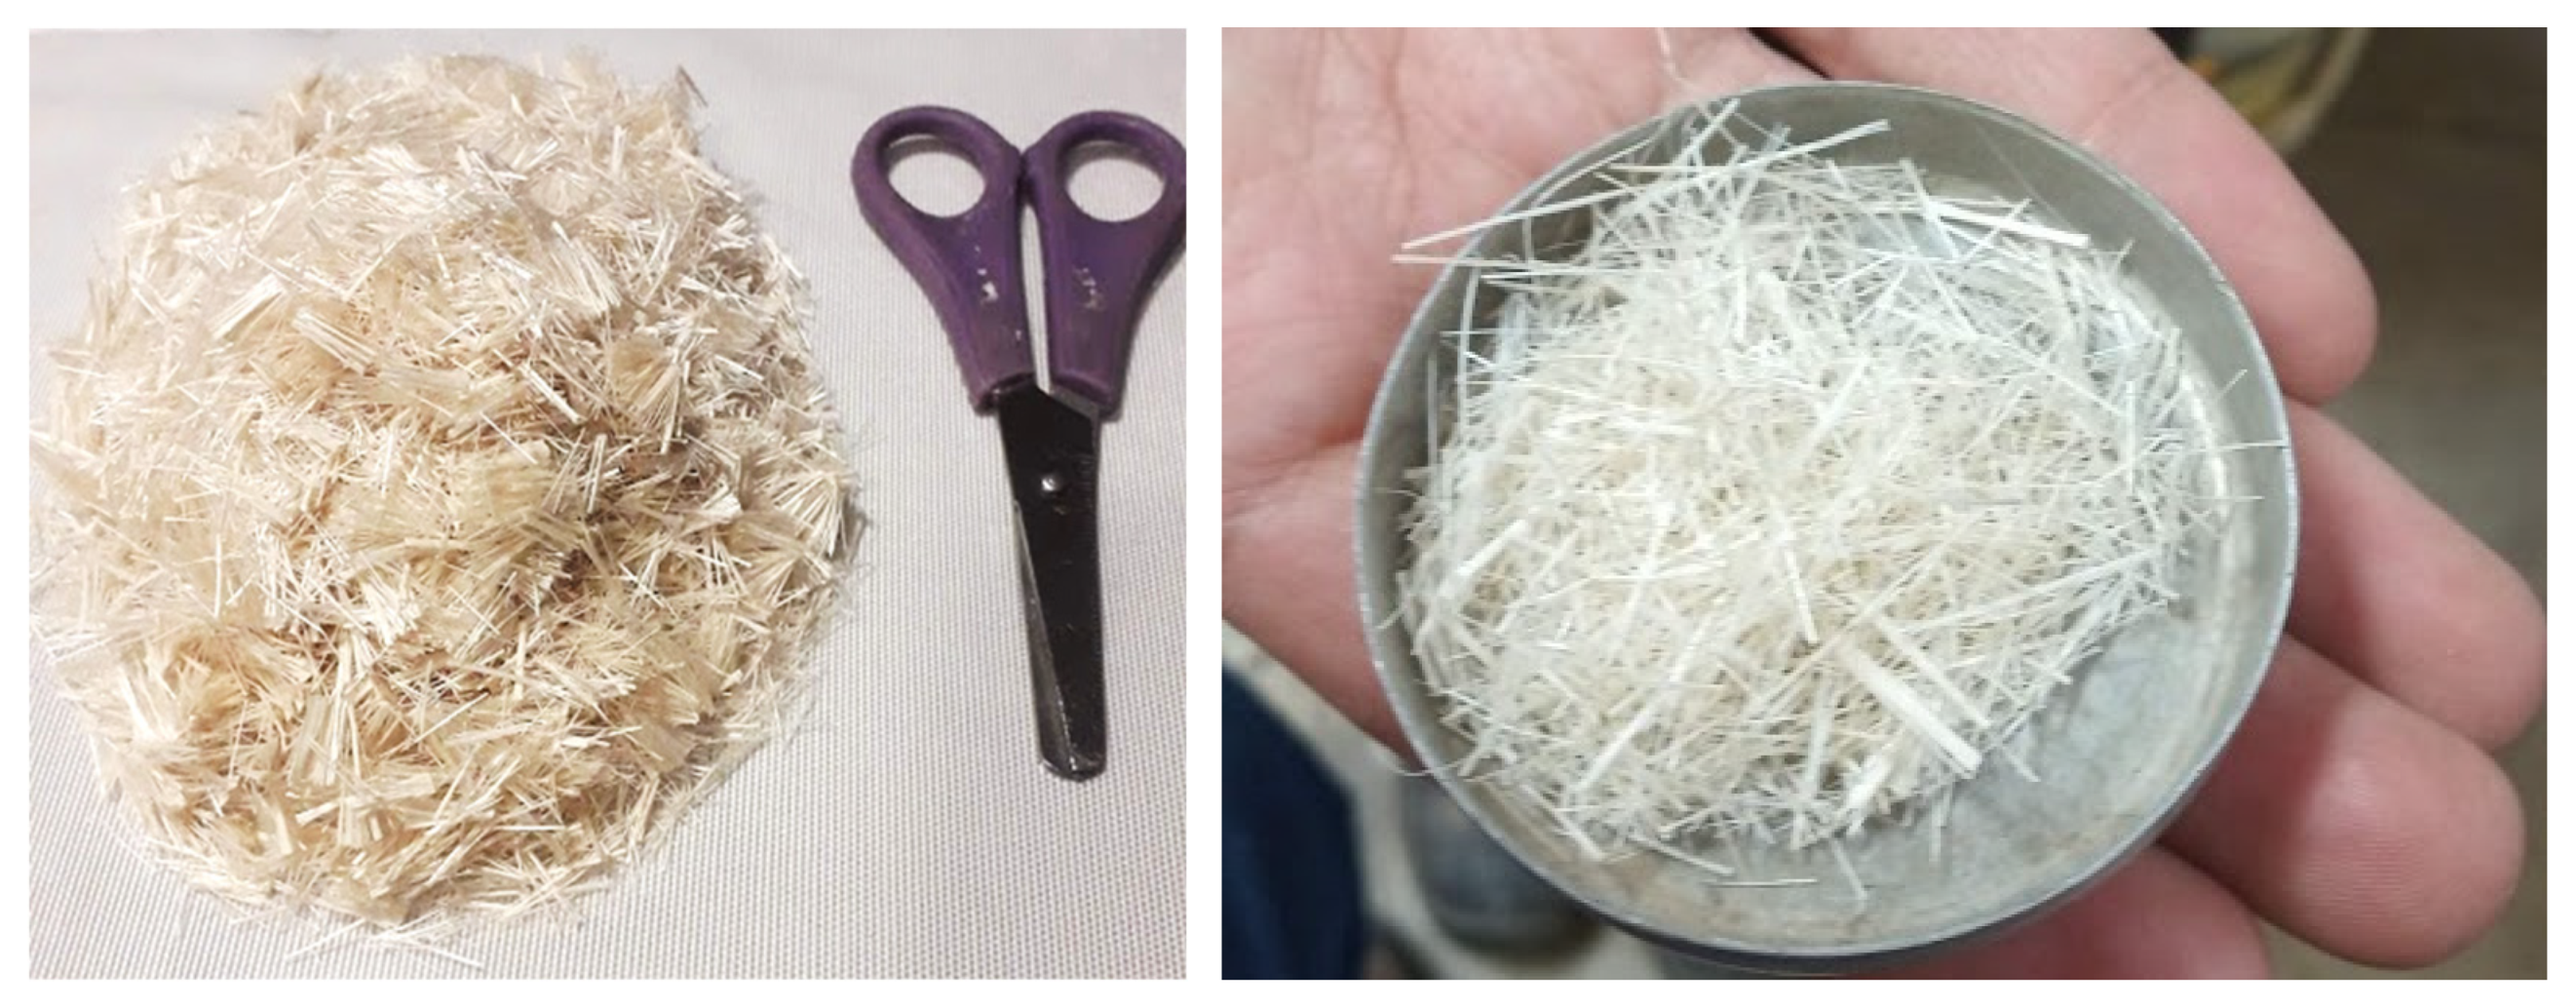
2.2. Abacá Fiber
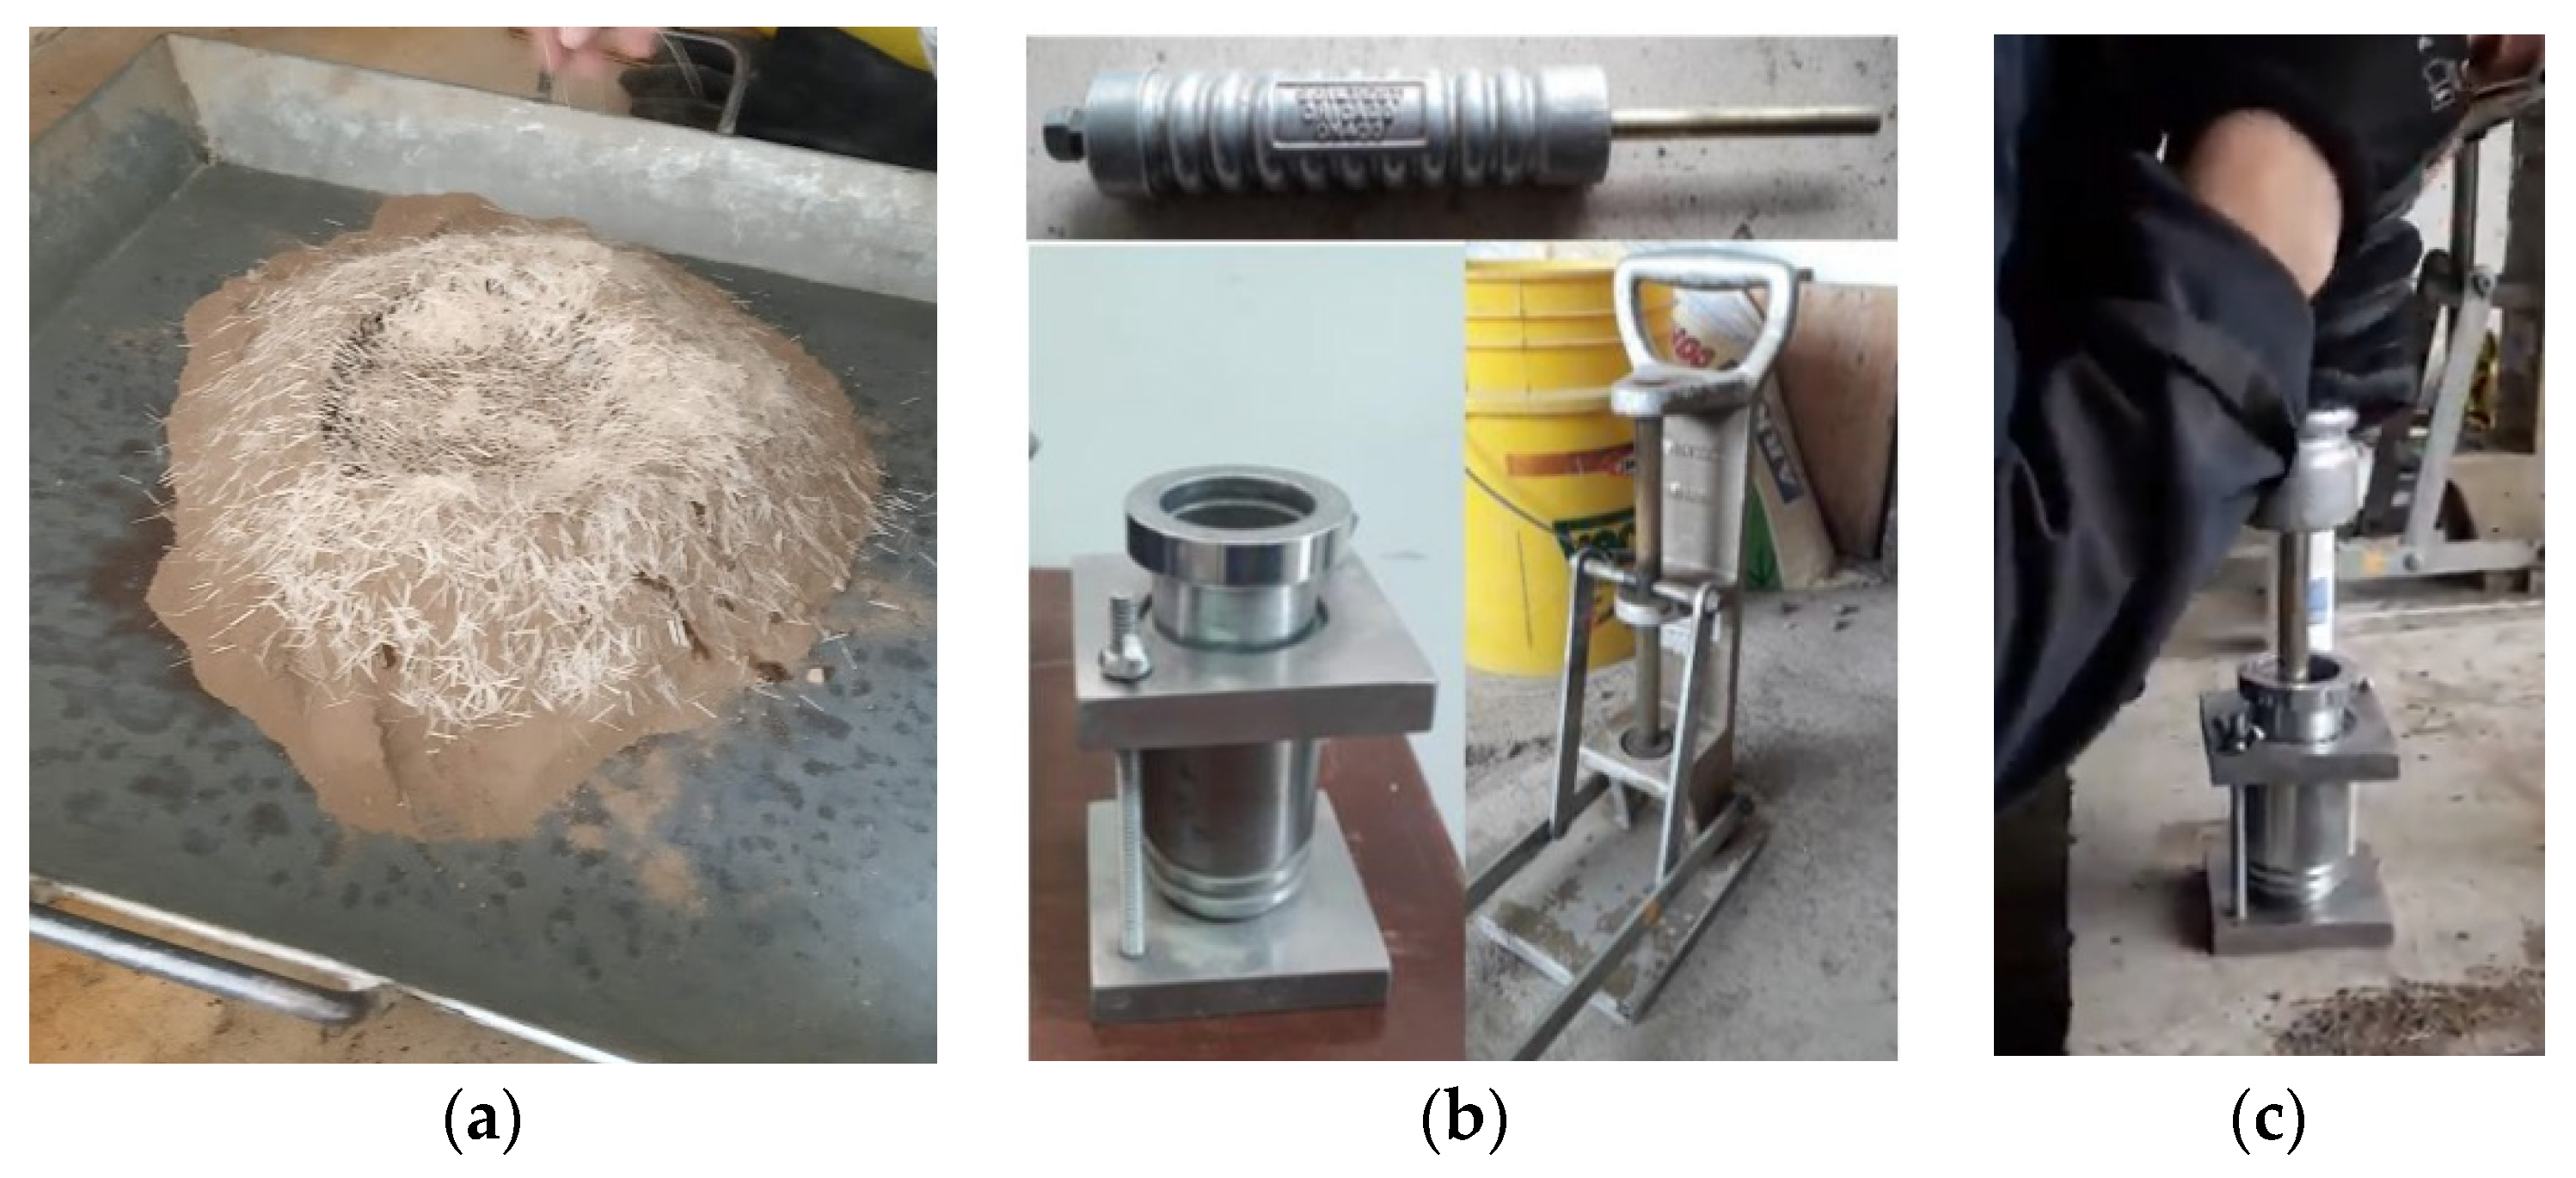
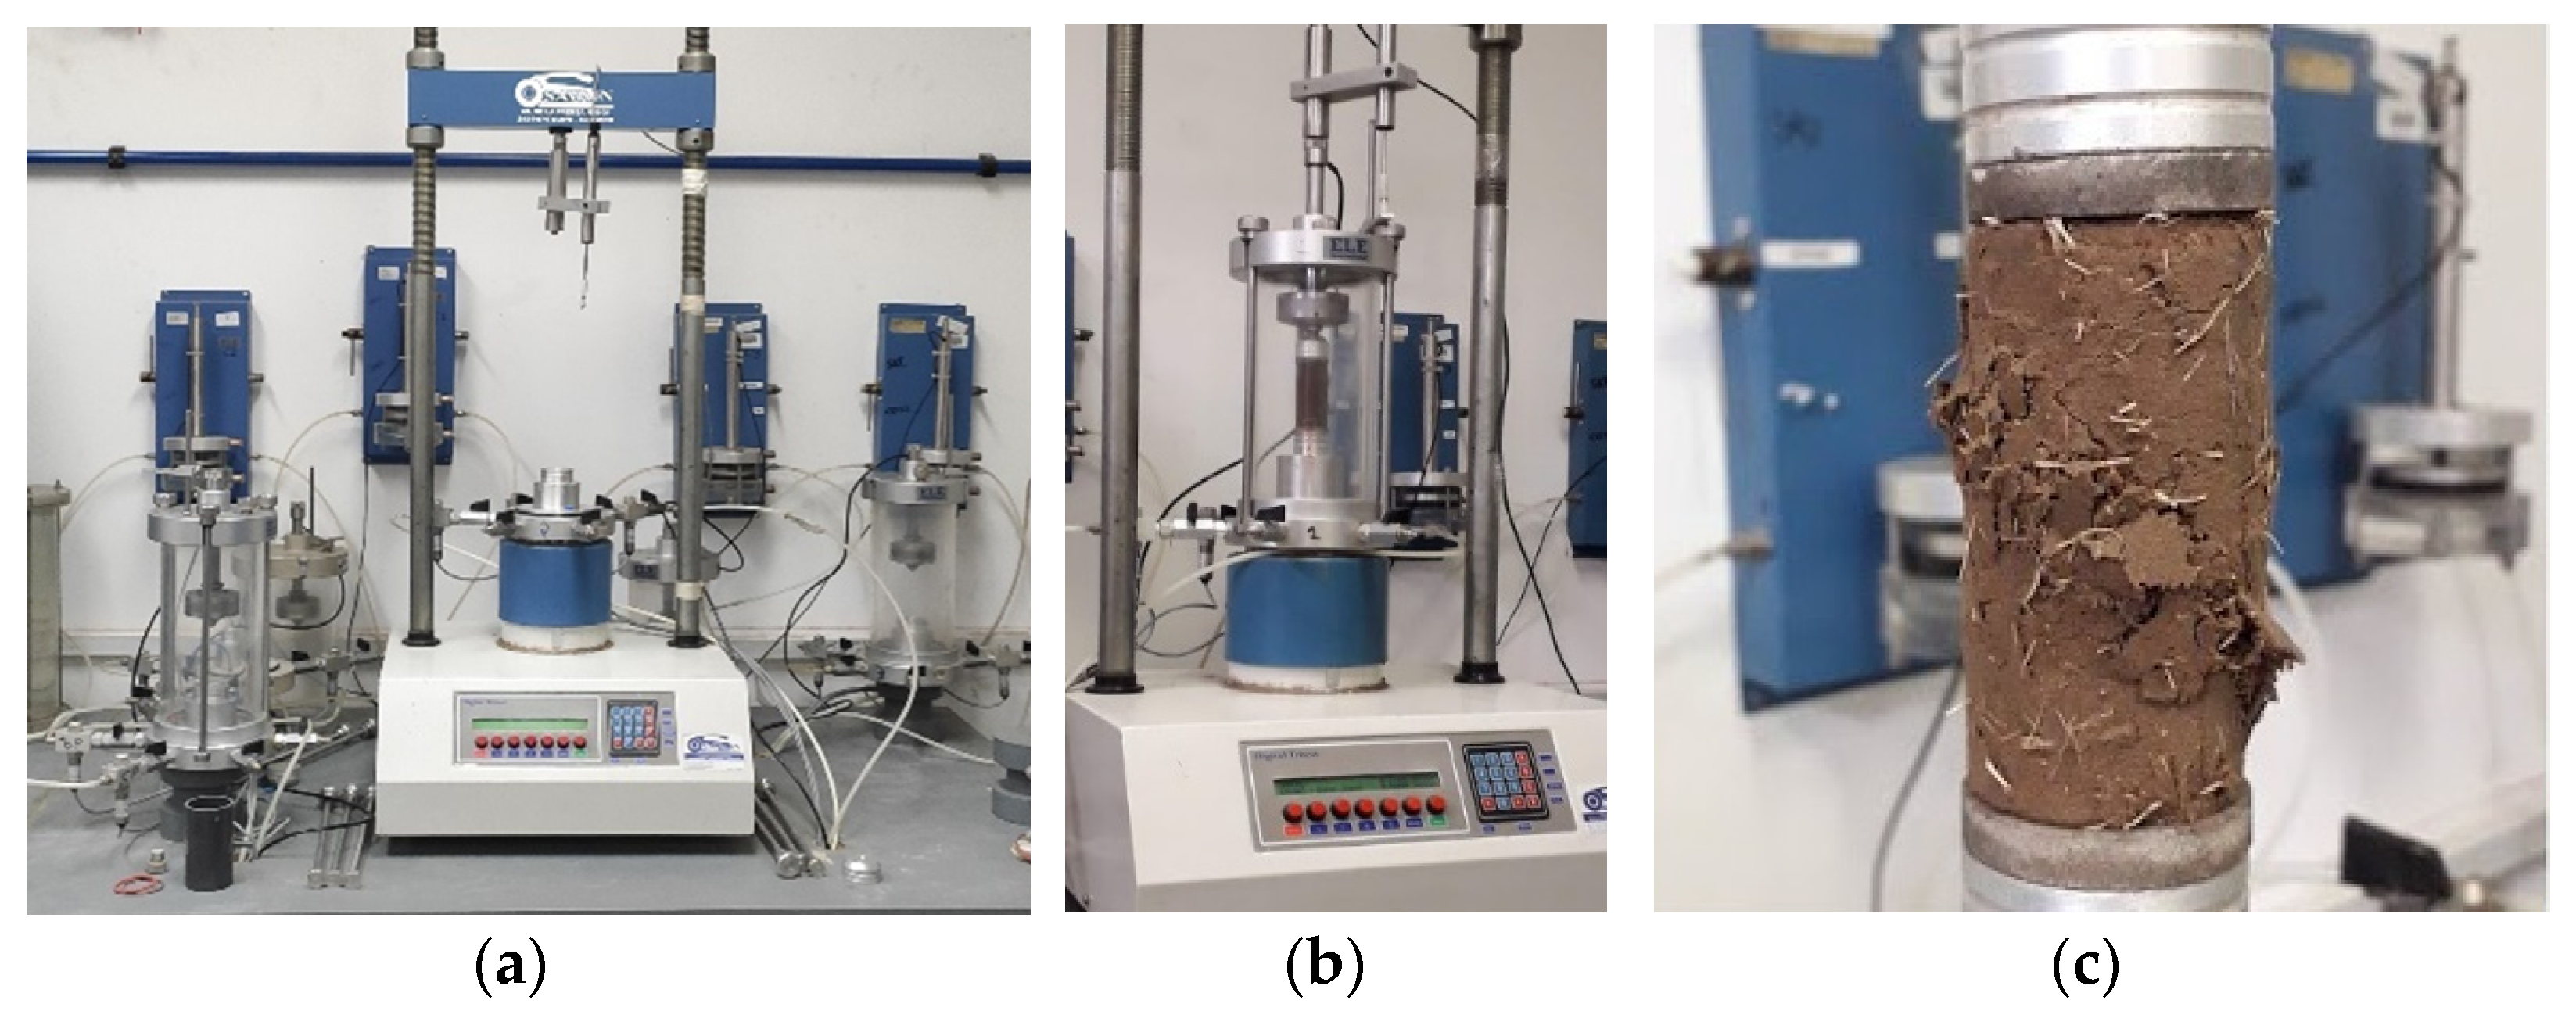
2.3. Specimen Preparation
2.4. Testing Program
2.5. Statistical Analyses
3. Results
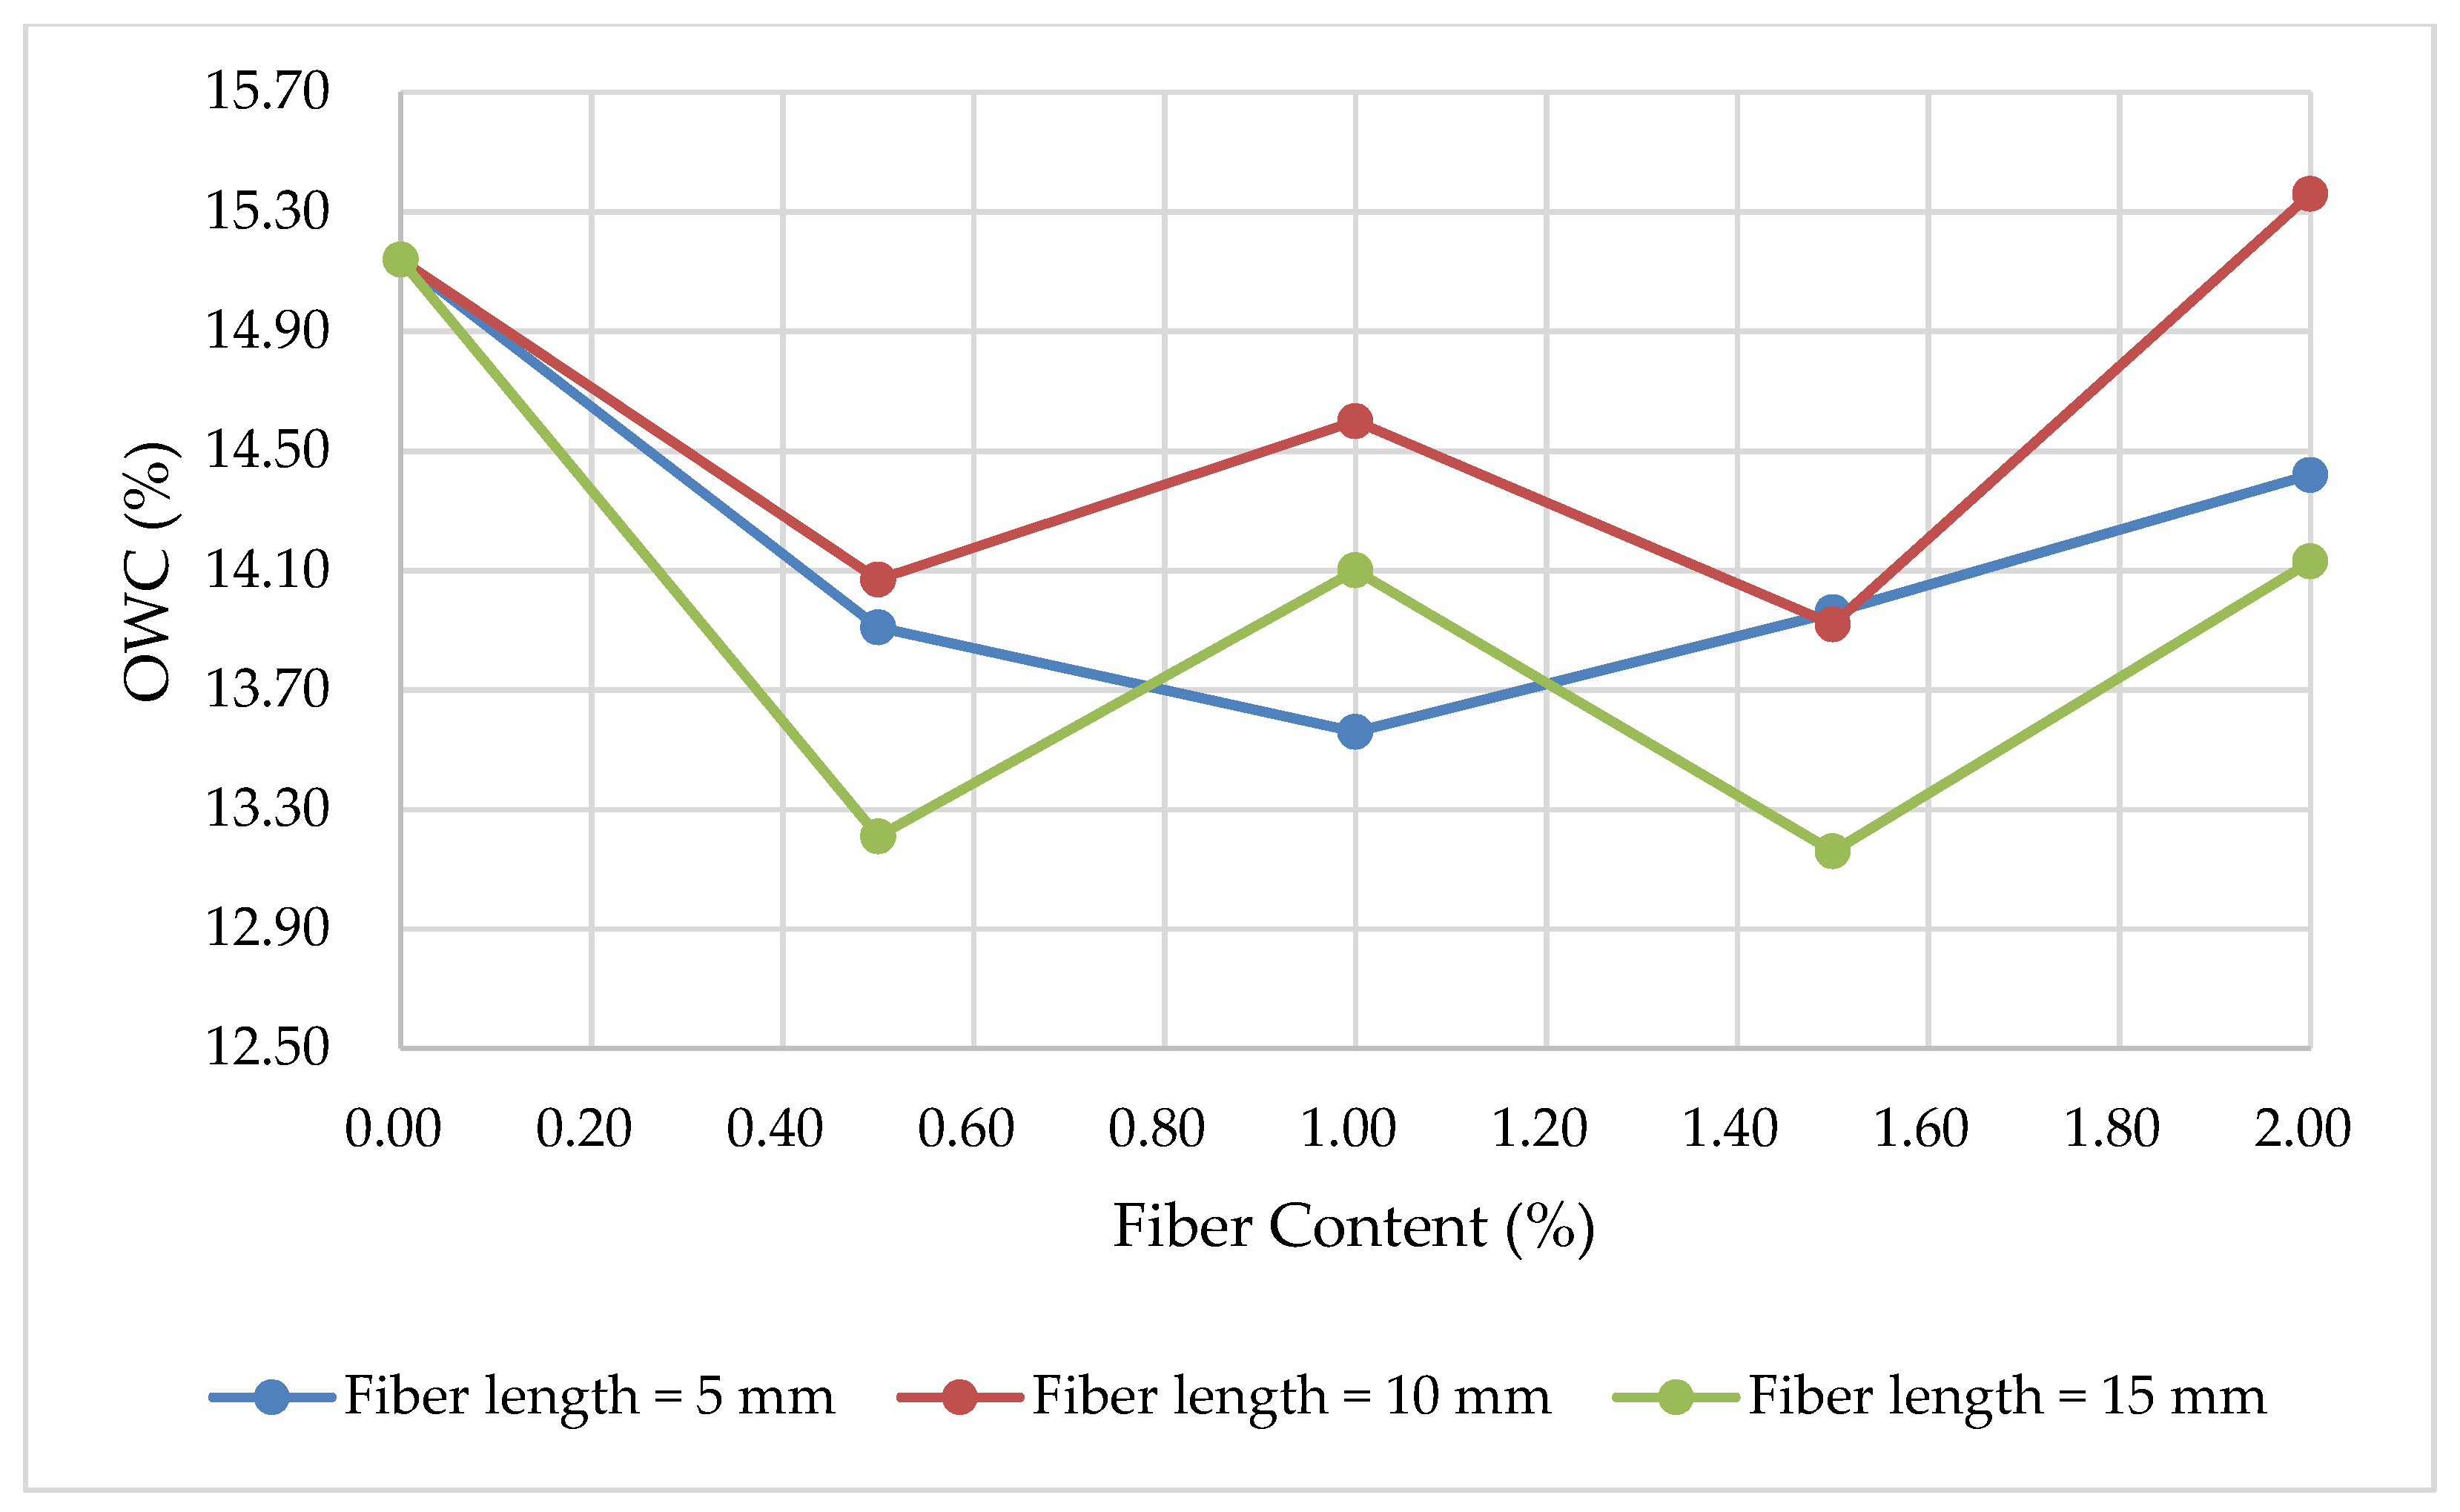
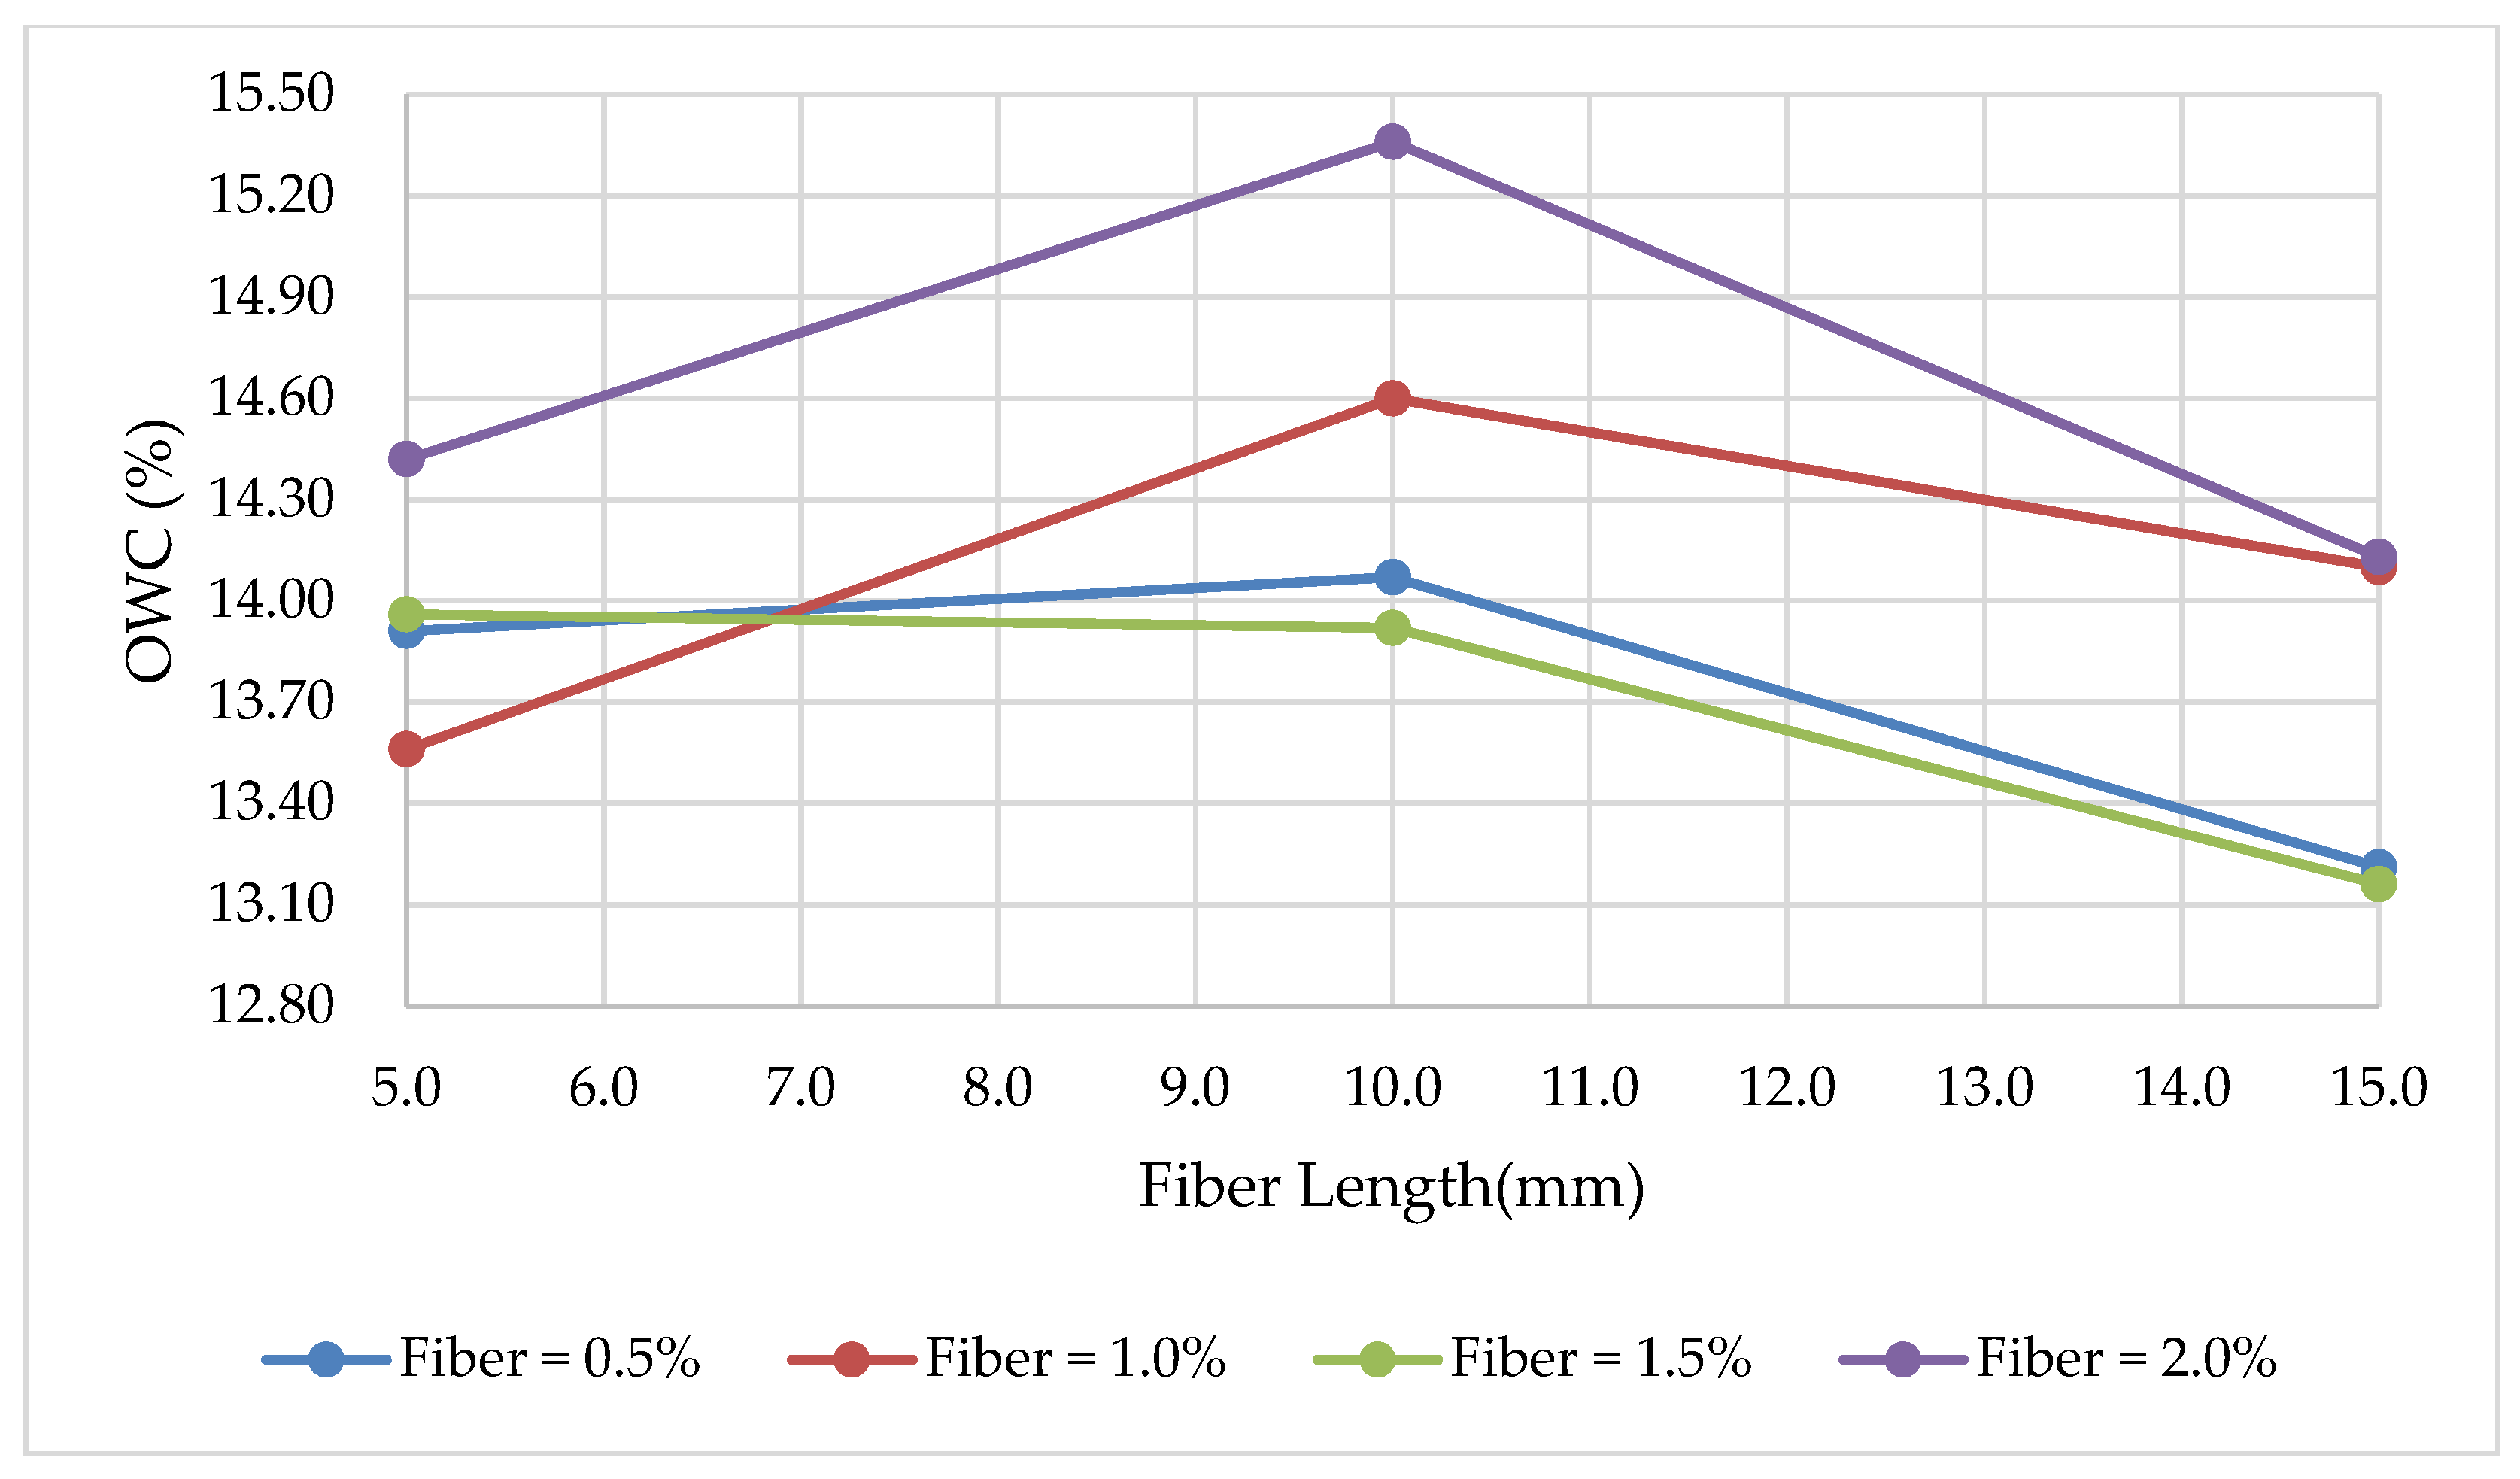
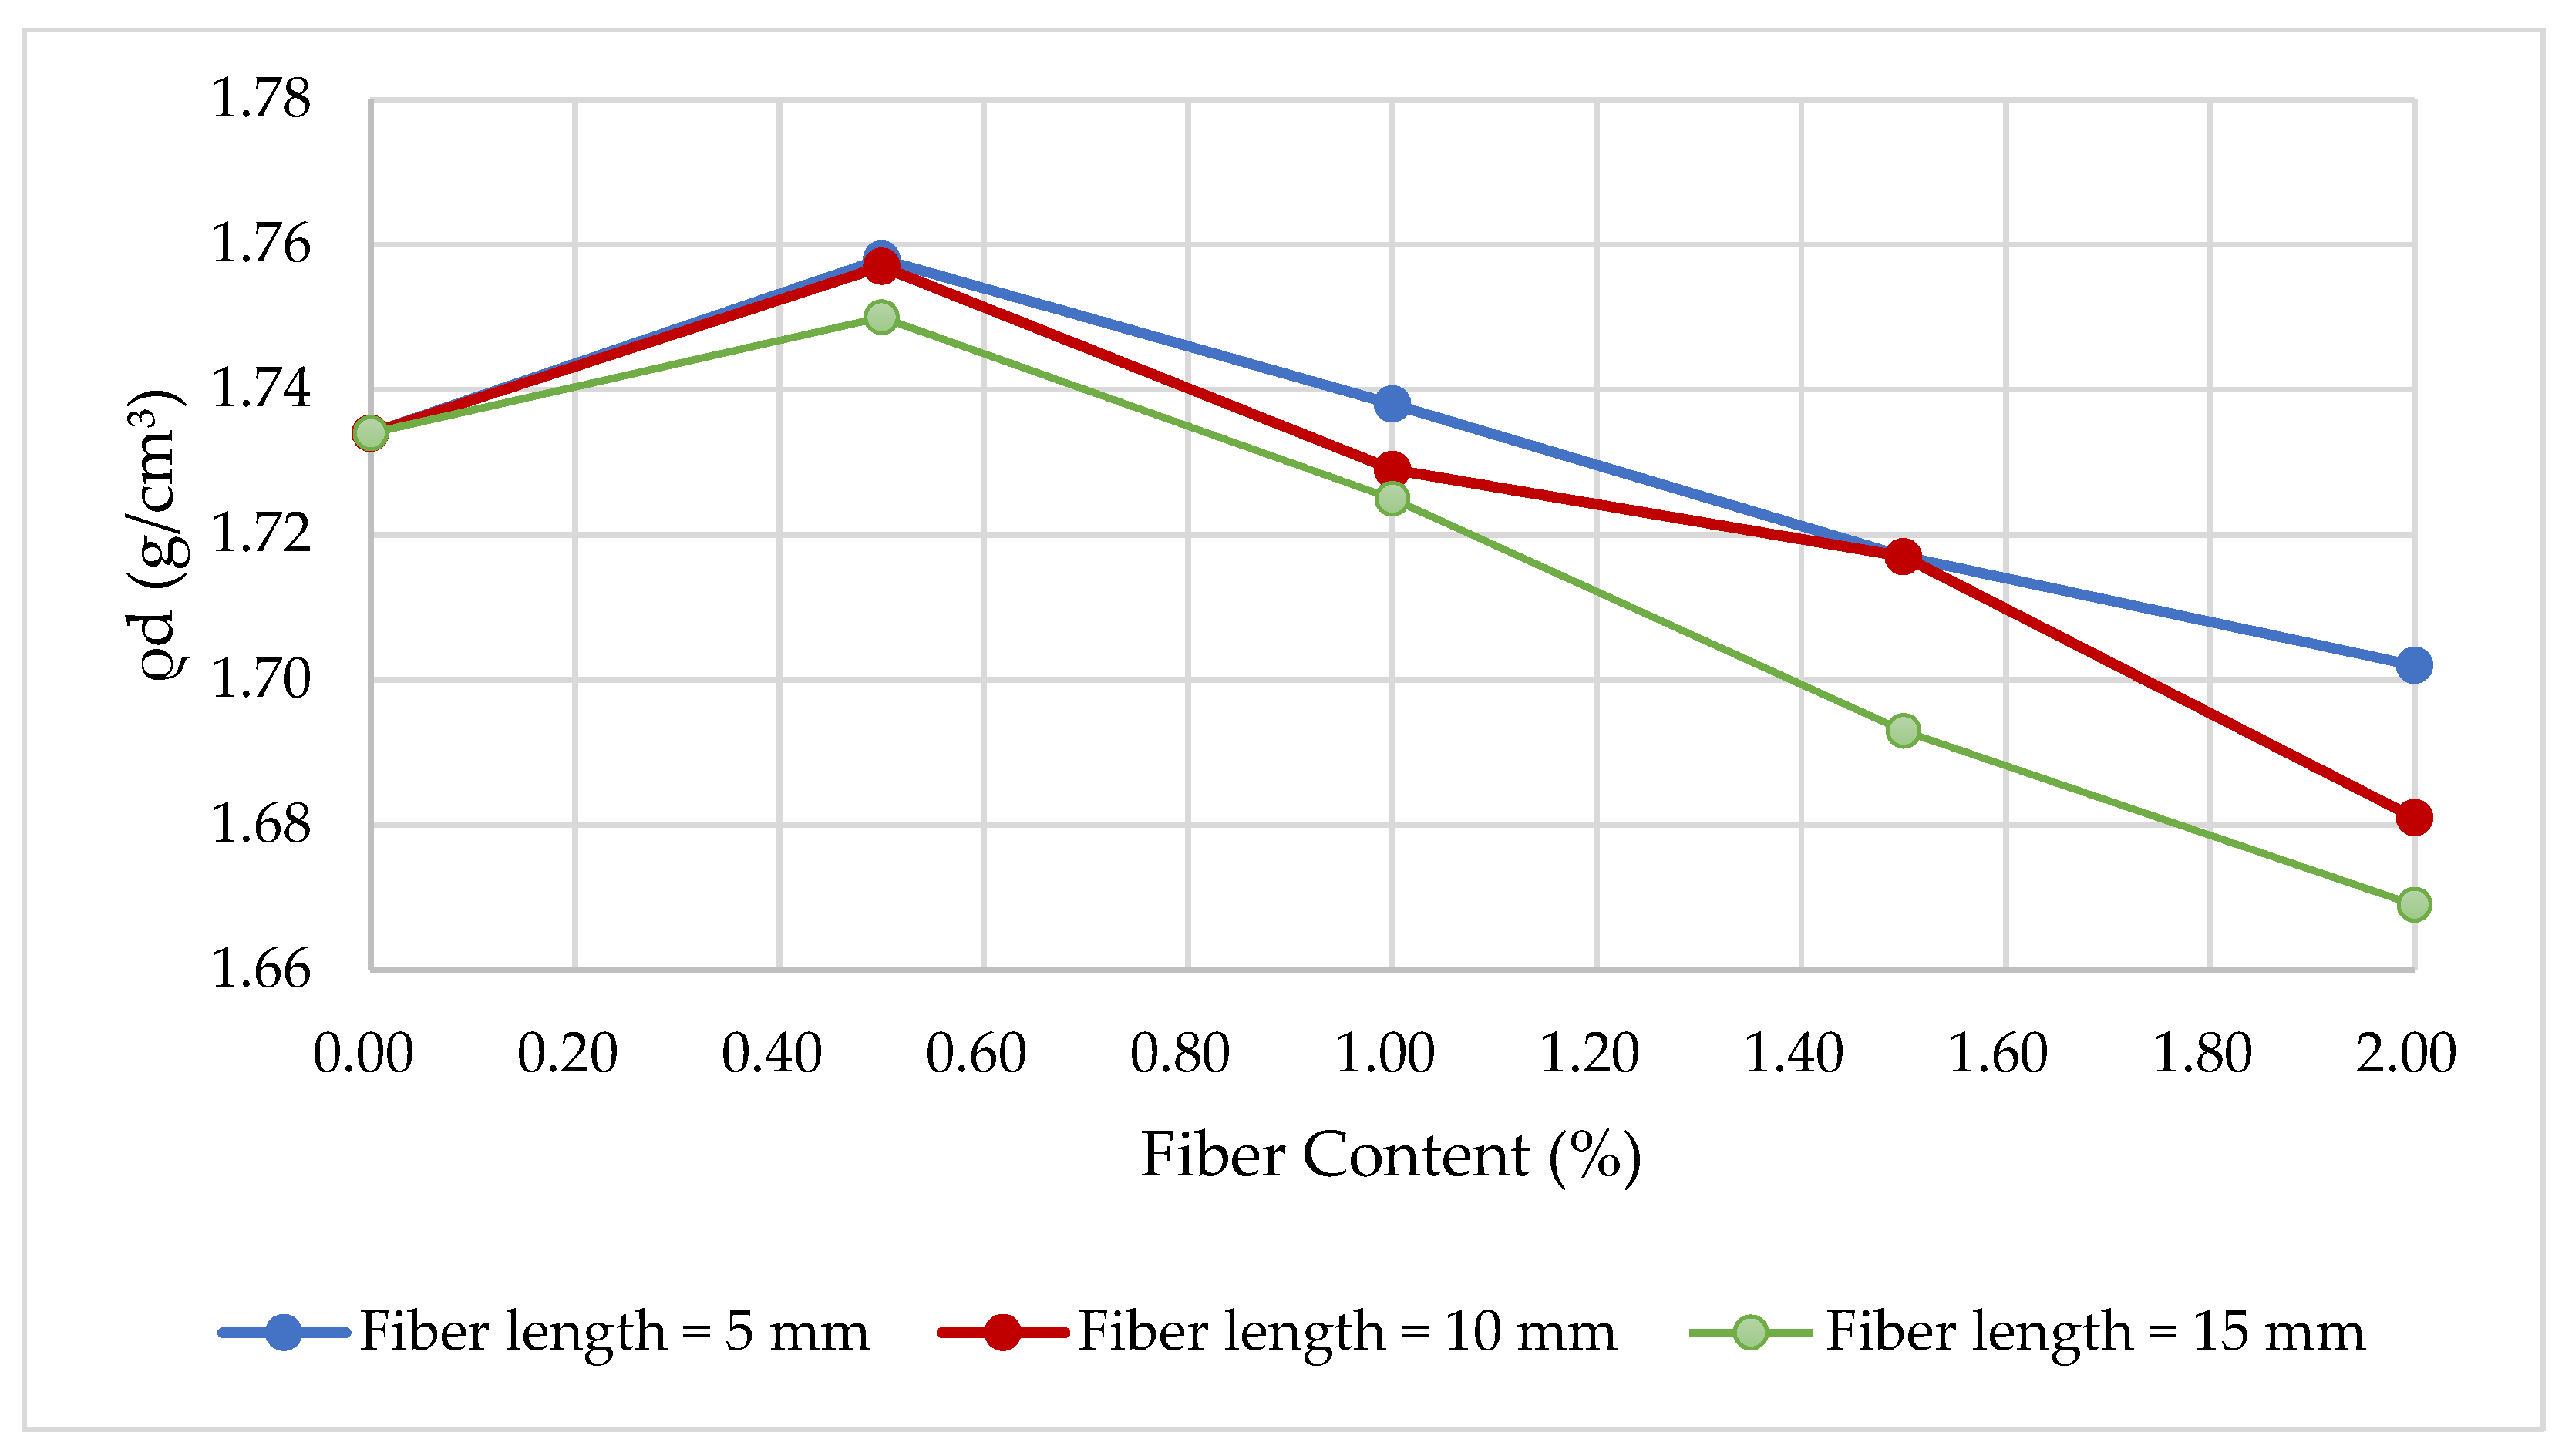
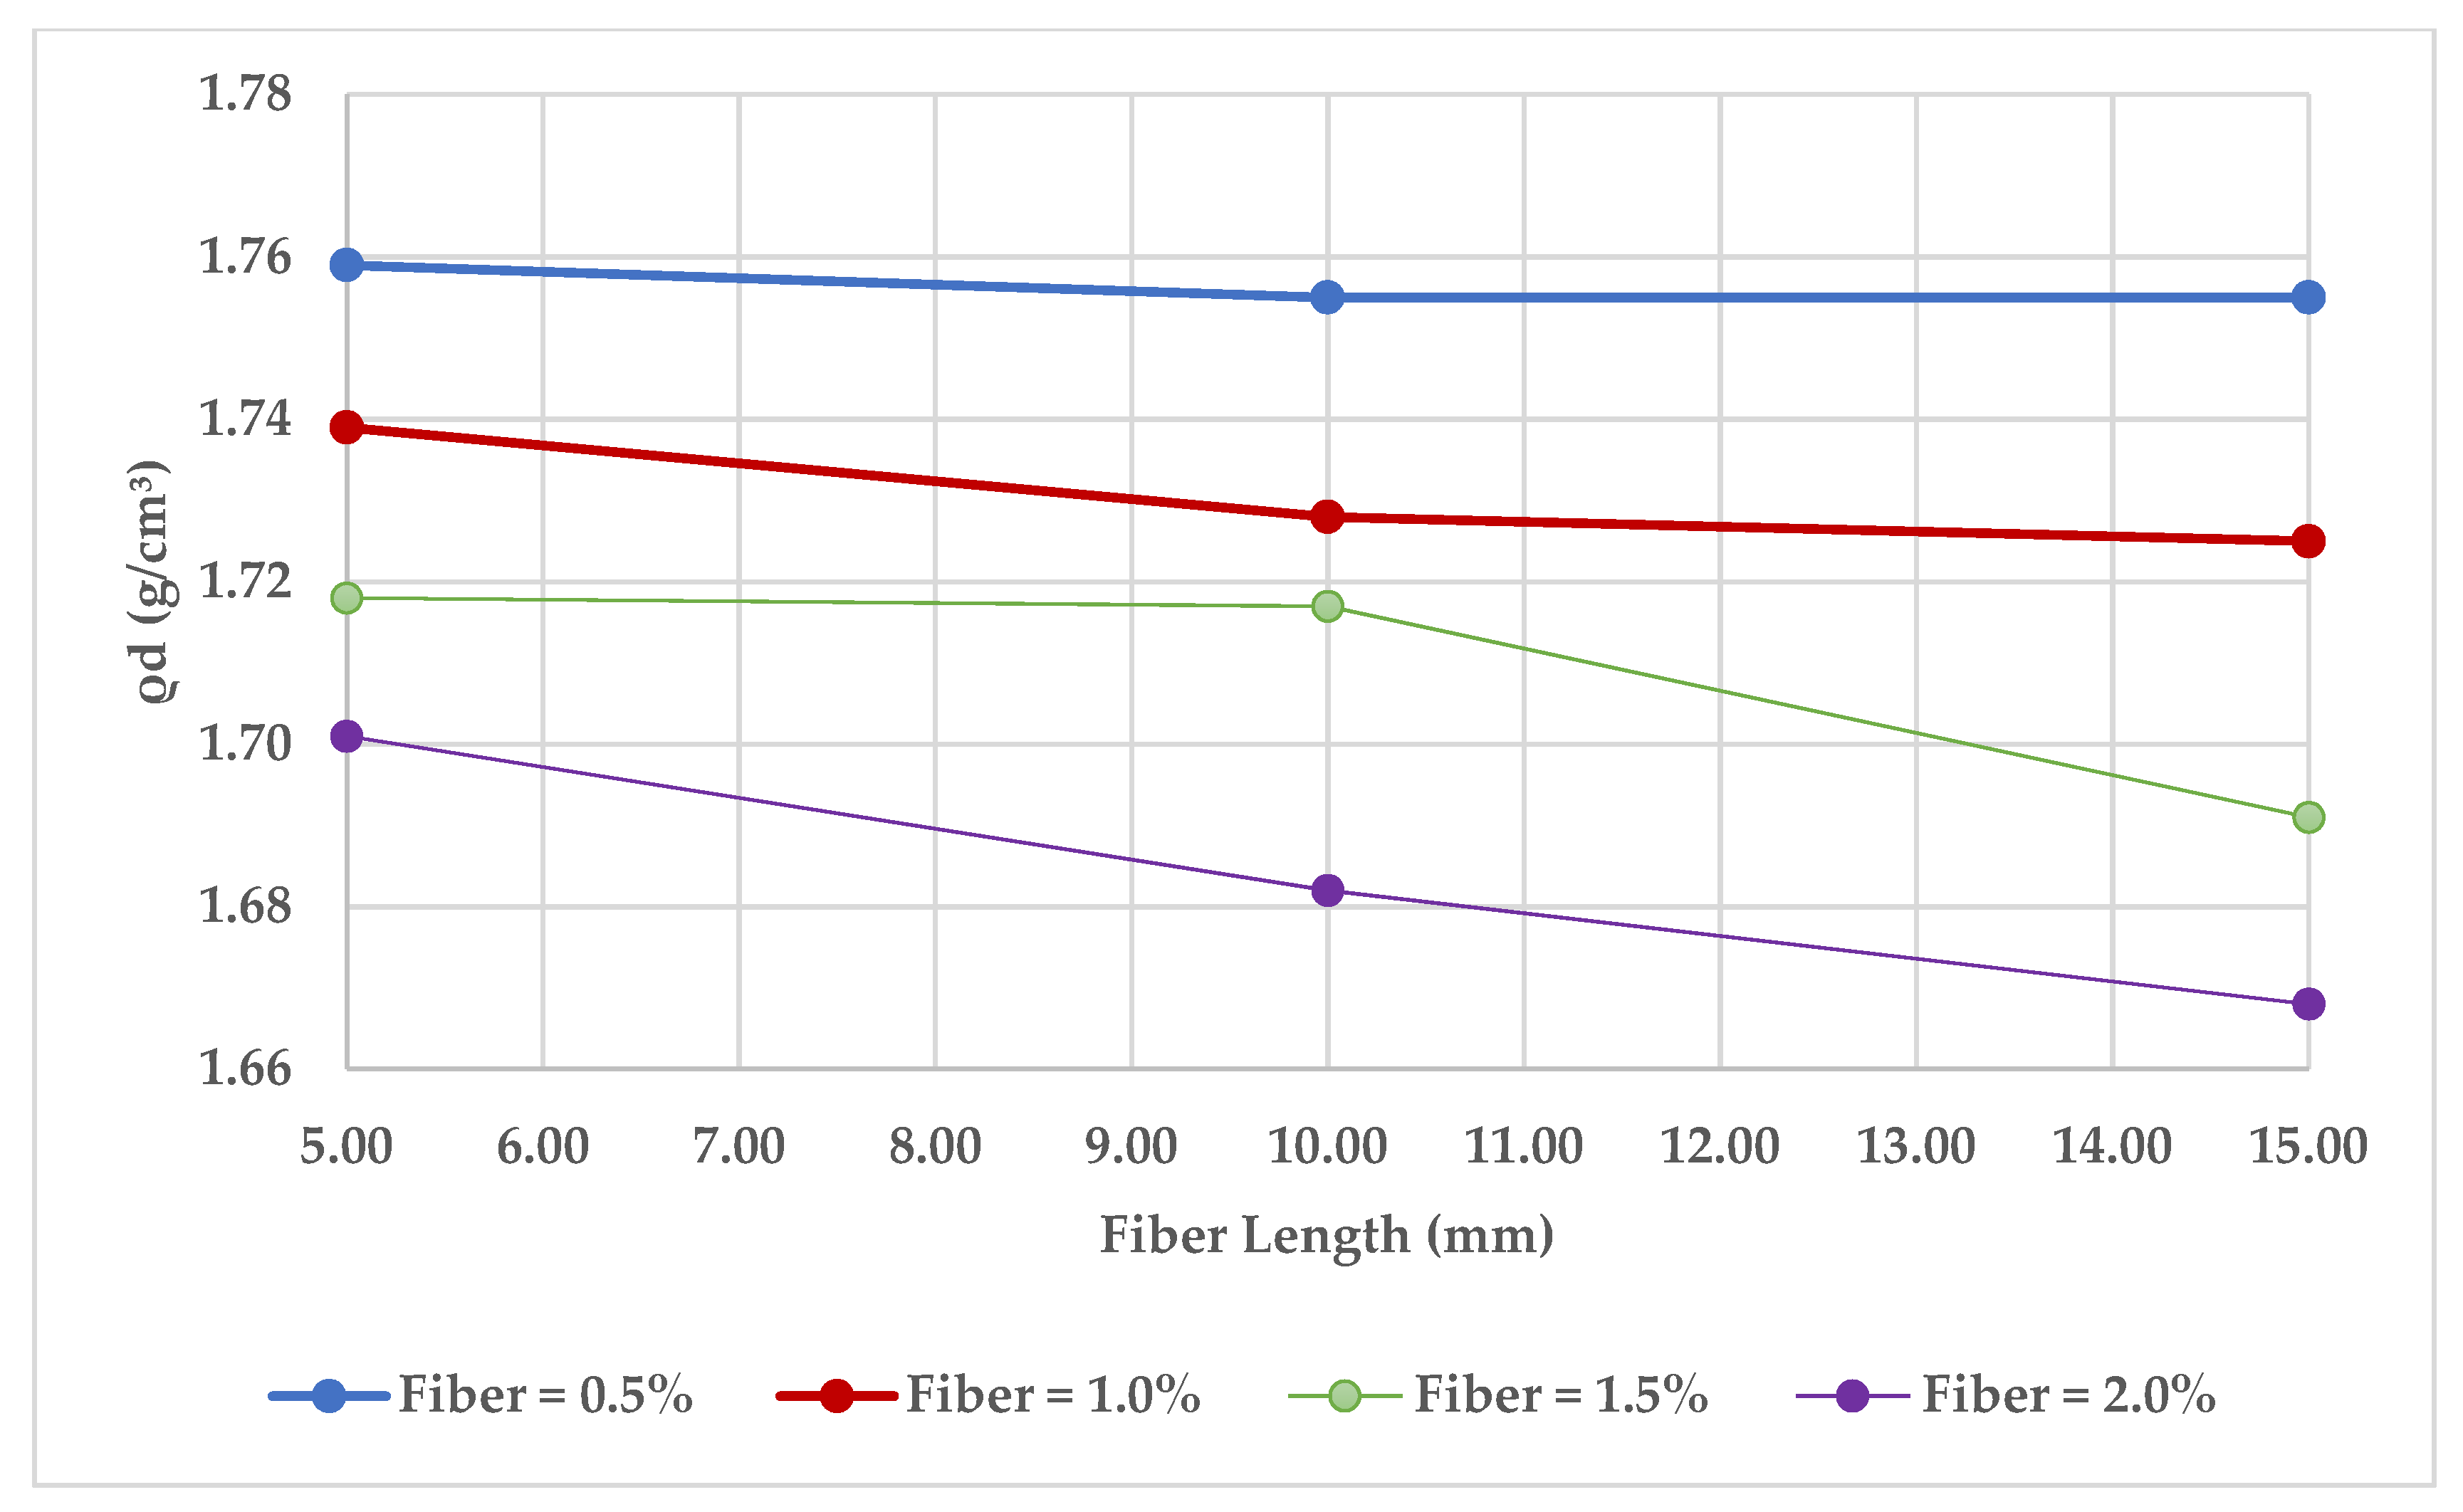
3.1. Compaction Behavior
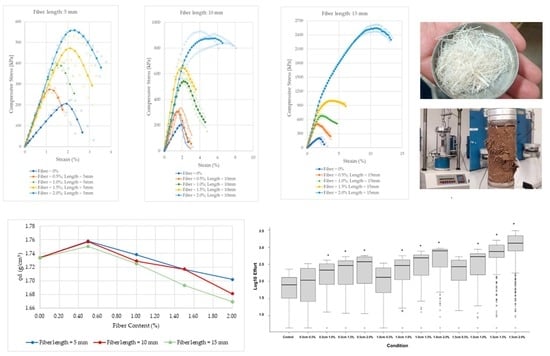
3.2. Unconfined Compression Strength
3.3. Linear Mixed Models with REML and Log10 Transformation
4. Discussion
5. Conclusions
Author Contributions
Funding
Data Availability Statement
Acknowledgments
Conflicts of Interest
References
- Gaafer, M.; Bassioni, H.; Mostafa, T. Soil Improvement Techniques. Int. J. Sci. Eng. Res. 2015, 6, 217–222. [Google Scholar]
- Rico, A.; del Castillo, H. La Ingeniería de suelos en las vías terrestres 2: Carreteras, ferrocarriles y autopistas; Editorial Limusa: Ciudad de México, México, 2012. [Google Scholar]
- Wang, Z.; Zhang, N.; Cai, G.; Jin, Y.; Ding, N.; Shen, D. Review of ground improvement using microbial induced carbonate precipitation (MICP). Mar. Georesour. Geotechnol. 2017, 35, 1135–1146. [Google Scholar] [CrossRef]
- Hamdan, N.; Kavazanjian, E.; Rittmann, B.E.; Karatas, I. Carbonate Mineral Precipitation for Soil Improvement Through Microbial Denitrification. Geomicrobiol. J. 2017, 34, 139–146. [Google Scholar] [CrossRef] [Green Version]
- Kheira, N.; Ahmed, A. A Direct Shear Investigation on the Determination of the Shearing Resistance of Reinforced Soil with Waste Rubber. In Recent Advances in Geo-Environmental Engineering, Geomechanics and Geotechnics, and Geohazards, Advances in Science, Technology & Innovation (IEREK Interdisciplinary Series for Sustainable Development); Springer International Publishing: Berlin/Heidelberg, Germany, 2019; pp. 295–299. [Google Scholar] [CrossRef]
- Rudramurthy, G.; Ramasamy, P.; Rajendran, A. Stabilization of Clayey Soil Using Lime and Prosopis Fibers. In Recent Advances in Geo-Environmental Engineering, Geomechanics and Geotechnics, and Geohazards, Advances in Science, Technology & Innovation (IEREK Interdisciplinary Series for Sustainable Development); Springer International Publishing: Berlin/Heidelberg, Germany, 2019; pp. 259–261. [Google Scholar] [CrossRef]
- Clariá, J.J.; Vettorelo, P. Suelos Reforzados con Fibras: Estado del Arte y Aplicaciones. In Revista Facultad De Ciencias Exactas, Físicas Y Naturales; Universidad Nacional de Córdoba: Córdoba, Argentina, 2014; Volume 1, Available online: https://revistas.unc.edu.ar/index.php/FCEFyN/article/view/6856 (accessed on 20 September 2022).
- Maher, M.H.; Gray, D.H. Static Response of Sands Reinforced with Randomly Distributed Fibers. J. Geotech. Eng. 1990, 116, 1661–1677. [Google Scholar] [CrossRef]
- Ranjan, G.; Vasan, R.M.; Charan, H.D. Probabilistic analysis of randomly distributed fiber-reinforced soil. J. Geotech. Eng. 1996, 122, 419–426. [Google Scholar] [CrossRef]
- Gray, D.H.; Ohashi, H. Mechanics of Fiber Reinforcement in Sand. J. Geotech. Eng. 1983, 109, 335–353. [Google Scholar] [CrossRef]
- Michalowski, R.L.; Čermák, J. Triaxial Compression of Sand Reinforced with Fibers. J. Geotech. Geoenviron. Eng. 2003, 129, 125–136. [Google Scholar] [CrossRef]
- Ibraim, E.; Fourmont, S. Behaviour of sand reinforced with fibres. Solid Mech. Its Appl. 2006, 146, 807–818. [Google Scholar] [CrossRef]
- Jadhao, P.D.; Nagarnaik, P.B. Influence of polypropylene fibers on engineering behavior of soil-fly ash mixtures for road construction. Electron. J. Geotech. Eng. 2008, 13, 1–11. [Google Scholar]
- Wu, Y.K.; Li, Y.B.; Niu, B. Investigation of mechanical properties of randomly distributed sisal fibre reinforced soil. Mater. Res. Innov. 2014, 18, S2-953–S2-959. [Google Scholar] [CrossRef]
- Babu, G.L.S.; Vasudevan, A.K. Strength and stiffness response of coir fiber-reinforced tropical soil. J. Mater. Civ. Eng. 2008, 20, 571–577. [Google Scholar] [CrossRef]
- Gray, D.; Al-Refeai, T.O. Behavior of fabric- versus fiber-reinforced sand. J. Geotech. Engrg. 1986, 112, 804–820. [Google Scholar] [CrossRef]
- Al-Refeai, T.O. Behavior of granular soils reinforced with discrete randomly oriented inclusions. Geotext. Geomembr. 1991, 10, 319–333. [Google Scholar] [CrossRef]
- Eldesouky, H.M.; Morsy, M.M.; Mansour, M.F. Fiber-reinforced sand strength and dilation characteristics. Ain Shams Eng. J. 2016, 7, 517–526. [Google Scholar] [CrossRef] [Green Version]
- Li, C. Mechanical Response of Fiber-Reinforced Soil; The University of Texas at Austin: Austin, TX, USA, 2005; pp. 122–134. [Google Scholar]
- Jiesheng, L.; Juan, Z.; Lin, X. Deformation and strength characteristics of sisal fibrous soil. Electron. J. Geotech. Eng. 2014, 19, 1585–1594. [Google Scholar]
- Freitag, D.R. Soil Randomly Reinforced with Fibers. J. Geotech. Eng. 1986, 112, 823–826. [Google Scholar] [CrossRef]
- Tran, K.Q.; Satomi, T.; Takahashi, H. Effect of waste cornsilk fiber reinforcement on mechanical properties of soft soils. Transp. Geotech. 2018, 16, 76–84. [Google Scholar] [CrossRef]
- Kumar, A.; Walia, B.S.; Mohan, J. Compressive strength of fiber reinforced highly compressible clay. Constr. Build Mater. 2006, 20, 1063–1068. [Google Scholar] [CrossRef]
- Maher, M.H.; Ho, Y.C. Mechanical properties of kaolinite fiber soil composite. J. Geotech. Eng. ASCE 1994, 120, 1381–1393. [Google Scholar] [CrossRef]
- Maity, J.; Chattopadhyay, B.C.; Mukherjee, S.P. Improvement of Characteristics of Clayey Soil Mixed with Randomly Distributed Natural Fibers. J. Inst. Eng. Ser. A 2018, 99, 55–65. [Google Scholar] [CrossRef]
- Subramani, T.; Udayakumar, D. Experimental Study on Stabilization of Clay Soil Using Coir Fibre. Int. J. Appl. Innov. Eng. Manag. 2016, 5, 192–204. [Google Scholar]
- Tang, C.; Shi, B.; Gao, W.; Chen, F.; Cai, Y. Strength and mechanical behavior of short polypropylene fiber reinforced and cement stabilized clayey soil. Geotext. Geomembr. 2007, 25, 194–202. [Google Scholar] [CrossRef]
- Gregory, G. Shear Strength, Creep and Stability of Fiber -Reinforced Soil Slopes; Oklahoma State University: Stillwater, OK, USA, 2006. [Google Scholar]
- Diambra, A.; Ibraim, E.; Wood, D.M.; Russell, A.R. Fibre reinforced sands: Experiments and modelling. Geotext. Geomembr. 2010, 28, 238–250. [Google Scholar] [CrossRef]
- Puppala, A.J.; Musenda, C. Effects of fiber reinforcement on strength and volume change in expansive soils. Transp. Res. Rec. 2000, 1736, 134–140. [Google Scholar] [CrossRef]
- Tampi, R.; Parung, H.; Djamaluddin, R.; Amiruddin, A. Elasticity modulus concrete of abaca fiber. IOP Conf. Ser. Earth Environ. Sci. 2020, 473, 012146. [Google Scholar] [CrossRef]
- Tampi, R.; Parung, H.; Djamaluddin, R.; Amiruddin, A.A. Reinforced concrete mixture using abaca fiber. IOP Conf. Ser. Earth Environ. Sci. 2020, 419, 012060. [Google Scholar] [CrossRef]
- Delicano, J.A. A review on abaca fiber reinforced composites. Compos. Interfaces 2018, 25, 1039–1066. [Google Scholar] [CrossRef]
- Kumar, A.M.; Parameshwaran, R.; Rajasekar, R. Effect of abaca reinforced polymer composite on dynamic mechanical analysis. Colloid Polym. Sci. 2021, 299, 1657–1667. [Google Scholar] [CrossRef]
- Alcaraz, É.; Nitiu, D.; Mallo, A. Characterization of vegetable fibers in papers used in restoration: Abacá and Japanese paper|Caracterización de fibras vegetales en papeles usados en restauración: Abacá y Papel Japón. Bol. De La Soc. Argent. De Bot. 2022, 57, 153–165. [Google Scholar] [CrossRef]
- Kumar, N.; Kumar, S.; Grewal, J.S.; Mehta, V.; Ali, S. Comparative study of Abaca fiber and Kevlar fibers based brake friction composites. Polym. Compos. 2022, 43, 730–740. [Google Scholar] [CrossRef]
- Pranoto, Y.; Suryono, J.; Rahman, L.H. Study of Utilizations Abaca Fibre with Kalimantan Local Material on the Concrete Compressive and Flexural Strength. IOP Conf. Ser. Earth Environ. Sci. 2021, 832, 012028. [Google Scholar] [CrossRef]
- D6913-17; Standard Test Methods for Particle-Size Distribution (Gradation) of Soils Using Sieve. ASTM: West Conshohocken, PA, USA, 2017; Volume 4. [CrossRef]
- D7928-21; Standard Test Method for Particle-Size Distribution (Gradation) of Fine-Grained Soils Using the Sedimentation (Hydrometer) Analysis. ASTM: West Conshohocken, PA, USA, 2021; pp. 1–25. [CrossRef]
- D2487-17; Standard Practice for Classification of Soils for Engineering Purposes (Unified Soil Classification System. ASTM: West Conshohocken, PA, USA, 2017; Volume 3, pp. 1–10. [CrossRef]
- D1557-12; Standard Test Methods for Laboratory Compaction Characteristics of Soil Using. ASTM: West Conshohocken, PA, USA, 2021. [CrossRef]
- Khatri, V.N.; Dutta, R.K.; Katre, S. Shear strength, bearing ratio and settlement behavior of clay reinforced with chemically treated coir fibres. Jordan J. Civ. Eng. 2017, 11, 659–679. [Google Scholar] [CrossRef]
- D2166-16; Standard Test Method for Unconfined Compressive Strength of Cohesive Soil. ASTM: West Conshohocken, PA, USA, 2016; pp. 1–7. [CrossRef]
- Bates, D.; Mächler, M.; Bolker, B.M.; Walker, S.C. lme4: Mixed-effects modeling with R. J. Stat. Softw. 2015, 67, 48. [Google Scholar] [CrossRef]
- Kuznetsova, A.; Brockhoff, P.B.; Christensen, R.H.B. lmerTest Package: Tests in Linear Mixed Effects Models. J. Stat. Softw. 2017, 82, 1–26. [Google Scholar] [CrossRef] [Green Version]
- Fox, J.; Weisberg, S.; Price, H.; Adler, D.; Bates, D.; Baud-Bovy, G.; Bolker, B.; Ellison, S.; Firth, D.; Friendly, M.; et al. Package ‘Car’; R Foundation for Statistical Computing: Vienna, Austria, 2012. [Google Scholar]
- Prabakar, J.; Sridhar, R.S. Effect of random inclusion of sisal fibre on strength behaviour of soil. Constr. Build Mater. 2002, 16, 123–131. [Google Scholar] [CrossRef]
- Jaramillo, N.A.D.; Ferreira, J.W.d.S.; Malko, J.A.C.; Casagrande, M.D.T. Mechanical Behavior of Clayey Soil Reinforced with Recycled Tire Rubber Using Chips and Fibers. Geotech. Geol. Eng. 2022, 40, 3365–3378. [Google Scholar] [CrossRef]
- Lawer, A.K.; Ampadu, S.I.K.; Owusu-Nimo, F. The effect of randomly distributed natural fibers on some geotechnical characteristics of a lateritic soil. SN Appl. Sci. 2021, 3, 642. [Google Scholar] [CrossRef]


| Soil Properties | Values |
|---|---|
| Specific Gravity | 2.66 |
| Water Content | 8.54% |
| Atterberg limits | |
| Liquid Limit | Nonplastic |
| Plastic Limit | Nonplastic |
| Plastic Index | Nonplastic |
| USCS Classification | ML |
| AASHTO Classification | A-4(0) |
| Grain Size Analysis | |
| Gravel | 0.0% |
| Sand | 42.7% |
| Silt | 55.8% |
| Clay | 1.5% |
| Optimum Water Content | 15.4% |
| Maximum Dry Density | 1.734 g/cm3 |
| Fiber Properties | Values |
|---|---|
| Linear Density | 40.9 Tex * |
| Water Content | 6.11% |
| Tenacity | 52.5 Cn/Tex |
| Breaking Load | 21.4 N |
| Strain at Break | 1.74% |
| Chemical Properties | Values |
|---|---|
| Cellulose | 63.35% |
| Hemicellulose | 18.30% |
| Lignin | 6.30% |
| Ash Content | 0.76% |
| Fats | 1.24% |
| Mixture No. | Fiber Content (%) | Fiber Length (mm) | Minimum No. of Specimens |
|---|---|---|---|
| 1 | 0 | 0 | 2 |
| 2 | 0.5 | 5 | 2 |
| 3 | 1.0 | 5 | 2 |
| 4 | 1.5 | 5 | 2 |
| 5 | 2.0 | 5 | 2 |
| 6 | 0.5 | 10 | 2 |
| 7 | 1.0 | 10 | 2 |
| 8 | 1.5 | 10 | 2 |
| 9 | 2.0 | 10 | 2 |
| 10 | 0.5 | 15 | 2 |
| 11 | 1.0 | 15 | 2 |
| 12 | 1.5 | 15 | 2 |
| 13 | 2.0 | 15 | 2 |
| Random Effects | |||||
| Groups | Variance | Std.Dev. | |||
| ID | 0.005 | 0.071 | |||
| Residual | 0.326 | 0.571 | |||
| Fixed Effects | |||||
| Indicator | Estimate | Std. Error | Df | t value | Pr(>|t|) |
| (Intercept) | 1.78 | 0.08 | 136.39 | 22.83 | <0.0001 |
| 0.5 cm and 0.5% | 0.10 | 0.11 | 125.37 | 0.87 | 0.39 |
| 0.5 cm and 1% | 0.34 | 0.11 | 141.60 | 3.08 | 0.00 |
| 0.5 cm and 1.5% | 0.42 | 0.11 | 124.62 | 3.86 | 0.00 |
| 0.5 cm and 2% | 0.49 | 0.11 | 107.21 | 4.42 | 0.00 |
| 1 cm and 0.5% | 0.20 | 0.10 | 127.99 | 1.98 | 0.05 |
| 1 cm and 1% | 0.47 | 0.10 | 99.55 | 4.67 | 0.00 |
| 1 cm and 1.5% | 0.64 | 0.10 | 99.22 | 6.32 | 0.00 |
| 1 cm and 2% | 0.80 | 0.10 | 73.86 | 7.88 | 0.00 |
| 1.5 cm and 0.5% | 0.44 | 0.11 | 117.43 | 4.17 | 0.00 |
| 1.5 cm and 1% | 0.64 | 0.10 | 98.46 | 6.32 | 0.00 |
| 1.5 cm and 1.5% | 0.90 | 0.09 | 81.89 | 9.72 | 0.00 |
| 1.5 cm and 2% | 1.13 | 0.09 | 74.97 | 12.61 | <0.0001 |
| Random Effects | |||||
| Groups | Variance | Std.Dev. | |||
| ID | 0.007 | 0.082 | |||
| Residual | 0.076 | 0.276 | |||
| Fixed Effects | |||||
| Indicator | Estimate | Std. Error | df | t value | Pr(>|t|) |
| (Intercept) | 0.34 | 0.05 | 62.76 | 6.46 | 0.00 |
| 0.5 cm and 0.5% | 0.02 | 0.08 | 62.92 | 0.26 | 0.80 |
| 0.5 cm and 1% | −0.02 | 0.08 | 63.86 | −0.31 | 0.76 |
| 0.5 cm and 1.5% | −0.02 | 0.07 | 59.90 | −0.22 | 0.83 |
| 0.5 cm and 2% | −0.01 | 0.08 | 55.20 | −0.09 | 0.93 |
| 1 cm and 0.5% | 0.04 | 0.07 | 60.67 | 0.58 | 0.56 |
| 1 cm and 1% | 0.13 | 0.07 | 53.31 | 1.77 | 0.08 |
| 1 cm and 1.5% | 0.10 | 0.07 | 53.59 | 1.44 | 0.16 |
| 1 cm and 2% | 0.18 | 0.08 | 46.54 | 2.35 | 0.02 |
| 1.5 cm and 0.5% | 0.02 | 0.07 | 58.46 | 0.30 | 0.77 |
| 1.5 cm and 1% | 0.11 | 0.07 | 53.29 | 1.56 | 0.12 |
| 1.5 cm and 1.5% | 0.29 | 0.07 | 49.55 | 4.34 | 0.00 |
| 1.5 cm and 2% | 0.39 | 0.07 | 47.00 | 5.89 | 0.00 |
| Fiber Length (mm) | Fiber Content (%) | Elastic Modulus (kPa) |
|---|---|---|
| 0 | 0 | 12,445 |
| 5 | 0.5 | 26,140 |
| 1 | 29,853 | |
| 1.5 | 26,852 | |
| 2 | 31,150 | |
| 10 | 0.5 | 26,578 |
| 1 | 30,844 | |
| 1.5 | 45,657 | |
| 2 | 33,630 | |
| 15 | 0.5 | 40,932 |
| 1 | 38,288 | |
| 1.5 | 48,316 | |
| 2 | 52,347 |
Publisher’s Note: MDPI stays neutral with regard to jurisdictional claims in published maps and institutional affiliations. |
© 2022 by the authors. Licensee MDPI, Basel, Switzerland. This article is an open access article distributed under the terms and conditions of the Creative Commons Attribution (CC BY) license (https://creativecommons.org/licenses/by/4.0/).
Share and Cite
Albuja-Sánchez, J.; Alcívar, E.; Escobar, D.; Montero, J.; Realpe, G.; Muñoz, A.; Peñaherrera-Aguirre, M. Influence of Abaca Fiber Inclusion on the Unconfined Compressive Strength of Reconstituted Sandy Silts. Fibers 2022, 10, 99. https://doi.org/10.3390/fib10110099
Albuja-Sánchez J, Alcívar E, Escobar D, Montero J, Realpe G, Muñoz A, Peñaherrera-Aguirre M. Influence of Abaca Fiber Inclusion on the Unconfined Compressive Strength of Reconstituted Sandy Silts. Fibers. 2022; 10(11):99. https://doi.org/10.3390/fib10110099
Chicago/Turabian StyleAlbuja-Sánchez, Jorge, Eduardo Alcívar, Daniela Escobar, Juan Montero, Guillermo Realpe, Andrés Muñoz, and Mateo Peñaherrera-Aguirre. 2022. "Influence of Abaca Fiber Inclusion on the Unconfined Compressive Strength of Reconstituted Sandy Silts" Fibers 10, no. 11: 99. https://doi.org/10.3390/fib10110099