Article

In Situ Preparation and Corrosion Resistance of a ZrO2 Film on a ZrB2 Ceramic

State Key Laboratory of Advanced Technology for Materials Synthesis and Processing, Wuhan University of Technology, Wuhan 430070, China
*
Author to whom correspondence should be addressed.
Coatings 2019, 9(7), 455; https://doi.org/10.3390/coatings9070455
Submission received: 15 June 2019 / Revised: 12 July 2019 / Accepted: 18 July 2019 / Published: 21 July 2019

Abstract

:
ZrO2 films were in situ prepared using the anodic passivation of a ZrB2 ceramic in alkaline solutions. The composition and structure of the films were characterized using field-emission scanning electron microscopy (FE-SEM), Raman spectroscopy, and X-ray photoelectron spectroscopy (XPS). The corrosion resistances were evaluated in 0.1 M oxalate solution using the potentiodynamic polarization method (PDP) and the electrochemical impedance spectroscopy (EIS) technique. The results show that ZrO2 films can be prepared using anodization from −0.8 to 0.8 V standard hydrogen electrode (SHE) in 2–16 M NaOH solutions. During the anodization, the dehydration reaction of Zr(OH)4 to ZrO2 caused the volume shrinkage and tensile stress of the films. When the thickness of the films exceeded a critical value, the mud-cracking morphology occurred. The films without cracks exhibited the inhibition effect and provided effective corrosion protection in a 0.1 M H2C2O4 solution, which had a positive correlation with the film thickness. The film obtained when put in an 8 M NaOH solution (near the critical thickness) was found to significantly improve its corrosion resistance when put in a 0.1 M H2C2O4 solution by almost one order of magnitude compared with the bare ceramic.

1. Introduction

Zirconia (ZrO2), an important engineering material, has been widely applied due to its excellent comprehensive performance such as good mechanical properties, chemical inertness, good oxidation resistance and biocompatibility [1,2,3]. When used as a coating or film material, its applications include antireflection coatings for laser diodes [4], electrode coatings for lithium-ion batteries [5], and various anti-corrosion films [6], all of which are widely researched.
The preparation methods for ZrO2 coatings, such as the hydrothermal treatment [6], sol-gel method [7], physical vapor deposition [8], electrodeposition [9] and spraying techniques [10] are highly developed. Among the existing methods, the in situ reaction technique is characterized by its uniform coating and the perfect bonding with the substrate. Accordingly, the coatings have important and unique applications. For example, Zhang et al. [11] prepared a Zr/ZrO2 electrode using in situ oxidation of Zr wire in a Na2CO3 melt to form a thin-film on the surface. This electrode can be used as a novel Zr/ZrO2 sensor for the in situ measurement of chemical parameters of deep-sea water. Yang et al. [12] obtained a close-packed nanoporous ZrO2 layer formed on the surface of zirconium alloy using anodization. It dramatically improves the oxidation resistance in a high-temperature steam environment compared with a bare Zr alloy.
The application of a ZrO2 film is primarily determined by the substrate. A Zr alloy is the leading substrate for the in situ method and thus constrains the application of in situ ZrO2 films. However, other substrates besides Zr alloys have been the subject of limited reports in recent years. ZrB2, a non-alloy, was reported as a substrate [13]. ZrB2 powder could be coated with ZrO2 and B2O3 films using high-energy ball milling. Such a coated powder promotes the densification of a ZrB2 ceramic [13].
A ZrO2 film has excellent corrosion resistance in aqueous solutions. Garg et al. [6] reported various nanocrystalline ZrO2 coatings with different thicknesses grown on pre-oxidized stainless steel using a hydrothermal method in a static autoclave. These coatings significantly improve the corrosion resistance of stainless steel when put in a 0.1 M sodium sulphate solution by almost four orders of magnitude compared with the bare stainless steel. The corrosion resistances of ZrO2 ceramic nanocoatings on superelastic NiTi alloy in Hank’s simulated physiological solution were also evaluated [14]. It was found to prevent the premature failures of NiTi components and nickel release to the human body. Therefore, the ZrO2 film in situ prepared through the anodization of a ZrB2 ceramic is expected to enhance the corrosion resistance of the substrate ZrB2 in aqueous solutions. In addition, the ZrO2 coating would act as a physical barrier and thus reduce or avoid the reaction between ZrB2 and a refractory metal at high temperature [15,16,17]. The refractory metal would thus be preserved and then contribute to preparing a ZrB2-based cermet and improving its toughness.
In this work, the anodic passivation behavior was first studied using the potentiodynamic polarization (PDP) method. Then, the composition and structure of the anodic films were characterized using the field-emission scanning electron microscopy (FE-SEM), Raman, and X-ray photoelectron spectroscopy (XPS) techniques. The corrosion resistances of the anodic films were evaluated in the 0.1 M H2C2O4 solution, which has been reported as one of the most aggressive acids [18].

2. Experimental Procedures

2.1. Materials

The ZrB2 ceramic was produced from commercial powder (Qinhuangdao Eno, Qinhuangdao, China; particle size range 10–15 μm, purity 99.5%). Sintering was carried out by the plasma activated sintering technique (PAS, ED-PAS 111 equipment, Elenix, Zama Shi, Japan) at 1900 °C for 5 min using a pressure of 30 MPa. The final density of ZrB2 ceramic was ~5.8 g·cm−3, corresponding to ~95.6% of its theoretical density. The obtained ceramic surfaces were ground flat by the precision surface grinding machine (Orbit 25EP, Blohm, Hamburg, Germany). It was then cut into several cylindrical specimens (Φ 5 mm × 3 mm) by a wire electrical discharge machine (Wire EDM, BM320-H, Suzhou Baoma, Suzhou, China) in preparation for the working electrodes. More details and properties have been reported in a previous paper [19].

2.2. Film Characterization

The chemical composition of the anodic films was characterized using Raman spectra (Invia, Renishaw, Wotton-under-Edge, UK) and X-ray photoelectron spectroscopy (XPS, ESCALab 250Xi, Thermo Fisher Scientific, Waltham, MA, USA). The Raman spectra was recorded in the range of 100–900 cm−1. A He-Ne laser (632.8 nm) was used as the excitation source. Furthermore, the XPS measurements were performed using an Al Kα (hν = 1486.6 eV) X-ray source powered at 150 W. The high-resolution narrow spectra were recorded with electron pass energy of 30 eV and a step size of 0.05 eV. The peak-fitting of XPS data was achieved using the XPSPEAK program (version 4.1, HongKong, China).
The surface and cross-section morphology were analyzed using FE-SEM (Quanta 250, FEI, Hillsboro, OR, USA) operating at 20 kV. A platinum coating (sputter coater, Q150RES, Quorum Technologies Ltd, Lewes, UK) was performed at 20 mA for 60 s to facilitate high-resolution FE-SEM images. The optical microscope (OM, DM2500M, Leica, Wetzlar, Germany) under normal light was also used to characterize the surface of the anodic film.

2.3. Electrochemical Measurements

The working electrode was prepared from the cylindrical ZrB2 ceramic. The specimen was connected with a copper wire on one face and then embedded in epoxy resin, leaving the circular bottom (Φ 5 mm) to contact the electrolyte. Before being used, the electrodes were abraded with up to 800 grit silicon carbide paper using an automatic polishing machine (Mecatech 334, Presi, Eybens, France), rinsed with distilled water and ethanol, and then dried in air at room temperature for 24 h.
A Pt plate counterelectrode (20 mm × 20 mm × 0.2 mm) and an Hg/HgO/1 M NaOH reference electrode (standard potential of 0.108 V [20], referred to as the standard hydrogen electrode (SHE)) were used for the potentiodynamic polarization (PDP) and the potentiostatic experiments on ZrB2. All potentials quoted in this text are given versus the SHE. All tests were conducted using a CHI604E electrochemical work station (CH Instruments, Chenhua, Shanghai, China) in 2–16 M NaOH solutions at 40 °C.
The polarization curves were recorded at a scanning potential rate of 2 mV·s−1 after the open circuit potential (OCP) was stabilized within 2 mV, starting from −1.3 V versus SHE. A potentiostatic test was carried out for preparing the anodic passive film at 0 V for 10 min after the OCP was stabilized. Then, the working electrode with a passive film was rinsed with water and ethanol, and dried in air at room temperature for 24 h. The passive film was used for a corrosion test in H2C2O4 solution and for surface characterization.
The corrosion test of the passive film when put in a 0.1 M H2C2O4 solution was conducted with a similar three-electrode cell. The Pt plate counterelectrode and Ag/AgCl/saturated KCl reference electrode (the standard potential was 0.198 V versus SHE) were used. Similar polarization curves were recorded at a scanning potential rate of 2 mV·s−1, starting from −0.8 V to 1.4 V versuss SHE. Furthermore, the electrochemical impedance spectroscopy (EIS) experiments were performed at the OCP, within the frequency region of 10−2–105 Hz and with an amplitude 5 mV. The Zsimedemo 3.30 d (Ann Arbor, MI, USA) software was used for fitting the Nyquist plots.

3. Results and Discussion

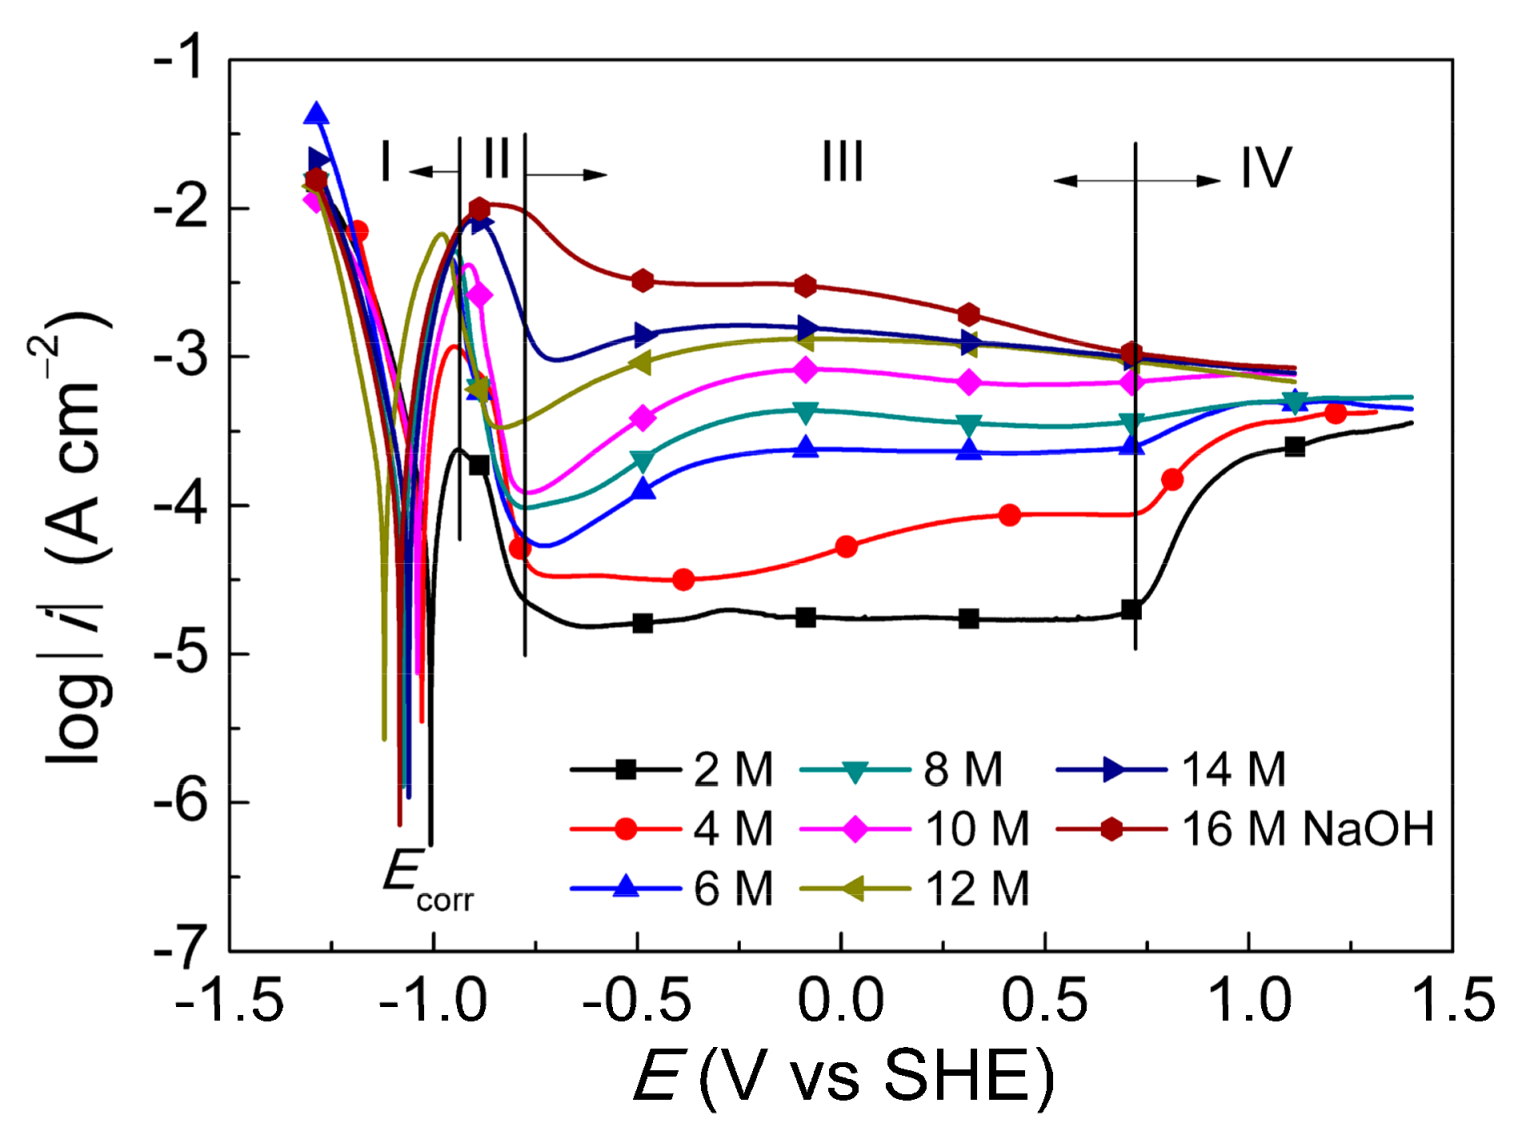
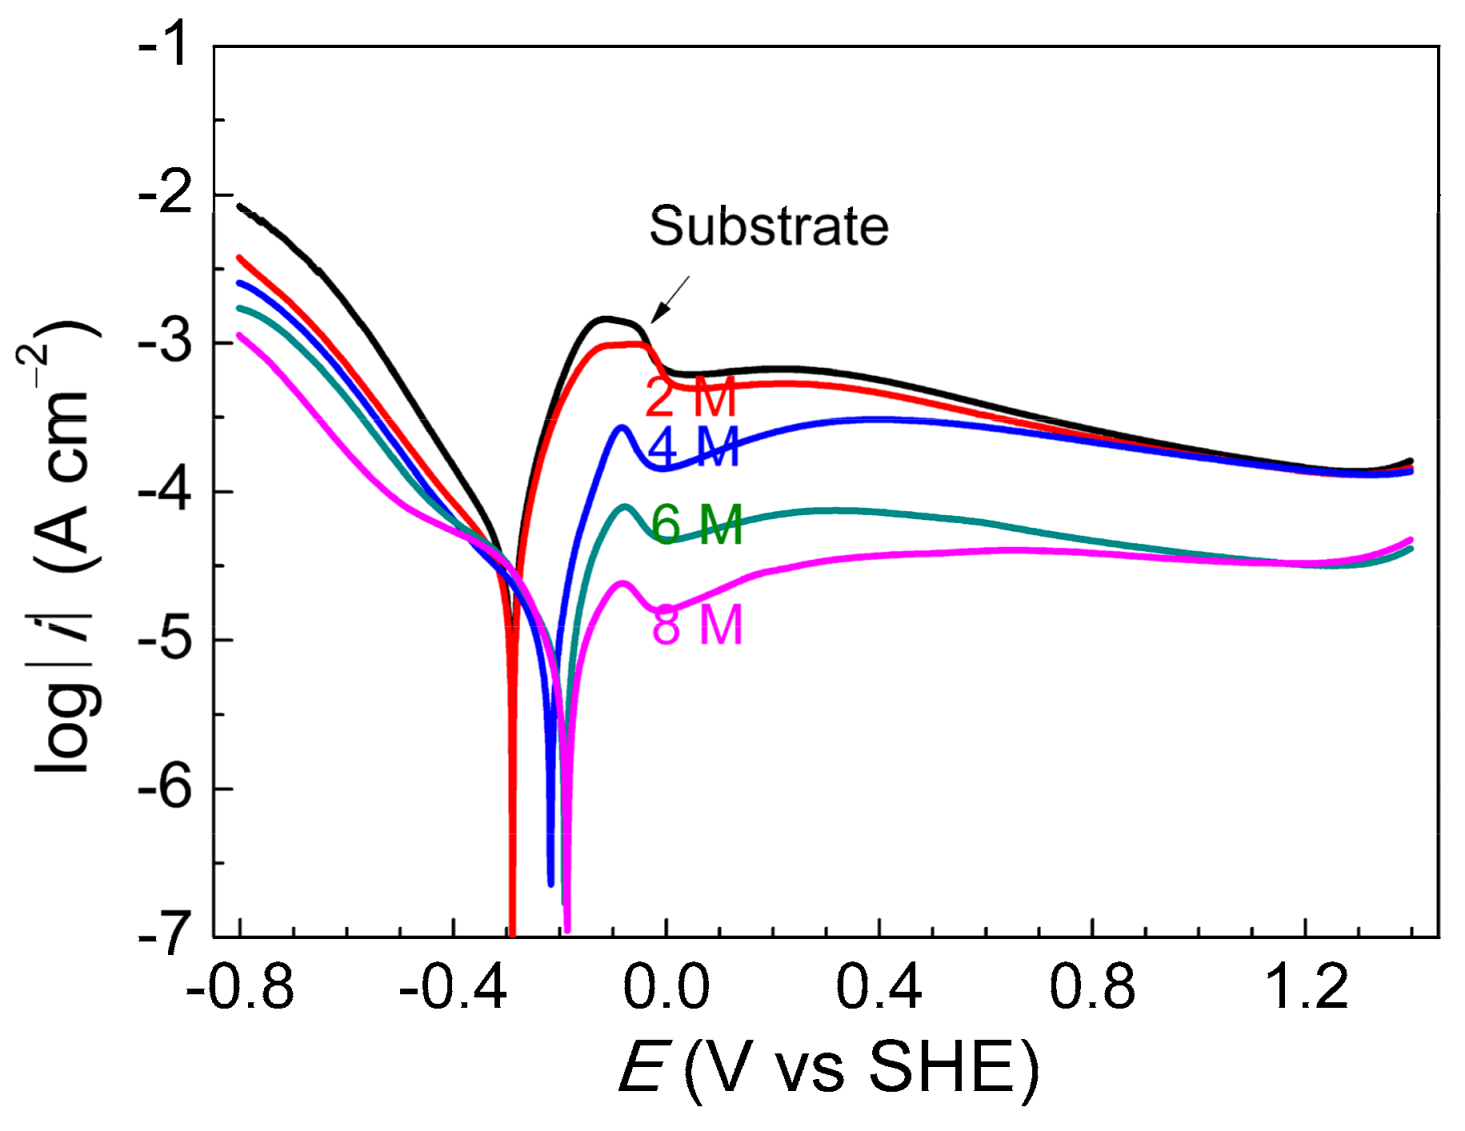
3.1. PDP of ZrB2 in NaOH Solutions

Figure 1 exhibits the PDP curves of ZrB2 ceramic in 2–16 M NaOH solutions. It can be seen that the ZrB2 ceramic exhibited active–passive polarization behavior. The divisions between typical regions, such as the active region (I, below −0.95 V), transition region (II, −0.95 to −0.8 V), passive region (III, −0.8 to 0.8 V), and oxygen evolution region (IV, above 0.8 V), are shown [21,22].
The passive potential region was slightly affected by NaOH concentration. Furthermore, the passive current density ip (10−5–10−3 A·cm−2) increased with the NaOH concentration. Such a high ip (10−4–10−3 A·cm−2, far above 10−5 A·cm−2, >6 M NaOH) might have resulted from the persisting contact with the electrolyte through the cracks or pores of the film [23]; that is to say, the higher the ip, the more defects the film would have.

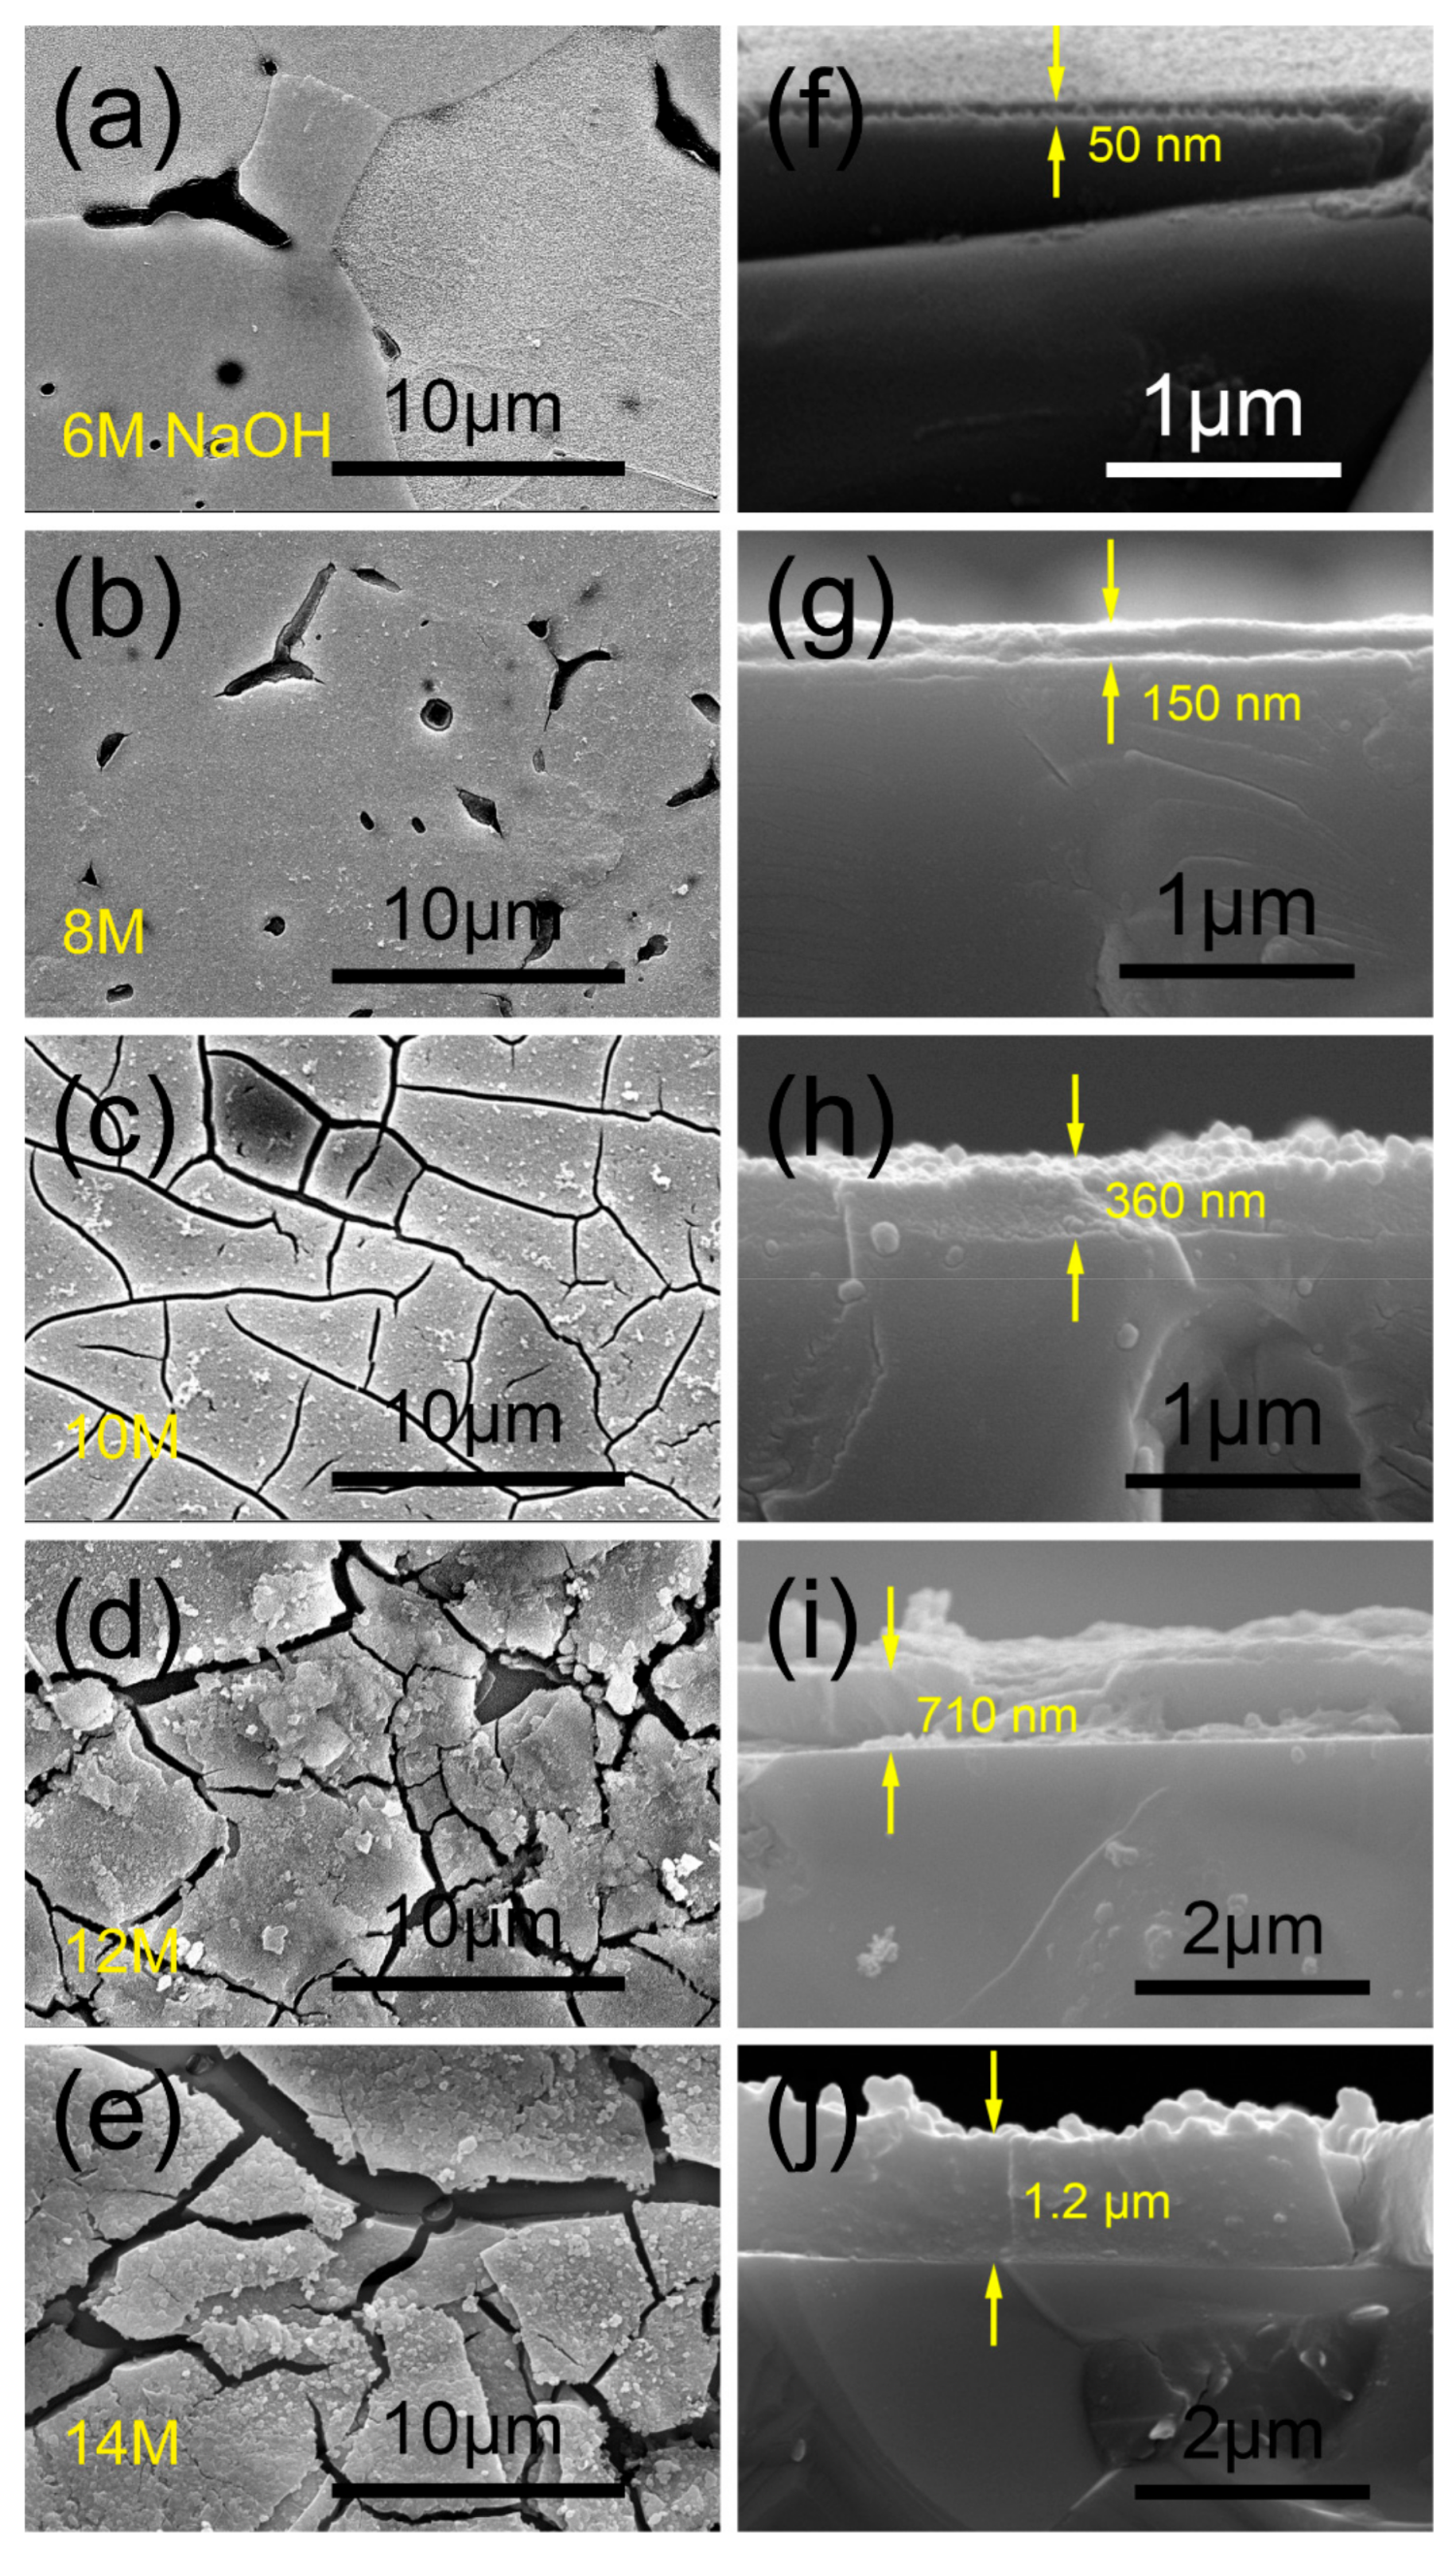
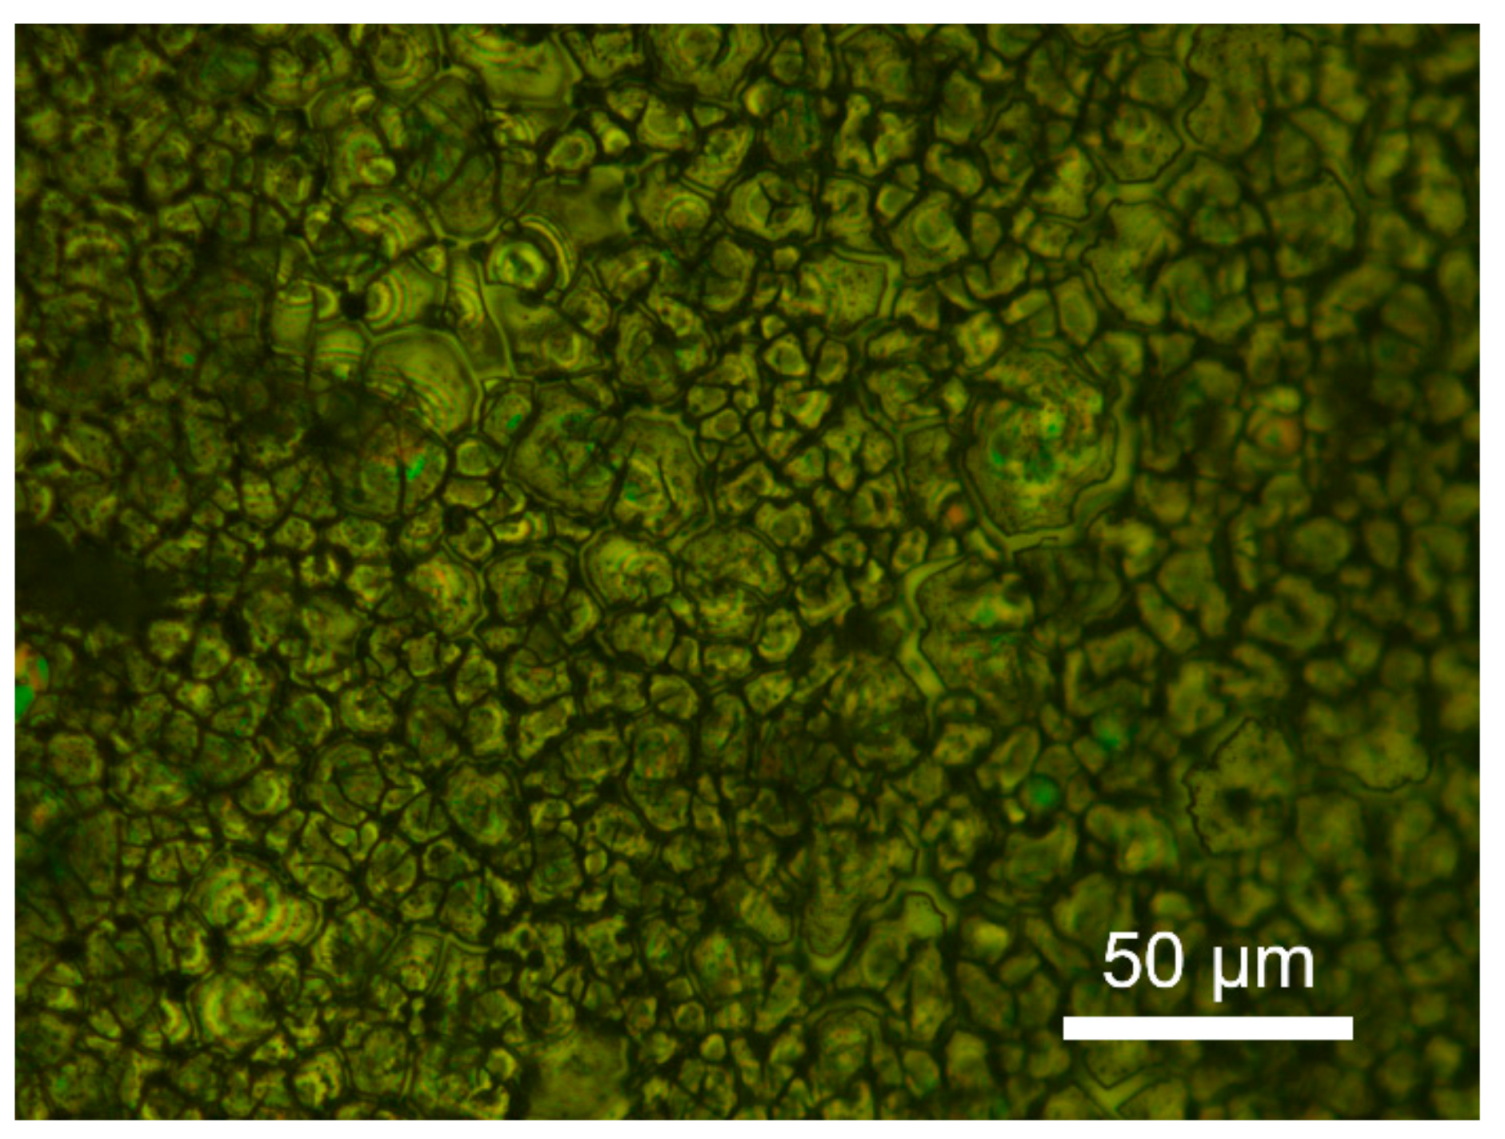
3.2. Morphology of the Anodic Film

Some representative anodic films were prepared using potentiostatic anodization at 0 V for 10 min in different NaOH solutions. Their surfaces and cross-section morphologies are shown in Figure 2. As seen in the cross-section morphologies, there were no cracks in the joint between the film and the substrate, which shows their good combination. The film thickness (50–1200 nm) increased with the increased NaOH concentration, which reflects the same tendency of the film formation rate.
All the specimens were flat in accordance with the polished surface of the matrix. It indicates that the film was transformed due to the ZrB2 surface, i.e., in situ fabricated. However, a noticeable mud-cracking behavior showed a large amount of cracks evenly distributed throughout the surface occurring in the 10 M NaOH solution (Figure 2c). The cracks broadened in 10–14 M NaOH solutions (Figure 2d,f). Such results are consistent with the above analysis of the passive current densities ip. Generally, a temperature gradient or volume shrinkage of the film caused by the dehydration generates tensile stress is responsible for the mud-cracking [24,25,26]. By eliminating the temperature gradient, the latter is the case. When the film thickness exceeds a critical value, the tensile stress is beyond the tensile strength of the films and crack initiation and propagation occurs. The critical thickness of these films was in the region 150–360 nm.
Furthermore, the film in the 6 M NaOH solution exhibited many blocks with different roughnesses, which is similar to the corroded surface under free corrosion [19]. These blocks might result from the free corrosion during the OCP test process, which was conducted before the potentiostatic anodization step in order to test the system stabilization. The anodization process without the OCP process was conducted and the corresponding surface is shown in Figure 3. It is shown that the different blocks disappeared, indicating the blocks were derived from the OCP step.

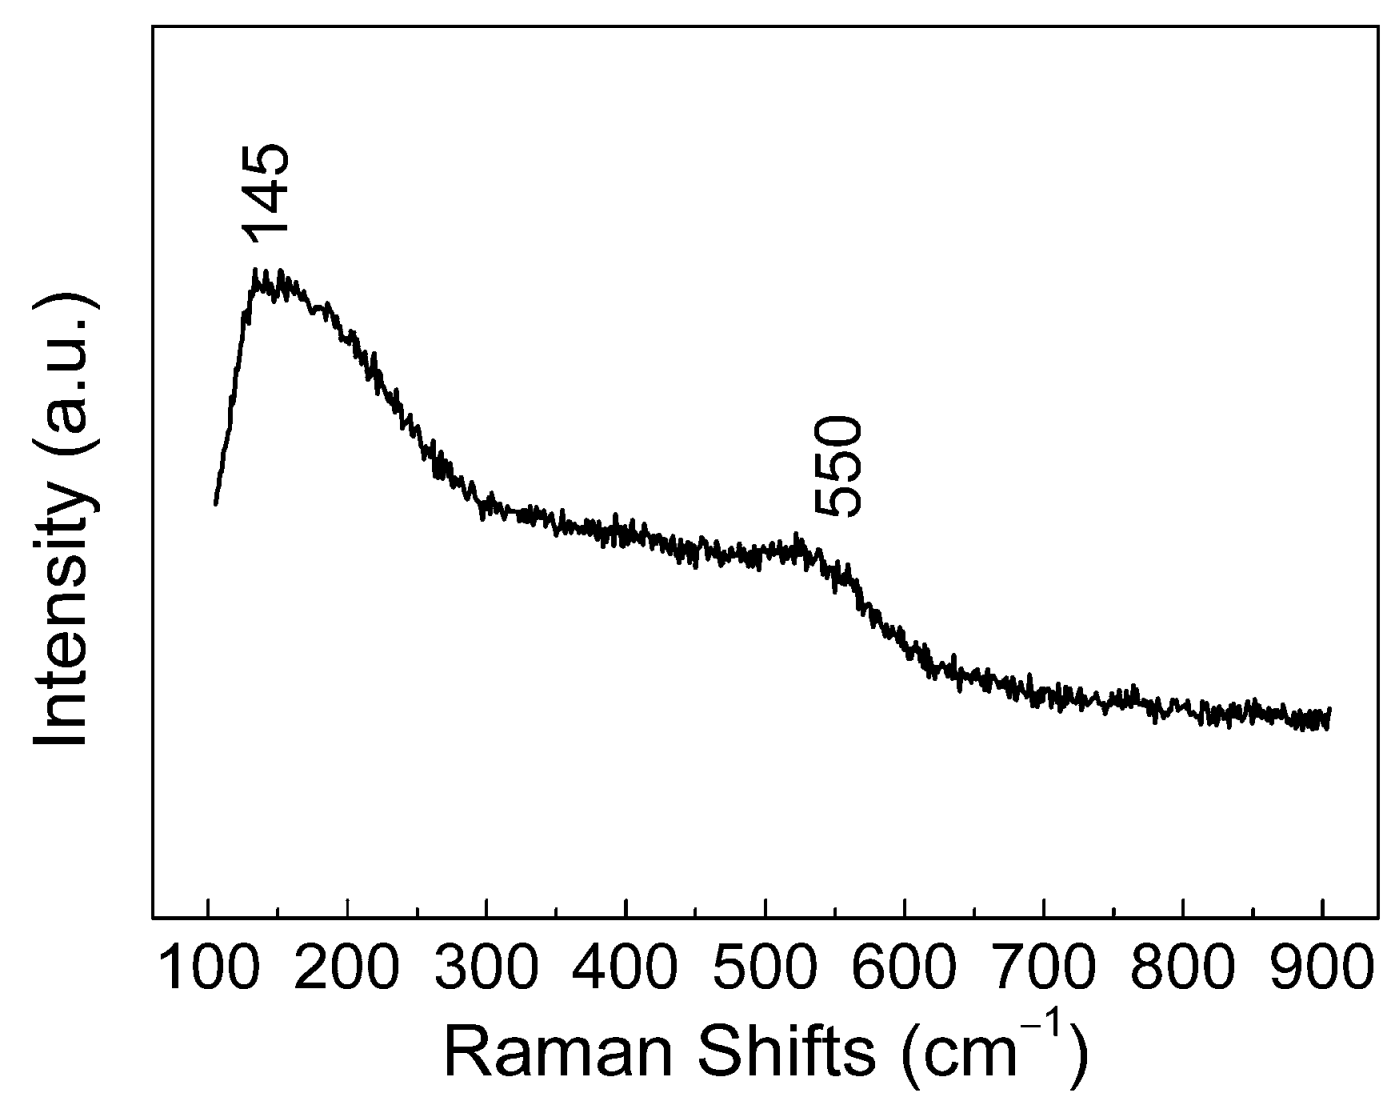
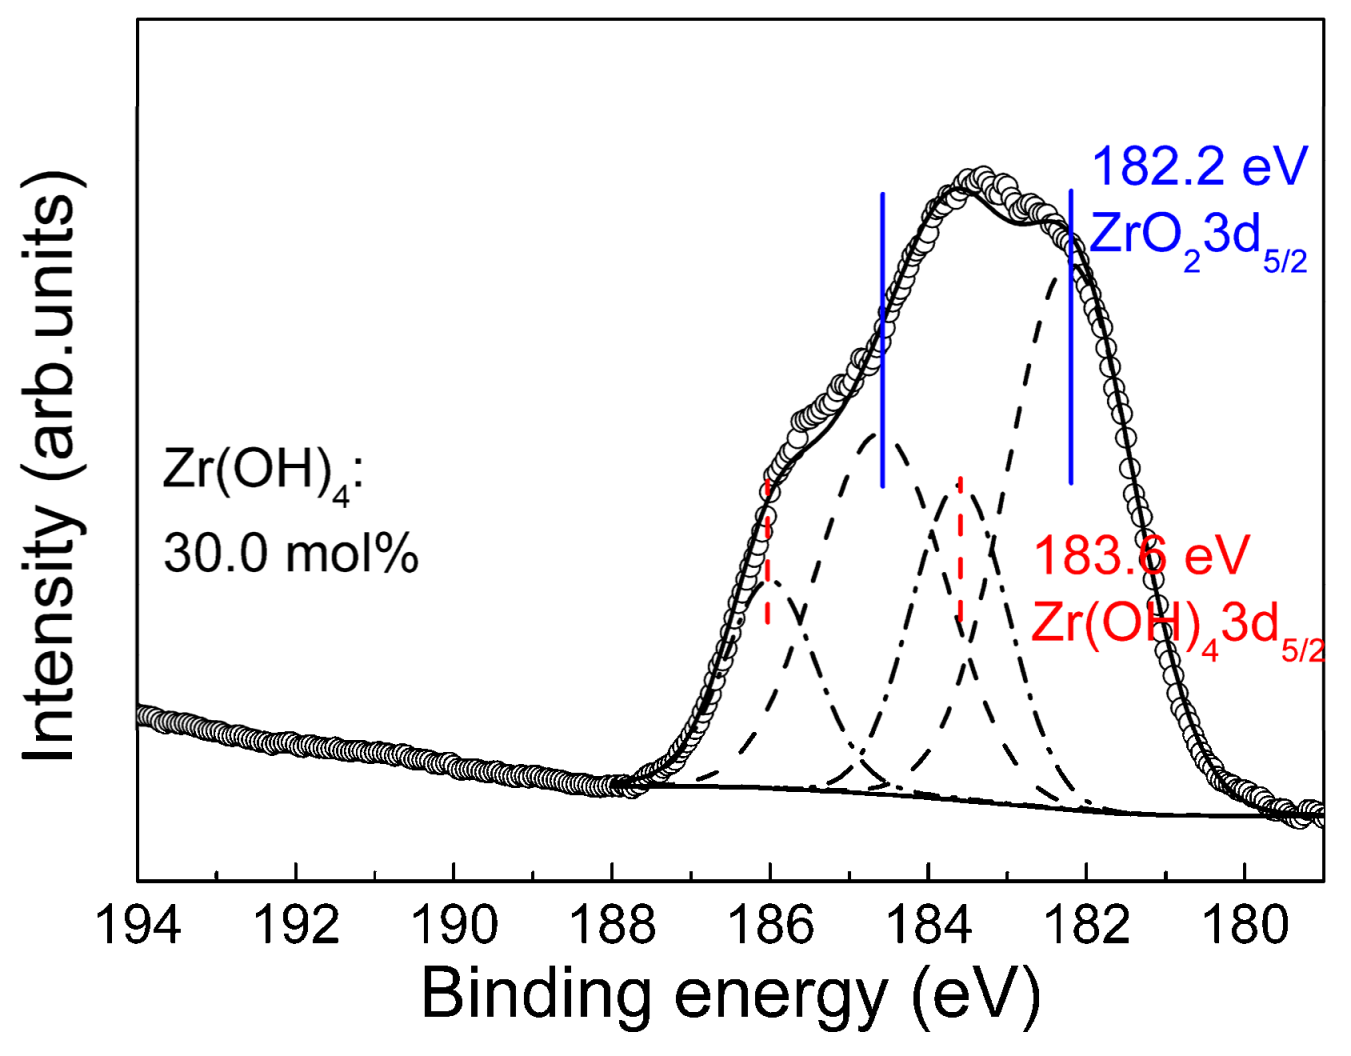
3.3. Composition of the Anodic Films

Figure 4 shows the Raman spectra of the anodic films obtained when put in a 10 M NaOH solution at 40 °C. It shows two broad peaks at 145 and 550 cm−1, which is characteristic of amorphous ZrO2 [27]. The characteristic peaks of B-containing products [28] are not found in the Raman spectra. In our previous work [19], the polyborate ions, which have highest oxidation state (oxidation number is +3) are produced at the corrosion potential and dissolved in the alkaline solution. At the higher potential, the B-containing products also have the same oxidation state and dissolve in the alkaline solution.
Figure 5 shows the B 1s and Zr 3d XPS spectra of the above film. No peaks were found in the range of 187–194 eV that belong to the B 1s spectra [18]. This indicates that the element boron was completely removed from the film, which is consistent with the Raman analysis. The Zr 3d spectra showed that the zirconium hydroxide (Zr(OH)4, 183.6 eV, Zr 3d5/2) [29] also existed, as well as the ZrO2 (182.2 eV, Zr 3d5/2) [30]. It had a low molar content of Zr(OH)4 compared with ZrO2. Zr(OH)4 tends to dehydrate (Zr(OH)4 → ZrO2 + H2O) and thus causes volume shrinkage. It should be noted that the loss of the adsorbed water may also lead to the volume shrinkage. Further observation of the anodic film obtained using potentiostatic anodization at 0 V for 10 min in 14 M NaOH solution without the drying process is shown in Figure 6. As can be seen, the cracks can be observed before the loss of the adsorbed water. Such results indicate that the dehydration reaction of Zr(OH)4 was responsible for the mud-cracking morphologies.

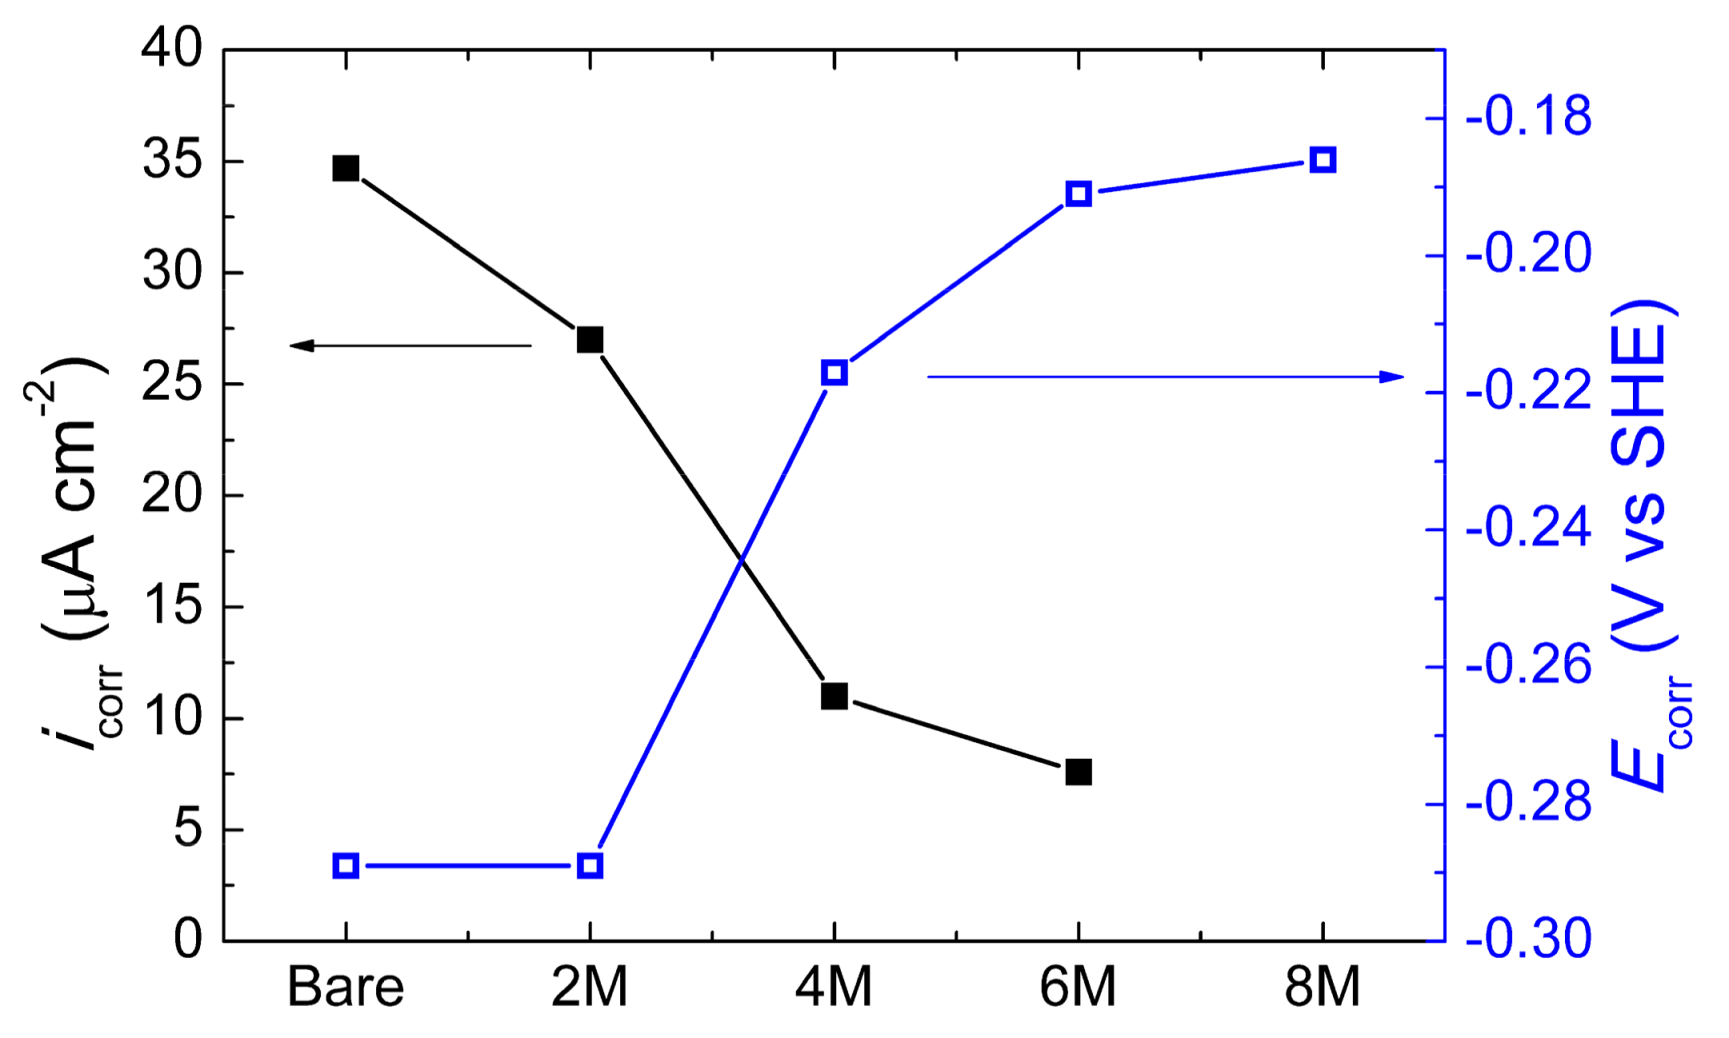
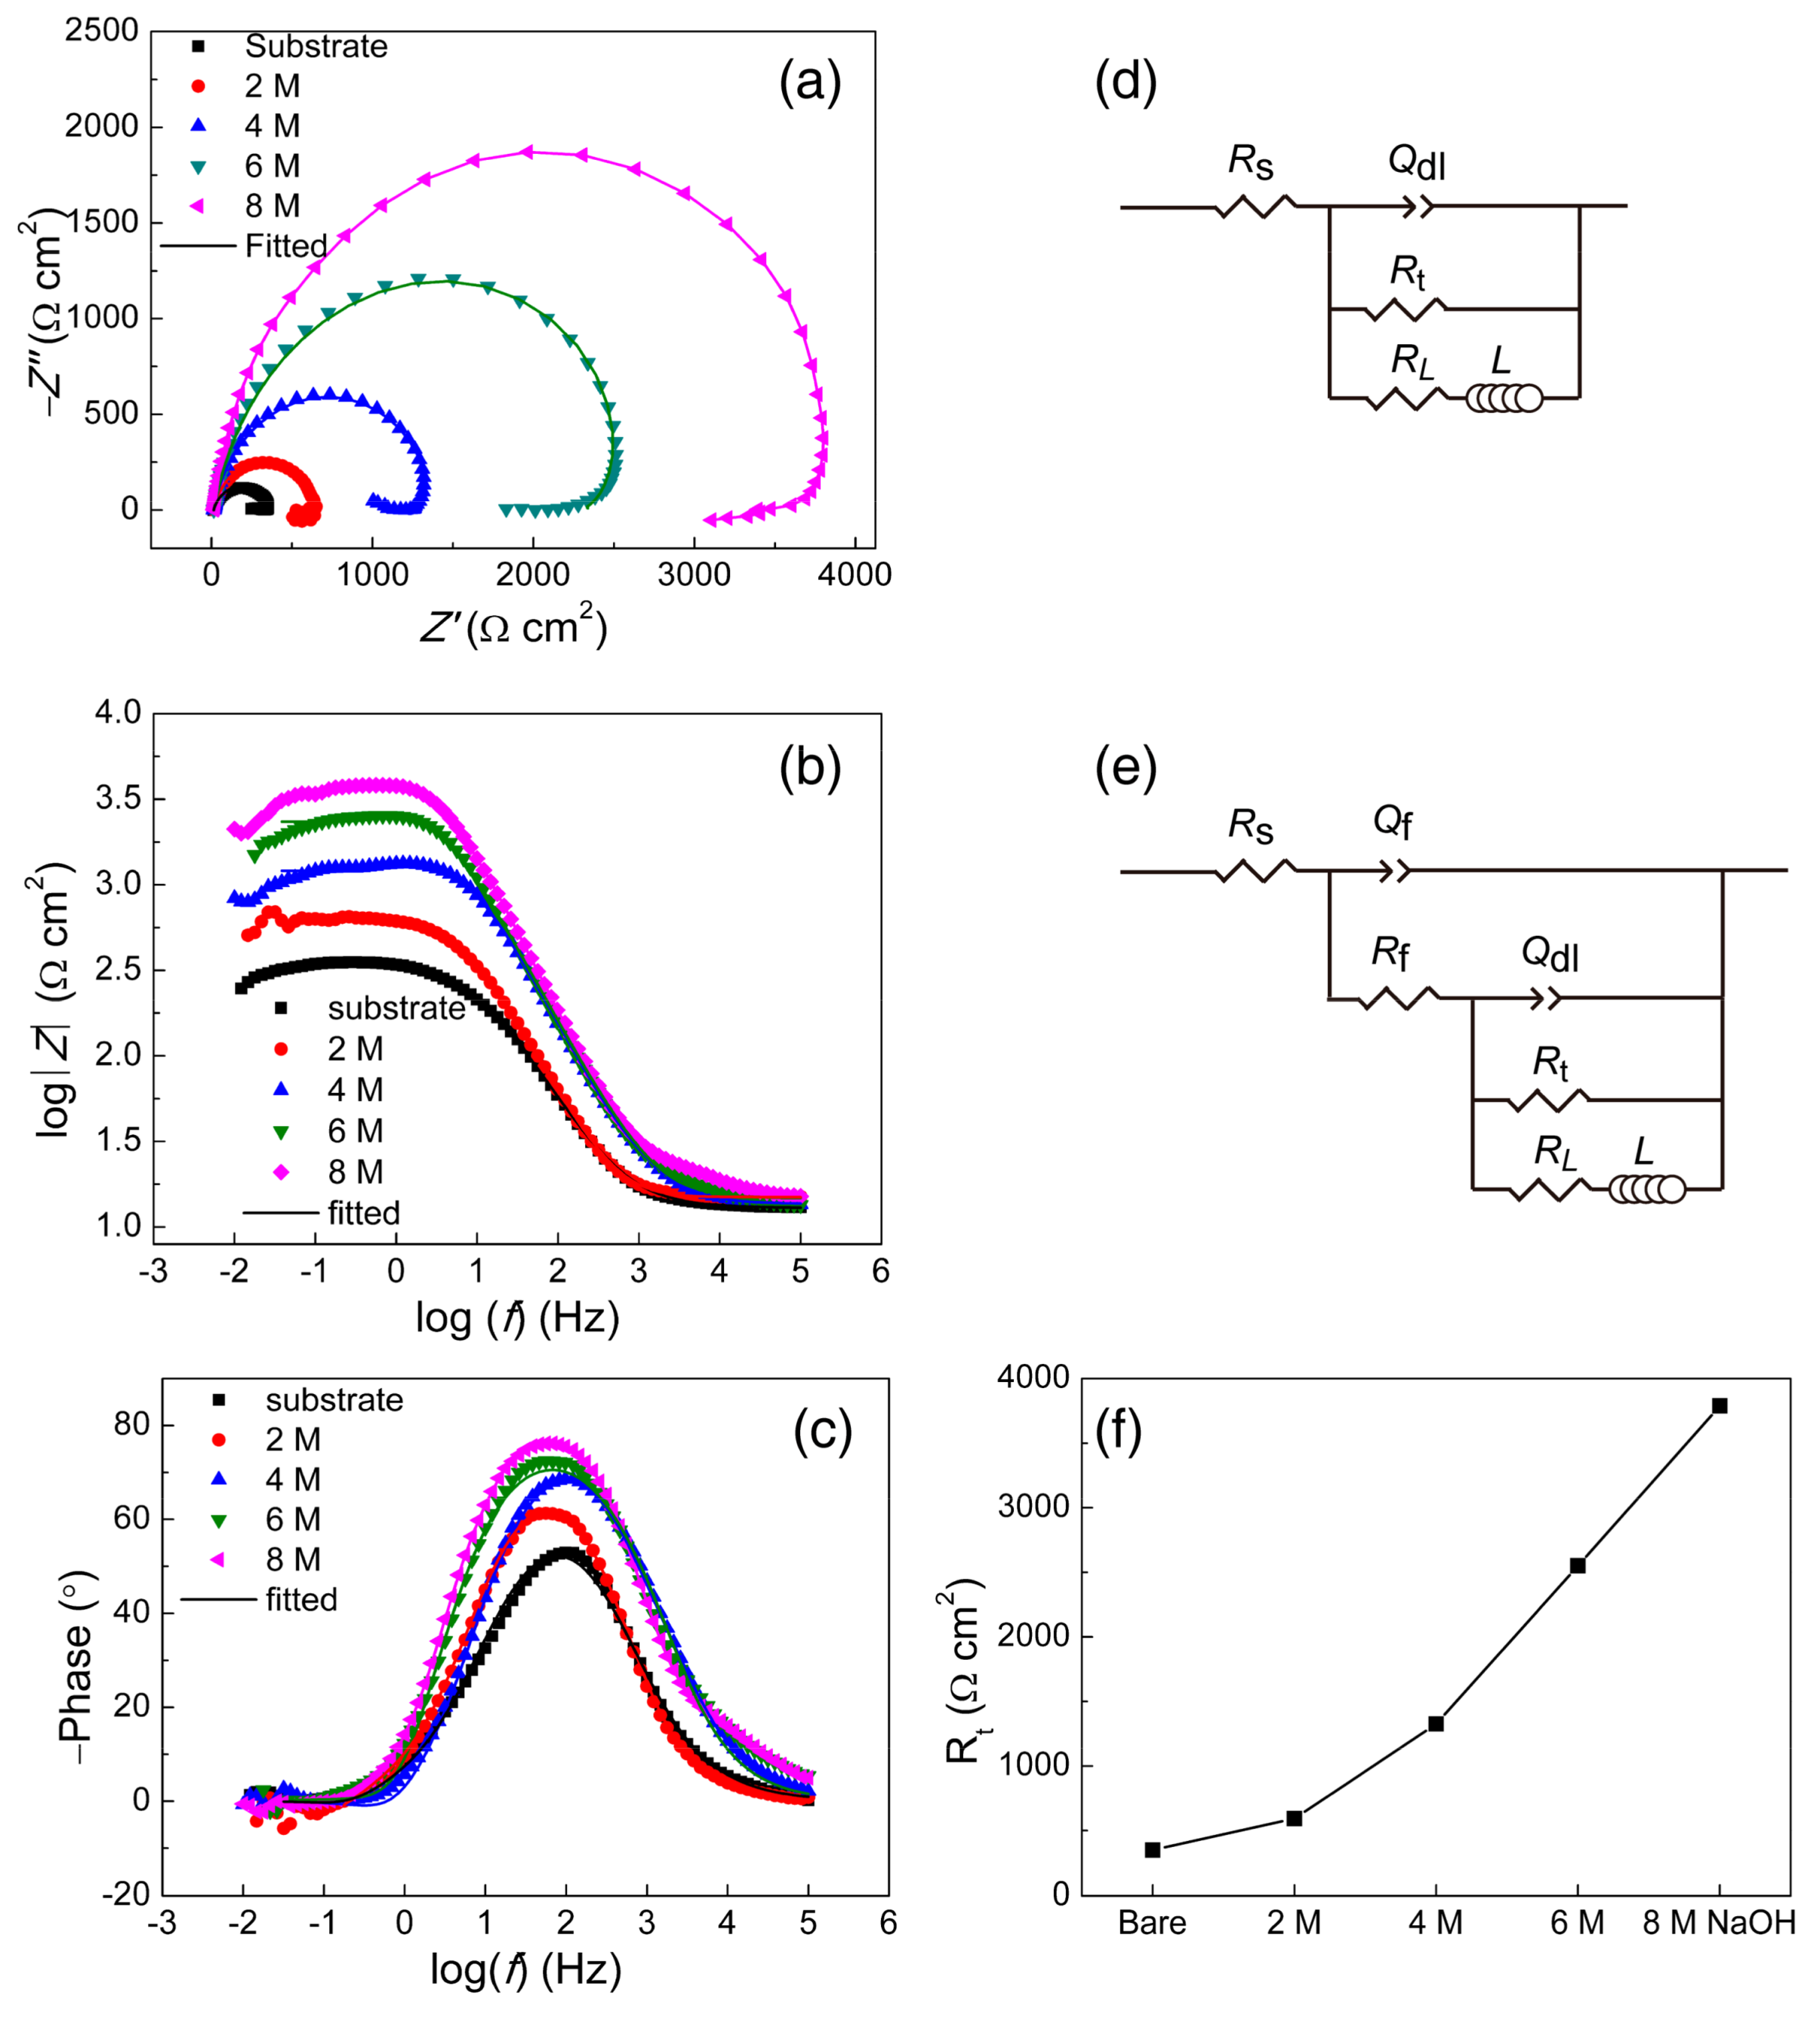
3.4. Corrosion Resistance of the Anodic Film When Put in a 0.1 M H2C2O4 Solution

Here, the corrosion protection of the anodic film without cracks gained attention because the cracks were generally regarded as considerable defects. Figure 7 shows the PDP curves of the above anodic films recorded when put in a 0.1 M H2C2O4 solution at 40 °C, where the ZrB2 ceramic substrate is listed for comparison. All the samples show similar active–passive behaviors and the passive potentials were above 0 V versus SHE. The similar curves show that the H2C2O4 solution could penetrate into the film and the curve basically reflected the interaction between the ceramic substrate and the solution.
Figure 8 shows the corrosion densities (icorr) and corrosion potentials (Ecorr) of the films calculated using the Tafel extrapolation method. As can be seen, the Ecorr had increased, in contrast with the bare ZrB2 ceramic (−0.3 V). The icorr of the substrate (3.5 × 10⁻⁵ A·cm−2) is similar with the literature [18]. Apparently, the icorr of the films was lower than the substrate and decreased with the film thickness. It should be noted that the cathodic curve of the film obtained in the 8 M NaOH solution shows the feature of oxygen diffusion, which shows the main cathodic reaction had changed from the hydrogen evolution reaction (HER) to the oxygen reduction reaction (ORR), and did not contain the Tafel line region. Thus, its icorr could not be calculated using the Tafel method and is not given in Figure 8. However, it is surely lower than the result (7.6 × 10⁻⁶ A·cm−2) of the film obtained in the 6 M NaOH solution.
Figure 9 displays the EIS results of the films without cracks put in a 0.1 M H2C2O4 solution at 40 °C where the ZrB2 substrate is listed for comparison. From the Nyquist plots (Figure 9a), the ZrB2 substrate had a capacitive arc at high frequency and an inductive loop at low frequency. It shows one time constant (Figure 9b,c). The capacitive arc results from the double-layer capacitance and the charge transfer resistance [31]. Furthermore, the inductive loop was related to the adsorbed intermediate product [32] on the corroded surface. The corresponding equivalent circuit is shown in Figure 9d, where Rs is the solution resistance, Rt is the charge transfer resistance, Qdl is a constant phase element parallel to Rt, and L is the inductance element with corresponding inductance resistance RL.
The film displays one capacitive arc at high frequency and one inductive loop at low frequency. However, this capacitive arc should include the information of the film’s resistance besides the charge transfer resistance. Furthermore, the typical equivalent circuit [33] for the films (Figure 9e) was used, where Rf is the film resistance and Qf is a constant phase element parallel to Rf. The fitted results are shown in Figure 9f and Table 1. As can be seen, all the Rf were smaller than the Rt, which leads to the similar EIS results for the substrate. Both of the resistances increased with the film thickness, which was consistent with the analysis of the polarization curves.
Usually, the Rf is used to evaluate the shielding capability of the film or coating. It is directly related to the film properties such as electrical conductivity, porosity, and thickness; furthermore, the Rt is the charge transfer resistance on the surface of the substrate, which could reflect the corrosion inhibition of the film. By comparing Rf and Rt, the contribution of the shielding ability and corrosion inhibition of the film can be clearly distinguished. Therefore, it can be seen that the corrosion inhibition of the film in this paper played a major role (Rt > Rf) and can be enhanced by the film thickness.
Although many studies [34,35,36] have reported such corrosion behaviors of films or coatings dominated by the corrosion inhibition, the research about the effects of the film thickness is not sufficient and clear [37,38]. The corrosion inhibition might result from the corrosion product, which acts as an inhibitor absorbed on the active sites [19,39]. When the film thickness increases, the diffusion of the product would decrease and the absorbed product might augment. Thus, the corrosion inhibition from the corrosion product might be enhanced. In short, the anodic film (without cracks) of ZrB2 could provide effective corrosion protection when put in a H2C2O4 solution, which had a positive correlation with the film thickness. The film obtained when put in a 8 M NaOH solution had the best protection effect, almost one order of magnitude greater compared with the substrate.

4. Conclusions

The ZrO2 films were prepared in situ using the anodization of a ZrB2 ceramic in 2–16 M NaOH solutions and characterized using the FE-SEM, Raman, and XPS techniques. Their corrosion resistances when put in a 0.1 M H2C2O4 solution were evaluated using the PDP and EIS techniques. The following conclusions can be drawn:
  • The anodic films could be prepared from −0.8 to 0.8 V (SHE). Furthermore, the passive current densities (10−5–10−3 A·cm−2) represented the film formation rate increase with the NaOH concentration.
  • The amorphous ZrO2 was the major component of the films. During the anodization, the dehydration reaction of Zr(OH)4 to ZrO2 caused the volume shrinkage and tensile stress of the films. When the thickness exceeded a critical value, the mud-cracking morphology occurred. The critical thickness was found in the region of 150–360 nm.
  • The films without cracks exhibited the inhibition effect and provided effective corrosion protection when put in a 0.1 M H2C2O4 solution, which had a positive correlation with the film thickness. The film obtained when put in a 8 M NaOH solution (~150 nm, near the critical thickness) performed best, almost one order of magnitude greater compared with the substrate.

Author Contributions

Conceptualization, J.L. and Q.S.; Methodology, J.Z. and H.Y.; Software, J.Z. and H.Y.; Formal Analysis, H.Y.; Investigation, J.Z.; Data Curation, J.Z. and H.Y.; Writing-Original Draft Preparation, H.Y.; Writing-Reviewing and Editing, J.Z. and H.Y.; Visualization, Q.S.; Supervision, L.Z.

Funding

This work is supported by the National Natural Science Fund of China (Nos. 51272190, 51521001), the 111 project of China (B13035), the Natural Science Foundation of Hubei Province (No. 2016CFA006) and the National Key Research and Development Program of China (2018YFB0905600, 2017YFB0310400).

Conflicts of Interest

The authors declare no conflict of interest.

References

  1. Chen, F.; Jin, D.; Tyeb, K.; Wang, B.; Han, Y.-H.; Kim, S.; Schoenung, J.M.; Shen, Q.; Zhang, L. Field assisted sintering of graphene reinforced zirconia ceramics. Ceram. Int. 2015, 41, 6113–6116. [Google Scholar] [CrossRef]
  2. Eltayeb, K.; Hong, W.; Chen, F.; Han, Y.-H.; Shen, Q.; Zhang, L. Field-assisted sintering of multiphase toughening zirconia ceramics. J. Ceram. Process. Res. 2017, 18, 1–9. [Google Scholar]
  3. Catauro, M.; Bollino, F.; Tranquillo, E.; Tuffi, R.; Dell’Era, A.; Ciprioti, S.V. Morphological and thermal characterization of zirconia/hydroxyapatite composites prepared via sol-gel for biomedical applications. Ceram. Int. 2019, 45, 2835–2845. [Google Scholar] [CrossRef]
  4. Dixit, V.K.; Marathe, A.; Bhatt, G.; Khamari, S.K.; Rajiv, K.; Kumar, R.; Mukherjee, C.; Panchal, C.J.; Sharma, T.K.; Oak, S.M. Evaluation of structural and microscopic properties of tetragonal ZrO2 for the facet coating of 980 nm semiconductor laser diodes. J. Phys. D. Appl. Phys. 2015, 48, 105102. [Google Scholar] [CrossRef]
  5. Han, H.; Qiu, F.; Liu, Z.; Han, X.-E. ZrO2-coated Li3V2(PO4)3/C nanocomposite: A high-voltage cathode for rechargeable lithium-ion batteries with remarkable cycling performance. Ceram. Int. 2015, 41, 8779–8784. [Google Scholar] [CrossRef]
  6. Garg, N.; Bera, S.; Velmurugan, S. Effect of coating thickness and grain size on the electrochemical properties of hydrothermally deposited nano-ZrO2coatings on stainless steel surface. Thin Solid Films 2019, 670, 60–67. [Google Scholar] [CrossRef]
  7. Yu, J.; Ji, G.; Shi, Z.; Wang, X. Corrosion resistance of ZrO2 films under different humidity coal gas conditions at high temperature. J. Alloy. Comp. 2019, 783, 371–378. [Google Scholar] [CrossRef]
  8. Jang, B.-K.; Sun, J.; Kim, S.; Oh, Y.-S.; Lee, S.-M.; Kim, H.-T. Thermal conductivity of ZrO2-4mol%Y2O3 thin coatings by pulsed thermal imaging method. Surf. Coat. Technol. 2015, 284, 57–62. [Google Scholar] [CrossRef]
  9. Setare, E.; Raeissi, K.; Golozar, M.A.; Fathi, M.H. The structure and corrosion barrier performance of nanocrystalline zirconia electrodeposited coating. Corros. Sci. 2009, 51, 1802–1808. [Google Scholar] [CrossRef]
  10. Khan, M.; Zeng, Y.; Lan, Z.; Wang, Y. Reduced thermal conductivity of solid solution of 20% CeO2 + ZrO2 and 8% Y2O3 + ZrO2 prepared by atmospheric plasma spray technique. Ceram. Int. 2019, 45, 839–842. [Google Scholar] [CrossRef]
  11. Zhang, X.T.; Zhang, R.H.; Hu, S.M.; Wang, Y. Development of Zr/ZrO2 high temperature and high pressure sensors for in-situ measuring chemical parameters of deep-sea water. Sci. China. Ser. E Technol. Sci. 2009, 52, 2466–2473. [Google Scholar] [CrossRef]
  12. Park, Y.J.; Kim, J.W.; Ali, G.; Cho, S.O. Enhancement of oxidation resistance of zirconium alloy with anodic nanoporous oxide layer in high-temperature air/steam environments. Corros. Sci. 2018, 140, 217–222. [Google Scholar] [CrossRef]
  13. Ortiz, A.L.; Zamora, V.; Rodríguez-Rojas, F. A study of the oxidation of ZrB2 powders during high-energy ball-milling in air. Ceram. Int. 2012, 38, 2857–2863. [Google Scholar] [CrossRef]
  14. Lopes, N.I.A.; Freire, N.H.J.; Resende, P.D.; Santos, L.A.; Buono, V.T.L. Electrochemical deposition and characterization of ZrO2 ceramic nanocoatings on superelastic NiTi alloy. Appl. Surf. Sci. 2018, 450, 21–30. [Google Scholar] [CrossRef]
  15. Wang, H.; Chen, D.; Wang, C.-A.; Zhang, R.; Fang, D. Preparation and characterization of high-toughness ZrB2/Mo composites by hot-pressing process. Int. J. Refract. Met. Hard Mater. 2009, 27, 1024–1026. [Google Scholar] [CrossRef]
  16. Sun, X.; Han, W.; Liu, Q.; Hu, P.; Hong, C. ZrB2-ceramic toughened by refractory metal Nb prepared by hot-pressing. Mater. Des. 2010, 31, 4427–4431. [Google Scholar] [CrossRef]
  17. Wang, B.; Li, J.; Yang, H.; Shen, Q.; Zhang, L. Effect of ZrC thin film on preventing reactions between Nb and ZrB2-SiC. J. Synth. Cryst 2015, 44, 2762–2766. (In Chinese) [Google Scholar]
  18. Monticelli, C.; Bellosi, A.; Dal Colle, M. Electrochemical behavior of ZrB2 in aqueous solutions. J. Electrochem. Soc. 2004, 151, B331–B339. [Google Scholar] [CrossRef]
  19. Yang, H.T.; Zhang, J.; Li, J.G.; Chen, F.; Shen, Q.; Zhang, L.M. Electrochemical corrosion behavior of zirconium diboride ceramic in concentrated alkaline solutions. Mater. Res. Express 2018, 5, 126303. [Google Scholar] [CrossRef]
  20. Inzelt, G.; Lewenstam, A.; Scholz, F. Handbook of Reference Electrodes; Springer: Berlin, Germany, 2013. [Google Scholar]
  21. Cao, C.N. Principles of Electrochemistry of Corrosion; Chemical Industrial Press: Beijing, China, 2008. [Google Scholar]
  22. Kelly, R.G.; Scully, J.R.; Shoesmith, D.; Buchheit, R.G. Electrochemical Techniques in Corrosion Science and Engineering; CRC Press: Boca Raton, FL, USA, 2002; pp. 55–58. [Google Scholar]
  23. Human, A.M.; Roebuck, B.; Exner, H.E. Electrochemical polarisation and corrosion behaviour of cobalt and Co(W, C) alloys in 1 N sulphuric acid. Mater. Sci. Eng. A 1998, 241, 202–210. [Google Scholar] [CrossRef]
  24. Hu, M.; Evans, A. The cracking and decohesion of thin films on ductile substrates. Acta Metall. 1989, 37, 917–925. [Google Scholar] [CrossRef]
  25. Krishnamurthy, S.; Reimanis, I. Multiple cracking in CrN and Cr2N films on brass. Surf. Coat. Technol. 2005, 192, 291–298. [Google Scholar] [CrossRef]
  26. Singh, K.B.; Tirumkudulu, M.S. Cracking in drying colloidal films. Phys. Rev. Lett. 2007, 98, 218302. [Google Scholar] [CrossRef] [PubMed]
  27. Li, M.J.; Feng, Z.C.; Ying, P.L.; Xin, Q.; Li, C. Phase transformation in the surface region of zirconia and doped zirconia detected by UV Raman spectroscopy. Phys. Chem. Chem. Phys. 2003, 5, 5326–5332. [Google Scholar] [CrossRef]
  28. Zhou, Y.; Fang, C.; Fang, Y.; Zhu, F. Polyborates in aqueous borate solution: A Raman and DFT theory investigation. Spectrochim. Acta A. 2011, 83, 82–87. [Google Scholar] [CrossRef] [PubMed]
  29. Barr, T.L. An ESCA study of the termination of the passivation of elemental metals. J. Phys. Chem. 1978, 82, 1801–1810. [Google Scholar] [CrossRef]
  30. Huang, C.; Tang, Z.; Zhang, Z. Differences between zirconium hydroxide (Zr(OH)4·nH2O) and hydrous zirconia (ZrO2·nH2O). J. Am. Ceram. Soc. 2001, 84, 1637–1638. [Google Scholar] [CrossRef]
  31. Yüce, A.O.; Mert, B.D.; Kardaş, G.; Yazıcı, B. Electrochemical and quantum chemical studies of 2-amino-4-methyl-thiazole as corrosion inhibitor for mild steel in HCl solution. Corros. Sci. 2014, 83, 310–316. [Google Scholar] [CrossRef]
  32. Zeng, Z.P.; Lillard, R.S.; Cong, H.B. Effect of salt concentration on the corrosion behavior of carbon steel in CO2 environment. Corrosion 2016, 72, 805–823. [Google Scholar] [CrossRef]
  33. Zhang, G.A.; Cheng, Y.F. Corrosion of X65 steel in CO2-saturated oilfield formation water in the absence and presence omf acetic acid. Corros. Sci. 2009, 51, 1589–1595. [Google Scholar] [CrossRef]
  34. Rekha, M.Y.; Kamboj, A.; Srivastava, C. Electrochemical behavior of SnNi-graphene oxide composite coatings. Thin Solid Films 2018, 653, 82–92. [Google Scholar] [CrossRef]
  35. Chen, Z.; Yang, W.; Xu, B.; Chen, Y.; Qian, M.; Su, X.; Li, Z.; Yin, X.; Liu, Y. Corrosion protection of carbon steels by electrochemically synthesized V-TiO2/polypyrrole composite coatings in 0.1 M HCl solution. J. Alloy. Comp. 2019, 771, 857–868. [Google Scholar] [CrossRef]
  36. Hong, S.; Wu, Y.; Gao, W.; Zhang, J.; Zheng, Y.; Zheng, Y. Slurry erosion-corrosion resistance and microbial corrosion electrochemical characteristics of HVOF sprayed WC-10Co-4Cr coating for offshore hydraulic machinery. Int. J. Refract. Met. Hard Mater. 2018, 74, 7–13. [Google Scholar] [CrossRef]
  37. Liu, Y.; Huang, J.; Claypool, J.B.; Castano, C.E.; O’Keefe, M.J. Structure and corrosion behavior of sputter deposited cerium oxide based coatings with various thickness on Al 2024-T3 alloy substrates. Appl. Surf. Sci. 2015, 355, 805–813. [Google Scholar] [CrossRef]
  38. Maeng, S.; Axe, L.; Tyson, T.A.; Gladczuk, L.; Sosnowski, M. Corrosion behaviour of magnetron sputtered α- and β-Ta coatings on AISI 4340 steel as a function of coating thickness. Corros. Sci. 2006, 48, 2154–2171. [Google Scholar] [CrossRef]
  39. Gu, Y.; Bandopadhyay, S.; Chen, C.F.; Ning, C.; Guo, Y. Long-term corrosion inhibition mechanism of microarc oxidation coated AZ31 Mg alloys for biomedical applications. Mater. Des. 2013, 46, 66–75. [Google Scholar] [CrossRef]
Figure 1. PDP curves for the ZrB2 ceramic in 2–16 M NaOH solutions at 40 °C.
Coatings 09 00455 g001
Figure 2. Surface and cross-section morphology of the films obtained using potentiostatic anodization at 0 V for 10 min in (a,f) 6 M, (b,g) 8 M, (c,h) 10 M, (d,i) 12 M, and (e,j) 14 M NaOH solution.
Coatings 09 00455 g002
Figure 3. Surface morphology of the anodic film obtained using potentiostatic anodization at 0 V for 10 min without the OCP test process when put in a 6 M NaOH solution.
Coatings 09 00455 g003
Figure 4. Raman spectra of the anodic film obtained using potentiostatic anodization when put in a 10 M NaOH solution at 0 V for 10 min.
Coatings 09 00455 g004
Figure 5. B 1s and Zr 3d XPS spectra for the anodic film obtained using potentiostatic anodization at 0 V for 10 min in 10 M NaOH solution.
Coatings 09 00455 g005
Figure 6. Optical image of the anodic film obtained using potentiostatic anodization when put in a 14 M NaOH solution at 0 V for 10 min without a drying process.
Coatings 09 00455 g006
Figure 7. PDP curves of the anodic films in 0.1 M H2C2O4 solution at 40 °C where the substrate (bare sample) is listed for comparison. The films were prepared using potentiostatic anodization in different NaOH solutions at 0 V for 10 min.
Coatings 09 00455 g007
Figure 8. The icorr and Ecorr of the anodic films put in a 0.1 M H2C2O4 solution at 40 °C calculated using the Tafel extrapolation method based on Figure 7.
Coatings 09 00455 g008
Figure 9. EIS results of the anodic films of ZrB2 ceramic when put in a 0.1 M H2C2O4 solution (40 °C) at OCP: (a) Nyquist plots, (b) Bode impedance magnitude plots, (c) Bode phase angle plots, (d,e) equivalent circuit for the substrate and the anodic films, and (f) the Rt of the substrate and the films.
Coatings 09 00455 g009
Table 1. Fitted results for the anodic films obtained from EIS spectra fitting where n1 and n2 are the indexes of Qf and Qdl, respectively.
SampleRs (Ω·cm2)Rt (Ω·cm2)Rf (Ω·cm2)RL (Ω·cm2)Qf (S·secn1·cm−2)n1Qdl (S·secn2·cm−2)n2L (H·cm−2)
Substrate12.9349.34481.02.2 × 10−50.793532.5
2 M14.9592.958.92959.25.5 × 10−60.961.2 × 10−50.706169.3
4 M13.61327.1107.95974.84.0 × 10−60.873.6 × 10−70.981373.7
6 M14.72551.2431.77386.54.3 × 10−60.872.2 × 10−70.961570.0
8 M17.43787.6510.213320.52.9 × 10−60.911.7 × 10−70.944710

