Abstract
By combining traditional electrochemical tests including Tafel extension method and Mott-Schottky fitting, spectroscopic ellipsometry (SE) and a micro-region analysis technique, which is an integrated system of a scanning reference electrode technique and scanning tunneling microscope (SRET/STM), the changes in properties of the oxide film that formed on the surface of the U-0.79 wt.% Ti alloy (U-Ti alloy in short) in 0.1 M NaNO3 were carefully investigated as the pH value changed. The results show that the properties of the oxide film are strongly pH-dependent. The corrosion potential and corrosion current density decrease with the increasing pH value. The oxide film appears to be a p-type semiconductor at pH = 2.43. However, the transition from n-type to p-type for the oxide film as a semiconductor is observed with the increasing applied potential when the solution pH value varies from 2.43 to 7.0. The oxide film presents as an n-type semiconductor when the pH value varies from 7.0 to 11.44. In addition, during the transition of the pH, the roughness and the number of active points of the alloy surface decreases while the oxide film is thicker. It can be concluded that the corrosion resistance of the oxide film formed on the U-Ti alloy surface is enhanced in neutral or alkaline solutions.
1. Introduction
The applications of metallic uranium are severely limited due to its terrible anti-corrosion properties, low yield strength and low hardness. However, alloying of uranium could overcome these disadvantages, as it has wide applications in the nuclear industry [1,2]. In comparison with other uranium alloy, uranium-titanium alloy could significantly improve the mechanical properties as well as anti-corrosion properties by adding much less alloying element, making it receive wide applications in the nuclear energy industry and military field [3,4,5,6,7]. For decades, lots of researchers paid much attention to evaluate the corrosion behaviors of the uranium–titanium alloy in different environments [8,9,10]. Lots of reports have confirmed that the corrosion behaviors are influenced by kinds of inner or outer factors: the inner factors include macroscopic size and shape, grain size, grain boundary, stress, inclusion, impurities contents, etc., while the outer factors include pH, temperature, component of environmental medium and so on [11,12,13].
The initial oxidation products formed on the metallic uranium or uranium alloy in ambient atmosphere are stoichiometric or hyper-stoichiometric U(IV) oxides in the form of UO2+x/UO2, where 0< x < 0.4, relating to O2 partial pressure [8,14]. With the development of uranium corrosion, a series of mixed-valence oxide of U(IV) and U(VI), as well as U(VI) oxides, could be observed, like U4O9, U3O7, U3O8, UO3 [15,16]. Milton et al. studied the surface transformation from active state to passive state of the U-1.76Ti and U-3.41Ti alloys via anodic polarization technique [8]. Milton et al. discovered that during the transformation, the corrosion current density (A/cm2) reduced from 10−4 order of magnitude to 10−6 order of magnitude. Nagelberg et al. systemically investigated the corrosion behavior of the uranium-titanium alloy with different titanium content [17]. They measured the oxidization rate of the uranium alloys with different weight ratios of titanium (0.8%, 1.0%, 1.5% and 2.0%) at 70 °C under N2 atmosphere with 95% relative humidity. Their results demonstrate that the oxidization rate has a close relationship with the titanium content: the corrosion rate of the uranium alloy containing 0.8 wt.% titanium is 100 times faster than that of the uranium alloy containing 2.0 wt.% titanium. They also studied the composition of the oxide formed on the uranium–titanium alloys via FTIR and XRD, and the results show that as the content of titanium increases, the complex oxide that formed on the surface changed into simple oxide. Also, in recent years, the hydrogen corrosion of the uranium–titanium alloy and the influences brought by impurities or intermetallic compound have also drawn lots of attention [18,19,20].
Although the corrosion behaviors of metallic uranium or the uranium–titanium alloy have been studied intensively for years, there are few reports about the influences of pH values on the electrochemical behavior. By now, most of the researches focused on the corrosion behaviors of ordinary metal or alloy rather than uranium in conditions with different pH values [21,22,23,24,25]. In fact, for most metals or alloys, different regions on the surface would suffer corrosion in different degrees as the chemical compositions and roughness differs and the thicknesses of the liquid membrane absorbed are different. Consequently, the pH values of the absorbed electrolyte would also differ [26,27]. Furthermore, the pH value at the interfaces of the solid/electrolyte could be changed by the temperature, humidity, serving environment, etc. Thus, to fully investigate the influences of pH values on the uranium–titanium alloy’s corrosion behavior, it is essential to study the corrosion in situ and in microscopic view, besides macroscopic electrochemical tests.
In this paper, we combined traditional electrochemical tests and scanning reference electrode technique to study the influences of the pH transition on the properties of the oxide film form on the surface of the uranium–titanium alloy immersed in 0.1 mol/L NaNO3 solution. Meanwhile, the thickness of the oxide films was studied via spectroscopic ellipsometry to further evaluate the influences.
2. Materials and Methods
2.1. Specimens and Solutions
The specimens (Ø13 mm × 3 mm, total impurity content < 500 ppm) used for all experiments were cut from an ingot prepared by arc melting. The specimens were quenched by immersing the U-0.79Ti rod into ice water quickly to obtain single α′ phase, and the typical needle-like martensitic metallography structure could be observed (Figure 1). In order to obtain a smooth surface, all specimens were mechanically ground with SiC papers up to #1200 grit and were successively polished with 0.3 μm Al2O3 powder. After being rinsed with deionic water, acetone and alcohol, the specimens were dried with cold air for further measurements.
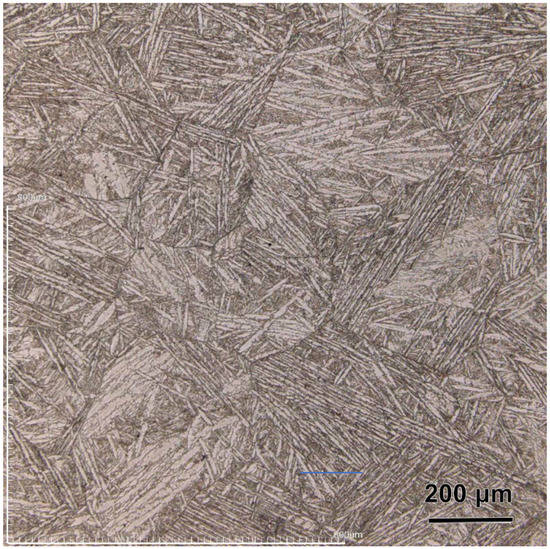
Figure 1.
The optical morphology of U-0.79Ti alloy.
All reagents utilized within this research are of analytical grade and were directly used without further purification. Sodium nitrite solution with the concentration of 0.1 mol/L was chosen as the electrolyte for all experiments. Further, the solution pH value was adjusted by nitric acid or sodium hydroxide, respectively. The temperature was optimized at 25 ± 1 °C while conducting electrochemical measurements by a constant temperature water bath.
2.2. Electrochemical Measurements
All electrochemical measurements were performed in a conventional three-electrode system using a CS2350 electrochemical workstation (Wuhan Correst Instrument Co., Ltd., Wuhan, China). The as-prepared specimens embedded in epoxy resin leaving 1 cm2 area were used as working electrodes; a platinum plate with about 4 cm2 was chosen as the counter electrode; the reference electrode was a saturated calomel electrode (SCE).
In order to have an in situ study of the electrochemical behaviors of the passive film formed on the U-0.79Ti alloy surface with the change of the solution’s pH value, the electrochemical experiments were performed in the following procedures:
- Open-circuit potential (OCP) measurements. Firstly, the OCPs were measured while the alloy sample was immersed into 0.1 mol/L NaNO3 solution with different pH values (pH = 2.43, 7.0, 11.44) for one hour at 25 °C.
- Tafel tests. The Tafel curves were obtained at a scan rate of 0.5 mV s−1 from −0.15 (versus OCP) to 0.15 V (versus OCP) after the measurements of OCPs.
- Mott-Schottky analysis. The Mott-Schottky analyses were then carried out on the passive film using a 10 mV AC signal with a frequency of 1 kHz and a step potential of 25 mV from −0.8 to 0.3 V (verus SCE).
Here, it should be emphasized that NO3− ions exhibit an inhibitive influence on the corrosion of uranium to a certain extent, so NaNO3 solution was chosen in all the experiments.
2.3. In Situ Microstructure and Potential Distribution Measurement
The microstructures and potential mappings were performed on a scanning electrochemical workstation equipped with SRET/STM coupling technique (XMU-BY-LG, Xiamen Legangtech instrument CO., Ltd., Xiamen, China) during the transition of the solution’s pH value. The data processing was conducted with the workstation-assorted software, Imager 4.7. The schematic diagram and the photograph of the test system have been detailed by Ye et al. [28]. More applications for the measurement system have been reported before [29,30,31,32]. It should be mentioned here that both the scanning probe electrode and the reference probe electrode are Pt-Ir probes (Ø20~30 μm) in either SRET or STM modes. The surface morphology was studied with the area of 20 μm × 20 μm and the potential distributions on the passive film with the area of 1500 μm × 1500 μm. The detailed measure procedures were conducted in the following sequence:
- (a)
- Firstly, the electrochemical workstation was switched to STM mode to investigate the initial surface morphology of the U-0.79Ti alloy sample before immersing it in 0.1 mol/L NaNO3.
- (b)
- Enough 0.1 mol/L NaNO3 solution with the pH value of 2.43 was added into the electrolytic cell to immerse the U-0.79Ti alloy sample for 1 h. The electrochemical workstation was then switched to SRET mode to obtain the potential distribution.
- (c)
- After the potential distribution measurement, the electrolyte solution was removed by pipette. The residual electrolyte was washed away by deionic water and, successively, the sample was dried by cold air blowing. Then, the electrochemical workstation was switched to STM mode again to investigate the surface morphology of the U-0.79Ti alloy sample after immersing it in acidic 0.1 mol/L NaNO3 solution with the pH value of 2.43.
- (d)
- Enough 0.1 mol/L NaNO3 solution with the pH value of 7.0 was added into the electrolytic cell to immerse the U-0.79Ti alloy sample for 1 h. Then, the potential distribution and surface morphology were studied as procedure (b) and (c).
- (e)
- Enough 0.1 mol/L NaNO3 solution with the pH value of 11.44 was added into the electrolytic cell to immerse the U-0.79Ti alloy sample for 1 h. Then, the potential distribution and surface morphology were studied as procedure (b) and (c).
Here it should be pointed out that as the testing areas of the scanning probe electrode relative to the U-0.79Ti alloy sample remain unchanged, the results reflected the in situ transition of micro-morphology and potential distribution while the pH values of the electrolyte solution change [28,29,30,31,32].
2.4. Spectroscopic Ellipsometry Measurement
Spectroscopic ellipsometry (SE, SENTECH SE801, Johannesburg, South Africa) was utilized to detect the evolution of the thickness of the oxide film that formed on the U-0.79Ti alloy surface as the pH value changed. The testing polarized light were in the range of 250–850 nm at three different incident angles of 65°, 70° and 75°, respectively. The thicknesses were calculated by using the Lorentz model. Detailed measurements were conducted according to the following procedures:
- (a)
- Firstly, the U-0.79Ti alloy specimen sample was immersed in 0.1 mol/L NaNO3 solution with the pH value of 2.43 for 1 h. Then, the solution was removed and the sample surface was dried by cold air blowing. After these treatments, the spectroscopic ellipsometry measurement was performed to detect the thickness of the oxide film on the surface of the U-0.79Ti alloy sample.
- (b)
- After the detection in step (a), the U-0.79Ti alloy specimen sample was then immersed in 0.1 mol/L NaNO3 solution with the pH value of 7.00 for 1 h. Then, the spectroscopic ellipsometry measurement was performed as step (a).
- (c)
- After the detection in step (b), the U-0.79Ti alloy specimen sample was then immersed in 0.1 mol/L NaNO3 solution with the pH value of 11.44 for 1 h. Then, the spectroscopic ellipsometry measurement was performed as step (a).
3. Results and Discussion
3.1. Open-Circuit Potential
As can be seen in Figure 2, when the U-0.79Ti sample was only immersed in acidic NaNO3 solution (pH = 2.43) for 3 h, the OCP increases continuously and finally reaches −0.04 V, indicating that the thickness of the oxide film formed on the sample surface increases with the time immersed. However, when the 0.1 mol/L NaNO3 solution changes during the immersing process, the OCP changes significantly: in the first hour, the sample was immersed in acidic solution (pH = 2.43) and the OCP rises apparently at the early stage and finally reaches −0.13 V; when the solution was converted to neutral (pH = 7.00) and the sample was further immersed for another hour, the OCP decreases from −0.13 V to −0.2 V; furthermore, the solution was converted to alkaline (pH = 11.44) and the OCP finally decreases to −0.24 V after the third hour. The changes of OCP suggest that the formation of the oxide film on the U-0.79Ti alloy surface has a close relationship with the pH values. In other words, if the pH value of the solution changes, the already existing electrode reaction equilibrium at the oxide film/solution would be destabilized. Further, under the new circumstance with a different pH, the reactants and products would be changed which would surely influence the properties of the oxide film, including thickness, compactness, composition, etc.

Figure 2.
The open-circuit potential (OCP) plots of the U-0.79Ti alloy sample immersed in 0.1 mol/L NaNO3 with different pH values: one sample was only immersed in the acidic solution (pH = 2.43) for 3 h, and another sample was immersed successively in acidic (pH = 2.43), neutral (pH = 7.00) and alkaline (11.44) solution for 1 h, respectively.
The corrosion mechanism of uranium–titanium is similar to that of metallic uranium, for the content of titanium in the uranium–titanium alloy is very low, which was reported in early researches. In acidic solution, the OCP of the uranium–titanium alloy is the mixed potential of the reduction reaction of H+ and the oxidization reaction of uranium; meanwhile, in neutral or alkaline solution, the OCP is the mixed potential of the reduction reaction of dissolved oxygen and the oxidization reaction of uranium. The characteristic electron configuration of uranium (5f36d17s2) makes it so that the uranium possesses a variety of valence state (highest to U(VI)), leading to a supremely complex oxidization process in aqueous solution. Lots of reports share the same opinion that there are two steps in the corrosion dissolution of uranium [33,34]: (1) the elementary U (0) is oxidized into U (IV) as Equations (1) and (2), which mainly exists in the form of UO2; (2) as the oxidization reaction develops, U (IV) transfers into U (VI) as Equations (3) and (4), which mainly exists in the form of UO22+. It is noteworthy that under an alkaline environment, the formation of UO3·2H2O proceeds as Equation (5) from UO22+ [35]. It can be inferred from Equations (3) to (5) that the composition and stability of the oxide film on the uranium surface and the concentration of uranium ions at the interface are strongly affected by the pH of the aqueous solution. Furthermore, based on the electric double layer theory, not only would the concentration of uranium ions (U4+ or UO22+) at the interface of the electrode/solution change with pH value, however also the concentration of H+ or OH− in the solution. As a result from the above, the constituent, thickness and compactness of the oxide film would change as the pH value of the solution changes, leading to the change of the OCP of the uranium–titanium alloy.
3.2. Tafel Curves
The obtained Tafel curves and the corresponding fitting results at pH 2.43, 7.0 and 11.44 were shown in Figure 3 and Table 1. While the pH value increases from 2.43 to 11.44, the corrosion potential (Ecorr) decreases. Notably, in each Tafel curve, the absolute value of the anodic Tafel slope (βa) is larger than that of the cathodic Tafel slope (βc), suggesting that the electrode reaction is likely to be under the mixed control of anodic dissolution of oxide film and the diffusion of uranium ions. Thus, the corrosion current density (icorr) was obtained by extending the cathodic Tafel curve [36,37]. It is clear that icorr decreases as the pH value increases, demonstrating that the corrosion rate of the uranium–titanium alloy could be slowed by raising the pH.

Figure 3.
Tafel curves and fitting results of the U-0.79Ti alloy immersed in 0.1 M NaNO3 solution with different pH values successively: (a) pH = 2.43, (b) pH = 7.0, (c) pH = 11.44.

Table 1.
Parameters calculated from the fitting results of Tafel results.
3.3. Mott-Schottky Tests
Usually, the oxide films on the surface of metal or alloy possess semiconductor properties and the semiconductor type can be judged via the Mott-Schottky equation. The types and concentration of defects could also be obtained from the Equation.
For n-type semiconductor
For p-type semiconductor
where C is the space charge capacitance (F/cm2), ε0 is the permittivity of the free space charge (8.854 × 10⁻¹⁴ F/cm), εr is the dielectric constant of the oxide films which is 22 [38], NA and ND are the acceptor and donor densities (cm−3), respectively, e is the elementary charge (1.602 × 10⁻¹⁹ C), Em is the electrode potential, Efb is the flat band potential (V), kB is the Boltzmann constant (1.38 × 10⁻²³ J/K) and T is the absolute temperature (K).
The Mott-Schottky curves are exhibited in Figure 4. In acidic solution (pH = 2.43), the oxide film appears in p-type semiconductor, indicating that the defects inside the oxide film are positive holes, and excess oxygen ions exist inside the oxide film. When the solution turns into neutrality (pH = 7.00) and the potential applied is lower than −0.1 V, the oxide film appears in p-type semiconductor (Figure 4b). On the contrary, if the potential applied exceeds −0.1 V, the oxide film turns into n-type semiconductor. These results suggest that in a neutral environment, the type of defects inside the oxide film of U-0.79Ti alloy is strongly affected by the potential applied. In other words, the defect type would change with potential at the interface of electrode/electrolyte. If the immersing time in the neutral condition is continuously prolonged, it is more obvious that the oxide film shows the tendency of changing from p-type to n-type semiconductor with the applied potential (Figure 5). The results suggest that the oxygen concentration decreases in the oxide film while the immersing time in the neutral condition is prolonged. When the pH value was adjusted to alkalinity successively, the oxide film appears in n-type semiconductor in the whole scanning potential range. This indicates that in an alkaline environment, there are excess uranium ions in the oxide film. However, as the radium of uranium ions is relatively large, excess uranium ions cannot exist at the lattice spacing, leading to the formation of oxygen anion holes. To keep the electric neutrality, there would be two electrons near the holes. To sum up, the semiconductor type of the oxide film formed on the U-0.79Ti alloy is strongly affected by the pH values in 0.1 M NaNO3 solution.

Figure 4.
The Mott-Schottky curves of the U-0.79Ti alloy immersed in 0.1 M NaNO3 solutions with different pH values successively: (a) pH = 2.43, (b) pH = 7.0, (c) pH = 11.44.
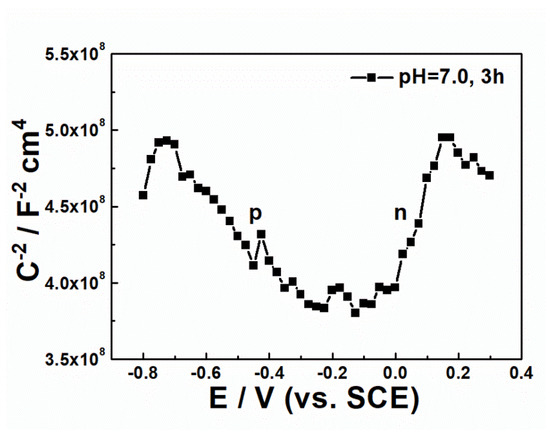
Figure 5.
The Mott-Schottky curve of that of the U-0.79Ti alloy immersed in 0.1 M NaNO3 acidic (pH = 2.43) firstly for 1 h and successively in neutral (pH = 7.0) solutions for 3 h.
3.4. Morphology and Potential Distribution Obtained from Combining Scanning Reference Electrode Technique and Scanning Tunneling Microscope (SRET/STM)
To study the properties of the oxide film formed on the U-0.79Ti alloy further in a microscopic view, the morphology and potential distribution were investigated by using the combining technique of SRET/STM. In Figure 6a, there are some defects with different sizes on the initial surface of the U-0.79Ti alloy sample (Site 1, 2, 3 and 4). After being immersed in the acidic 0.1 mol/L NaNO3 solution (pH = 2.43), the surface becomes rougher and the defects enlarge (Figure 6b). However, after being immersed in the neutral solution (pH = 7.00), apparent changes occur to the surface morphology (Figure 6c). Small defects (Site 1, 2 and 3) disappear, while the larger defect (Site 4) at the bottom part in Figure 6a still remains. Furthermore, the surface is smoother compared with that immersed in acidic solution. Similar phenomena are also observed on the sample surface after being successively immersed in the alkaline solution (Figure 6d). The results suggest that when the sample is immersed in NaNO3 solution with different pH values, small defects could change due to the formation or dissolution of the oxide film, while the large defects tend to remain unchanged in the same conditions. In other words, it is nearly impossible to recover the large defects on the uranium–titanium alloy via the mechanism of forming oxide film in certain solutions. Nevertheless, further researches are still needed to determine the critical size to distinguish small or large defects.
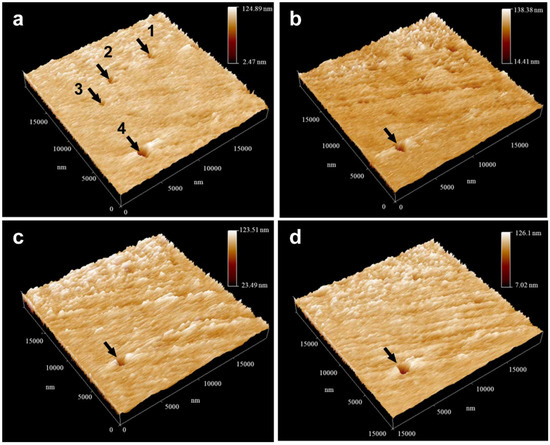
Figure 6.
The in situ morphology changes of the U-0.79Ti alloy during pH changes: (a) before immersion, (b) pH = 2.43, 1 h, (c) pH = 7.0, 1 h, (d) pH = 11.44, 1 h.
The roughness of the sample surface in different conditions is analyzed by using the software of Imager4.7 (Table 2). After firstly being immersed in acidic 0.1 mol/L NaNO3 (pH = 2.43) solution, both Ra (arithmetical mean deviation of the profile) and Sm (mean spacing of the profile irregularities) increased sharply. However, after being immersed in neutral and alkaline solution, either Ra or Sm decreased obviously, while still being higher than the initial value. These results imply that the oxide film formed on the uranium–titanium alloy in neutral or alkaline environments should possess higher compactness compared with that in acidic environments.
Table 2.
The roughness of the U-0.79Ti alloy during pH changes.
Scanning electrochemical probe techniques have been widely used to study corrosion behavior in situ. It is generally acknowledged that active sites and inactive sites can be presented by potential distribution owing to inhomogeneity of electronic fields on the surface. Based on the measure principle of scanning electrochemical probes, the imaged potentials (ΔE) are the differences of average corrosion potential (Eaverage) and local corrosion potential (Elocal) at each point of scanning probe [29]:
Thus, if the ΔE of a certain site is more positive, the site possesses a higher reaction activity.
Figure 7 shows the potential distributions of the electrode surface in 0.1 mol/L NaNO3 solutions with different pH values successively. As can be seen, a number of active sites are observed on the surface at the initial stage when being immersed in the acidic solution (pH = 2.43) (Figure 7a). After 1 h, the number of active sites decreases slightly (Figure 7b). When the pH value is adjusted to neutrality and then to alkalinity (Figure 7c,d), the number of active sites on the surface decreases step by step. The changes of the potential distribution suggest that when the pH value of the solution increases, the number of defects on the oxide film would decrease.

Figure 7.
The in situ potential distribution changes of the U-0.79Ti alloy during pH changes: (a) pH = 2.43, 5 min, (b) pH = 2.43, 1 h, (c) pH = 7.0, 1 h, (d) pH = 11.44, 1 h.
3.5. Spectroscopic Ellipsometry Measurement
The thickness of the oxide film that formed on the alloy surface represents the corrosion resistance in solutions of different pH values. In order to obtain the changes of the oxide film’s thickness in situ during the pH changes of the solution, spectroscopic ellipsometry was applied. The spectroscopic ellipsometry measures the ratio of the amplitude reflection coefficients of p-polarized light (in p-polarization, the electric fields of incident and reflected light waves oscillate within the plane of incidence) and s-polarized light (in s-polarization, the electric fields of incident and reflected light waves oscillate vertical to the plane of incidence), i.e.,
where ρ is the ratio, rp is the reflection coefficient of p-polarized light and rs is the reflection coefficient of p-polarized light. Then, Ψ and Δ, which express the amplitude ratio and phase difference between p- and s-polarizations, respectively, can be calculated. When a sample structure is simple, the amplitude ratio Ψ is characterized by the refractive index n, while Δ represents light absorption described by the extinction coefficient k. By combining the ellipsometry parameters and the characteristics of sample structure to analyze, we could obtain kinds of surface information, including optical constant, thickness of the transparent layer, structure characteristics, etc.
Within the uranium–titanium alloy, the electrons inside mainly behave in the form of simple harmonic vibration for bound electrons or migration for free electrons under the light field. The optical properties could be described using the Drude-Lorentz (DL) mode. Here, ε is the dielectric constant.
εLorentz expresses the vibration of bound electrons. The Lorentz model assumes a physical model in which the electron oscillates in viscous fluid, since the mass of the atomic nucleus is far larger than that of the electron. The bound electrons are driven by the light filed. In Equation (11), E is the photon energy, j denotes the jth oscillator, Aj is called the oscillator strength, Γj is the damping coefficient representing the proportional constant of viscous force and Ej is the energy of the jth oscillator bound level. On the other hand, εDrude expresses migration of free electrons. As the free electrons are not affected by the binding effect of the atomic nucleus, the motivation of electrons driven by light filed is only affected by the damping impact. In other words, the energy of the bound level is 0. In Equation (12), Ep is oscillator strength and Γp is the damping coefficient. For the uranium–titanium alloy, it is reasonable that the optical properties in the visible light range are described by the DL mode. In the reflection on the uranium–titanium, the light only goes by an opaque substrate of the alloy. Thus, the reflection process could be described using a simple air/substrate mode. In the fitting process, by optimizing the parameters in the DL model, we could calculate the ellipsometry parameters Ψcal and Δcal. The calculated parameters (Ψcal and Δcal) and the measured parameters (Ψex and Δex) are compared using Equation (13). The root–mean–square error, σ, reflects the differences between the trial model and the real optical properties of the materials.
In Equation (13), Ej refers to the energies of different photons, M is the analytical points and P is the number of the unknown parameters in the model. When σ is minimum and close to 0, the calculated ellipsometry parameters agree with the measured ones, implying that the model could reflect the optical properties of the material. Then, we could use corresponding dispersion model to calculate the optical constants. Furthermore, we could calculate the thickness of the oxide film formed on the surface using certain models by the software. The fitting results as well as the measured data of ellipsometry parameters Ψ and Δ are shown in Figure 8a. The calculated results agree with the measured data quite well, suggesting that the model and corresponding parameters conform with the real optical properties of U-0.79Ti alloy well. Further, the calculated optical constants are shown in Figure 8b.

Figure 8.
(a) The ellipsometry parameters and (b) optical constants of the oxide film formed on the U-0.79Ti alloy under different conditions.
Table 3 exhibits the thickness of the oxide films with different pH values. When the sample was directly immersed in the acidic solution (pH = 2.43) for 3h, the thickness of the oxide film is 9.1 nm. However, during the process of pH transition from acidity to alkalinity (from 2.43 to 11.4), the thickness of the oxide film increases to 11.4 nm. These results demonstrate that high pH value of the immersing solution could decrease the dissolution speed of the oxide film, resulting in increasing the thickness of the oxide film. Furthermore, this would also lead to a decrease of the corrosion current density to a certain extent during the pH transition.
Table 3.
The thickness of the oxide film formed on the U-0.79Ti alloy under different conditions.
4. Conclusions
In this paper, we have carefully investigated the influences of pH value transition on the properties of the oxide film formed on the U-0.79Ti alloy (immersed in 0.1 M NaNO3 solutions) via a combining study of traditional electrochemical tests and scanning reference electrode technique. The electrochemical test results show that both corrosion potential and corrosion current density decrease while the pH value increases. The results also prove that the oxide film possesses semiconductor properties, however, the semiconductor type varied with the pH values. In the acidic condition (pH = 2.43), the oxide film appears as a p-type semiconductor. When the condition changes to neutral (pH = 7.00), the semiconductor type exhibits a close relationship with the applied potential: when the potential is lower than −0.3 V, the oxide film is a kind of p-type semiconductor; when the potential exceeds −0.3 V, on the contrary, the oxide film appears as a n-type semiconductor. When the condition finally changes to alkalinity (pH = 11.43), the oxide film eventually turns to an n-type semiconductor in the whole applied potentials. The combining technique of SRET/STM provides the microscopic explanation of the macroscopic properties. During the pH value transition, either the surficial microscopic defects or potential distribution exhibits significant changes. The defects distributed on the oxide film would grow up in an acidic condition while, on the contrary, the defects with small sizes could be restored during the oxide film forming process in the neutral and alkaline condition, and the roughness decreases to a certain extent. Moreover, the potential distribution shows that the oxide film possesses more active sites in the acidic condition than in the neutral or alkaline condition, implying a close relationship with macroscopic electrochemical properties. The results of spectroscopic ellipsometry also confirm that the properties of the oxide film changes with the pH value, i.e., the thickness will increase when the pH value increases. In summary, the relationship between pH values and oxide film properties is studied and, relatively, the neutral and alkaline conditions could help the formation of oxide film with better protective effects on the surface of the U-0.79Ti alloy. Furthermore, the analytical techniques applied in this work could also be expanded in other researches about other uranium alloys or ordinary alloy materials to reveal the relationship between the macroscopic properties and the microscopic structure.
Author Contributions
Data curation, D.C.; Formal Analysis, D.C. and M.W.; Funding Acquisition, G.S. and Y.L.; Investigation, D.C., D.Z. and H.W.; Methodology, D.C.; Project Administration, G.S.; Resources, X.C.; Supervision, G.S. and Y.L.; Writing—Original Draft, D.C.; Writing—Review and Editing, Y.L.
Funding
This research was funded by the National Natural Science Foundation of China (No. 61505182), the National Science Foundation for Young Scientists of China (No. 21805251) and the Initiative Scientific Research Program of Materials Institute, CAEP (No. TP02201704).
Conflicts of Interest
The authors declare no conflict of interest.
References
- Kindlimann, L.E.; Greene, N.D. Dissolution kinetics of nuclear fuels: ⅠUranium. Corrosion 1967, 23, 29–33. [Google Scholar] [CrossRef]
- Kindlimann, L.E.; Greene, N.D. Mechanism for the acid corrosion behavior of neutron-irradiated uranium. Corrosion 1970, 26, 189–192. [Google Scholar] [CrossRef]
- Wilkinson, W.D. Uranium Metallurgy; Interscience Publishers: New York, NY, USA, 1962. [Google Scholar]
- Greenholt, C.J.; Weirick, L.J. The oxidation of U-0.75wt.%Ti in environments containing oxygen and/or water vapour at 140 °C. J. Nucl. Mater. 1987, 144, 110–120. [Google Scholar] [CrossRef]
- Koger, J.W. Overview of Corrosion, Corrosion Protection, and Stress-Corrosion Cracking of Uranium and Uranium Alloys (No. Y/DV—202); Oak Ridge Y-12 Plant: Oak Ridge, TN, USA, 1981. [Google Scholar]
- Ecklmeyer, K.H. Effects of Heat Treatment on the Microstructure and Mechanical Properties of U-0.75wt.% Ti. (No. SAND--75-0599); Sandia National Labs.: Livermore, CA, USA, 1976.
- The Royal Society. The Health Hazards of Depleted Uranium Munitions: Part II; The Royal Society: London, UK, 2002. [Google Scholar]
- Erikson, R.L.; Divine, J.R.; Hostetler, C.J.; Price, K.R. A Review of the Environmental Behavior of Uranium Derived from Depleted Uranium Alloy Penetrators; Pacific Northwest Lab.: Richland, WA, USA, 1990.
- Milton, L.; Zabielski, C.V.; Sklover, G.N. Corrosion Behavior of Depleted Uranium-Titanium and Uranium-Molybdenum Alloy (No. AMMRC-TR-73-11); Army Materials and Mechanics Research Center: Watertown, MA, USA, 1973. [Google Scholar]
- Handley-Sidhu, S.; Worsfold, P.J.; Boothman, C.; Lloyd, D.J.; Alvarez, R.; Livens, F.R.; Vaughan, D.J.; Keith-Roach, M.J. Corrosion and fate of depleted uranium penetrators under progressively anaerobic conditions in estuarine sediment. Environ. Sci. Technol. 2009, 43, 350–355. [Google Scholar] [CrossRef] [PubMed]
- Xu, M.; Yu, S.; Luo, T. Atmospheric corrosion and stress corrosion for uranium alloy. Chin. Soc. Corr. Prot. 2004, 24, 112–115. [Google Scholar]
- Cai, D.; Sang, G.; Wang, Q. Corrosion inhibition of sodium chromate for uranium-titanium alloy in sodium chloride solution. Rare Met. Mater. Eng. 2014, 43, 1447–1451. [Google Scholar]
- Toque, C.; Milodowski, A.E.; Baker, A.C. The corrosion of depleted uranium in terrestrial and marine environments. Environ. Radioact. 2014, 128, 97–105. [Google Scholar] [CrossRef] [PubMed]
- Ritchie, A.G. A review of the rates of reaction of uranium with oxygen and water vapour at temperatures up to 300 °C. J. Nucl. Mater. 1981, 102, 170–182. [Google Scholar] [CrossRef]
- Aronson, S.; Roof, R.B.; Belle, J. Kinetic study of the oxidation of uranium dioxide. Chem. Phys. 1957, 27, 137–144. [Google Scholar] [CrossRef]
- Bloch, J.; Atzmony, U.; Dariel, M.P.; Mintz, M.H.; Shamir, N. Surface spectroscopy studies of the oxidation behavior of uranium. J. Nucl. Mater. 1982, 105, 196–200. [Google Scholar] [CrossRef]
- Nagelberg, A.S.; Ottesen, D.K. Corrosion Behavior of Lean Uranium-Titanium Alloys (SAND80-8215); Sandia National Labs.: Livermore, CA, USA, 1980.
- Shi, P.; Luo, L.; Zhao, Y.; Fu, X.; Ao, B.; Bai, B.; Wang, X. The evolution of chemical nature on U-0.79wt.%Ti surface during vacuum annealing. Appl. Surf. Sci. 2015, 343, 49–55. [Google Scholar] [CrossRef]
- Zhang, G.; Wang, X.; Wu, J. Influence of silicon impurity on the reaction of U-0.7wt.%Ti alloy and hydrogen. J. Alloy. Compd. 2015, 648, 122–126. [Google Scholar] [CrossRef]
- Shi, P.; Shen, L.; Bai, B.; Lang, D.; Lu, L.; Li, G.; Lai, X.; Zhang, P.; Wang, X. Preferred hydride growth orientation of U-0.79wt.%Ti alloy with β+U2Ti microstructure. J. Nucl. Mater. 2013, 441, 1–5. [Google Scholar] [CrossRef]
- Huang, J.; Wu, X.; Han, E. Influence of pH on electrochemical properties of passive films formed on Alloy 690 in high temperature aqueous environments. Corros. Sci. 2009, 51, 2976–2982. [Google Scholar] [CrossRef]
- Wang, Y.; Cheng, G.; Wu, W.; Qiao, Q.; Li, Y.; Li, X. Effect of pH and chloride on the micro-mechanism of pitting corrosion for high strength pipeline steel in aerated NaCl solutions. Appl. Surf. Sci. 2015, 349, 746–756. [Google Scholar] [CrossRef]
- Hakiki, N.E.; Boundin, S.; Rondot, B.; Belo, M.D.C. The electronic structure of passive films formed on stainless steels. Corros. Sci. 1995, 37, 1809–1822. [Google Scholar] [CrossRef]
- Guo, X.; Gao, K.; Qiao, L.; Chu, W. The correspondence between susceptibility to SCC of brass and corrosion-induced tensile stress with various pH values. Corros. Sci. 2002, 44, 2367–2378. [Google Scholar] [CrossRef]
- Shetty, S.; Nayak, J.; Shetty, A.N. Influence of sulfate ion concentration and pH on the corrosion of Mg–Al–Zn–Mn (GA9) magnesium alloy. Magnes. Alloy. 2015, 3, 258–270. [Google Scholar] [CrossRef]
- Liu, X.J.; Spikes, H.; Janet, S.; Wong, S. In situ pH responsive fluorescent probing of localized iron corrosion. Corros. Sci. 2014, 87, 118–126. [Google Scholar] [CrossRef]
- Marques, A.G.; Izquierdo, J.; Souto, R.M.; Simães, A.M. SECM imaging the cut edge corrosion of galvanized steel as a function of pH. Electrochim. Acta 2015, 153, 238–245. [Google Scholar] [CrossRef]
- Ye, C.; Hu, R.; Li, Y.; Lin, C.; Pan, J. Probing the vertical profiles of potential in a thin layer of solution closed to electrode surface during localized corrosion of stainless steel. Corros. Sci. 2012, 61, 242–245. [Google Scholar] [CrossRef]
- Lin, C.; Zhou, X.; Tian, Z. Study of localized corrosion of metals by using the electrochemical techniques with spatial resolution. Electrochemistry 1999, 5, 25–30. [Google Scholar]
- Shao, M.; Fu, Y.; Lin, C. A study on pitting corrosion of aluminum alloy 2024-T3 by scanning microreference electrode technique. Mater. Sci. Eng. A 2003, 344, 323–327. [Google Scholar] [CrossRef]
- Lin, B.; Hu, R.; Lin, C. A study on the initiation of pitting corrosion in carbon steel in chloride-containing media using scanning electrochemical probes. Electrochim. Acta 2010, 55, 6542–6545. [Google Scholar] [CrossRef]
- Xu, H.; Liu, Y.; Lin, C.J. Corrosion behavior of reinforcing steel in simulated concrete pore solutions: A scanning micro-reference electrode study. Electrochim. Acta 2009, 54, 4067–4072. [Google Scholar] [CrossRef]
- Dong, W.; Xie, G.; Miller, T.R.; Franklin, M.P.; Oxenberg, T.P.; Bouwer, E.J.; Ball, W.P.; Halden, R.U. Sorption and bioreduction of hexavalent uranium at a military facility by the Chesapeake Bay. Environ. Pollut. 2006, 142, 132–142. [Google Scholar] [CrossRef] [PubMed]
- Laue, C.A.; Gates-Anderson, D.; Fitch, T.E. Dissolution of metallic uranium and its alloys. J. Radioanal. Nucl. Chem. 2004, 261, 709–717. [Google Scholar] [CrossRef]
- Stephanie, H.S.; Keith-Roach, M.J.; Loyd, J.R.; Vaughan, D.J. A review of the environmental corrosion, fate and bioavailability of munitions grade depleted uranium. Sci. Total Environ. 2010, 408, 5690–5700. [Google Scholar]
- McCafferty, E. Calidation of corrosion rates measured by the Tafel extrapolation method. Corros. Sci. 2005, 47, 3202–3215. [Google Scholar] [CrossRef]
- Zhao, Y.; Guo, X. Determination of electrochemical kinetic parameters in a mixture controlled corrosion system. Acta Phys. Chim. Sin 2006, 22, 1281–1286. [Google Scholar]
- Huntley, D.J. The dielectric constant of UO2 and its varation with porosity. J. Phys. 1966, 44, 2952–2956. [Google Scholar]
© 2019 by the authors. Licensee MDPI, Basel, Switzerland. This article is an open access article distributed under the terms and conditions of the Creative Commons Attribution (CC BY) license (http://creativecommons.org/licenses/by/4.0/).