1. Introduction
Lithium niobate (LiNbO
3, LN) is an innovative material which has been researched extensively in the last few years due to its physicochemical properties. It has a fusion temperature close to 1200 °C, a Curie temperature of 1206 °C [
1], and a perovskite-type crystalline structure, that is, it is composed of two cations A = Li and B = Nb, and an anion X = O [
2]. The crystalline organization in perovskites allows the movement of B cations provoking a polarization of the crystal while enabling high pyroelectric, photo-refractive, ferro-electric, electro-optic, piezo-optic, acusto-optic and foto-voltaic coefficients, and nonlinear electric susceptibilities [
3,
4,
5]. Some of the methods adopted for the synthesis of lithium niobate include a water-soluble reaction which solves problems such as the use of toxic compounds, but has a long reaction time and limited control of the reaction conditions [
6]; Liu et al. [
7] used a combustion method to synthesize high purity LN powders, however, while this approach uses a low reaction temperature and zero solvents, the end product applications may be limited because of the morphological and macroscopic characteristics.
Zeng and Tung [
8] had a different approach by using the sol-gel method with niobium (V) ethoxide and lithium nitrate as precursors, which is cheaper to achieve and requires a low calcination temperature as well in comparison with an all-alkoxide reaction, however, this synthesis use acetylacetone as a chelant, which is a highly toxic reactant. Wang et al. [
9] also used the sol-gel method with dihydrate lithium acetate and niobium chloride as precursors, but the latter is highly reactive and toxic for humans and the environment and requires special handling. Some of the advantages of the sol-gel method are that due to the relative proximity of the mixed components of the gel, inferior temperatures are required for the formation of the ceramic and crystallization. Furthermore, it yields a high purity and homogeneous product and electrospinning solutions for the obtainment of fibers. The most important factors influencing the sol-gel process and the preparation of ceramic fibers by electrospinning are the type and concentration of precursor [
10,
11,
12,
13].
Organometallic compounds, such as niobium ethoxide (Nb(OCH
2CH
3)
5) and lithium hydroxide (LiOH), have been recently used in the processing route. For instance, acid catalysts are necessary, hydrolysis is difficult to control and requires additional steps and a long time for heating, and stirring is needed. In this works is reported that lithium niobate nanofibers were formed by the coalescence of colonies of particles at low temperature, giving rise to nanofibers with two different morphologies, cylindrical and necklace-like nanofibers [
14]. The oriented growth in the matrix of the nanofibers is hindered by the fracture of the fibers, so slow heating or treatment at a higher temperature is necessary when using a polymer as a matrix. Recently, there has been an intense research effort on electrospinning of ceramics, we were not able to find many reports on the synthesis of lithium niobate nanofibers by electrospinning. Precursor concentration is a crucial parameter for the efficient preparation of fibers by electrospinning and sol gel because it affects viscosity and surface tension. In the specific case of ceramics, it has been reported that characteristics like diameter, grain growth rate, and sinterability are influenced by concentration values [
13]. In this article, the synthesis of LiNbO
3 and SiO
2 were carried out using the sol-gel method by avoiding the use of harmful reactants while keeping the synthesis as brief as possible.
2. Materials and Methods
Lithium niobate sol-gel was prepared by dissolving Lithium-niobium ethoxide (Alfa Aesar 99%) in ethanol and using acetic acid as a catalyzer for hydrolysis, keeping a molar ratio of 1:10:6. Silica sol-gel was prepared by dissolving tetraethyl orthosilicate in ethanol using hydrochloric acid as a catalyzer for hydrolysis, keeping a molar ratio of 1:0.1. Simultaneously, 6 mL of a 10% Polyvinyl pyrrolidone, PVP (Alfa Aesar Mw 1,300,000) solution were prepared using ethanol (Jalmek 99.5%) as the solvent. This solution was divided into equal amounts and then added to both sol-gels and homogenized for 1 h. Precursor solutions of 0.003 (M003), 0.03 (M03) and 0.05 M (M05) of LiNbO3, and 10 w/v% SiO2 were obtained. The precursor solutions were transferred to 10 mL glass syringes connected through a hose to a coaxial nozzle and placed in a KD Scientific injection pump. The distance used between the nozzle and the collector was 10 cm. The feeding rate was 4 mL/h for the outer solution of SiO2 and 3 mL/h for the inner solution of LiNbO3, for samples M003 and M03; for the sample M05 1.5 mL/h for SiO2 and 3 mL/h for the LiNbO3 solution at 9 to 10 kV. Fibers were collected on a rotating drum covered with aluminum foil. Characterization of as-spun fibers was carried out by Fourier Transformed Infrared Spectroscopy (ALPHA Platinum, Bruker, Mexico City, Mexico) with 40 scans and a resolution of 4 cm−1 Morphology and diameters were determined by Scanning Electron Microscopy (JSM-6010 PLUS/LA, JEOL, Mexico City, Mexico). Before observation, the membrane samples were coated with gold using a sputter coating. Thermogravimetric Analysis, Differential Thermal Analysis and Differential Scanning Calorimetry were carried out simultaneously with an SDT Q600 instrument (SDT Q600 V20.9 build 20, TA Instruments, Mexico City, Mexico) using a 10 °C/min heating rate. The samples treated at 800 °C, 1000 °C, 1200 °C and 1400 °C were characterized by FTIR (ALPHA Platinum, Bruker, Mexico City, Mexico), SEM (JSM-6010 PLUS/LA, JEOL, Mexico City, Mexico), Raman spectroscopy (Alpha 300, Witec, Ulm, Germany) using a 532 nm laser scanning an area of 5 µm, and crystalline phases were identified by XRD with parameters Cu Kα1, 35 kV, 25 mA (X’Pert PRO, Malvern Panalytical, Mexico City, Mexico) and a scanning range from 20° to 40° at a 2°/min scan speed.
3. Results and Discussions
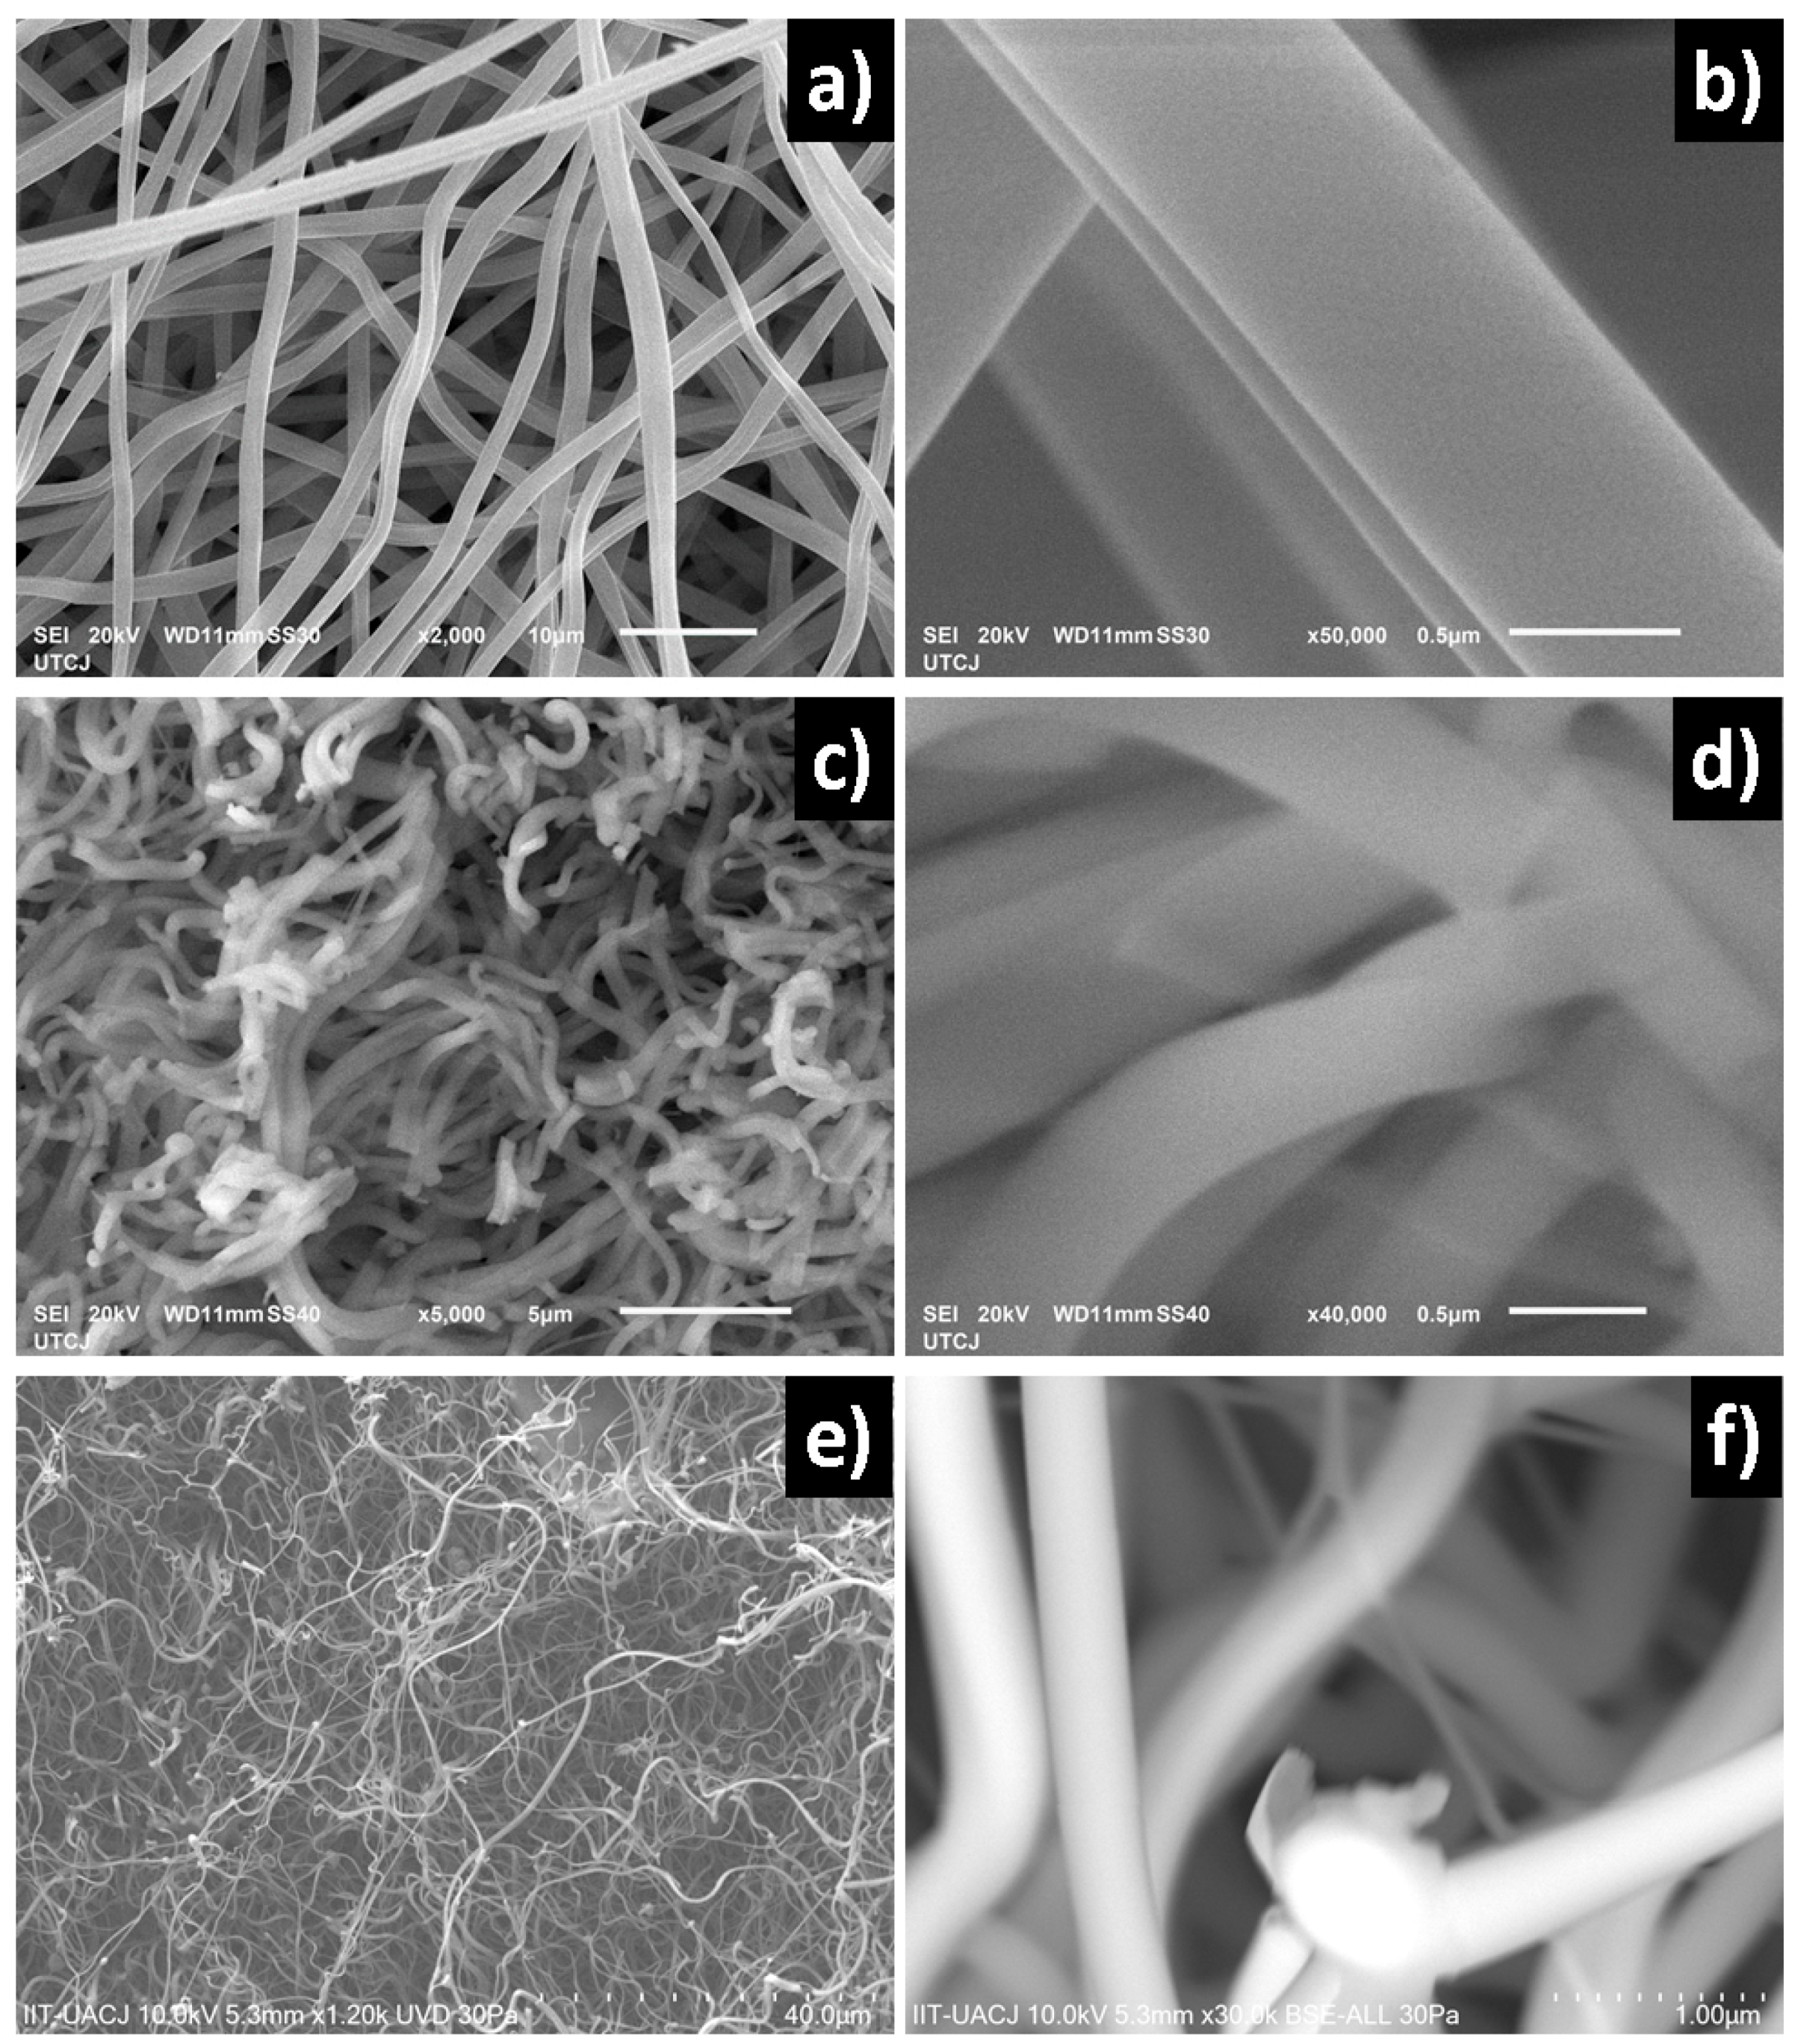
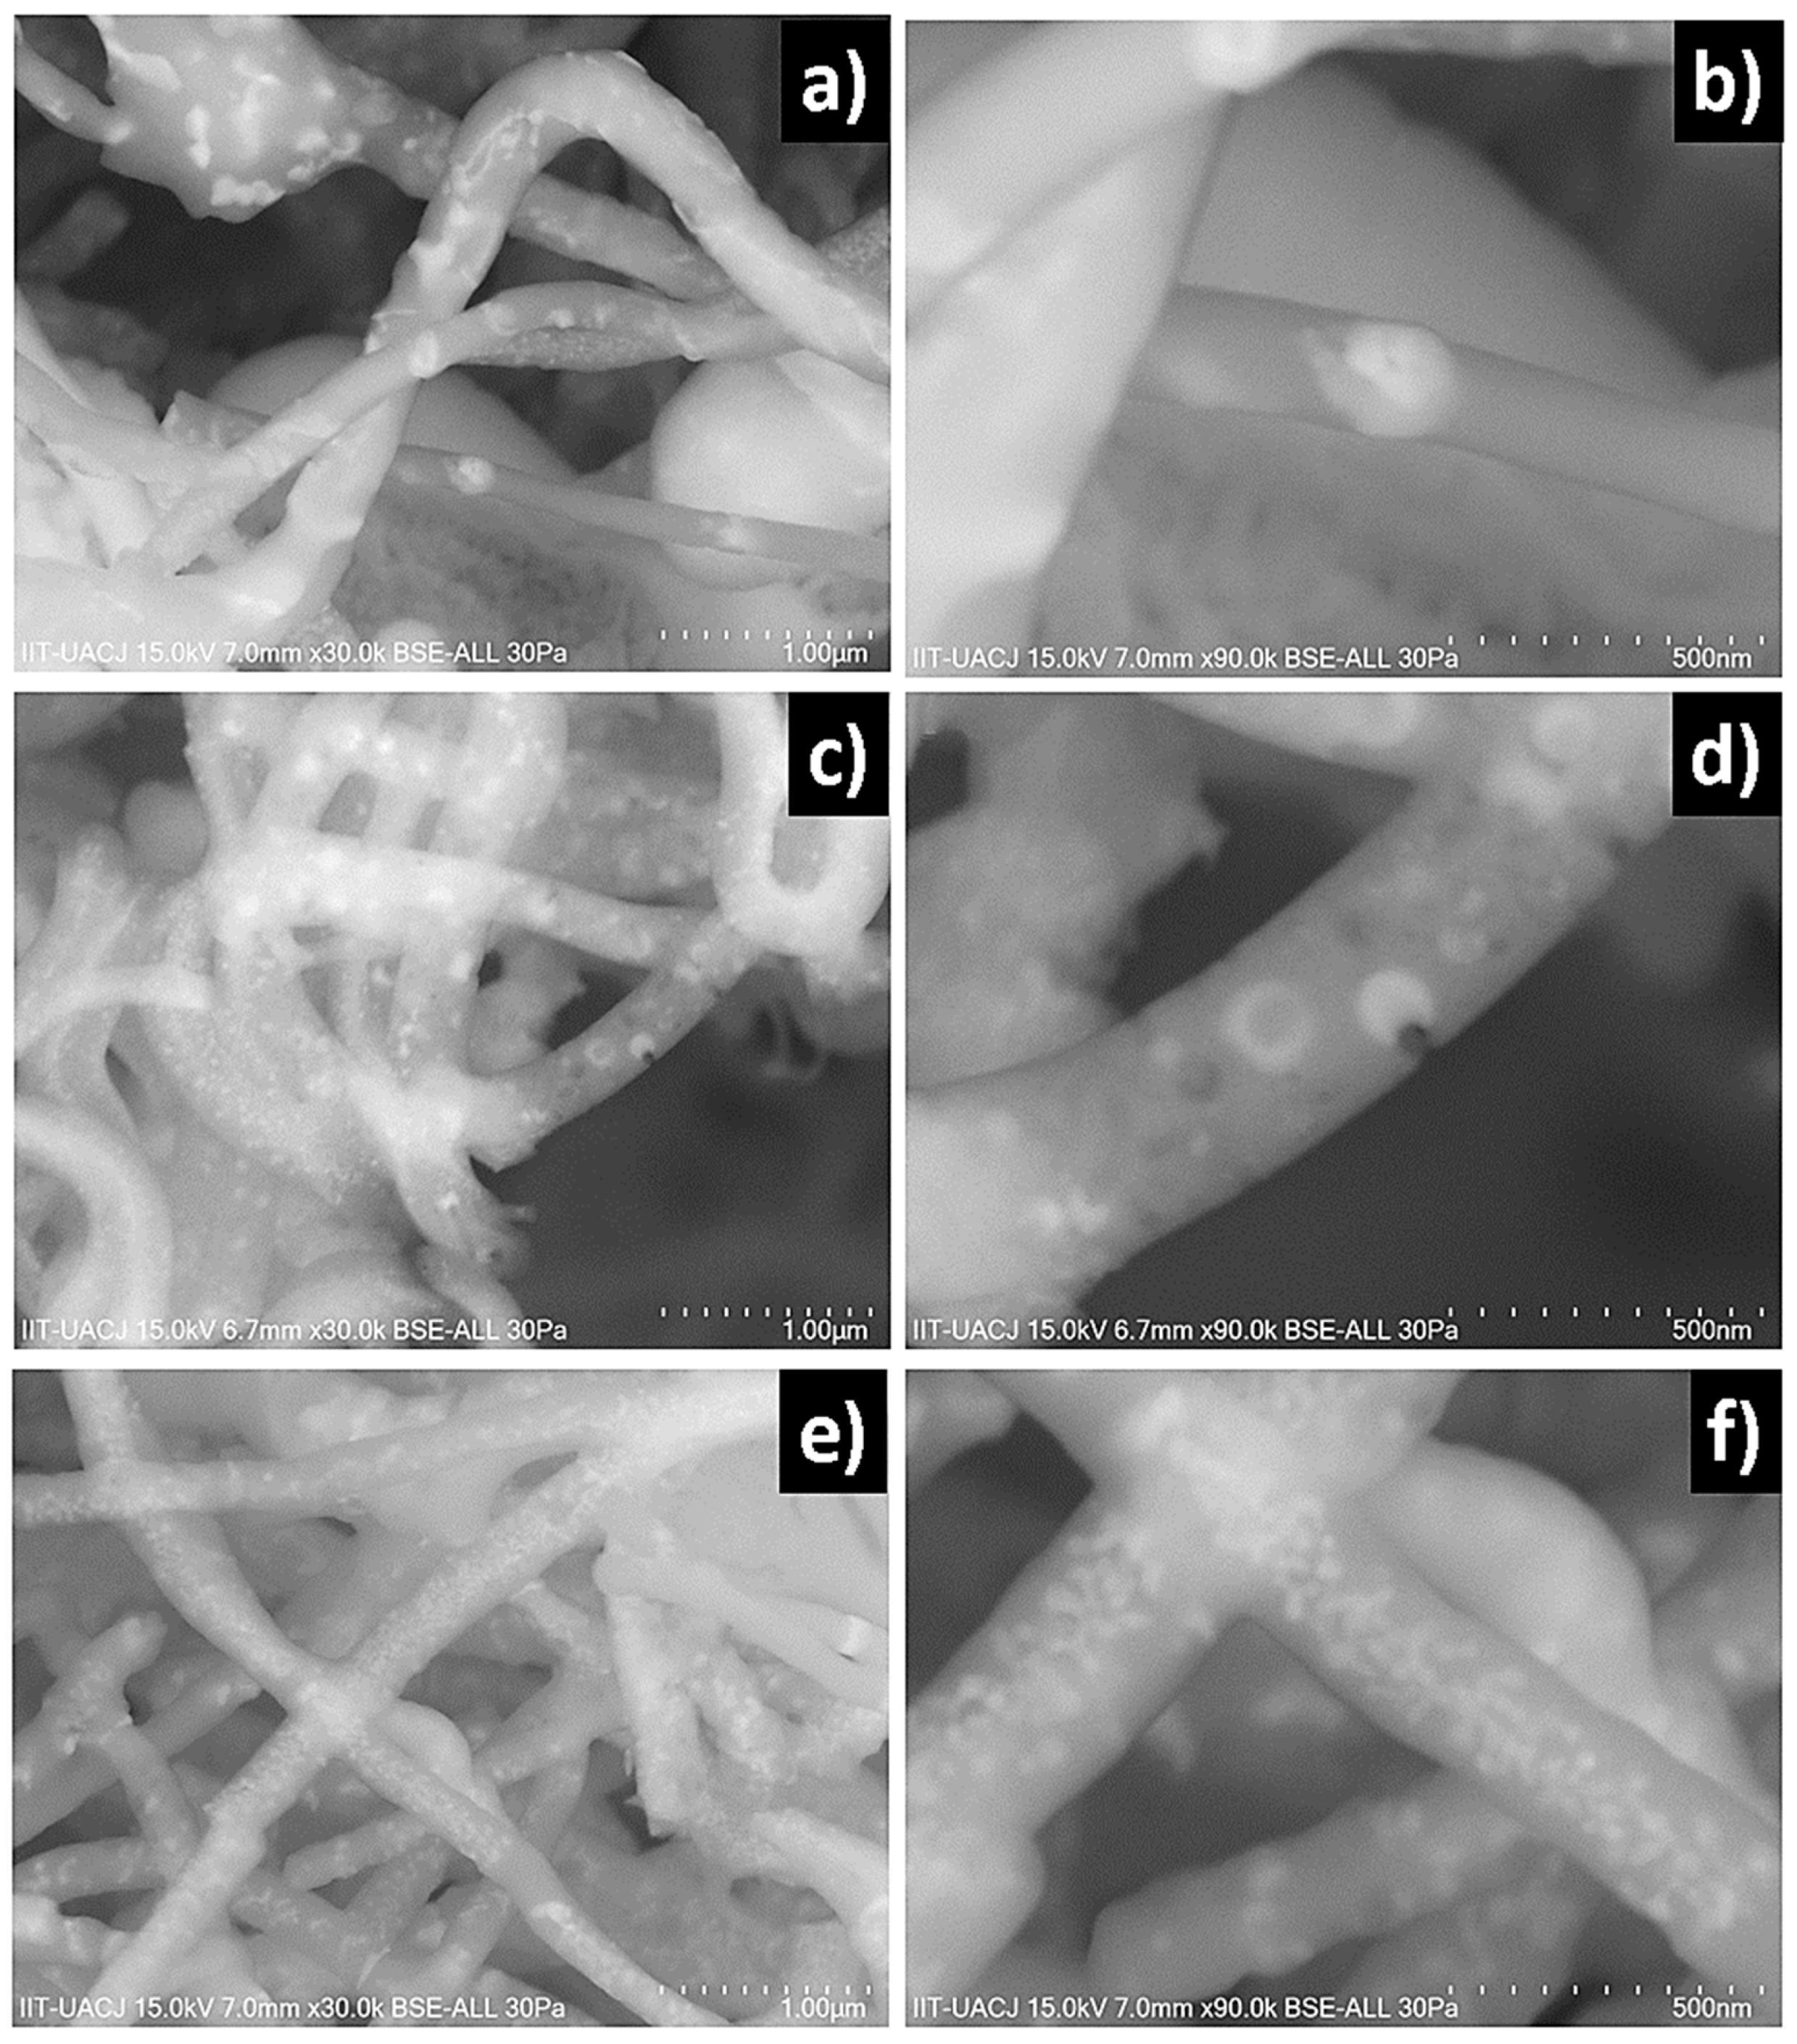
The SEM images obtained from as-spun samples M003, M03 and M05 are observed in
Figure 1.
Figure 1a,b show micrographs at 2000 and 50,000× of the M003 sample obtained, the fibers were cylindric with a homogeneous surface and random orientation. The average diameter of fibers was 760 ± 82 nm.
Figure 1c,d show micrographs at 5000 and 40,000× of the M003 sample in which images shows the same morphology with an average diameter of 510 ± 94 nm. The fibers present a diameter of 330 ± 83 nm distributed randomly. A further reduction in the inner flow to 1.5 mL/h to produce fibers with a cylindric morphology and homogeneous surface and an average diameter of 330 ± 118 nm is shown in
Figure 1e,f micrographs at 1200 and 30,000× of the M05 sample. A few defects of round and elongated shape are observed with small accumulations. It is seen that at a low concentration of lithium niobate the fibers appear to be polymer only because the precursor solution of sample M003 is mostly silica sol-gel. The sample M03 presents ruptures and discontinuity in the fibers. On the other hand, by increasing the concentration of lithium niobate, continuity is restored due to the greater stability of the injected flows as a result of the increase in lithium concentration.
The sample obtained from solution M05 was characterized by DTA, IR, Raman and XRD because this precursor solution allowed for a better electrospun process and gives uniform fibers.
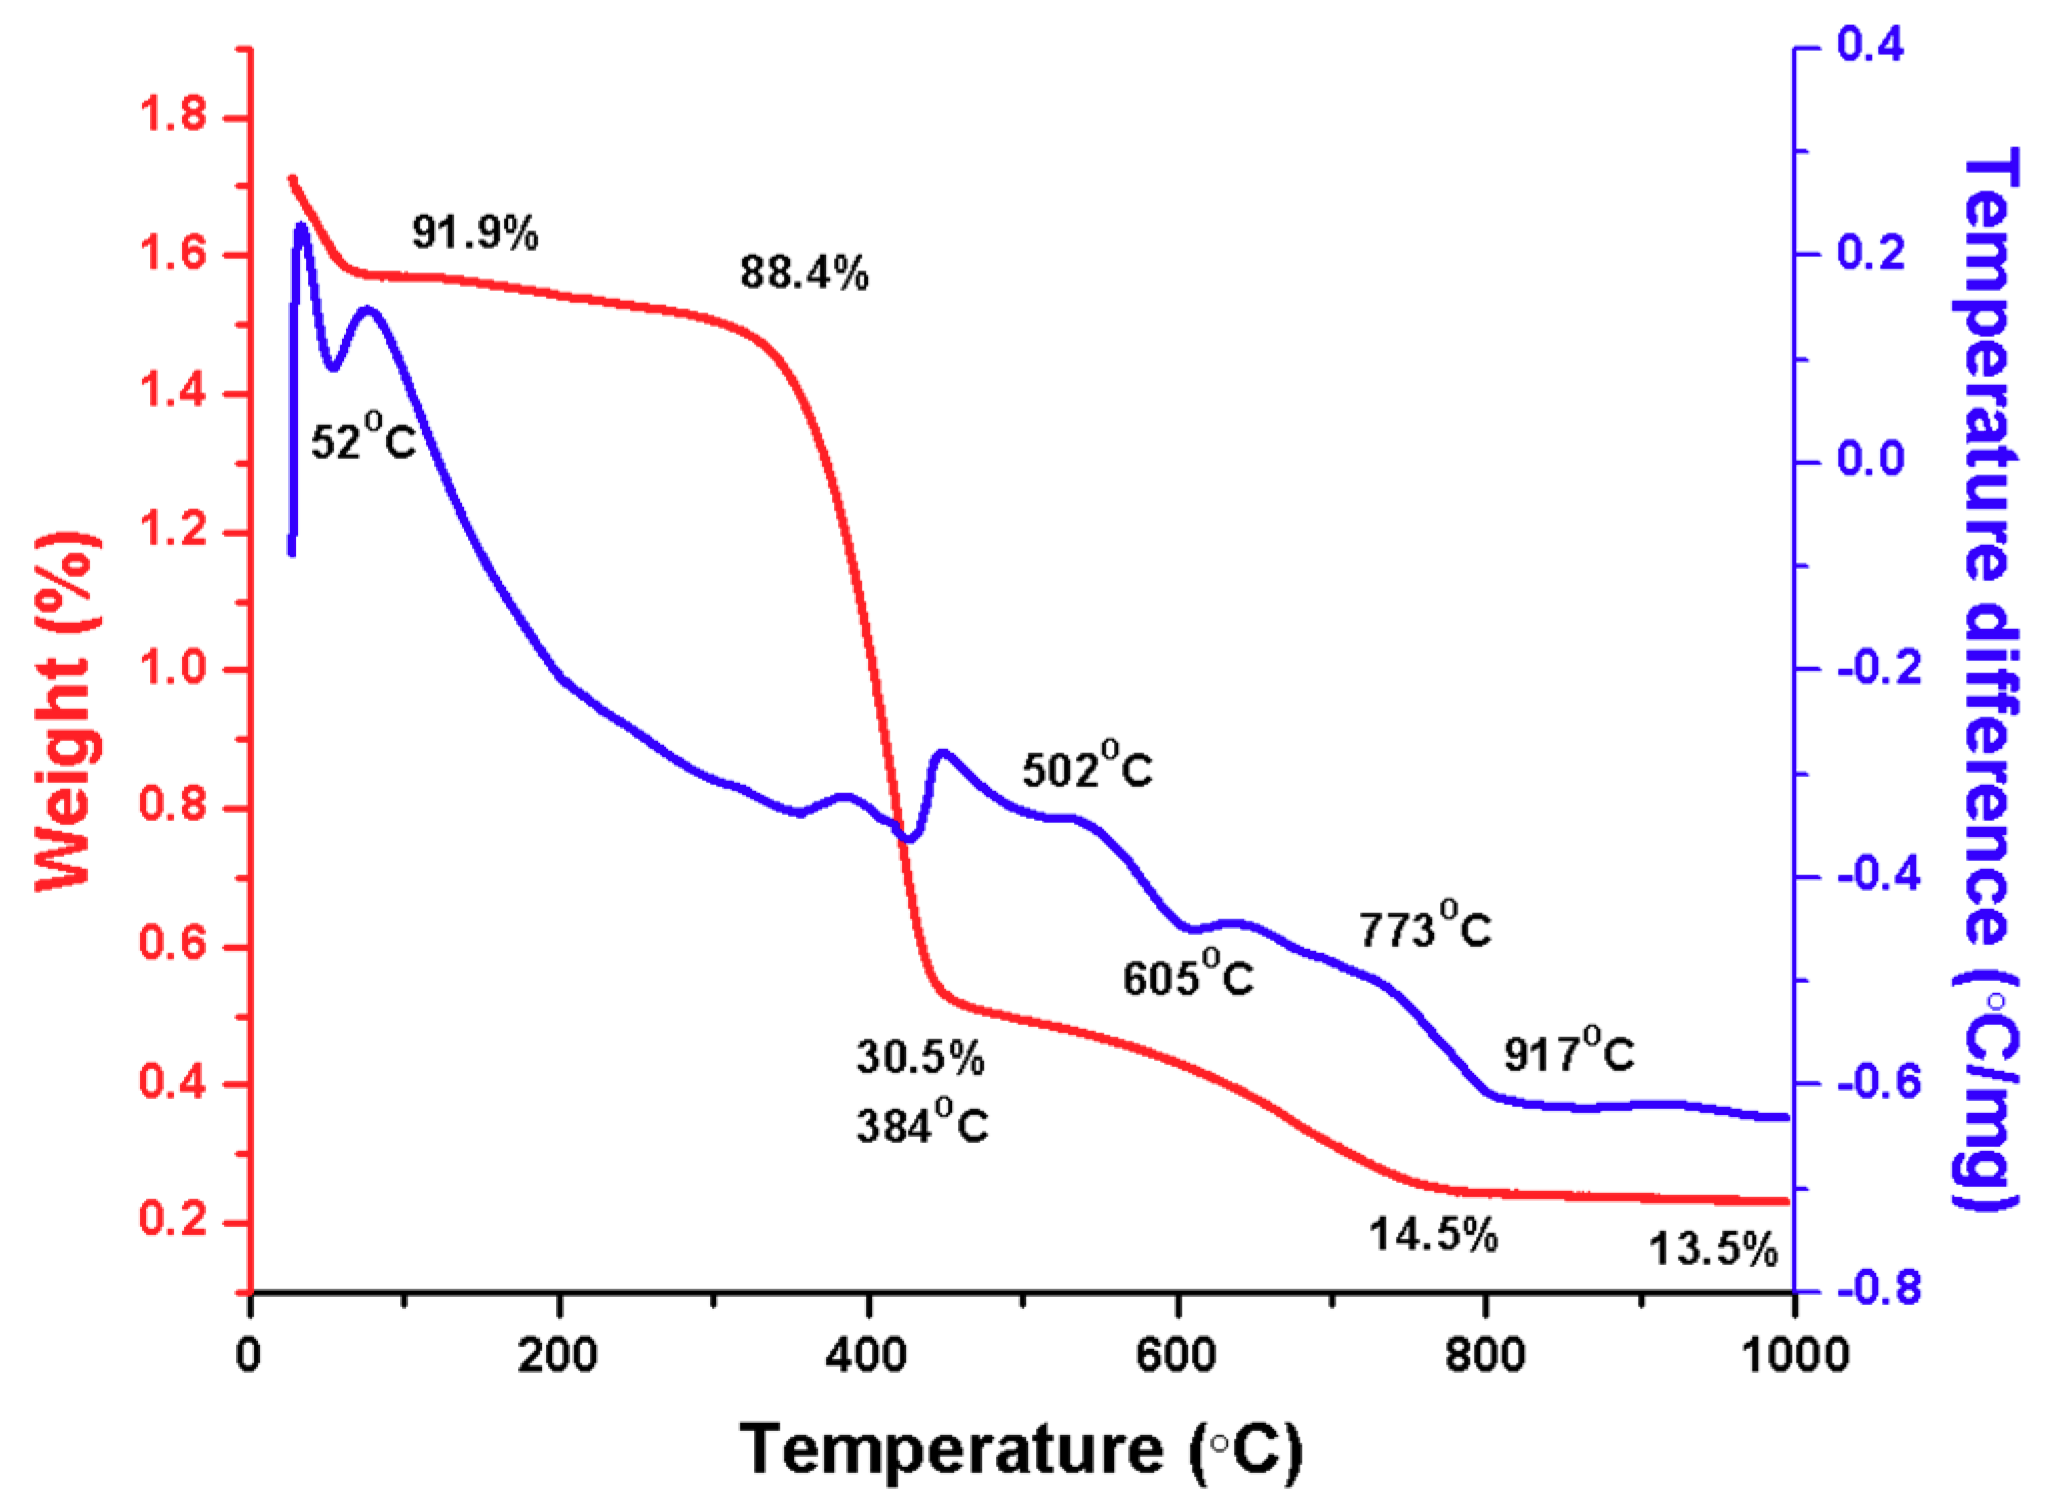
Figure 2 is the thermogram by differential scanning calorimetry and thermogravimetric analysis for sample M05, where a loss of 8.07% weight at 91 °C can be observed, corresponding to the loss of water. Subsequently, the weight remains stable up to 288 °C where it descends by 11.59% corresponding to the organic components derived from the polymer. At 352 °C, the weight loss increases to 17.07%, temperature at which a change in crystalline phase occurs and from this point and up to 454 °
C the amount of weight is reduced by 52.4% due to a great loss of organic matter. At 773 and 917 °C, a loss of 15.97% and 0.98% occur, respectively. The analysis reveals that after heat treatment under a temperature of 920 °C, the composite loses up to 86.42% of its weight.
The infrared spectrum of as-spun fibers M05 is shown in
Figure 3. At 25 °C the spectra show absorption bands related to functional groups in the PVP, silica and lithium-niobium ethoxide/ethanol/acetic acid solution produced by sol-gel. PVP vibration bands can be observed, a hydroxyl stretching band of H
2O is present at 3420 cm
−1, followed by C–H stretching bands at 2900, 1650 and 1410 cm
−1. In the fingerprint zone, the stretching of carbonyl (C=O) bonds can be observed at 1655 cm
−1, while scissoring bands of methyl groups are present at 1441, 1415 and 1379 cm
−1 and other the characteristic vibration of the C=O group appears at 1291 and 650 cm
−1 to the nitrogen of the tertiary amine in PVP, C–O bands at 1000–1050 cm
−1 and CH bands a 1400–1500 cm
−1 can be observed. A band corresponding to C–N bonds is observed at 1291 cm
−1 and IR spectra show peaks for the bonds Nb–O at 500–700 cm
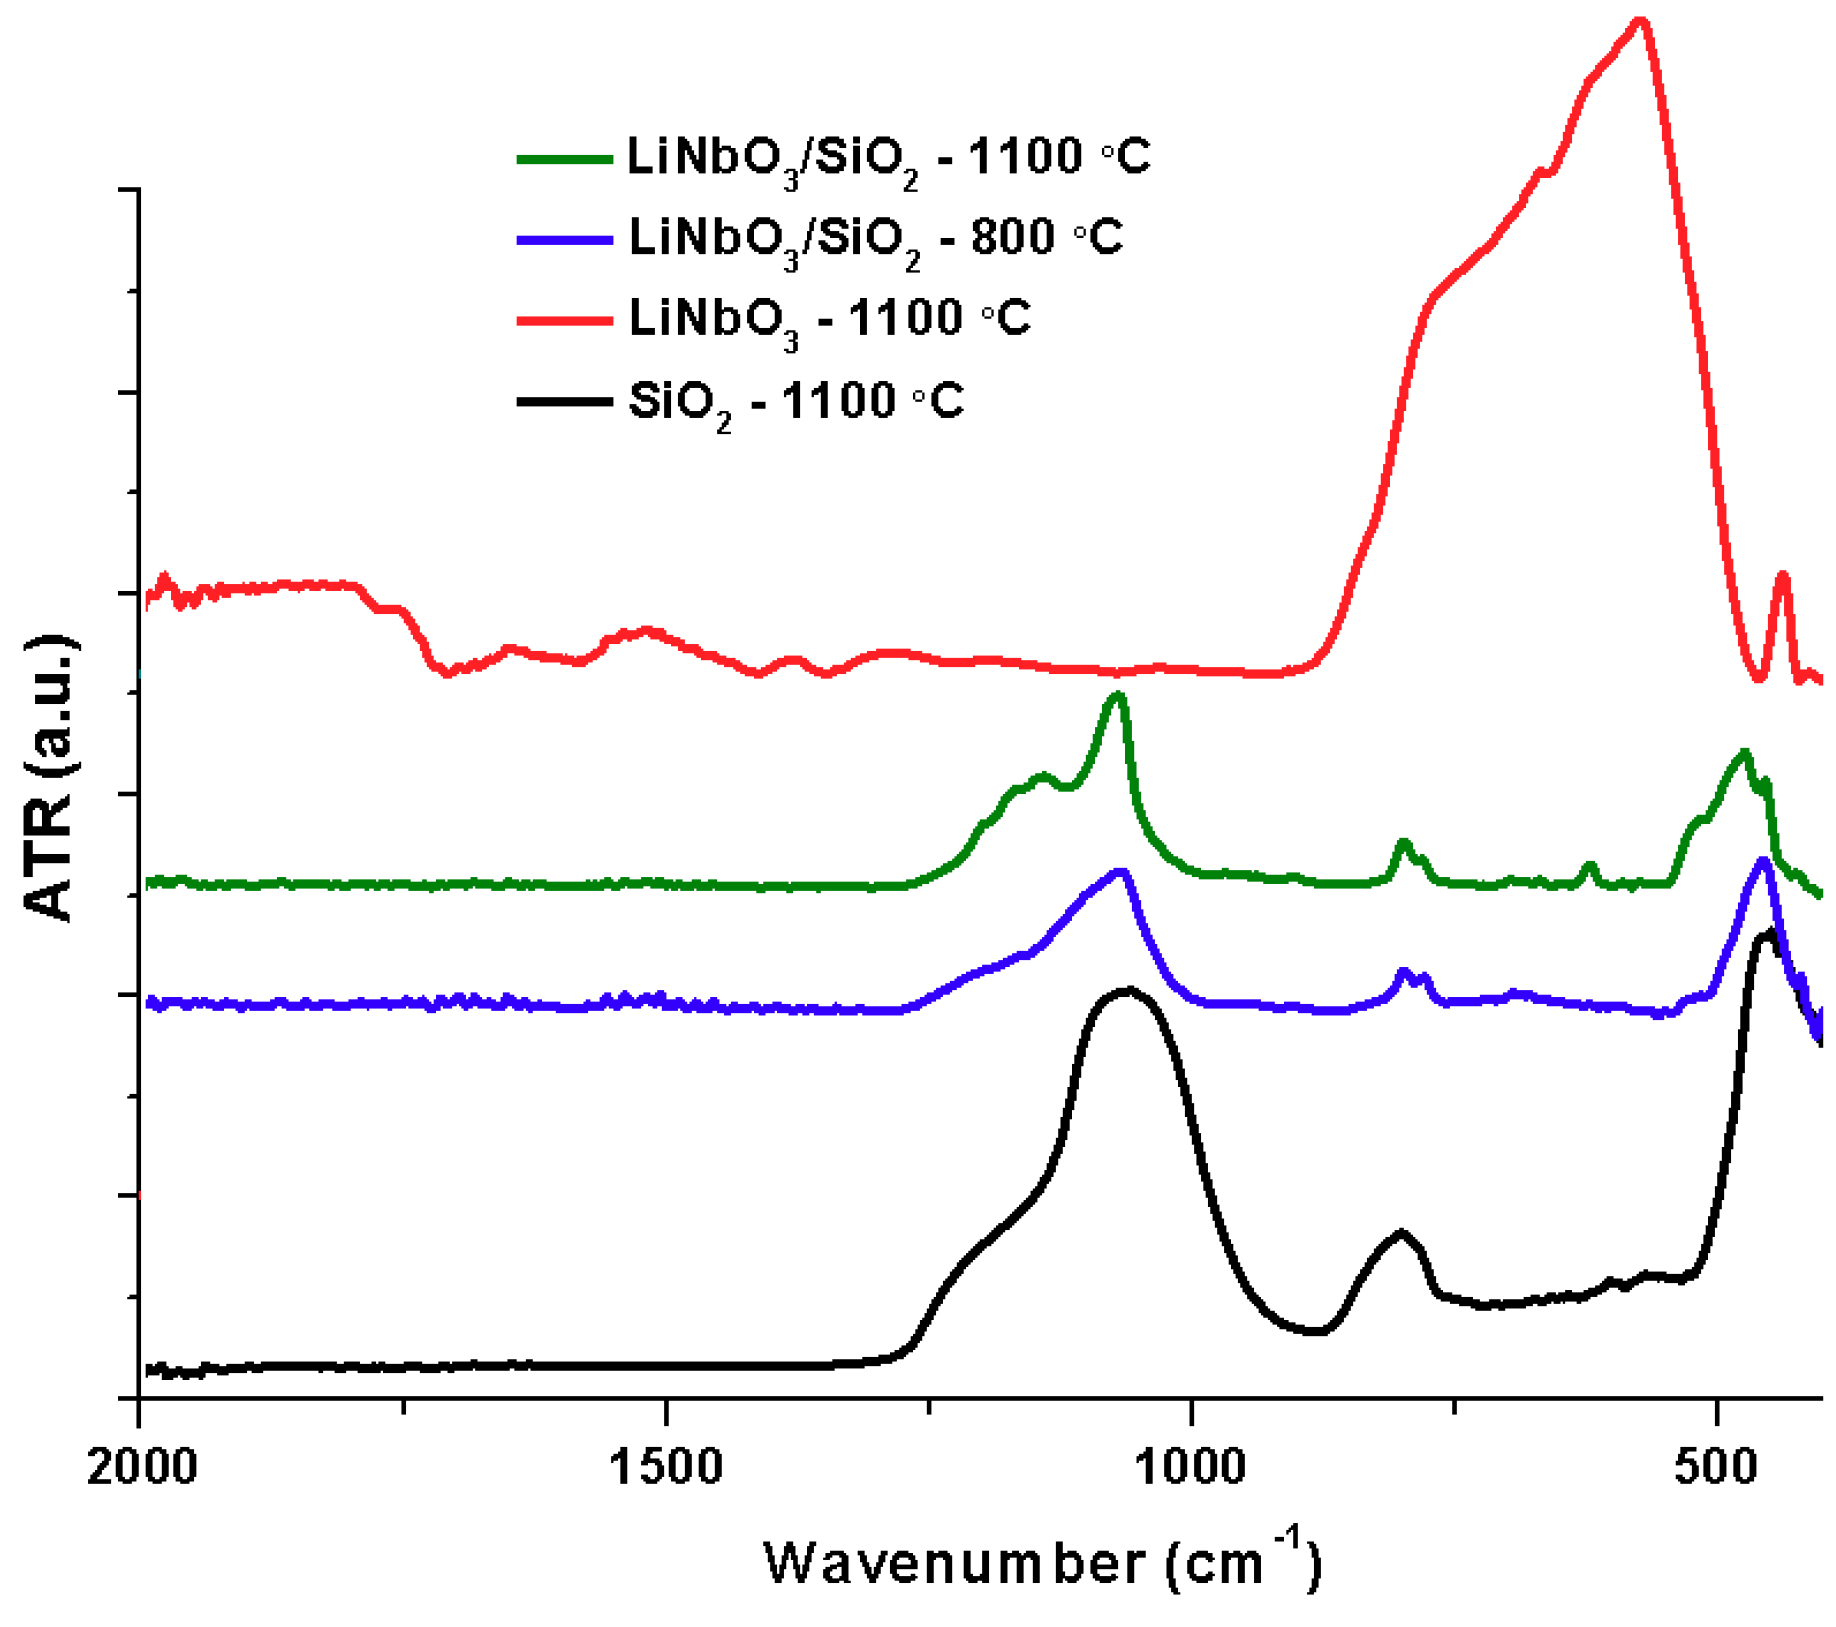
−1. The infrared analysis of the SiO
2 fibers (black), LiNbO
3/SiO
2 coaxial fibers at 800 °C (blue), and 1100 °C (green) and LiNbO
3 powders (red) are shown in
Figure 2. The intensity of carbonyl vibration bands decreases at 200 °C, while C–H almost disappears. Both phenomena are caused by polymer decomposition at 180 °C. Organic matter is lost completely and characteristic bands of silica appear at 500 °C. Vibration bands of Si–O bonds are present as symmetric (1220 and 800 cm
−1) and asymmetric (1080 cm
−1) stretching, and the scissoring (460 cm
−1) modes [
12]. Two important changes took place at 800 °C, first, chemical stability is reached by the ceramic fibers, represented by the loss of the Si–OH and M–OR bonds.
Figure 3 shows the vibrations corresponding to Nb–O at 900, 700 and 550 cm
−1 at 800 °C. The peaks become defined as the temperature increases. The spectrum of LiNbO
3/SiO
2 coaxial fibers is compared with the crystalline lithium niobate powders.
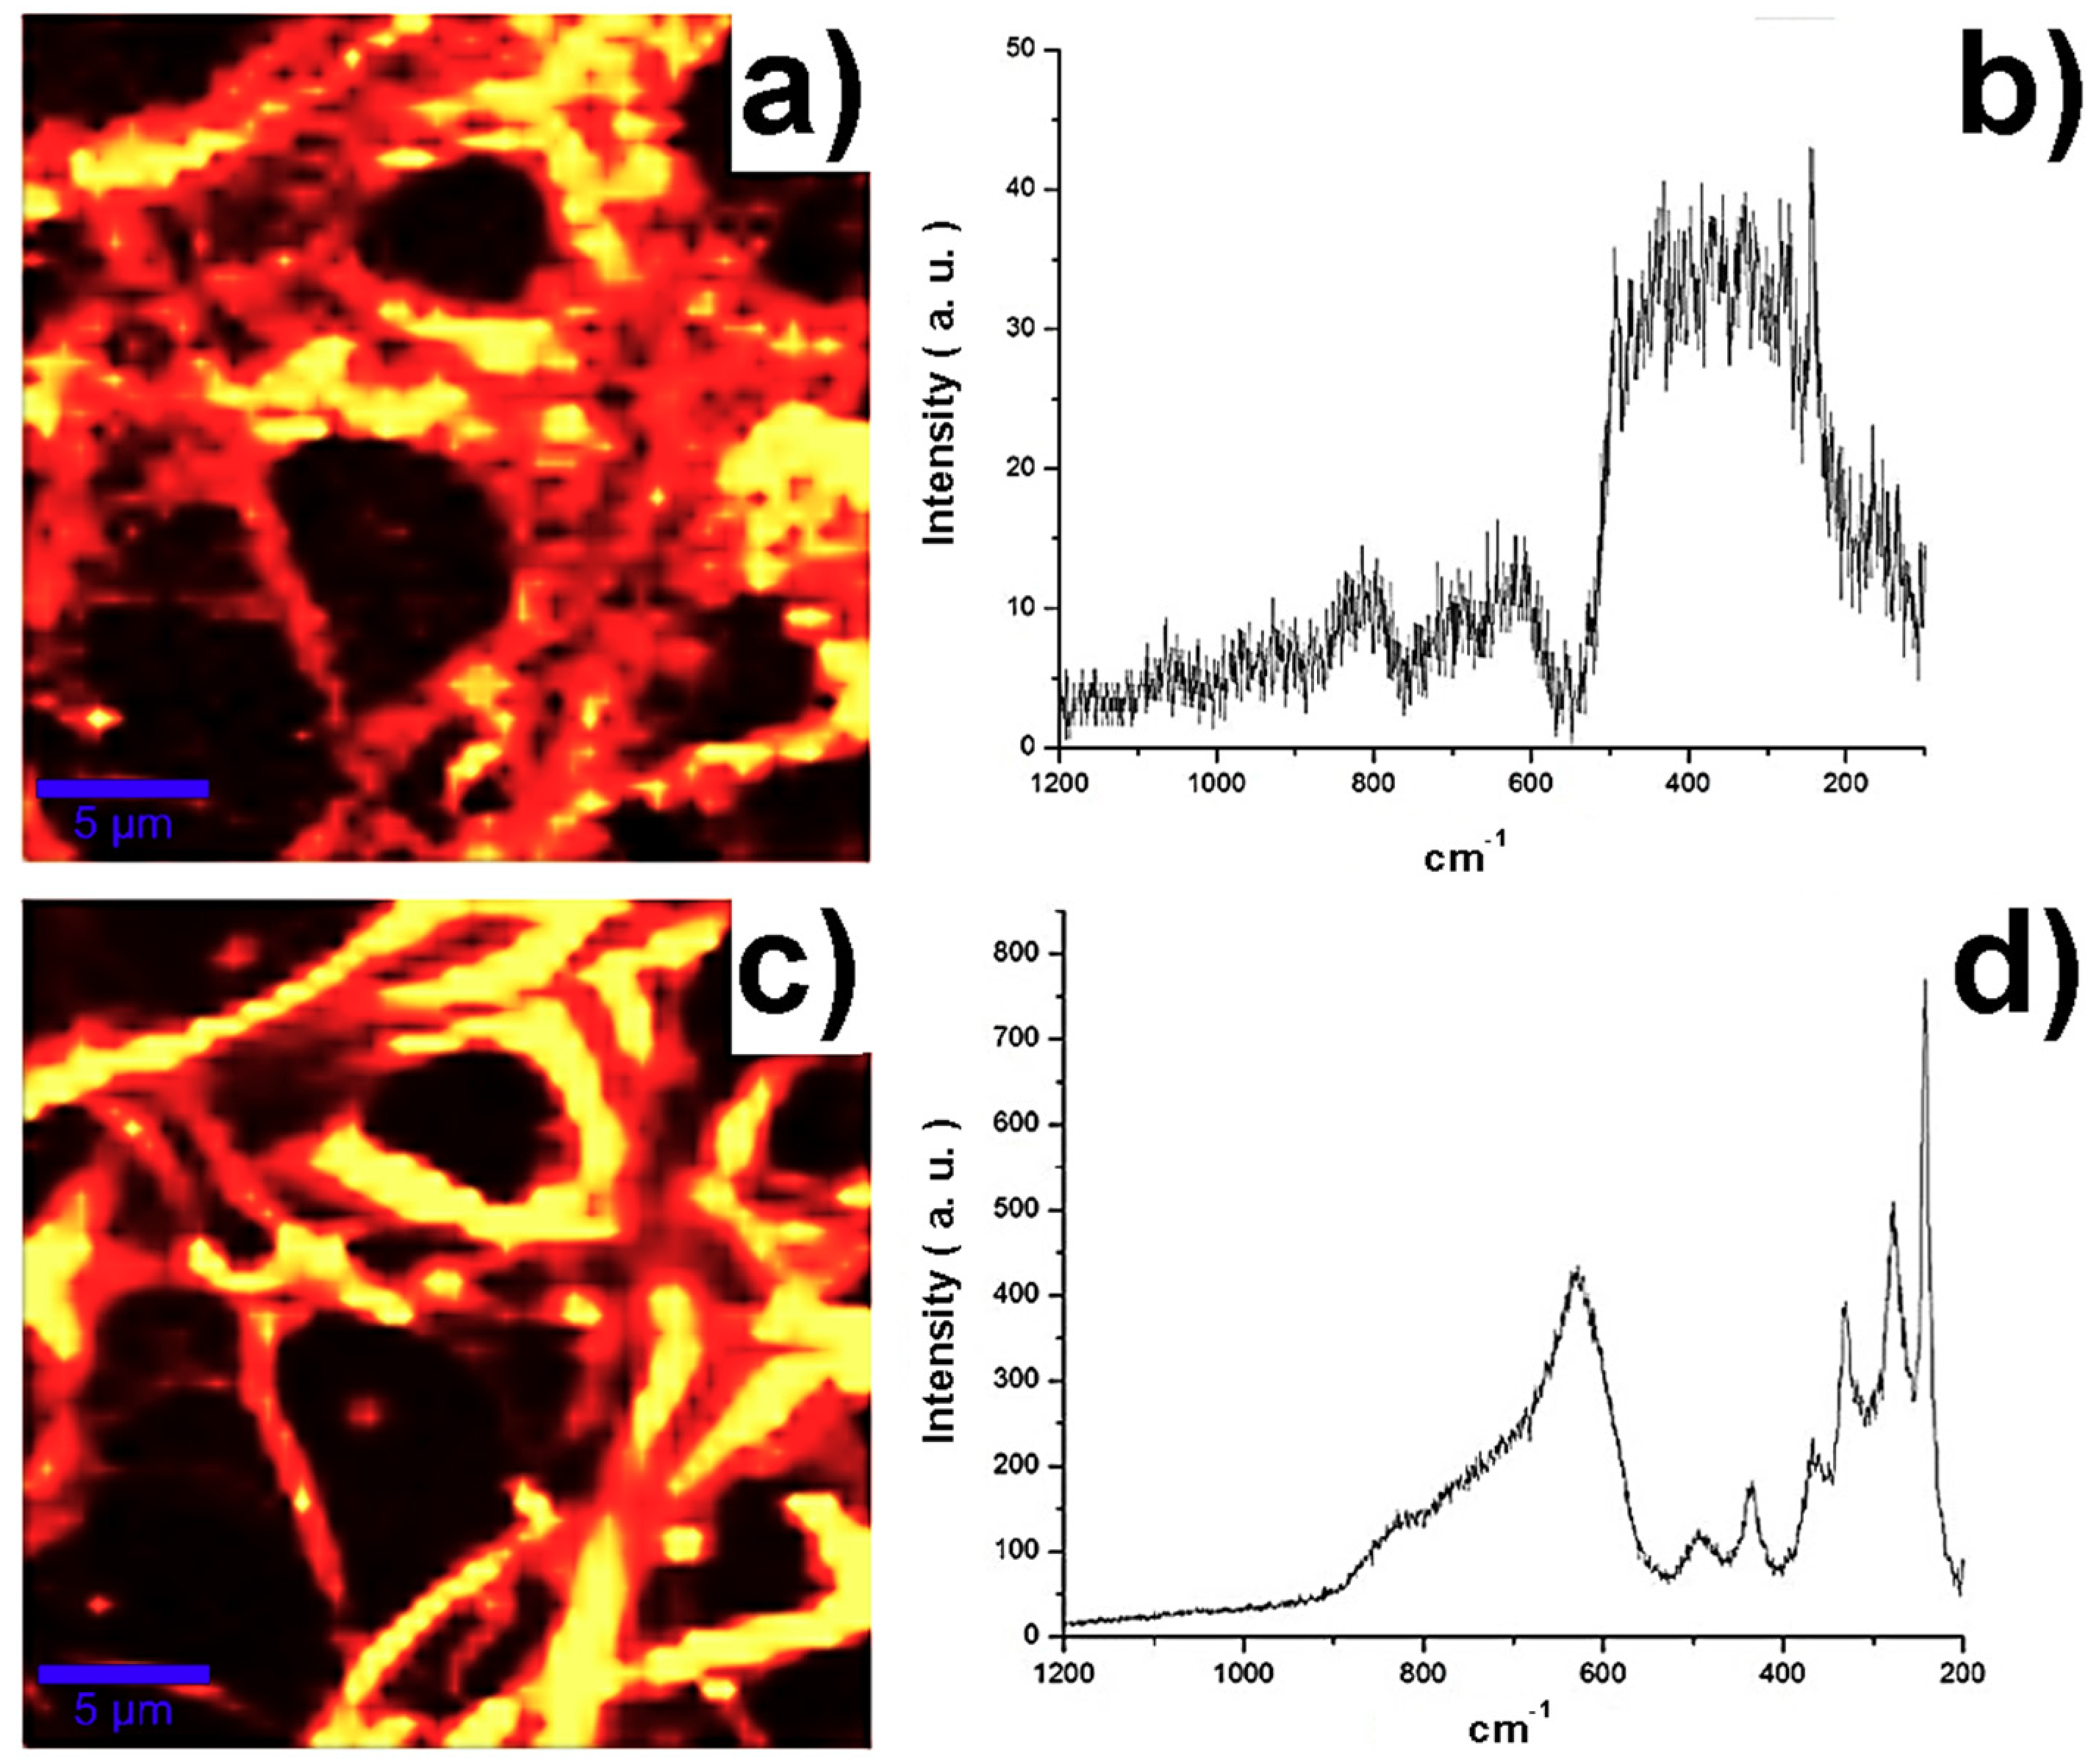
The coaxial fibers samples M03 and M05 at 800 °C were characterized by Raman spectroscopy, the continuous structure of the fibers can be observed in the Raman spectroscopy map in
Figure 4a,c.
Figure 4b,d show the Raman spectrum corresponding to lithium niobate, showing vibrations of the bond Nb–O in the range of 670–550 cm
−1, the bond O–Nb–O at 432 cm
−1 strongly coupled to the Li–O and O–Li–O bonds, while weak signals at 238cm
−1 are assigned to the deformation of Nb–O. Vibrations corresponding to SiO
2 are detected in the outside of the fibers, while vibrations corresponding to LiNbO
3 are detected in the inside of the fibers, according to the coaxial configuration. In addition, vibrations were detected at 800, 619 cm
−1 and from 200 to 559 cm
−1, corresponding to the vibrations of the O–Si–O bonds at 810 cm
−1. It is noticeable that the higher the concentration of lithium niobate, the greater the definition of the silica edges of the fibers.
Figure 5 shows samples after thermal treatment at 800 °C. As observed in the images, the mean diameters and standard deviation decreased considerably. For instance, the diameter in sample M003 (
Figure 5a,b) decreased 47% (diameter 360 ± 120 nm). Likewise, the sample obtained from solution M03 (
Figure 5d,e) decreased 54% to a mean diameter of 280 ± 76 nm. As observed in
Figure 5f,g, a continuous and smooth surface is retained in sample M05, and the diameter decreases 57% to 190 ± 140 nm. As observed in
Figure 5, the fibrous continuous morphology was lost in samples prepared, and lithium niobate particles formed due to grain growth and glass formation. However, the original fiber structure is observed in all areas. It was observed that lithium niobate particles increased with the increment in precursor concentration. At low concentrations, only a few crystals are formed. In comparison, the amount of precursor available in more concentrated solutions caused the higher center orientation of particles. These processes lead to the formation of coaxial-fibers of wider diameters due to the incorporation of silica. Nanometric particles of lithium niobate inside of fibers were obtained from precursor solutions.
Figure 6 shows the SEM micrograph zone obtained from the coaxial fibers M05 at 1000 °C. The fibers were observed with the same morphology of a continuous structure composed of silica with lithium niobate nanoparticles within the fibers. It is noticeable that at a higher temperature the diameter of the fibers increases to 637 ± 127 nm due to the fusion of the formed glass and the coalescence of the fibers. In the zoom of the
Figure 5c to 80,000× lithium niobate particles are clearly seen in white contrast. EDS analysis in
Figure 5c shows that the fibers are composed mainly of O (61.65 wt %), Si (20.36 wt %), C (16.05 wt %), and Nb (1.93 wt %). The resulting concentration is 0.02 moles for LiNbO
3 approximately near to the initial precursor solutions.
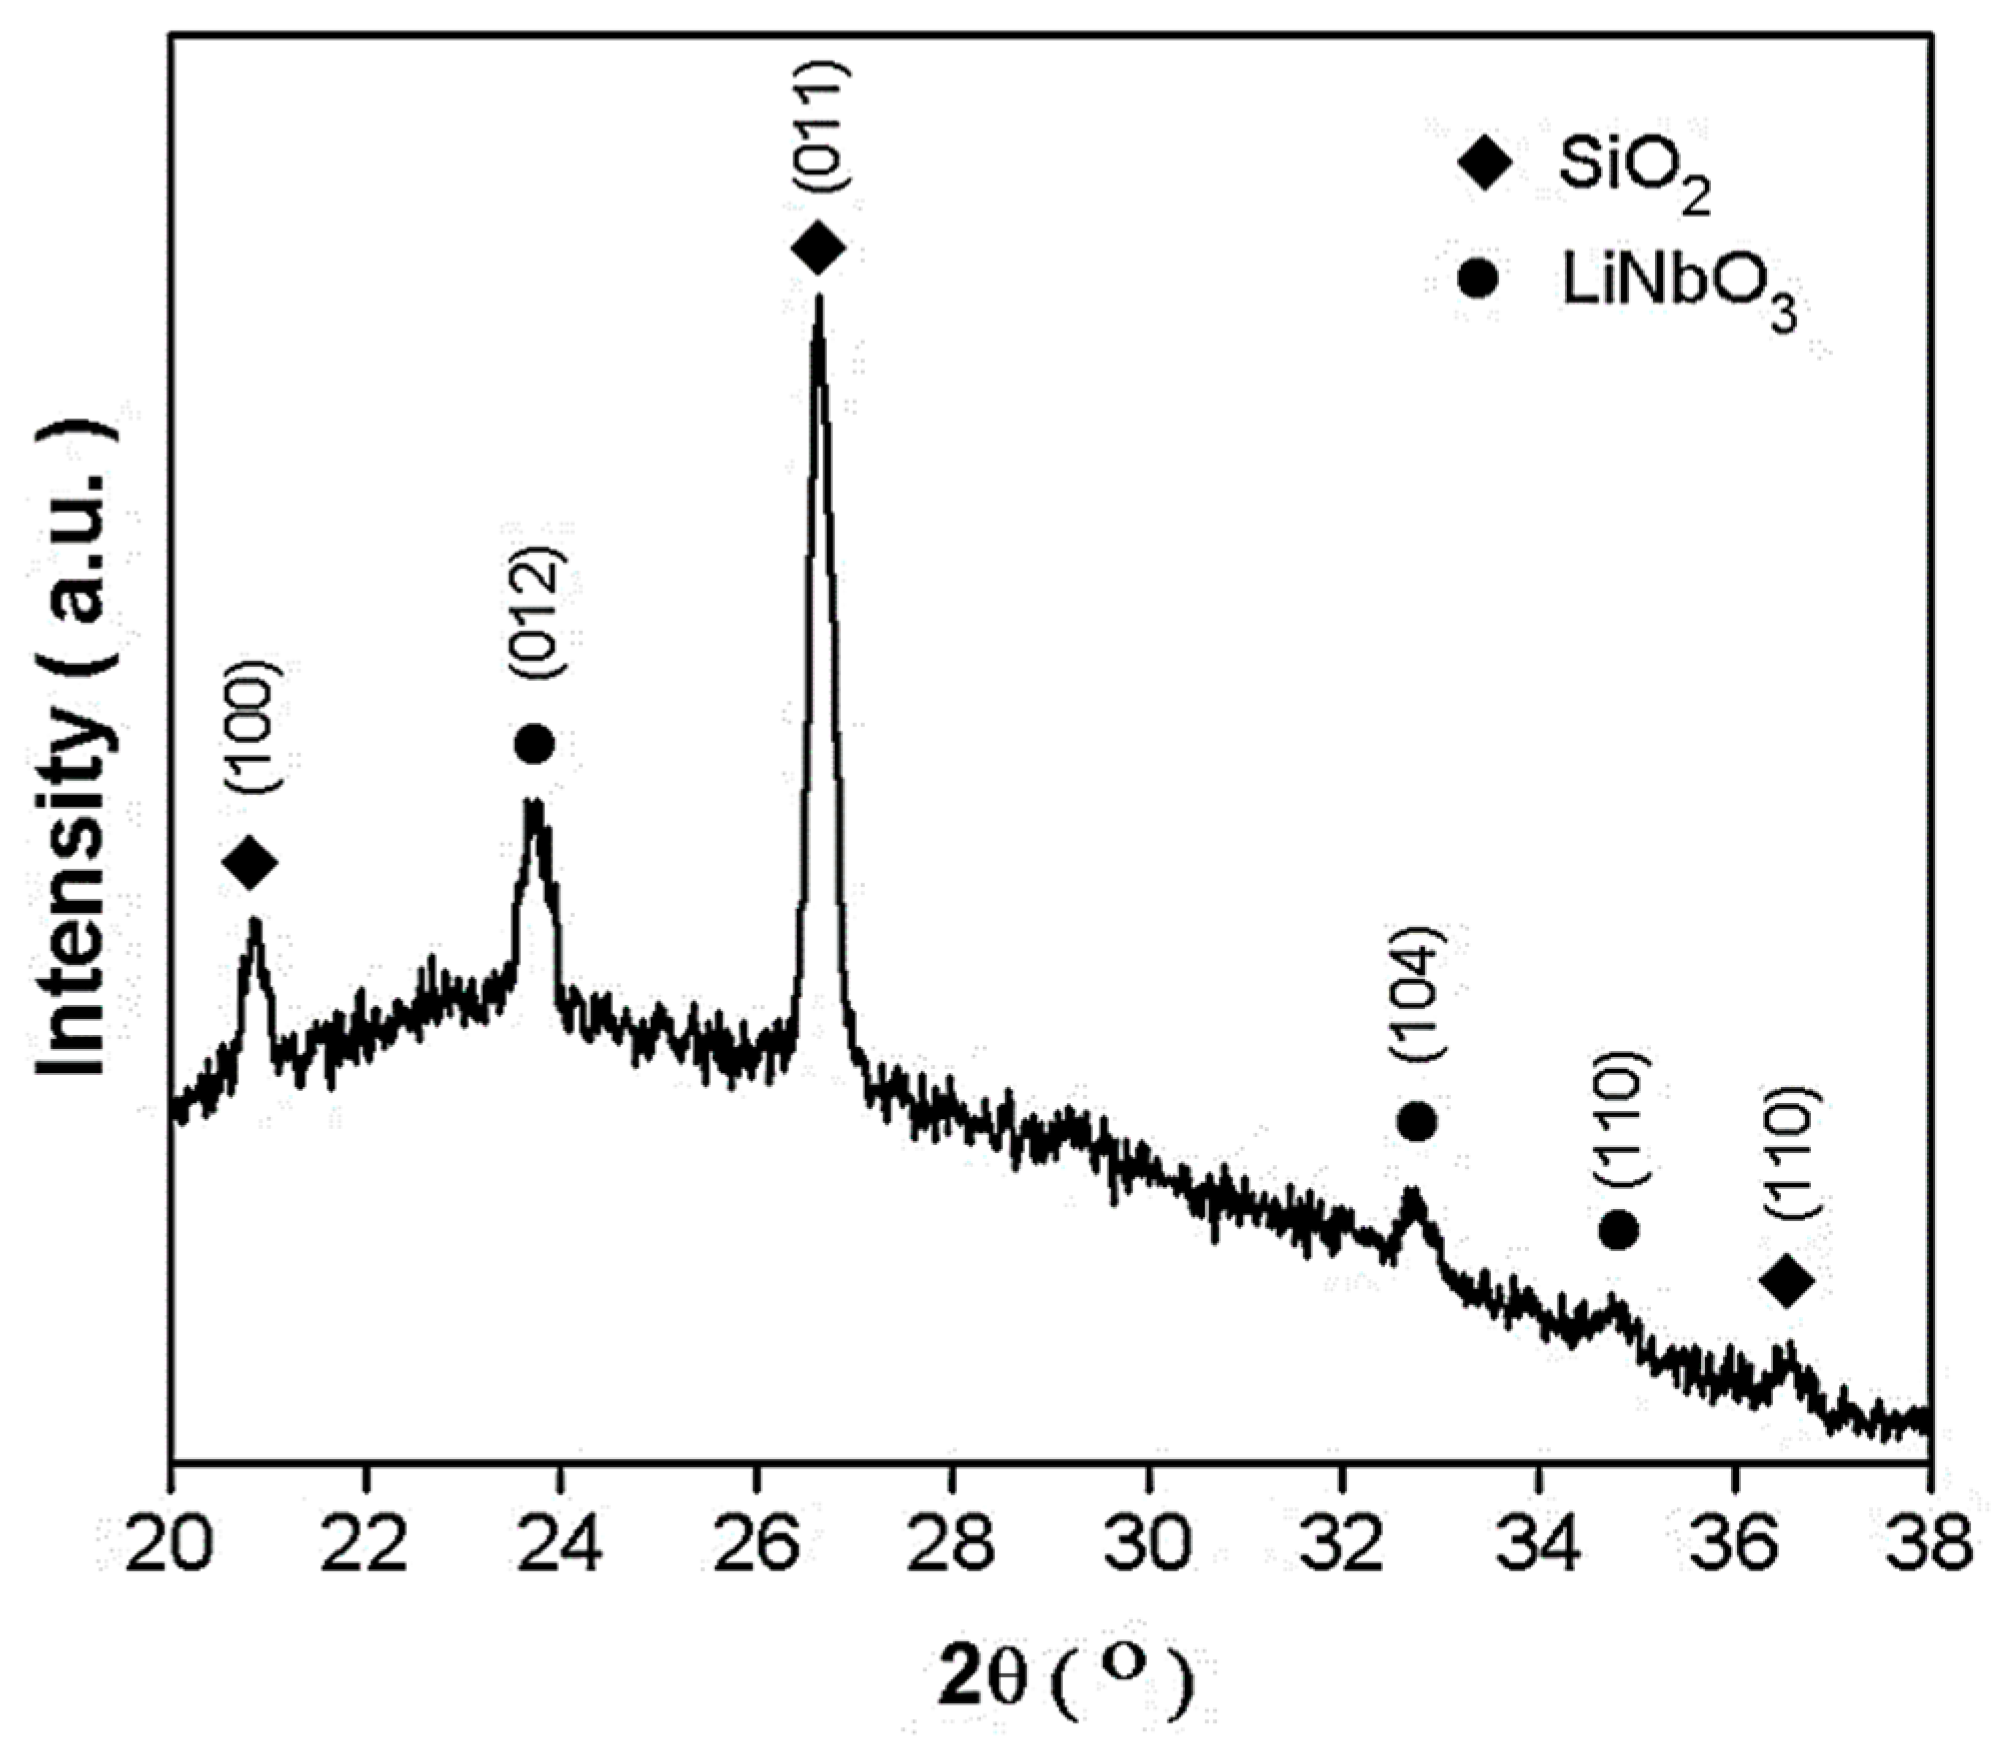
To confirm the existence of the lithium niobate nanoparticles within the fibers, an XRD analysis was performed, showed in
Figure 7. XRD of LiNbO
3 fibers showed the formation of a curve of approximately 20° to 30° belonging to silica and crystalline lithium niobite peaks according to the Raman and IR results. In this diffractogram, the habitual fluorescence background was seen due to the amorphous SiO
2 phase, but also, a Quartz phase was found and characterized by their main diffracted peaks (100), (011) and (110) using JCP: 01-087-2096. The formation of crystalline lithium niobate phase was also confirmed by XRD peaks. Crystallographic indexation was obtained using JCP: 00-074-2238 for trigonal (R3c) indicating (012), (104), and (110) as the principal directions.


