Technical and Economic Criteria to Select Pavement Surfaces of Port Handling Plants


Abstract
:1. Introduction
- Access and internal roads: It consists of roads affected by promiscuous traffic, both light and heavy. As regards the design loads and solutions, it is possible to adopt the types listed in the literature for ordinary roads [9].
- Parking lots for light vehicles: These areas are subjected to road vehicles loads. The solar radiation and frequently long duration of parking could cause permanent deformations on thermosensible pavements.
- Parking lots for heavy vehicles: Heavy vehicles stand in these areas waiting for moving goods or processing administrative practices or resting for a period. The zones are usually loaded for enough time to trigger viscous phenomena and therefore permanent pavement deformations (i.e., rutting).
- Cargo handling: Two vehicle types are of interest for this area: unconstrained guide (e.g., lift trucks, mobile cranes rubber-tired carriers and wheeled tractors) or constrained transport systems (e.g., overhead traveling cranes). Static loads induced during handling storage units are comparable to ones induced by airplanes or heavy road vehicles. Moreover, dynamic actions of these vehicles cannot be overlooked: Appropriate coefficients are usually used to increase the static loads [10];
- Containers storage areas: In order to optimize the available space, often containers are arranged in parallel rows up to three or four superposed planes: The load transmitted to the pavement is up to 1000 kN on a 61 cm-side square surface [11].
- Flexible pavements are generally constituted by four layers arranged in the depth from the surface:
- ○
- Wearing and binder layers composed of asphalt concrete, which are subjected to high shear and flexural stresses which cause rutting and cracking;
- ○
- base course composed of bituminous concrete or bitumen-bound granular if high stresses are expected, otherwise granular mixtures are commonly used;
- ○
- subbase composed of granular course, which is usually only subjected to vertical tensions and it has a function of loads distribution on the subgrade;
- ○
- subgrade, the upper layer of the natural soil which may be the undisturbed local material.
- Semi-rigid pavements are very similar to flexible pavements, but they have a cement-bound base layer. Semi-rigid pavements are used in presence of very heavy traffic (to be considered both as number of repetitions and entity of loads). Both flexible and semi-rigid pavements have a design period 15–20 years long.
- Rigid pavements are composed of a concrete slab laid on one or two subbase layers composed of cement-bound material or granular mix. Concrete slabs often have a square pattern for better load spreading. If any longitudinal or transverse steel reinforcement is present, it controls the widening cracks due to concrete thermal deformations.
- Concrete block pavements are typically composed of pre-formed modular pavers on a bedding layer, a base course, and a subbase layer. Used for the first time in the northern European ports, they are now used all over the world. The experience gained over many years shows that as the side length grows, so too does the stress–strain and more block thickness is required. Both rigid and concrete block pavements have a service life not less than 20–40 years.
2. Materials and Methods
3. Pavement Design
3.1. Flexible Pavement
- 8 cm-thick asphalt concrete wearing course;
- 8 cm-thick asphalt concrete binder course;
- 40 cm-thick asphalt concrete base course.
3.2. Rigid Pavement
- 42 cm-thick concrete slabs;
- 20 cm-thick cement-bound subbase.
- 43 cm-thick concrete slabs;
- 20 cm-thick cement-bound base.
3.3. Block Pavement
- 80 mm-thick concrete pavers with plan dimensions 200 mm × 100 mm;
- 30 mm-thick bedding sand;
- 700 mm-thick lean concrete base with characteristic compressive cube strength equal to 10 MPa;
- 150 mm crushed rock base material with a CBR equal to 80%.
4. Economic Comparison
5. Discussion and Conclusions
Author Contributions
Funding
Conflicts of Interest
References
- Abualtayef, M.; De Heer, R.; Kuroiwa, M.; Matsubara, Y.; Seif, A. Sensitivity analysis of heavy pavement design for a container terminal area, case study: Port of Gaza, Palestine. J. Appl. Sci. 2007, 7, 1241–1248. [Google Scholar] [CrossRef]
- Di Mascio, P.; Loprencipe, G.; Moretti, L. Criteri di scelta delle pavimentazioni portuali. In Proceedings of the 1st Italian Congress Porti&Navigazione: Sostenibilità e Sicurezza nel Trasporto Marittimo, Rome, Italy, 23 May 2012. [Google Scholar]
- Meletiou, M.; Knapton, J. Container terminal pavement management. In UNCTAD Monographs on Port Management; United Nations: New York, NY, USA, 1987; p. 65. [Google Scholar]
- Razdan, A.; Dinesh, S.; Nikhil, M.; Rishil, P. Comparative study of economical analysis of different types of pavement block in pavement construction. Int. J. Sci. Technol. Eng. 2018, 4, 30–31. [Google Scholar]
- Babashamsi, P.; Yusoff, N.I.M.; Ceylan, H.; Nor, N.G.M.; Jenatabadi, H.S. Evaluation of pavement life cycle cost analysis: Review and analysis. Int. J. Pavement Res. Technol. 2016, 9, 241–254. [Google Scholar] [CrossRef]
- Corazza, M.V.; Di Mascio, P.; Moretti, L. Management of sidewalk maintenance to improve walking comfort for senior citizens. In WIT Transactions on the Built Environment; Brebbia, C.A., Ricci, S., Eds.; WIT Press: Southampton, UK, 2017; Volume 176, pp. 195–206. [Google Scholar]
- Corazza, M.V.; Di Mascio, P.; Moretti, L. Managing sidewalk pavement maintenance: A case study to increase pedestrian safety. J. Traffic Transp. Eng. (Engl. Ed.) 2016, 3, 203–214. [Google Scholar] [CrossRef]
- Zoccali, P.; Moretti, L.; Di Mascio, P.; Loprencipe, G.; D’Andrea, A.; Bonin, G.; Teltayev, B.; Caro, S. Analysis of natural stone block pavements in urban shared areas. Case Stud. Constr. Mater. 2018, 8, 498–506. [Google Scholar] [CrossRef]
- Consiglio Nazionale delle Ricerche. Catalogo delle Pavimentazioni Stradali. In Consiglio Nazionale delle Ricerche, Bollettino Ufficiale; Terra, M., Ed.; Consiglio Nazionale delle Ricerche: Rome, Italy, 1995; Volume 178, p. 95. (In Italian) [Google Scholar]
- Knapton, J.; Smith, D.R. The North American port pavement design manual. In Proceedings of the 3rd International Workshop on Concrete Block Paving, Cartagena de Indias, Colombia, 10–13 May 1998. [Google Scholar]
- Bucchi, A. Tipologie delle pavimentazioni interportuali. In Proceedings of the National Congress La Ricerca nel Settore Delle Infrastrutture Interportuali e Aeroportuali, Trieste, Italy, 28–29 June 1995; Izzi, S., Ed.; FrancoAngeli s.r.l.: Milano, Italy, 1996; Volume 1. (In Italian). [Google Scholar]
- Iskakbayev, A.; Teltayev, B.; Oliviero Rossi, C. Steady-state creep of asphalt concrete. Appl. Sci. 2017, 7, 142. [Google Scholar] [CrossRef]
- Loprencipe, G.; Cantisani, G. Evaluation methods for improving surface geometry of concrete floors: A case study. Case Stud. Struct. Eng. 2015, 4, 14–25. [Google Scholar] [CrossRef]
- Praticò, F.; Ammendola, R.; Moro, A. Mitigating the adverse impacts of fuel spillages on airfield pavements by improving HMA chemical resistance. In Proceedings of the 1st International Conference on Transportation Infrastructure (ICTI 2008), Beijing, China, 24–26 April 2008. [Google Scholar]
- Cantisani, G.; D’Andrea, A.; Di Mascio, P.; Loprencipe, G. Reliance of pavement texture characteristics on mix-design and compaction process. In Proceedings of the 8th RILEM International Symposium on Testing and Characterization of Sustainable and Innovative Bituminous Materials, Ancona, Italy, 7–9 October 2015; Springer: Dordrecht, The Netherlands, 2016; pp. 271–281. [Google Scholar] [CrossRef]
- Øverli, J. Experimental and numerical investigation of slabs on ground subjected to concentrated loads. Open Eng. 2014, 4, 210–225. [Google Scholar] [CrossRef]
- Assoporti. Movimenti in principali porti italiani-anno 2015. Available online: http://www.assoporti.it/media/2712/movimenti_portuali_-2015_19mar18.pdf (accessed on 16 February 2019).
- Miccoli, S.; Finucci, F.; Murro, R. Assessing project quality: A multidimensional approach. Adv. Mater. Res. 2014, 1030, 2519–2520. [Google Scholar] [CrossRef]
- Miccoli, S.; Finucci, F.; Murro, R. Criteria and procedures for regional environmental regeneration: A European strategic project. Appl. Mech. Mater. 2014, 675–677, 401–405. [Google Scholar] [CrossRef]
- Knapton, J.; Nixon, N. The Structural Design of Heavy Duty Pavements for Ports and Other Industries, Enlarged ed.; British Port Association: London, UK, 1983. [Google Scholar]
- Knapton, J. The Structural Design of Heavy Duty Pavements for Ports and Other Industries, 4th ed.; Taylor & Francis: Abingdon, UK, 2007. [Google Scholar]
- Asphalt Institute. Thickness Design. Asphalt Pavements for Heavy Wheel Loads, 1st ed.; Asphalt Institute: College Park, MD, USA, 1986. [Google Scholar]
- Asphalt Institute. Asphalt Pavement Thickness Design Software for Highways, Airports, Heavy Wheel Loads and Other Applications; Asphalt Institute: College Park, MD, USA, 2005. [Google Scholar]
- Huang, Y.H. Pavement Analysis and Design, 2nd ed.; Prentice Hall: Upper Saddle River, NJ, USA, 2004. [Google Scholar]
- Ministero de fomiento. Guidelines for Design and Construction of Port Pavement; Ministero de fomiento: Madrid, Spain, 1994.
- ANAS. Elenco Prezzi Nuove Costruzioni e Manutenzione Straordinaria; Ente nazionale per le strade: Rome, Italy, 2018. (In Italian) [Google Scholar]
- Domenichini, L.; Di Mascio, P. Indagine sulle Condizioni Climatiche Italiane ai fini del Dimensionamento delle Sovrastrutture Stradali; DISAT 91/3; Università degli Studi dell’Aquila: L’Aquila, Italy, 1991. (In Italian) [Google Scholar]
- AASHTO. AASHTO Guide for Design of Pavement Structures; American Association of State Highway and Transportation Officials: Washington, DC, USA, 1993. [Google Scholar]
- PCA. Structural Design for Roller-Compacted Concrete for Industrial Pavements; Portland Cement Association: Skokie, IL, USA, 1987. [Google Scholar]
- Westergaard, H.M. Stresses in concrete pavements computed by theoretical analysis. Public Roads 1926, 7, 25–35. [Google Scholar]
- Bradbury, R.D. Reinforced Concrete Pavements; Wire Reinforcement Institute: Washington, DC, USA, 1938. [Google Scholar]
- ANAS. Elenco Prezzi Costi Elementari; Ente nazionale per le strade: Rome, Italy, 2017. (In Italian) [Google Scholar]
- Jung, Y.; Freenman, T.J.; Zollinger, D.G. Guidelines for Routine Maintenance of Concrete Pavement; Federal Highway Administration: Austin, TX, USA, 2008.
- Nebraska Department of Roads. Pavement Maintenance Manual; Nebraska Department of Roads: Lincoln, NE, USA, 2002. [Google Scholar]
- Gedafa, D.S. Performance prediction and maintenance of flexible pavement. In Proceedings of the 2007 Mid-Continent Transportation Research Symposium, Ames, IA, USA, 16–17 August 2007. [Google Scholar]
- ANAS. Elenco Prezzi Manutenzione Ordinaria; Ente nazionale per le strade: Rome, Italy, 2017. (In Italian) [Google Scholar]
- Moretti, L.; Cantisani, G.; Di Mascio, P. Management of road tunnels: Construction, maintenance and lighting costs. Tunn. Undergr. Space Technol. 2016, 51, 84–89. [Google Scholar] [CrossRef]
- ISTAT. Le prospettive per l’economia italiana nel 2015–2017; Istituto Nazionale di Statistica: Rome, Italy, 2018. (In Italian) [Google Scholar]
- International Monetary Fund. World Economic Outlook: Subdued Demand: Symptoms and Remedies; IMF: Washington, DC, USA, 2016. [Google Scholar]
- PricewaterhouseCoopers. The World in 2050. The Long View. How Will the Global Economic Order Change by 2050? PWC: London, UK, 2017. [Google Scholar]
- De Jong, D.L.; Peatz, M.G.F.; Korswagen, A.R. Computer Program BISAR, Layered Systems under Normal and Tangential Surface Loads; Shell Laboratorium Amsterdam: Amsterdam, The Netherlands, 1973. [Google Scholar]
- Miner, M.A. Cumulative damage in fatigue. J. Appl. Mech. 1945, 67, A159–A164. [Google Scholar]
- Ferrari, P.; Giannini, F. Ingegneria Stradale, vol. II Corpo Stradale e Pavimentazioni; ISEDI: Torino, Italy, 2007. (In Italian) [Google Scholar]
- Moretti, L. Technical and economic sustainability of concrete pavements. Mod. Appl. Sci. 2014, 8, 1–9. [Google Scholar] [CrossRef]


| Type of Area | Type of Pavement | ||
|---|---|---|---|
| Semi-Rigid and Flexible | Concrete | Modular Pavers | |
| Access and internal roads |  Suitable for light vehicles | LCCA needs | LCCA needs |
| Parking lots for heavy vehicles |  Avoid in presence of long period parking and oil spill |  Recommended solution | Reasonable solution |
| Cargo handling | suitable only for guided public transport | reasonable solution | suitable only for low-tangential stresses |
| Containers storage areas | avoid if possible | good solution | recommended solution |
| Light vehicle parking | reasonable solution | suggested permeable concrete | suggested vegetative and permeable blocks |
| Pedestrian | even dirt road with anti-dusting bituminous layer | LCCA needs | reasonable solution |
| Characteristic | Symbol | Value | Units |
|---|---|---|---|
| Unladen weight | UW | 65 | Mg |
| Lifting capacity | LC | 45 | Mg |
| Service weight | SW | 110 | Mg |
| Number of wheels, front/rear | NW,f/r | 4/2 | – |
| Wheelbase | Wb | 5750 | mm |
| Track width | TW | 3000 | mm |
| Center-to-center spacing between dual tires | SDT | 800 | mm |
| Distance between the two inner front axle wheel centers | DWC | 2400 | mm |
| Distance of load center from front axle | DLC | 2700 | mm |
| Tire pressure, front/rear | p | 1 | MPa |
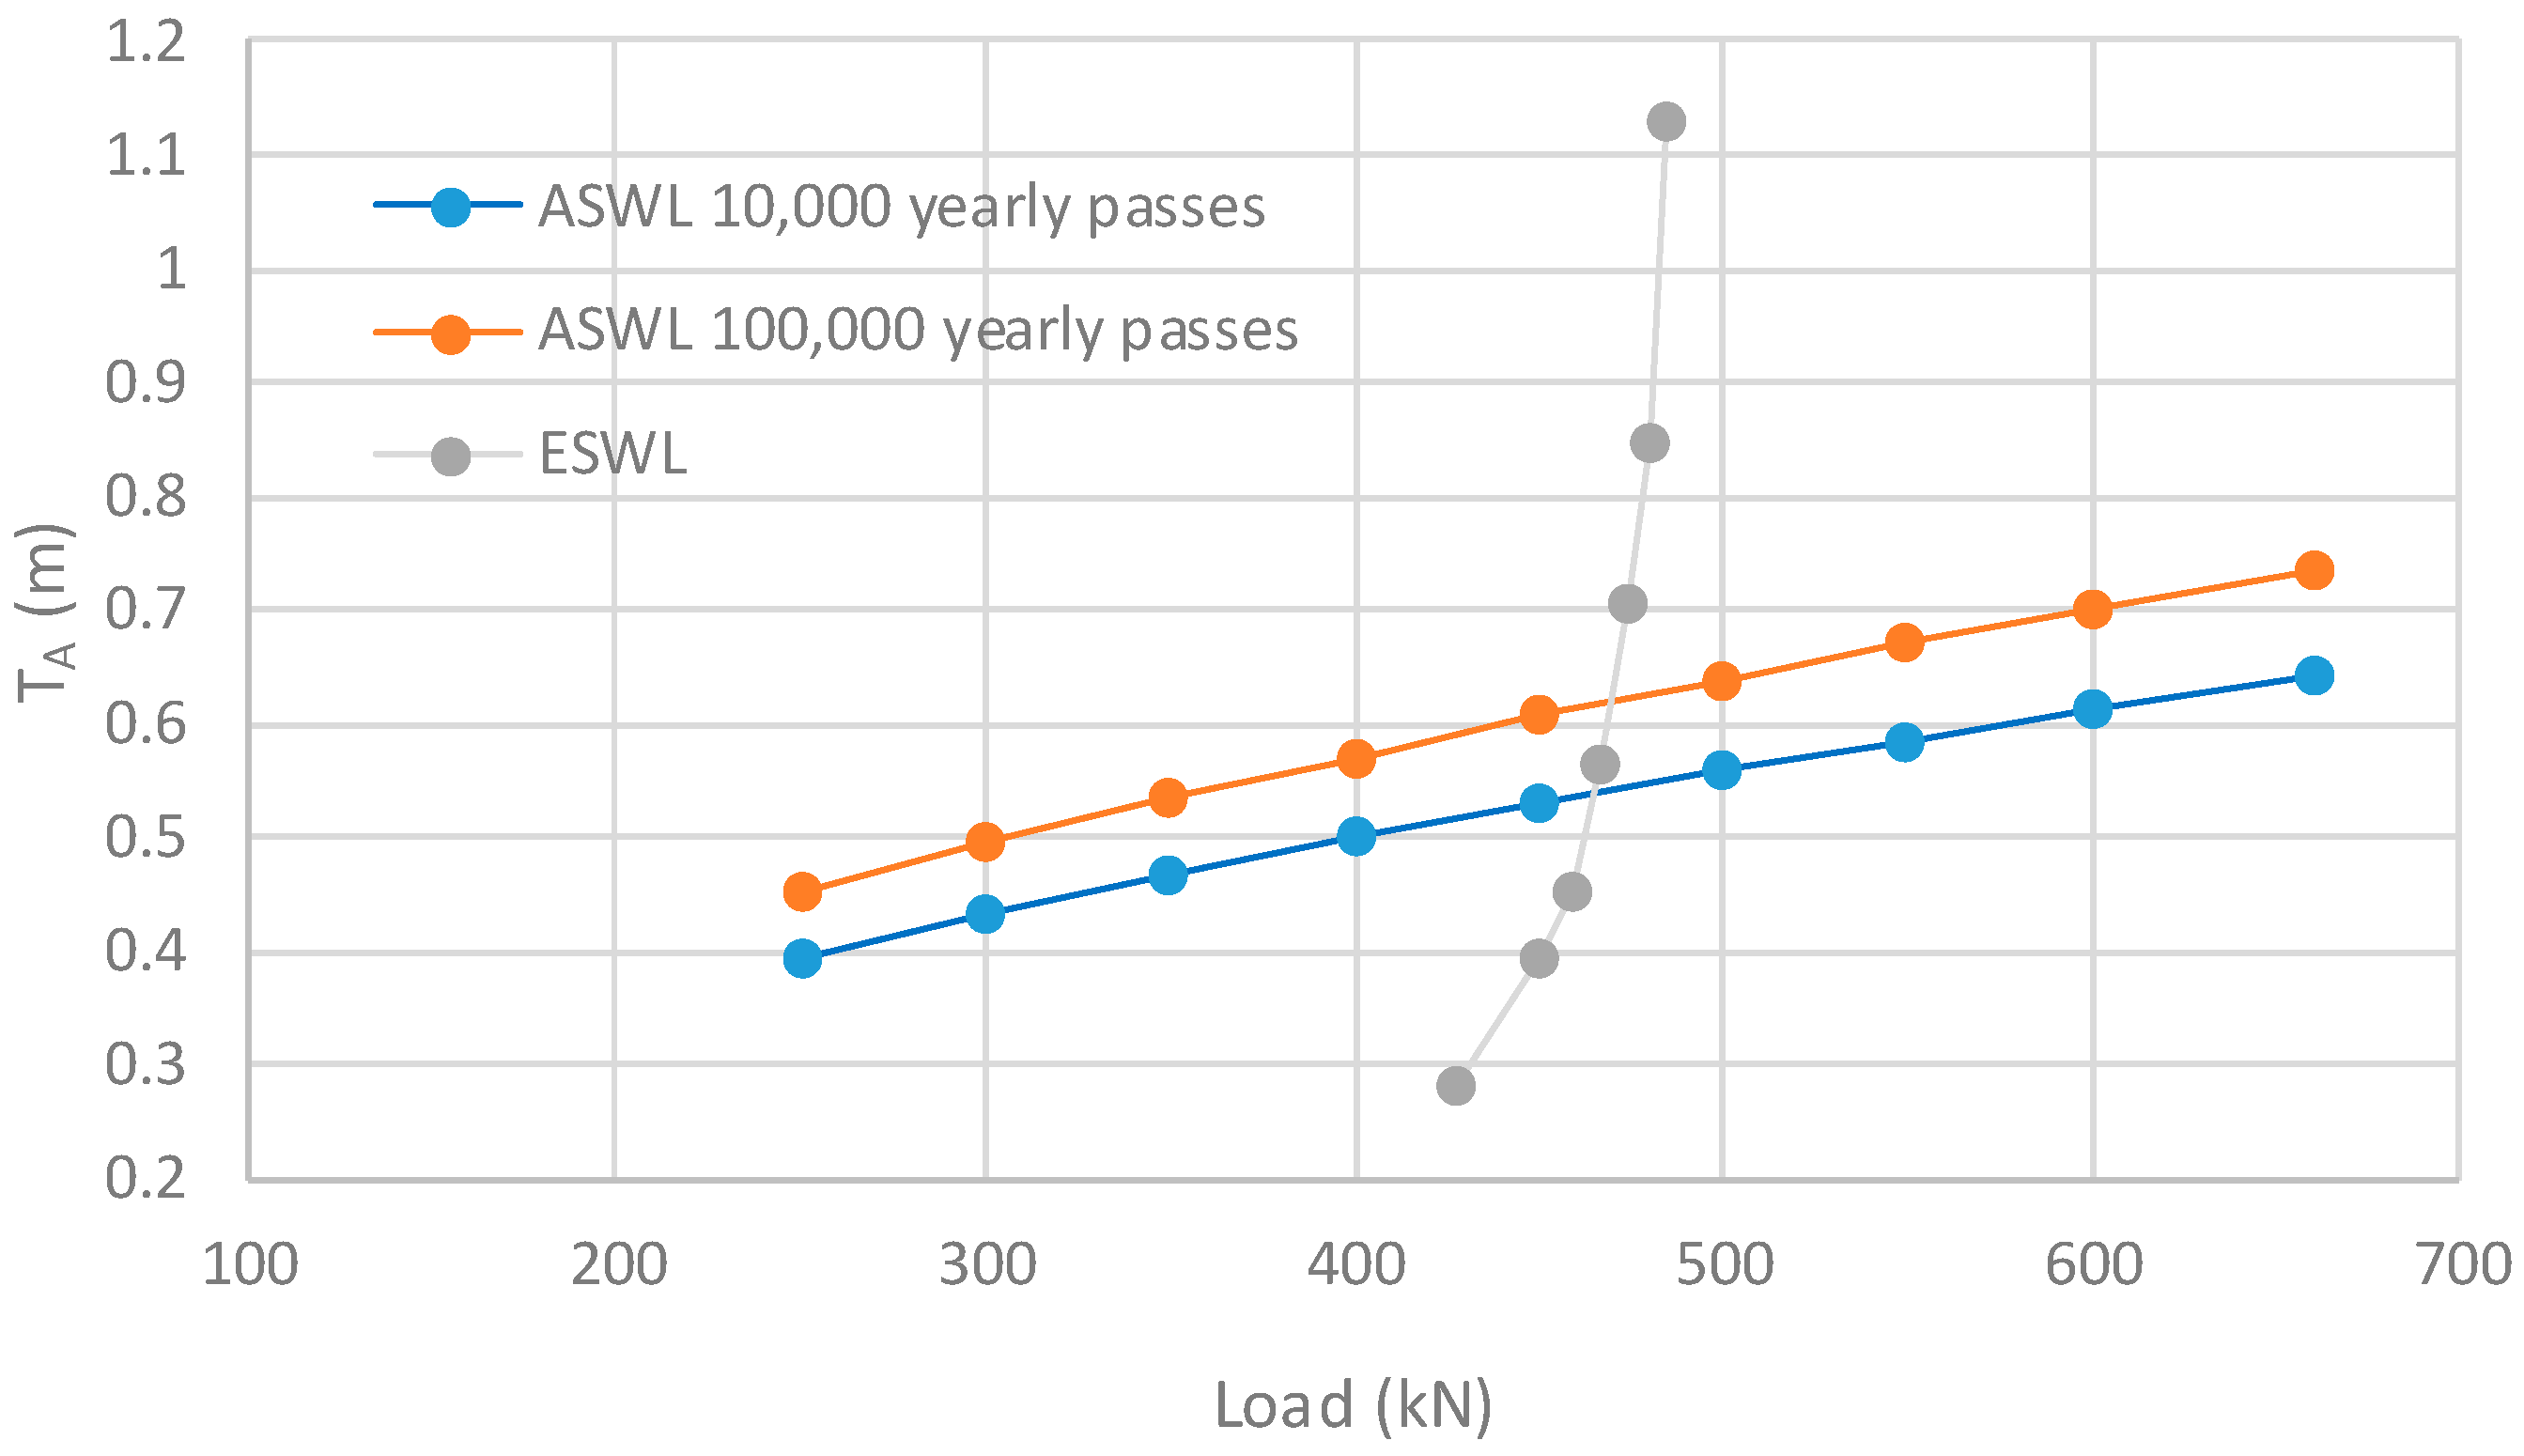
| ASWL (kN) | a (m) | N = 10,000 | N = 100,000 | ||
|---|---|---|---|---|---|
| TA/a | TA (m) | TA/a | TA (m) | ||
| 250 | 0.282 | 1.4 | 0.395 | 1.6 | 0.451 |
| 300 | 0.309 | 0.433 | 0.494 | ||
| 350 | 0.334 | 0.467 | 0.534 | ||
| 400 | 0.357 | 0.500 | 0.571 | ||
| 450 | 0.378 | 0.530 | 0.606 | ||
| 500 | 0.399 | 0.559 | 0.638 | ||
| 550 | 0.418 | 0.586 | 0.669 | ||
| 600 | 0.437 | 0.612 | 0.699 | ||
| 660 | 0.458 | 0.642 | 0.733 | ||
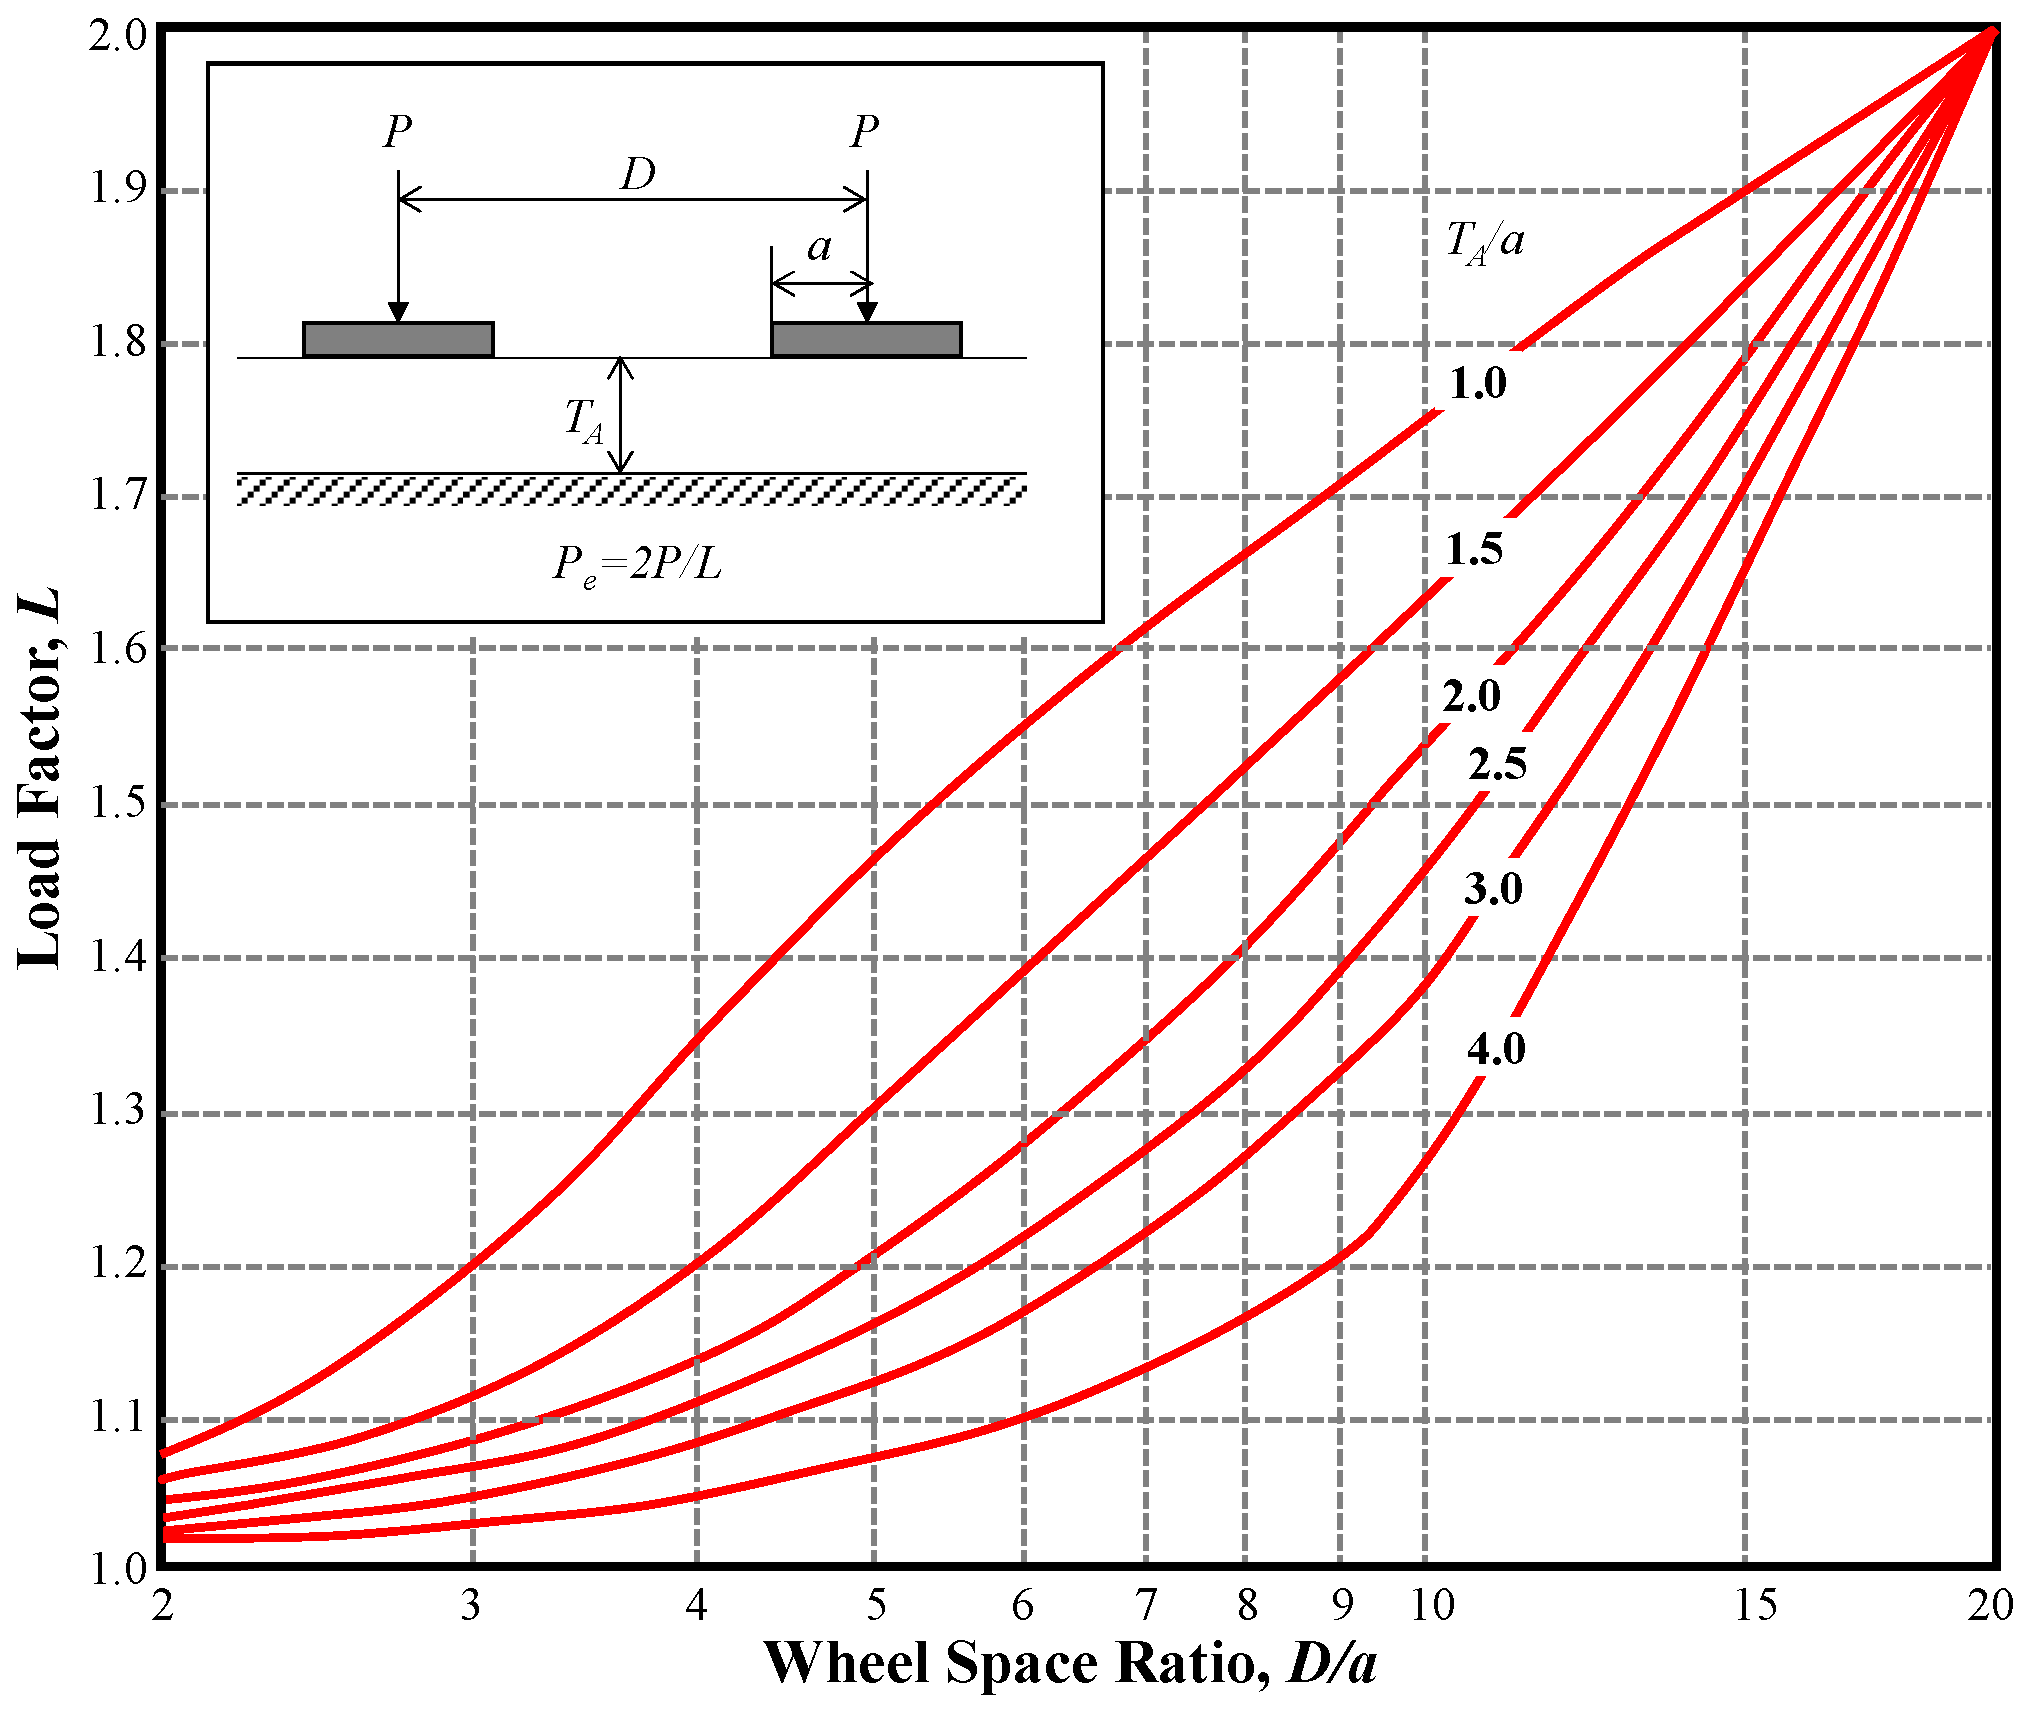
| TA/a | L | DWL (kN) | EWSL (kN) | TA (m) |
|---|---|---|---|---|
| 1.0 | 1.17 | 250 | 427.35 | 0.282 |
| 1.4 | 1.11 | 300 | 450.45 | 0.395 |
| 1.6 | 1.09 | 350 | 458.72 | 0.451 |
| 2.0 | 1.07 | 400 | 467.29 | 0.564 |
| 2.5 | 1.055 | 450 | 473.93 | 0.705 |
| 3.0 | 1.04 | 500 | 480.77 | 0.846 |
| 4.0 | 1.03 | 550 | 485.44 | 1.128 |
| Season | E (MPa) | εz (–) | N | n | n/N |
|---|---|---|---|---|---|
| Winter | 10,000 | 7.08 × 10⁻⁵ | 7.22 × 10⁹ | 150,000 | 2.08 × 10⁻⁵ |
| Spring/Autumn | 7000 | 9.41 × 10⁻⁵ | 3.84 × 10⁹ | 300,000 | 7.81 × 10⁻⁵ |
| Summer | 3000 | 1.46 × 10⁻⁴ | 1.87 × 10⁹ | 150,000 | 8.04 × 10⁻⁵ |
| ∑n/N | – | – | – | – | 1.79 × 10⁻⁴ |
| εc (–) | N | n | n/N |
|---|---|---|---|
| 1.46 × 10⁻⁴ | 2.56 × 10⁸ | 600,000 | 2.34 × 10⁻² |
| Characteristic | Value | Units |
|---|---|---|
| Concrete flexural tensile strength at 90 days | 6 | MPa |
| Young’s modulus of concrete | 45,000 | MPa |
| Poisson ratio | 0.15 | – |
| Allowable maximum tensile stress | 2.4 | MPa |
| Modulus of subgrade (or subbase) reaction | 0.21 | MPa/mm |
| σ (MPa) | N | n | n/N |
|---|---|---|---|
| 0.59 | 6.41 × 10⁸ | 600,000 | 9.37 × 10⁻⁴ |
| Load | Wheel Spacing (mm) | pf |
|---|---|---|
| SDT | 800 | 0.80 |
| DWC | 2400 | 0.19 |
| DWC + SDT | 3200 | 0.07 |
| Condition | df,i |
|---|---|
| Braking | 30% |
| Cornering | 40% |
| Accelerating | 10% |
| Surface unevenness | 20% |
| Total | 100% |
| Layer | εC (–) | n | n/N |
|---|---|---|---|
| granular base | 0.215 × 10⁻⁴ | 600,000 | 5.57 × 10⁻⁷ |
| subgrade | 0.215 × 10⁻⁵ | 600,000 | 9.30 × 10⁻¹² |
| σR (MPa) | σN (MPa) | n | n/N |
|---|---|---|---|
| 0.27 | 0.20 | 600,000 | 0.16 |
| Material or Work | Cost | Units |
|---|---|---|
| Bituminous asphalt wearing course | 184.65 | €/m3 |
| Bituminous asphalt binder course | 157.51 | €/m3 |
| Bituminous asphalt base course | 140.25 | €/m3 |
| Tack-coat | 1.11 | €/m2 |
| Concrete for slabs | 132.12 | €/m3 |
| Slabs placing and finishing | 11.00 | €/m2 |
| Cement-bound base course | 40.32 | €/m3 |
| Concrete blocks and bedding sand | 26.55 | €/m3 |
| Lean concrete base | 40.32 | €/m3 |
| Crushed rock base material | 24.99 | €/m3 |
| 8-cm depth milling of bituminous pavement | 42.00 | €/m3 |
| Joint sealing | 11.10 | €/m |
| Grinding of concrete pavement | 3.86 | €/m2 |
| Taking apart and relaying of concrete blocks | 15.00 | €/m2 |
| Type of Pavement | Construction Cost (€/m2) |
|---|---|
| Asphalt pavement | 86.80 |
| Concrete pavement | 74.55 |
| Concrete block pavement | 58.52 |
| Type of Pavement | PV (€/m2) |
|---|---|
| Asphalt pavement | 106.41 |
| Concrete pavement | 79.33 |
| Block pavement | 80.39 |
© 2019 by the authors. Licensee MDPI, Basel, Switzerland. This article is an open access article distributed under the terms and conditions of the Creative Commons Attribution (CC BY) license (http://creativecommons.org/licenses/by/4.0/).
Share and Cite
Di Mascio, P.; Loprencipe, G.; Moretti, L. Technical and Economic Criteria to Select Pavement Surfaces of Port Handling Plants. Coatings 2019, 9, 126. https://doi.org/10.3390/coatings9020126
Di Mascio P, Loprencipe G, Moretti L. Technical and Economic Criteria to Select Pavement Surfaces of Port Handling Plants. Coatings. 2019; 9(2):126. https://doi.org/10.3390/coatings9020126
Chicago/Turabian StyleDi Mascio, Paola, Giuseppe Loprencipe, and Laura Moretti. 2019. "Technical and Economic Criteria to Select Pavement Surfaces of Port Handling Plants" Coatings 9, no. 2: 126. https://doi.org/10.3390/coatings9020126