Preparation and Performance Optimization of Original Aluminum Ash Coating Based on Plasma Spraying


1
College of Mechanical Engineering, Nantong University, Nantong 226019, China
2
Graduate School of Advanced Technology and Science, University of Tokushima, Tokushima 770-8506, Japan
*
Author to whom correspondence should be addressed.
Coatings 2019, 9(11), 770; https://doi.org/10.3390/coatings9110770
Submission received: 23 October 2019
/
Revised: 13 November 2019
/
Accepted: 14 November 2019
/
Published: 19 November 2019
(This article belongs to the Section Surface Characterization, Deposition and Modification)
Abstract
:As an industrial solid waste, the original aluminum ash (OAA) will cause serious pollution to the air and soil. How to reuse the OAA has been a research difficulty. Thus, a method of preparing a plasma spray powder using OAA is proposed. The OAA was hydrolyzed and ball milled, and the flowability of original aluminum ash spray powder (OAASP) was evaluated by the angle of repose. The coating properties were determined via analyzing the microstructure and the phase of the coating, and the effects of plasma spray parameters on the coating properties were investigated by the orthogonal experiment to optimize spray parameters. The results show that the angle of repose of OAASP after granulation was less than 40°, which met the requirements of plasma spraying. When the spraying current was 600 A, the spraying voltage was 60 V, the main gas flow was 33 slpm, and the powder flow rate was 22 g/min, and the prepared original aluminum ash coating (OAAC) had excellent comprehensive performance. After the spraying process parameters were optimized, the microhardness of the coating was 606.54 HV, which is about twice the hardness of the substrate; the abrasion rate was 12.86 × 10⁻³ g/min; the porosity was 0.16%; and the adhesive strength was 16 MPa. When the amount of Al2O3 added was 50%, the hardness of the coating was increased by 17.61%.
1. Introduction
Aluminum ash, also known as aluminum slag, is a by-product of aluminum electrolysis and aluminum smelting. According to statistics, 1 ton of aluminum will produce 180–290 kg of aluminum ash during the entire technological process [1,2,3,4]. In line with the different components, the aluminum ash can be split into primary and secondary aluminum ash. The primary aluminum ash color is grayish white, which is produced in the primary aluminum electrolysis and casting process without adding salt flux [5]. It is a mixture of aluminum and aluminum oxides with an aluminum content of 30%–70%. The primary material used in this study, the original aluminum ash (OAA), can be acquired by ball milling and screening of the primary aluminum ash [6,7]. Furthermore, the ultimate aluminum ash (UAA) can be obtained after OAA is processed with the hot aluminum ash separator, but the OAA and UAA differ greatly in performance.
Due to technical limitations, there is currently no efficacious way to recycle large quantities of aluminum ash. The treatment of aluminum ash is still dominated by accumulation and landfill in most enterprises, which will generate environmental pollution. Aluminum nitride (AlN) in aluminum ash reacts with water vapor or rain in the air at a certain temperature to form NH3 with a strong pungent odor [8,9]. Excessive inhalation can damage the respiratory health of the human body. Second, many heavy metals in bauxite, such as Hg, Cd, and Pb can bring about heavy metal pollution, if buried in soil and groundwater systems [10]. Other scholars have also made certain achievements in the comprehensive utilization of aluminum ash. For example, the aluminum ash is used to prepare refractory materials [11,12], steelmaking deoxidizer [13,14], inorganic flocculants [15,16,17], chemical raw materials [18,19,20], and building materials [21,22]. Nevertheless, most of the above applications are in the theoretical and laboratory stages, which have a high production cost, and may cause secondary pollution. While it cannot be promoted on a large scale, the accumulation of aluminum ash is still increasing year by year.
Plasma spraying is a method of heating a powdered material such as ceramics, alloys, and metals into a molten or semi-molten state, and spraying it at a high speed on the surface of the pretreated workpiece to form a firm surface layer [23,24,25,26]. Commonly used spray powders range in price from a few, to a few hundred dollars per kilogram. Among them, high-purity alumina powder is one of the commonly used spray powders, the main component of aluminum ash is alumina, and the price is low [27,28,29,30,31]. If we can replace the high-purity alumina coating with aluminum ash coating, this will not only reduce production costs, turning waste into treasure, but also protect the ecological environment.
In this study, a method for the utilization of waste aluminum ash was proposed. The OAA was turned into an original aluminum ash spray powder (OAASP) by hydrolysis and ball milling, and the original aluminum ash coating (OAAC) was prepared by atmospheric plasma spraying technology. In this experiment, the OAAC was plasma sprayed on the surface of 45-steel, and the microstructure observation and performance test of the coating were carried out to verify the feasibility of the process. Moreover, the effects of spray process parameters and the alumina content on the properties of the coating were investigated, and the parameters were optimized to obtain the best coating performance.
2. Experiments
2.1. Raw Materials
The main experimental raw material was OAA, bought from China Jiangsu Haiguang Metal Co., Ltd. (Suqian, China), which collected aluminum ash used in the experiment from multiple aluminum processing factories. Therefore, the source of aluminum ash is complicated. The chemical composition of OAA is shown in Table 1. According to X-ray fluorescence (XRF, MiniPal4, PANalytical Company, Almelo, The Netherlands) analysis, the key elements in OAA are Al, Fe, and Si, among which Al has the most content of 61.802%. Due to the fact that the OAA was not merely intricate in source, but also prone to introduce new impurities during production and transportation, the OAA contained various trace elements such as Zn, Mn, and Ti. The 45-steel without any heat treatment was employed as the substrate, which was sandblasted using Al2O3 before spraying.
The OAA was subjected to X-ray diffraction (XRD, D/Max 2500PC Rigaku, Japan Science and Technology Co., Ltd., Tokyo, Japan) semi-quantitative analysis. The phase composition was as shown in Table 2, and the XRD pattern is shown in Figure 1. The main phase of OAA was 21 wt.% ± 3 wt.% Al and 44 wt.% ± 3 wt.% AlN. In addition, OAA also comprised some fluoride salts and chloride salts, which were not detected by XRD because their content was generally less than 5%. A mass of AlN was contained in the OAA because N2 was introduced during the refining of the aluminum alloy. Due to the presence of AlN, the aluminum ash was prone to hydrolysis at temperatures above 30 °C, resulting in the production of pungent ammonia gas, so that the aluminum ash could not be stored for a long time, and the OAA needed to be denitrified.
2.2. Preparation of Original Aluminum Ash Spray Powder
Since aluminum ash comes from disparate factories and is apt to introduce impurities during transportation, OAA contained many large-particle impurities, such as broken glass, stone and plastic, and so a 50-mesh standard sieve was utilized for impurity removal. The hydrolysis experiment was conducted at room temperature; the screened OAA was placed in a beaker, ultrapure water was added at a solid:liquid ratio of 1:10. Then the beaker was placed in a constant-temperature water bath with a temperature of 90–100 °C, and a stirring device was applied to carry out hydrolysis treatment to remove salt and nitrogen in the aluminum ash.
The nitrogen removal process lasted for 3–6 h, and phenolphthalein test paper was placed in the beaker mouth. If the test paper did not change color, it indicated that the nitrogen removal was over. Then we stopped heating and let the beaker stand for 1–2 h. The aluminum ash liquid in the beaker stratified, as shown in Figure 2. The upper layer was scum which was hardly soluble in water; the middle layer was turbid liquid; the lower layer was a precipitate which was also hardly soluble in water; the middle layer gradually became transparent as the standing time extended.
The turbid liquid of the middle layer and the sediment of the lower layer were placed in an oven at 120 °C respectively, and dried for 6–12 h. The dried aluminum ash was taken out from the beaker and subjected to a ball milling treatment. The instrument used was a laboratory horizontal planetary ball mill, the DECO-PBM-H-0.4L type, produced by Deco Instruments (Changsha, China). The grinding ball was made of stainless steel and the radius of the ball was 5 mm. The grinding method was vacuum grinding, and the rotation speed of the ball grinding tank was 1100 rpm. After being ground for 5–10 min, the aluminum ash was taken out and sieved with a 100-mesh sample sieve to obtain the OAASP. Figure 3 is a particle size distribution diagram of OAASP, and the primary particle size distribution range is 120–150 mesh.
2.3. Preparation of Original Aluminum Ash Coating
The Al–Ni powder was chosen to prepare the bonding layer for its wide application and low prices. The Al–Ni alloy bonding layer was prepared on the surface of 45-steel substrates by plasma spraying equipment (FH-80, Fahan Spraying Machinery Co., Ltd., Shanghai, China), and its thickness was 0.08–0.18 μm. The material was Al–Ni powder commonly used for the alumina ceramic coating. Through the preparation of the Al–Ni bonding layer, it assisted in improving the bonding strength of the coating [32]. Table 3 is the bonding layer process parameters.
The process parameters of the plasma spraying equipment were adjusted, and OAASP was sprayed on the surface of the bonding layer. An orthogonal experiment with four factors and three levels was used in the spraying experiment, and there were nine groups of L9 (34) (O1–O9). In addition, the spray current, spray voltage, the powder flow rate, and the main gas flow were selected as the principal factors of the spraying process, and the gas used was argon. The designed orthogonal test table is shown in Table 4.
2.4. Experiment Equipment and Testing Methods
The coating was prepared by the plasma spraying complete set of equipment, namely the FH-80 type, produced by Fahan Spraying Machinery Co., Ltd. (Shanghai, China). The composition analysis was performed by X-ray fluorescence, which was the MiniPal4 type produced by PANalytical Company (Almelo, The Netherlands). Phase analysis was performed by X-ray diffraction analysis, the D/Max 2500PC Rigaku type, which was produced by Japan Science and Technology Co., Ltd. (Tokyo, Japan).
The microstructure of the coating was observed by scanning electron microscope (SEM), the S-3400 type, produced by Hitachi, Ltd. (Tokyo, Japan) The type and the content of elements in the coating micro-area were analyzed by energy-dispersive X-ray spectroscopy (EDS), the Quantax75 type, produced by Japan Hitachi, Ltd. The main parameters used to evaluate the performance of OAAC were porosity [33], adhesive strength, microhardness, and abrasion rate.
The porosity was measured by the simplified Archimedes drainage method and laboratory-made platform. The test piece of coating was dried and weighed to obtain a mass m0, then put in distilled water to get the mass of the discharged water m1. The test piece was removed from the water and weighed to obtain the mass m2. Finally, the porosity of the OAAC could be obtained according to the formula (m2 – m0)/m1. The smaller the porosity, the denser the coating.
The abrasion rate was measured by a ring three-body wear tester, MMH-5 type, produced by Hansen Precision Instrument Co., Ltd. (Jinan, China). According to the international standard ISO7784.2-97 [34], the weight loss method was adopted in the experiment. The sample after abrasion was ultrasonically cleaned, dried and weighed, and the abrasion rate was calculated according to the formula (m1 – m2)/t, where, m1 is the mass before grinding, m2 is the mass after grinding, and t is the grinding time. The type of the electronic balance for weighing was FA-2004N, produced by Grand Instrument and Equipment Co., Ltd. (Shanghai, China), and its accuracy was 0.1 mg.
According to the Chinese national standard GB/T 8642-2002 [35], the adhesive strength was measured by the stretching method. The used equipment was a universal mechanical testing machine, CMT5105 type, produced by MTS Industrial Systems Co., Ltd. (Shenzhen, China). The adhesive strength was used to characterize the mechanical combine ability between the bonding layer and the OAAC.
Due to the thin thickness of the aluminum ash coating, the Vickers hardness was used to measure the hardness of the OAAC based on Chinese national standard GB4342-84 [36]. The digital micro hardness tester type was TMV-1, produced by Time Group Inc. (Beijing, China), which is suitable for hardness measurement of materials such as surface coatings, integrated circuit (IC) sheets, and ceramics. The principle was to calculate the Vickers hardness by measuring the diagonal length of the indentation. Then 10 relatively smooth areas selected on the surface of the coating were tested, and the results were averaged.
3. Results and Discussion
3.1. Characterization and Evaluation of Original Aluminum Ash Spray Powder
3.1.1. Observation and Analysis of Microstructure
The microstructure of the OAA and the OAASP was observed by scanning electron microscope, and the results are shown in Figure 4. Figure 4a is the SEM image of OAA, which had extremely irregular particle size and morphology and contained sharp edges and corners. Figure 4b is the SEM image of OAASP obtained after the hydrodynamic ball milling treatment. The particles were comparatively small and uniform, and the shape was approximately spherical. Meanwhile, during the hydrolysis process, some salt particles were dissolved in water and filtered off, and thus the content of salt particles was greatly reduced, which helped to enhance the flowability of the spray powder and facilitate the preparation of the OAAC.
3.1.2. Composition Analysis
The chemical composition of OAASP was analyzed by XRF, and the results are shown in Table 5. Compared with OAA, OAASP had the lesser changed chemical composition and the unvaried type of the element. Some salts were soluble in water and were removed after hydrolysis and filtration.
Figure 5 shows the XRD pattern of OAASP. In comparison with OAA, OAASP had significantly increased Al and Al2O3 content, but also had decreased content of AlN. AlN and H2O could react at room temperature to form Al(OH)3 and NH3, and heating and stirring in a water bath accelerated the chemical reaction. After the NH3 overflowed, the filtered Al(OH)3 was heated in the oven, to be further decomposed into Al2O3 and H2O. Therefore, the nitrogen content in OAASP was reduced, while the Al2O3 content was increased. The results shown in Figure 5 signify that the method of removing nitrogen in aluminum ash by hydrolysis was effective. However, OAASP still contained a handful of AlN. The reason lies in that when AlN is hydrolyzed, Al(OH)3 is formed on the surface of AlN particles to prevent further reaction.
3.1.3. Evaluation of Flowability
The angle of repose is the minimum angle between the slope and the horizontal surface; when the object on the slope is in a critical state of sliding along the slope. It is a common way to evaluate the flowability of the powder. The smaller the angle of repose, the smaller the friction and the better the flowability. It is generally considered that the θ ≤ 40° can meet the needs of production flowability performance [37]. In this experiment, the angle of repose of the different samples is shown in Figure 6. The OAA was irregular particles with an angle of repose of 41.17° and poor flowability performance. After granulation, the OAASP had a smaller angle of repose of 35.70°, which belongs to regular particulates and has ideal flowability. After hydrolysis and ball milling, the angle of repose of OAASP was reduced by 13.28%. It can be seen that the granulation process of hydrolysis and ball milling was conducive to improving the flowability performance of aluminum ash.
3.2. Microstructure Analysis of Original Aluminum Ash Coating
3.2.1. Microstructure of Coating
The microstructure of the OAAC was observed by SEM, and the results are shown in Figure 7. Figure 7a shows the surface morphology of the coating. The surface of the OAAC was relatively rough, because of manual spraying, and different deposition rates of the powders with various phases of OAA. The surface of the coating was dispersed with variety of areas, namely light regions, dark regions, and gray regions. As shown in Figure 7b, the cross section of the sample had obvious stratification. The upper layer was the coating portion formed by the OAASP through the atmospheric plasma spraying process; the middle layer was the bonding layer formed by the Al/Ni powder; the lower layer was a 45-steel substrate. Generally, the thickness of the coating is required to be about 500 μm in the industry [38]. As the coating was hand-sprayed, the thickness of the OAAC was 450–550 μm, which basically met the requirements of industrial production.
3.2.2. Energy Spectrum Analysis
Different color regions existed on the surface of the OAAC, and the SEM and the energy spectrum were used for analysis. The diverse color regions are shown in Figure 8, which are segmented into the gray region, the light region, and the dark region.
The energy spectrum analysis was applied to different regions, and the EDS images are shown in Figure 9. In the light of the proportion of each element, it can be inferred that the main phase in the light region was Al2O3, and the main phases in the gray region and the dark region were Al2O3, SiO2, and Fe3O4. The light region had the highest hardness, about 500–900 HV, and the dark region had the lowest hardness, about 100–200 HV. Therefore, in order to improve the hardness of the coating, dark regions should be avoided during the spraying process.
3.2.3. Phase Analysis
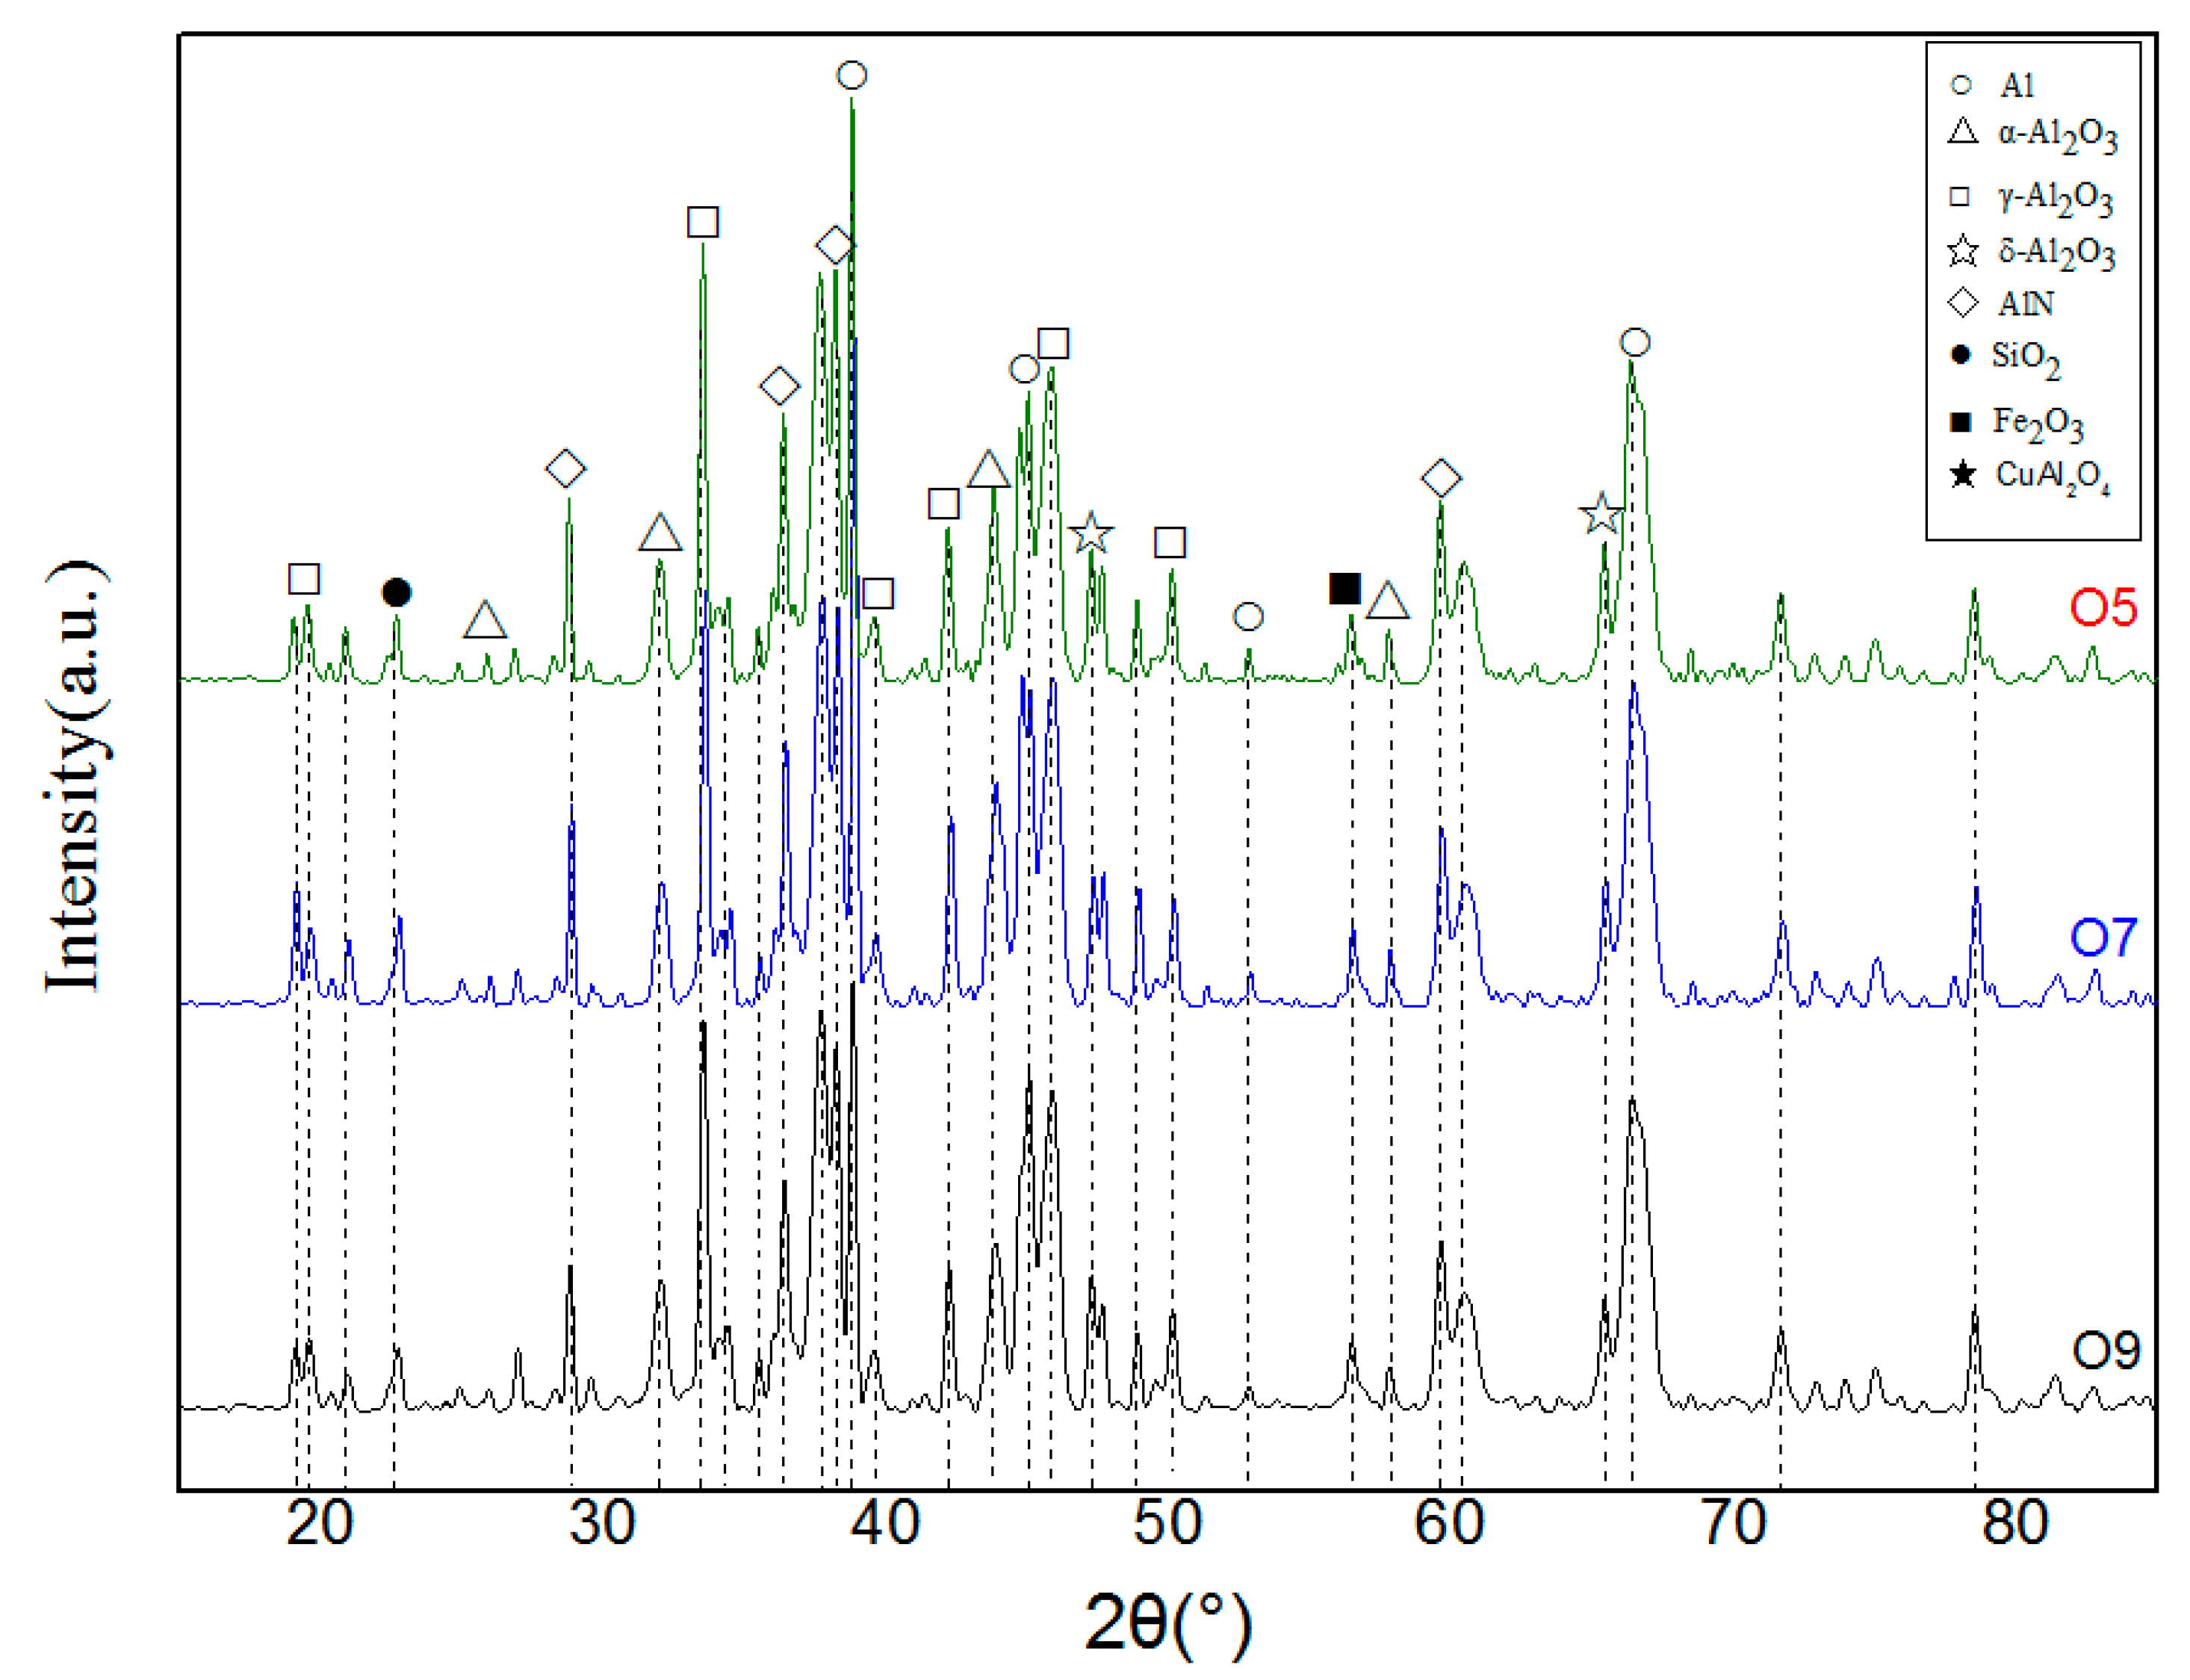
Figure 10 shows the XRD pattern of the OAAC. It is observed that the phase of the OAAC lessened compared with OAASP, for the residual Al(OH)3 in the sprayed powder was completely converted to Al2O3 under the high temperature of plasma spraying, which could enhance the stability of the coating. The main phases were Al, different forms of Al2O3, AlN, etc. Al2O3 in the OAAC had three phases, which were α-Al2O3, γ-Al2O3, and δ-Al2O3. Among them, α-Al2O3 is the most stable form of the Al2O3 crystal form, which was the key to the high performance of the alumina ceramic coating. γ-Al2O3 and δ-Al2O3 are transitional alumina with unstable properties, and when they are heated to above 1200 °C, most of them can be converted into α-Al2O3, which could enhance the performance of the coating. The plasma arc outer flame temperature was above 2000 °C, and theoretically γ-Al2O3 and δ-Al2O3 should have been completely converted into α-Al2O3. However, in the actual spraying process, due to the excessive powder feed speed and the transition state alumina powder being wrapped by other types of powder, it could not be fully converted into α-Al2O3. For small particles, the metastable forms of Al2O3 are normally retained and also γ-Al2O3 is usually formed from molten particles by reason of low interfacial energy.
3.3. Coating Performance Optimization
3.3.1. Orthogonal Experiment
The spray process had a large impact on the coating properties, while the spray process and coating properties all contained multiple parameters. An orthogonal experiment is a commonly used multi-factor and multi-level experimental design method, which can reduce the workload, and the experimental results are evenly dispersed and neatly comparable. This experiment mainly verified the feasibility of optimizing the performance of the coating by orthogonal experiment. Therefore, the spray current, spray voltage, the powder flow rate and the main gas flow were selected as the research variables. Other spraying process parameters such as spray distance (100 mm) and spray angle (60°) remained unchanged. Finally, the best coating process parameters for OAAC was determined by testing the coating properties. This study conducted an L9 (34) orthogonal experiment, and the parameter orthogonal table is shown in Table 4. The microhardness, adhesive strength, porosity, and abrasion rate of the obtained coating samples were taken as the indicators, and the orthogonal test results were analyzed by comprehensive scoring method.
First, the weight of each indicator was given according to the different importance, and then the weighted indicator was calculated for each test, in order to convert into a single indicator problem. The comprehensive score was 100 points, in which microhardness, porosity, abrasion rate, and adhesive strength are 25 points respectively. Because the porosity and abrasion rate of the coating were negatively related to the coating quality, it was a negative value. The microhardness, adhesive strength, porosity, and abrasion rate listed in Table 6 were calculated from the test results. In the lower half of Table 6, k1, k2, and k3 are the average values of the first, second, and third levels of the respective factors. R is the extreme difference (i.e., the difference between the maximum and minimum values in k1, k2, and k3), which reflected the degree of influence of the listed factors on the indicators of the sample; that is, the larger the R, the greater the influence of the listed factors on the indicators.
The primary and secondary indicators affecting the performance of OAAC could be obtained by orthogonal test, i.e., spray current > spray voltage > main gas flow > powder flow rate. When the spray current was 600 A, the spray voltage was 60 V, the main gas flow rate was 33 slpm, and the powder flow rate was 11 V, the performance of obtained coating was superior. The OAAC was prepared according to the preferred parameters, and the performance test results of OAAC are shown in Table 7. Compared with the coating prepared under the O9 process which had the best comprehensive performance in nine groups, the adhesive strength was increased by 33%; compared with the 45-steel substrate, the hardness was increased by about 100%.
3.3.2. Optimization of Alumina Content in OAASP
Spray was carried out using OAASP as raw materials under the preferred process parameters of Table 7. Considering the cost of spray powder, adding 0%–50% high-purity alumina as modifier, the change of comprehensive performance of OAAC was investigated. The specific proportion of alumina in spray powder is shown in Table 8.
The microhardness, porosity, abrasion rate, and adhesive strength of the coating were measured. The results are shown in Table 9, and H100 was a high purity alumina ceramic coating. With the increase of high purity alumina, the above four properties of OAAC were improved to varying degrees. When the amount of Al2O3 added was 50%, the coating performance parameters can be obtained from Table 9. Compared with the H0 coating, the microhardness increased by 17.61%, the porosity decreased by 19.63%, the abrasion rate decreased by 19.83%, and the adhesive strength increased by 5.35%. However, its performance was lower than high-purity alumina ceramic coatings. It can be seen that the content of alumina in the aluminum ash played an important role in the performance of the coating. With the addition of Al2O3, the overall performance of the coating was significantly improved.
4. Conclusions
- The plasma spray powder was prepared by OAA after hydrolyzing and ball milling; the roundness of the particles was improved; the AlN content was reduced and the angle of repose of OAASP was 32.19°. Compared with OAA, the angle of repose was reduced by 13.28%, and the flowability of powder was higher, which met the requirements of the plasma spraying.
- The sorts of the phases of the OAAC were greatly reduced, and the main phases were Al and different forms of Al2O3. Some regions with different brightness were formed on the surface of the coating. While the hardness of disparate regions differed, the hardness of the light region was the highest. Therefore, during the spraying process, the formation of dark areas should be averted in order to improve the hardness of the coating.
- The primary and secondary order of the influence of the spraying process parameters on the comprehensive performance of the OAAC was determined by the orthogonal experiment, i.e., the spray current > spray voltage > the main gas flow > the powder flow rate. The preferred spraying parameters were: spraying current 600 A, spraying voltage 60 V, main gas flow 33 slpm, and powder flow rate 22 g/min.
- The amount of alumina in the spray powder had a large effect on the properties of the coating. Therefore, in order to improve the quality of the aluminum ash coating, the spray powder can be purified or an appropriate amount of alumina can be added to the spray powder to increase the alumina content.
- The spray process parameters were optimized by orthogonal experiments, but simply four factors were considered in our research. In the future, factors like spray distance and spray angle can be taken into account to obtain an optimal solution.
5. Patents
The authors of this paper have carried out research on the recycling and reuse of aluminum ash for many years. Three China invention patents related to this paper have been granted, the patent numbers are CN106830025B, CN106745618B and CN106830035B. In addition, four China invention patents have been published; the patent numbers are CN107312998A, CN106893962A, CN108704920A and CN107058936A.
Author Contributions
Conceptualization, H.N. and Y.Z.; methodology, S.L.; validation, J.Z. and T.G.; formal analysis, H.N. and S.L.; investigation, J.Z. and X.W.; resources, H.N. and S.L.; writing—original draft, J.Z.; writing—review and editing, H.N. and S.L.; visualization, J.Z.; supervision, H.N.
Funding
This research was supported by A Priority Academic Program Development of Jiangsu Higher Education Institutions (PAPD), Key Research and Development Program of Jiangsu (Industry Prospects and Common Key Technologies) (BE2018093), Jiangsu Province University Students Innovation Training Program Key Project (201910304055Z).
Conflicts of Interest
The authors declare no conflict of interest.
References
- Wu, C.Y.; Yu, H.F.; Zhang, H.F. Extraction of aluminum by pressure acid-leaching method from coal fly ash. Trans. Nonferrous Met. Soc. China 2012, 22, 2282–2288. [Google Scholar] [CrossRef]
- Li, X.L.; Ou, Y.J.; Li, C.L.; Zhu, J.K.; Zhi, P.G. Preparation of Alumina from Aluminum Ash by Sintering with Sodium Hydroxide; IOP Conference Series: Earth and Environmental Science; IOP Publishing: Bristol, UK, 2018; Volume 233. [Google Scholar]
- Aubert, J.E.; Husson, B.; Vaquier, A. Metallic aluminum in MSWI fly ash: Quantification and influence on the properties of cement-based products. Waste Manag. 2004, 24, 589–596. [Google Scholar] [CrossRef] [PubMed]
- Zhang, H.; Zhang, X.; Zhao, X.; Tang, Y.; Zuo, Y. Preparation of Ti–Zr-based conversion coating on 5052 aluminum alloy, and its corrosion resistance and antifouling performance. Coatings 2018, 8, 397. [Google Scholar] [CrossRef]
- Yang, Y.; Guo, Y.Q.; Zhu, W.S.; Huang, J.B. Environmental impact assessment of China’s primary aluminum based on life cycle assessment. Trans. Nonferrous Met. Soc. China 2019, 29, 1784–1792. [Google Scholar] [CrossRef]
- Chen, Z.L.; Tang, M.H.; Lu, S.Y.; Alfons, B.; Ding, J.M.; Qiu, Q.L.; Yan, J.H. Mechanochemical degradation of PCDD/Fs in fly ash within different milling systems. Chemosphere 2019, 223, 188–195. [Google Scholar]
- Li, B.H.; Deng, Z.Y.; Wang, W.X.; Fang, H.S.; Zhou, H.B.; Deng, F.X.; Huang, L.; Li, H.Y. Degradation characteristics of dioxin in the fly ash by washing and ball-milling treatment. J. Hazard. Mater. 2017, 339, 191–199. [Google Scholar] [CrossRef]
- Arumugam, N.; Amirhomayoun, S.; Takayuki, S. Hydrogen gas generation from metal aluminum-water interaction in municipal solid waste incineration (MSWI) bottom ash. Waste Manag. 2018, 73, 342–350. [Google Scholar]
- Arumugam, N.; Nithiya, A.; Takayuki, S. Aluminum and aluminum alloys in municipal solid waste incineration (MSWI) bottom ash: A potential source for the production of hydrogen gas. Int. J. Hydrogen Energy 2016, 41, 820–831. [Google Scholar]
- Vareda, J.P.; Valente, A.J.M.; Luisa, D. Assessment of heavy metal pollution from anthropogenic activities and remediation strategies: A review. J. Environ. Manag. 2019, 246, 101–118. [Google Scholar] [CrossRef]
- Abyzov, V.A. Refractory cellular concrete based on phosphate binder from waste of production and recycling of aluminum. Procedia Eng. 2017, 206, 783–789. [Google Scholar] [CrossRef]
- Abyzov, V.A. Lightweight refractory concrete based on aluminum-magnesium-phosphate binder. Procedia Eng. 2016, 150, 1440–1445. [Google Scholar] [CrossRef]
- Zhan, D.P.; Zhang, H.S.; Jiang, Z.H. Effects of AIMnCa and AIMnFe alloys on deoxidization of low carbon and low silicon aluminum killed steels. J. Iron Steel Res. Int. 2008, 15, 15–18. [Google Scholar] [CrossRef]
- Zhang, G.H.; Chou, K.C. Deoxidation of molten steel by aluminum. J. Iron Steel Res. Int. 2015, 22, 905–908. [Google Scholar] [CrossRef]
- Peng, H.L.; Zhong, S.X.; Xiang, J.X.; Lin, Q.T.; Yao, C.; Dong, J.H.; Yin, G.C.; Yao, K.; Zeng, S.Y.; Zhong, J. Characterization and secondary sludge dewatering performance of a novel combined aluminum-ferrous-starch flocculant (CAFS). Chem. Eng. Sci. 2017, 173, 335–345. [Google Scholar] [CrossRef]
- Lin, Q.T.; Peng, H.L.; Zhong, S.X.; Xiang, J.X. Synthesis, characterization, and secondary sludge dewatering performance of a novel combined silicon–aluminum–iron–starch flocculant. J. Hazard. Mater. 2015, 285, 199–206. [Google Scholar] [CrossRef] [PubMed]
- Kachalova, G.S. Modern Coagulants and Flocculants in the Cleaning of Washing Waters of Water Treatment Plants; IOP Conference Series: Earth and Environmental Science; IOP Publishing: Bristol, UK, 2018; Volume 451. [Google Scholar]
- Tripathy, A.K.; Mahalik, S.; Sarangi, C.K.; Tripathy, B.C.; Sanjay, K.; Bhattacharya, I.N. A pyro-hydrometallurgical process for the recovery of alumina from waste aluminium dross. Miner. Eng. 2019, 137, 181–186. [Google Scholar] [CrossRef]
- Ramaswamy, P.; Ranjit, S.; Bhattacharjee, S.; Gomes, S.A. Synthesis of high temperature (1150 °C) resistant materials after extraction of oxides of Al and Mg from aluminum dross. Mater. Proc. 2019. [Google Scholar] [CrossRef]
- Leiva, C.; Galiano, Y.L.; Arenas, C.; Fariñas, B.A.; Pereira, F. A porous geopolymer based on aluminum-waste with acoustic properties. Waste Manag. 2019, 95, 504–512. [Google Scholar] [CrossRef]
- Dirisu, J.O.; Fayomi, O.S.I.; Oyedepo, S.O.; Jolayemi, K.J.; Moboluwarin, D.M. Critical evaluation of aluminium dross composites and other potential building ceiling materials. Procedia Manuf. 2019, 35, 1205–1210. [Google Scholar] [CrossRef]
- Echarri-Iribarren, V.; Echarri-Iribarren, F.; Rizo-Maestre, C. Ceramic panels versus aluminium in buildings: Energy consumption and environmental impact assessment with a new methodology. Procedia Manuf. 2019, 233, 959–974. [Google Scholar] [CrossRef]
- Sobolev, A.; Kossenko, A.; Zinigrad, M.; Borodianskiy, K. An investigation of oxide coating synthesized on an aluminum alloy by plasma electrolytic oxidation in molten salt. Appl. Sci. 2017, 7, 889. [Google Scholar] [CrossRef]
- Takajo, S.; Hollis, K.J.; Cummins, D.R.; Tegtmeier, E.L.; Dombrowski, D.E.; Vogel, S.C. Texture evolution in U-10Mo nuclear fuel foils during plasma spray coating with Zr. Quantum Beam Sci. 2018, 2, 12. [Google Scholar] [CrossRef]
- Sanjai, S.G.; Anathakrishna, B.; Sumanth, M.S.; Srideep, S.; Ramaswamy, P. Process development to synthesize plasma sprayable powders from nano alumina ceramic powders. Mater. Today Proc. 2019. [Google Scholar] [CrossRef]
- Rahmati, M.; Raeissi, K.; Toroghinejad, M.R.; Hakimizad, A.; Santamaria, M. Effect of pulse current mode on microstructure, composition and corrosion performance of the coatings produced by plasma electrolytic oxidation on AZ31 Mg alloy. Coatings 2019, 9, 688. [Google Scholar] [CrossRef]
- He, L.; Zhao, Y.; Xing, L.; Liu, P.; Zhang, Y.; Wang, Z. Low infrared emissivity coating based on graphene surface-modified flaky Aluminum. Materials 2018, 11, 1502. [Google Scholar] [CrossRef]
- Algahtani, A.; Mahmoud, E.R.; Khan, S.Z.; Tirth, V. Experimental studies on corrosion behavior of ceramic surface coating using different deposition techniques on 6082-T6 aluminum alloy. Processes 2018, 6, 240. [Google Scholar] [CrossRef]
- Gatzen, C.; Mack, D.E.; Guillon, O.; Vaßen, R. YAlO3-A novel environmental barrier coating for Al2O3/Al2O3-ceramic matrix composites. Coatings 2019, 9, 609. [Google Scholar] [CrossRef]
- Chen, X.; Li, C.D.; Xu, S.J.; Hu, Y.; Ji, G.C.; Wang, H.T. Microstructure and microhardness of Ni/Al-TiB2 composite coatings prepared by cold spraying combined with postannealing treatment. Coatings 2019, 9, 565. [Google Scholar] [CrossRef]
- Cheng, K.C.; Chen, J.H.; Stadler, S.; Chen, S.H. Properties of atomized AlCoCrFeNi high-entropy alloy powders and their phase-adjustable coatings prepared via plasma spray process. Appl. Surf. Sci. 2019, 478, 478–486. [Google Scholar] [CrossRef]
- Yusoff, N.H.N.; Ghazali, M.J.; Isa, M.C.; Daud, A.R.; Muchtar, A. Effects of powder size and metallic bonding layer on corrosion behaviour of plasma-sprayed Al2O3-13% TiO2 coated mild steel in fresh tropical seawater. Ceram. Int. 2013, 39, 2527–2533. [Google Scholar] [CrossRef]
- ISO7784.2-97. Paints and Varnishes-Determination of Resistance to Abrasion. Part 2: Rotating Abrasive Rubber Wheel Method; International Organization for Standardization: Geneva, Switzerland, 1997.
- GB/T 8642-2002. Thermal Spraying-Determination of Tensile Adhesive Strength; China Machinery Industry Federation: Beijing, China, 2002. (In Chinese)
- GB4342-84. Metal microscopic Vickers Hardness Test Method; China Ministry of Metallurgical Industry: Beijing, China, 1984. (In Chinese)
- John, G.O.; Li, W.G.; Zhao, Y.T.; Li, C.L. Porosity and its significance in plasma-sprayed coatings. Coatings 2019, 9, 460. [Google Scholar]
- Geldart, D.; Abdullah, E.C.; Hassanpour, A.; Nwoke, L.C.; Wouters, I. Characterization of powder flowability using measurement of angle of repose. China Particuol. 2006, 4, 104–107. [Google Scholar] [CrossRef]
- Tan, A.W.Y.; Sun, W.; Bhowmik, A.; Lek, J.Y.; Marinescu, I.; Li, F.; Khun, N.W.; Dong, Z.L.; Liu, E. Effect of coating thickness on microstructure, mechanical properties and fracture behaviour of cold sprayed Ti6Al4V coatings on Ti6Al4V substrates. Surf. Coat. Technol. 2018, 349, 303–317. [Google Scholar] [CrossRef]
Figure 1.
The XRD pattern of OAA.
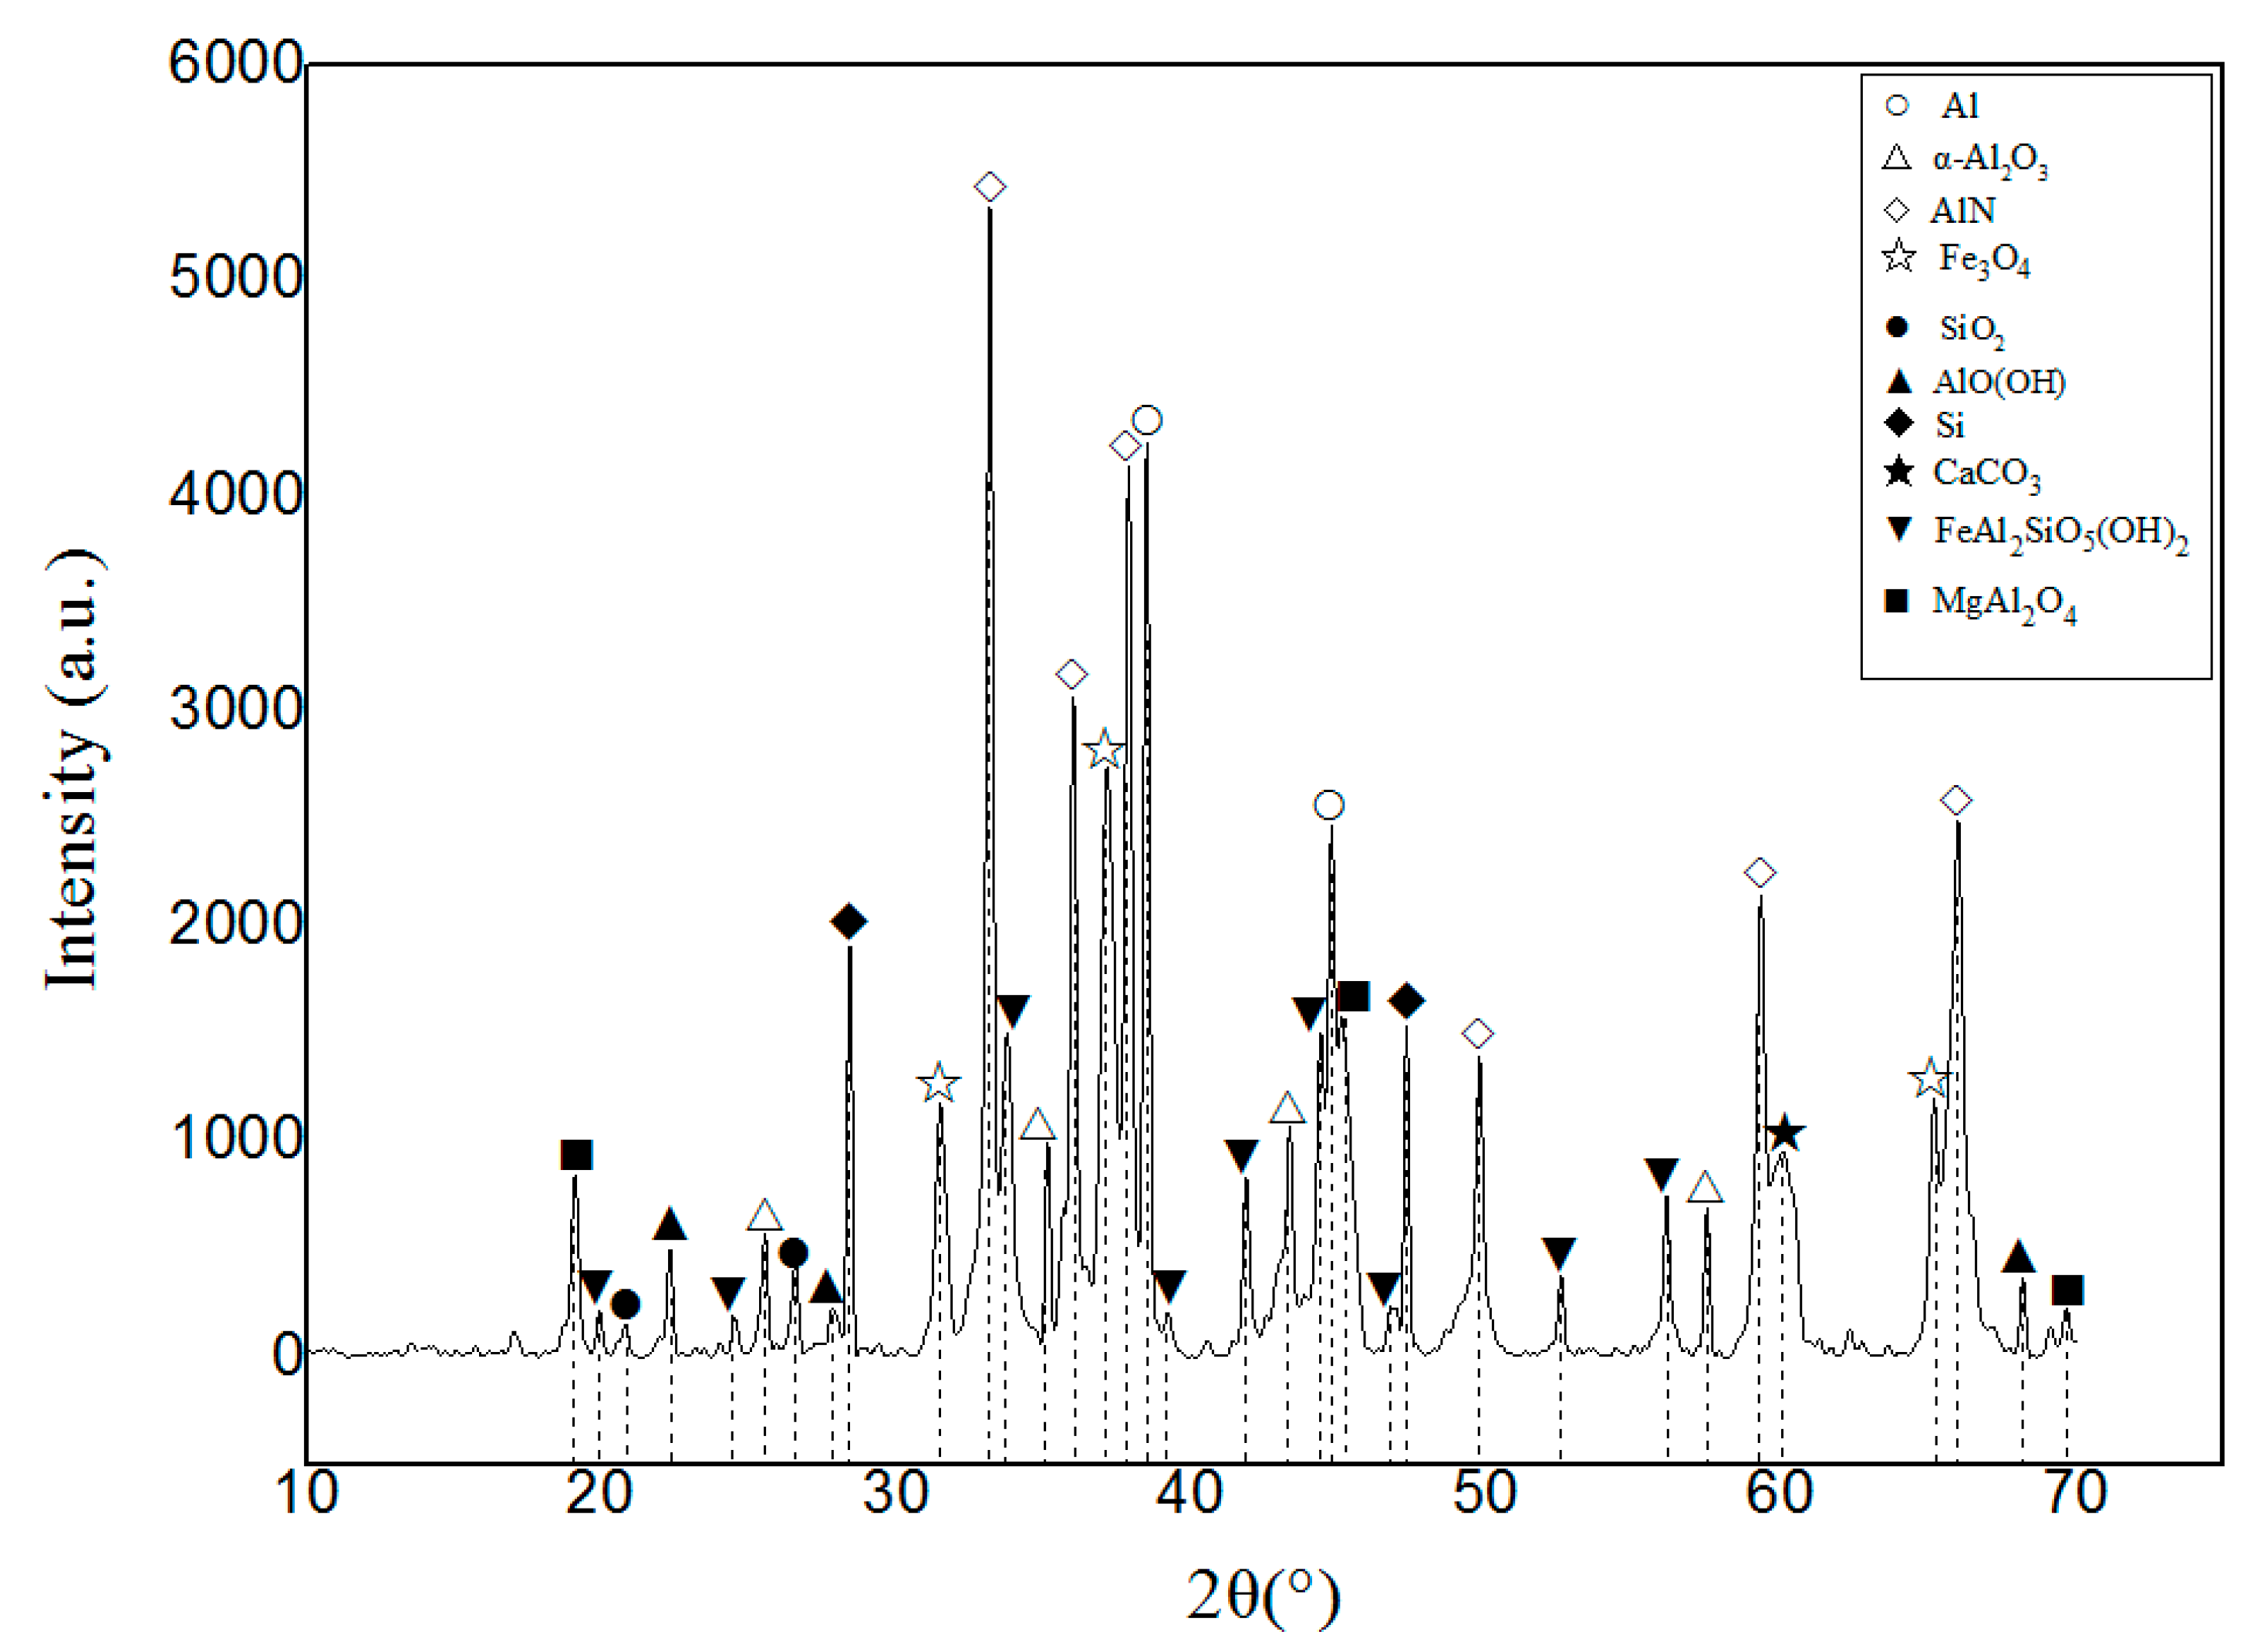
Figure 2.
Stratification of aluminum ash after hydrolysis and resting.

Figure 3.
Particle size distribution diagram of original aluminum ash spray powder (OAASP).
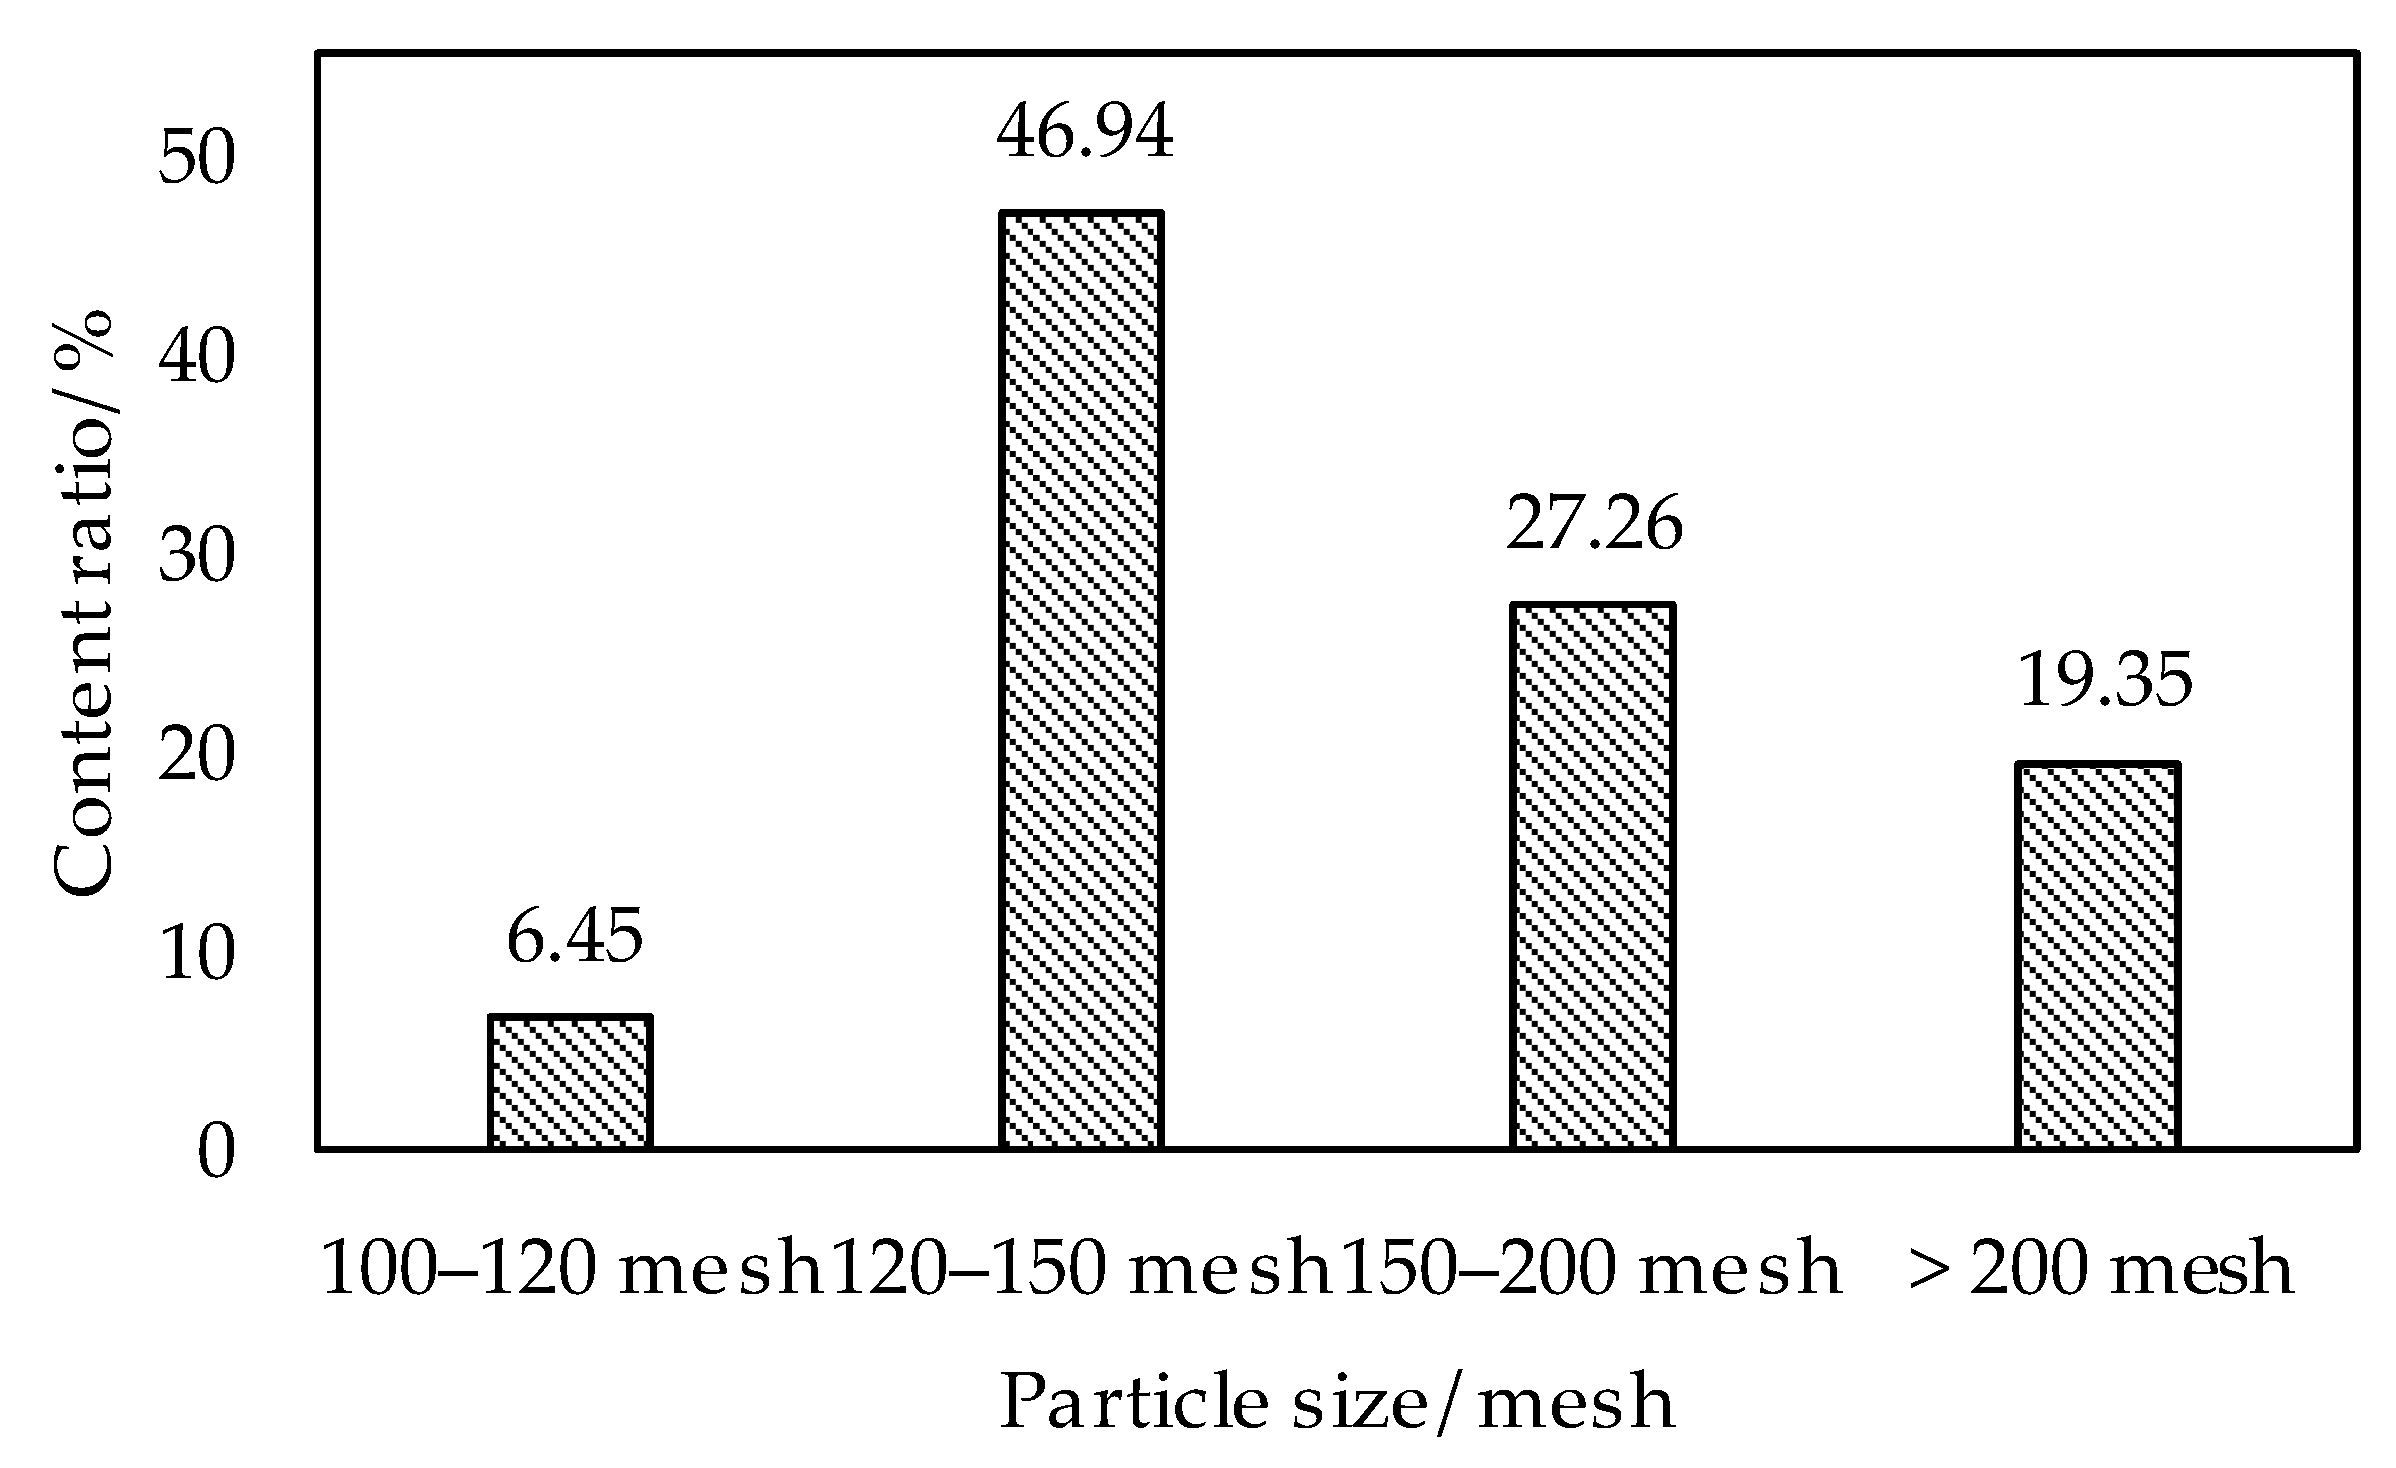
Figure 4.
SEM images: (a) OAA image; (b) OAASP image.
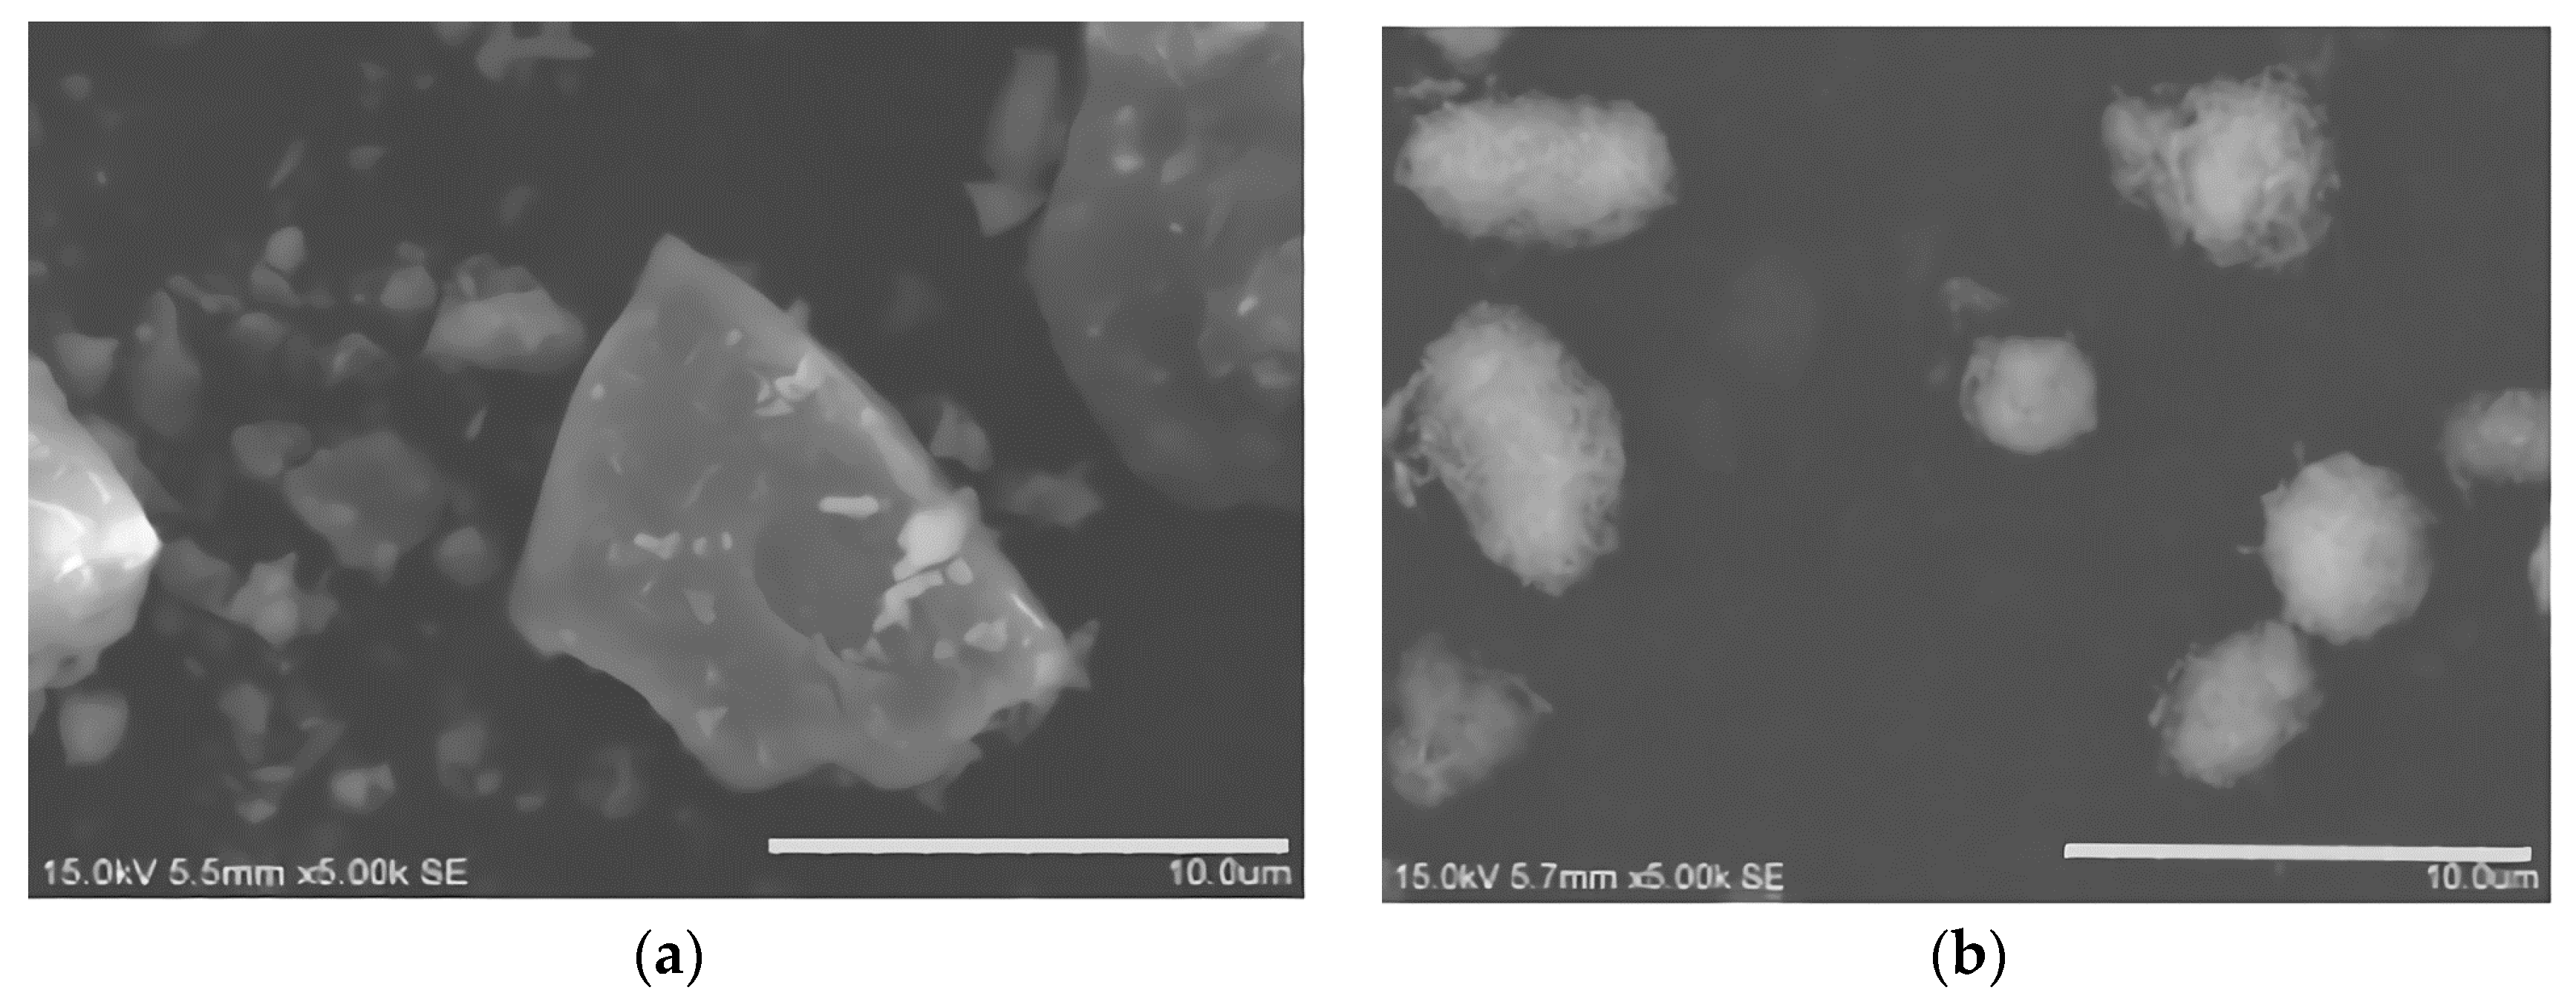
Figure 5.
The XRD pattern of OAASP.
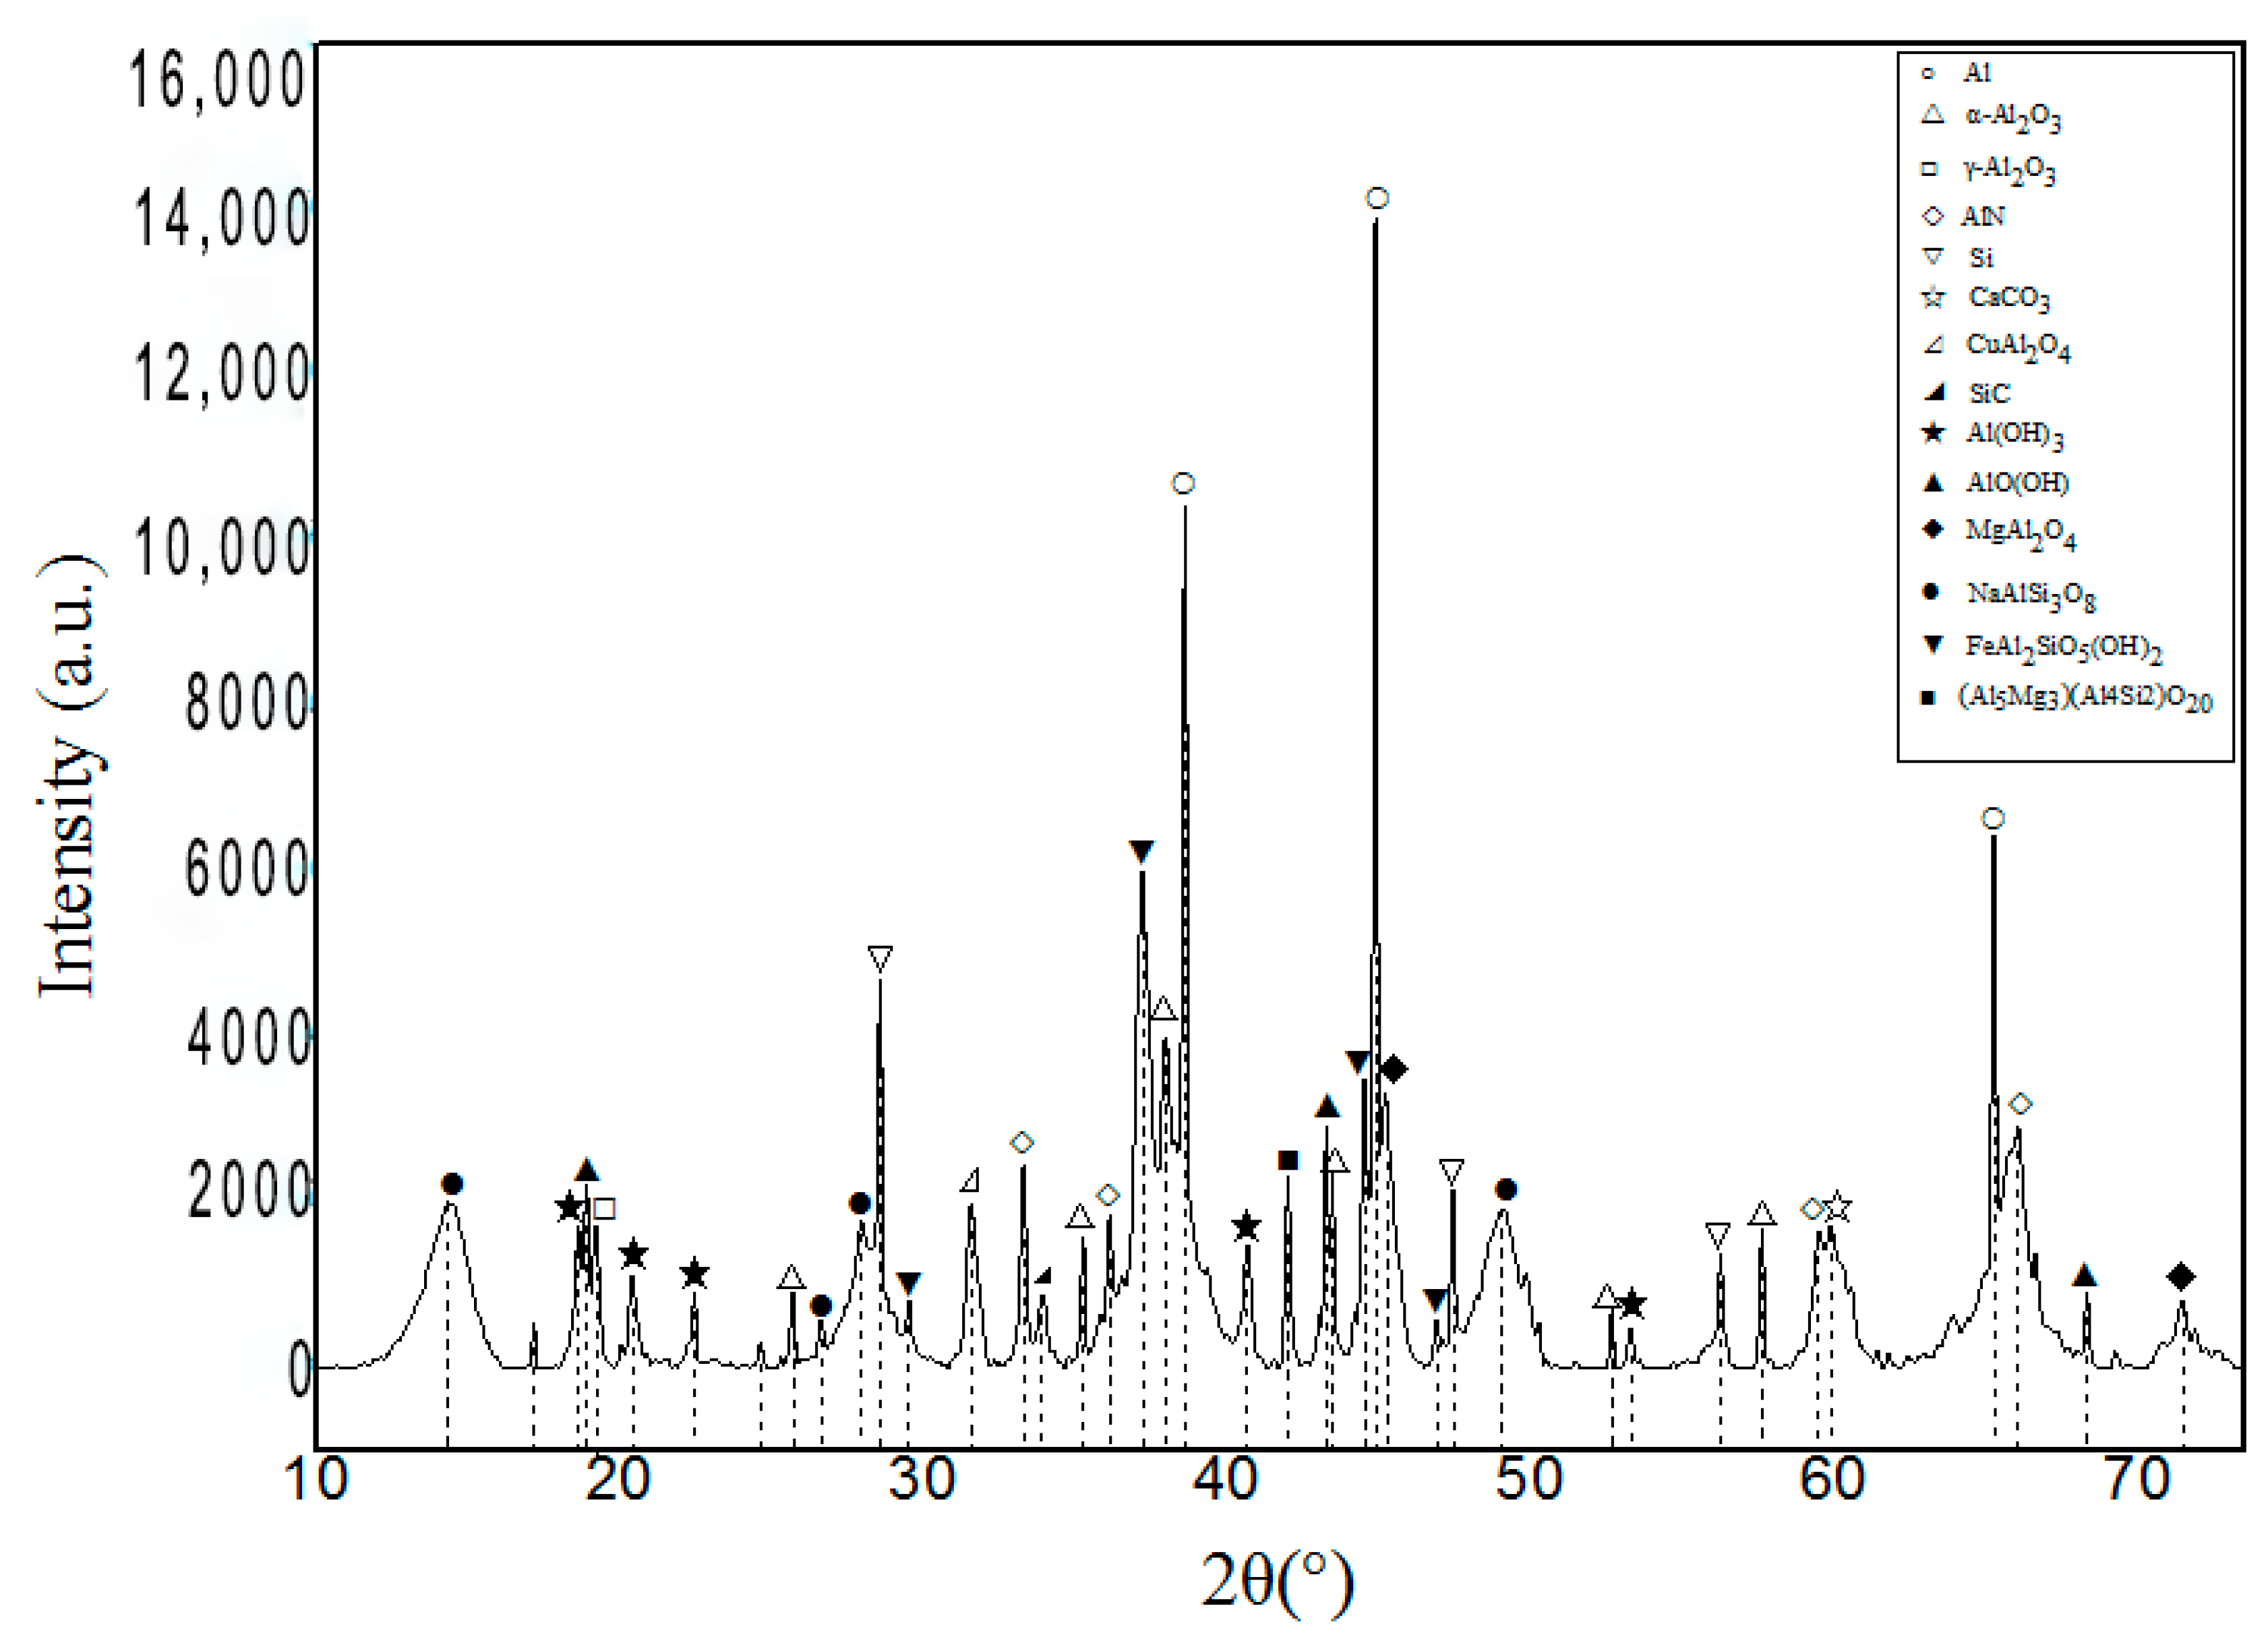
Figure 6.
Angle of repose of different samples.
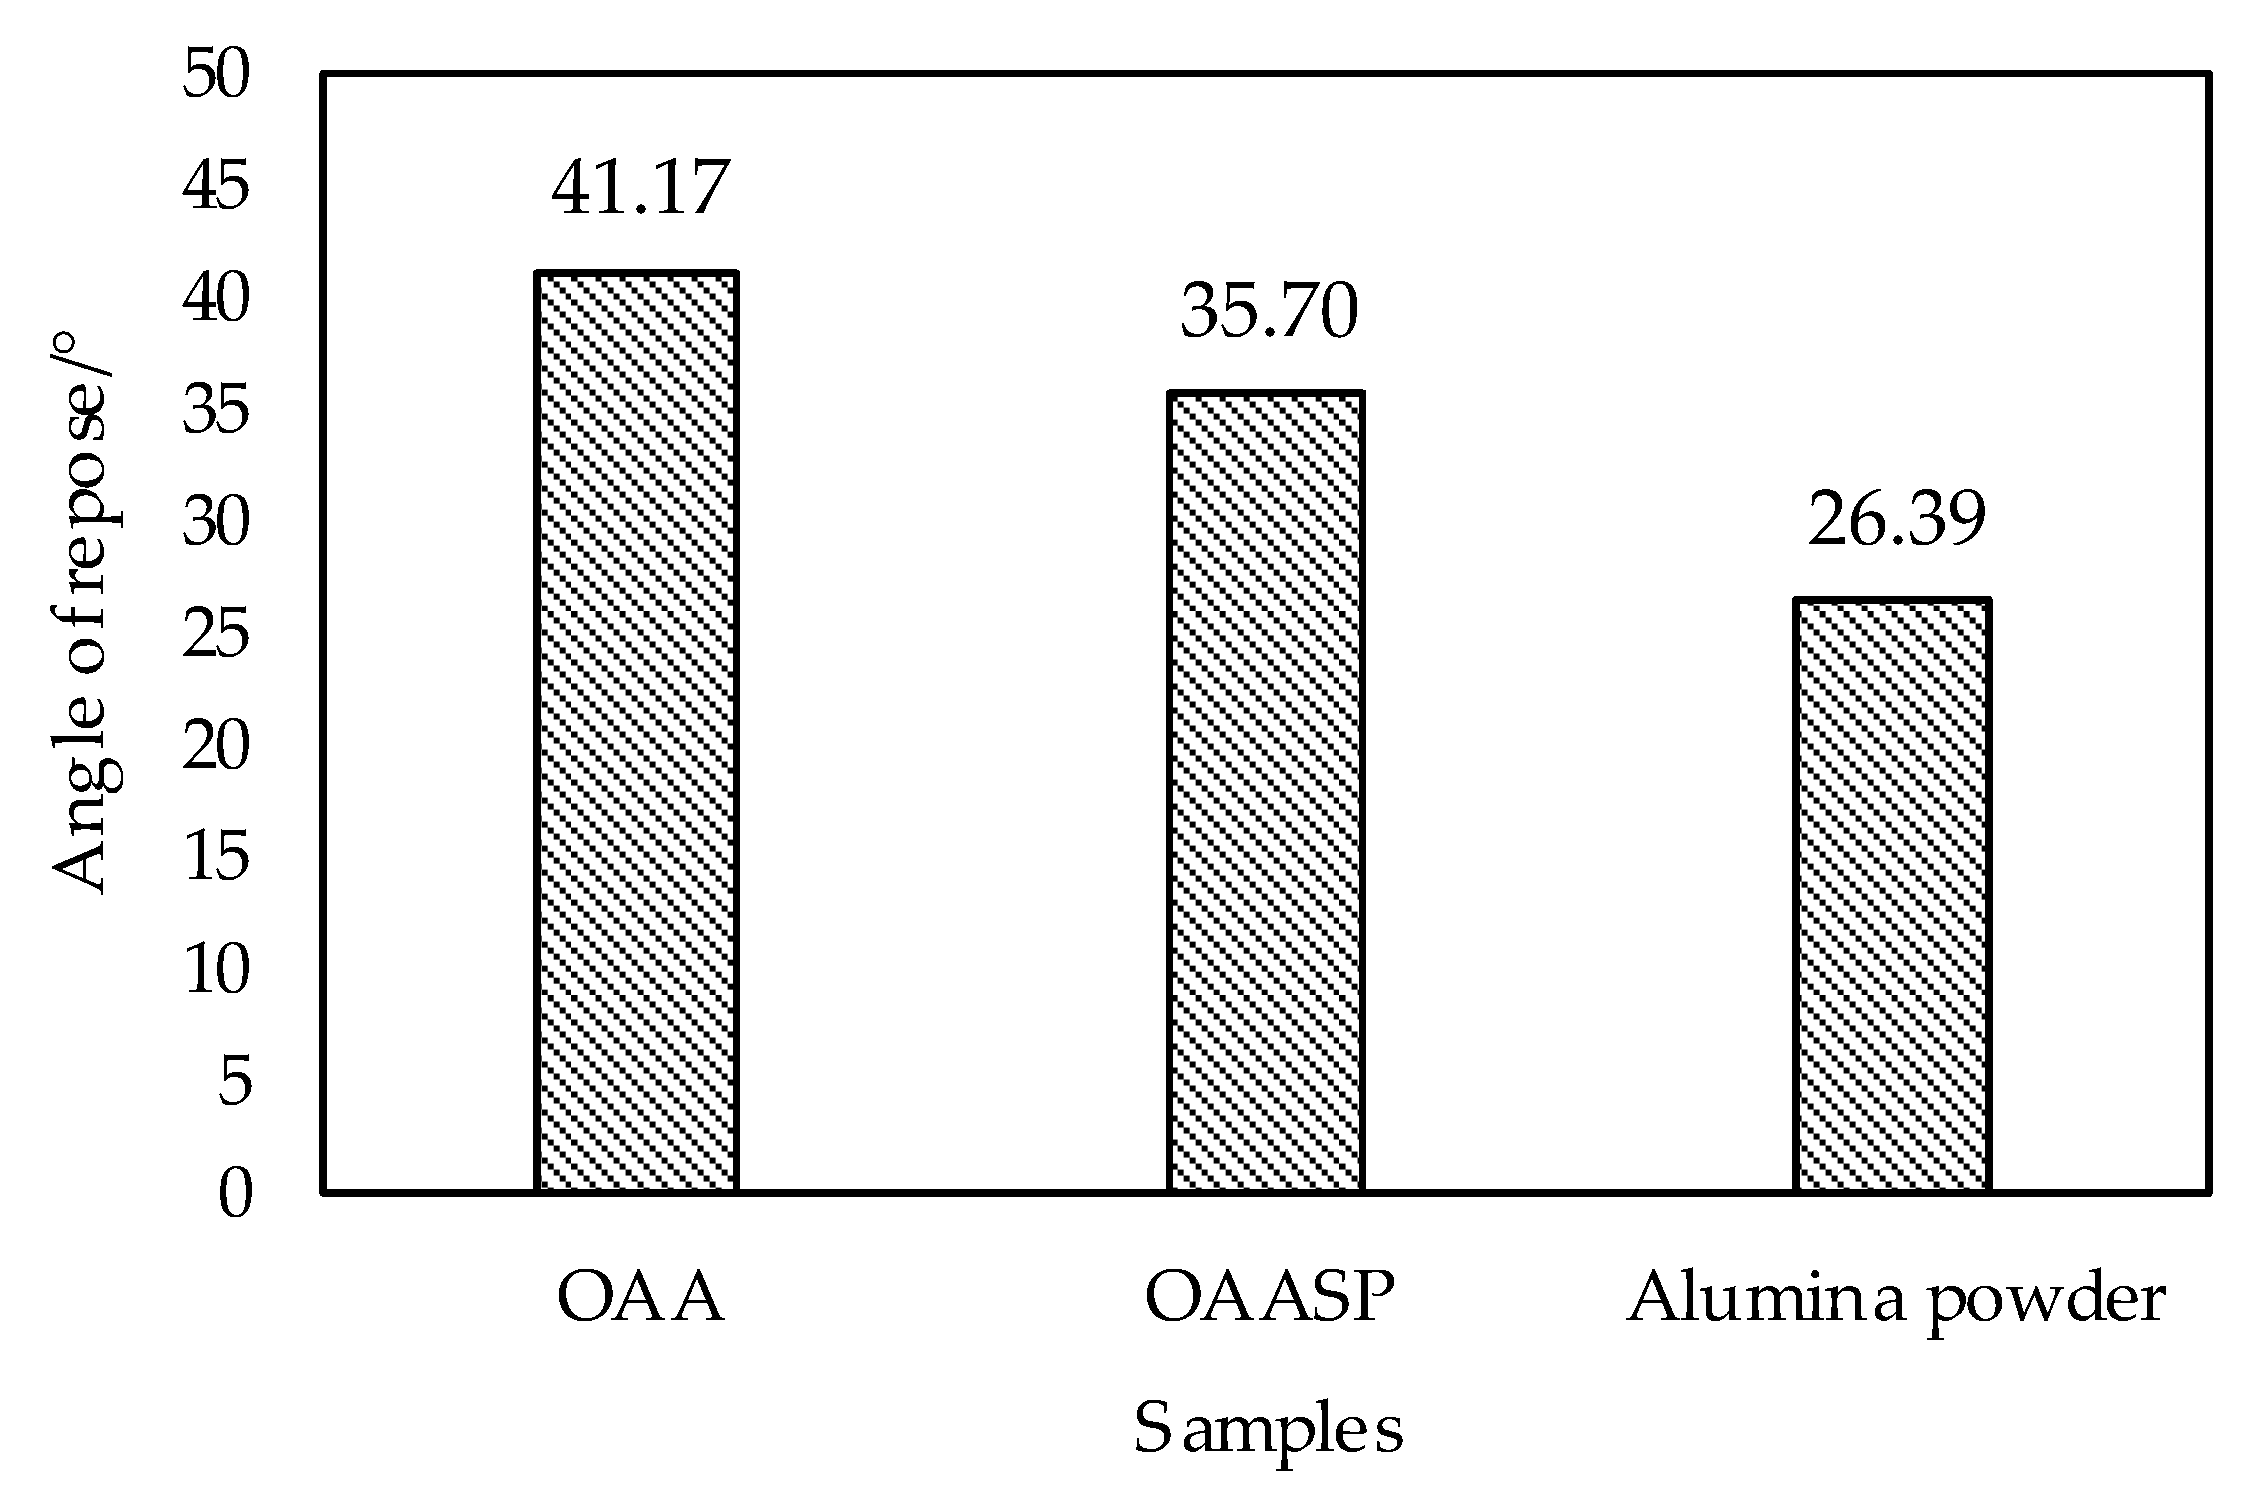
Figure 7.
SEM images of coatings: (a) surface microstructure; (b) cross section microstructure.
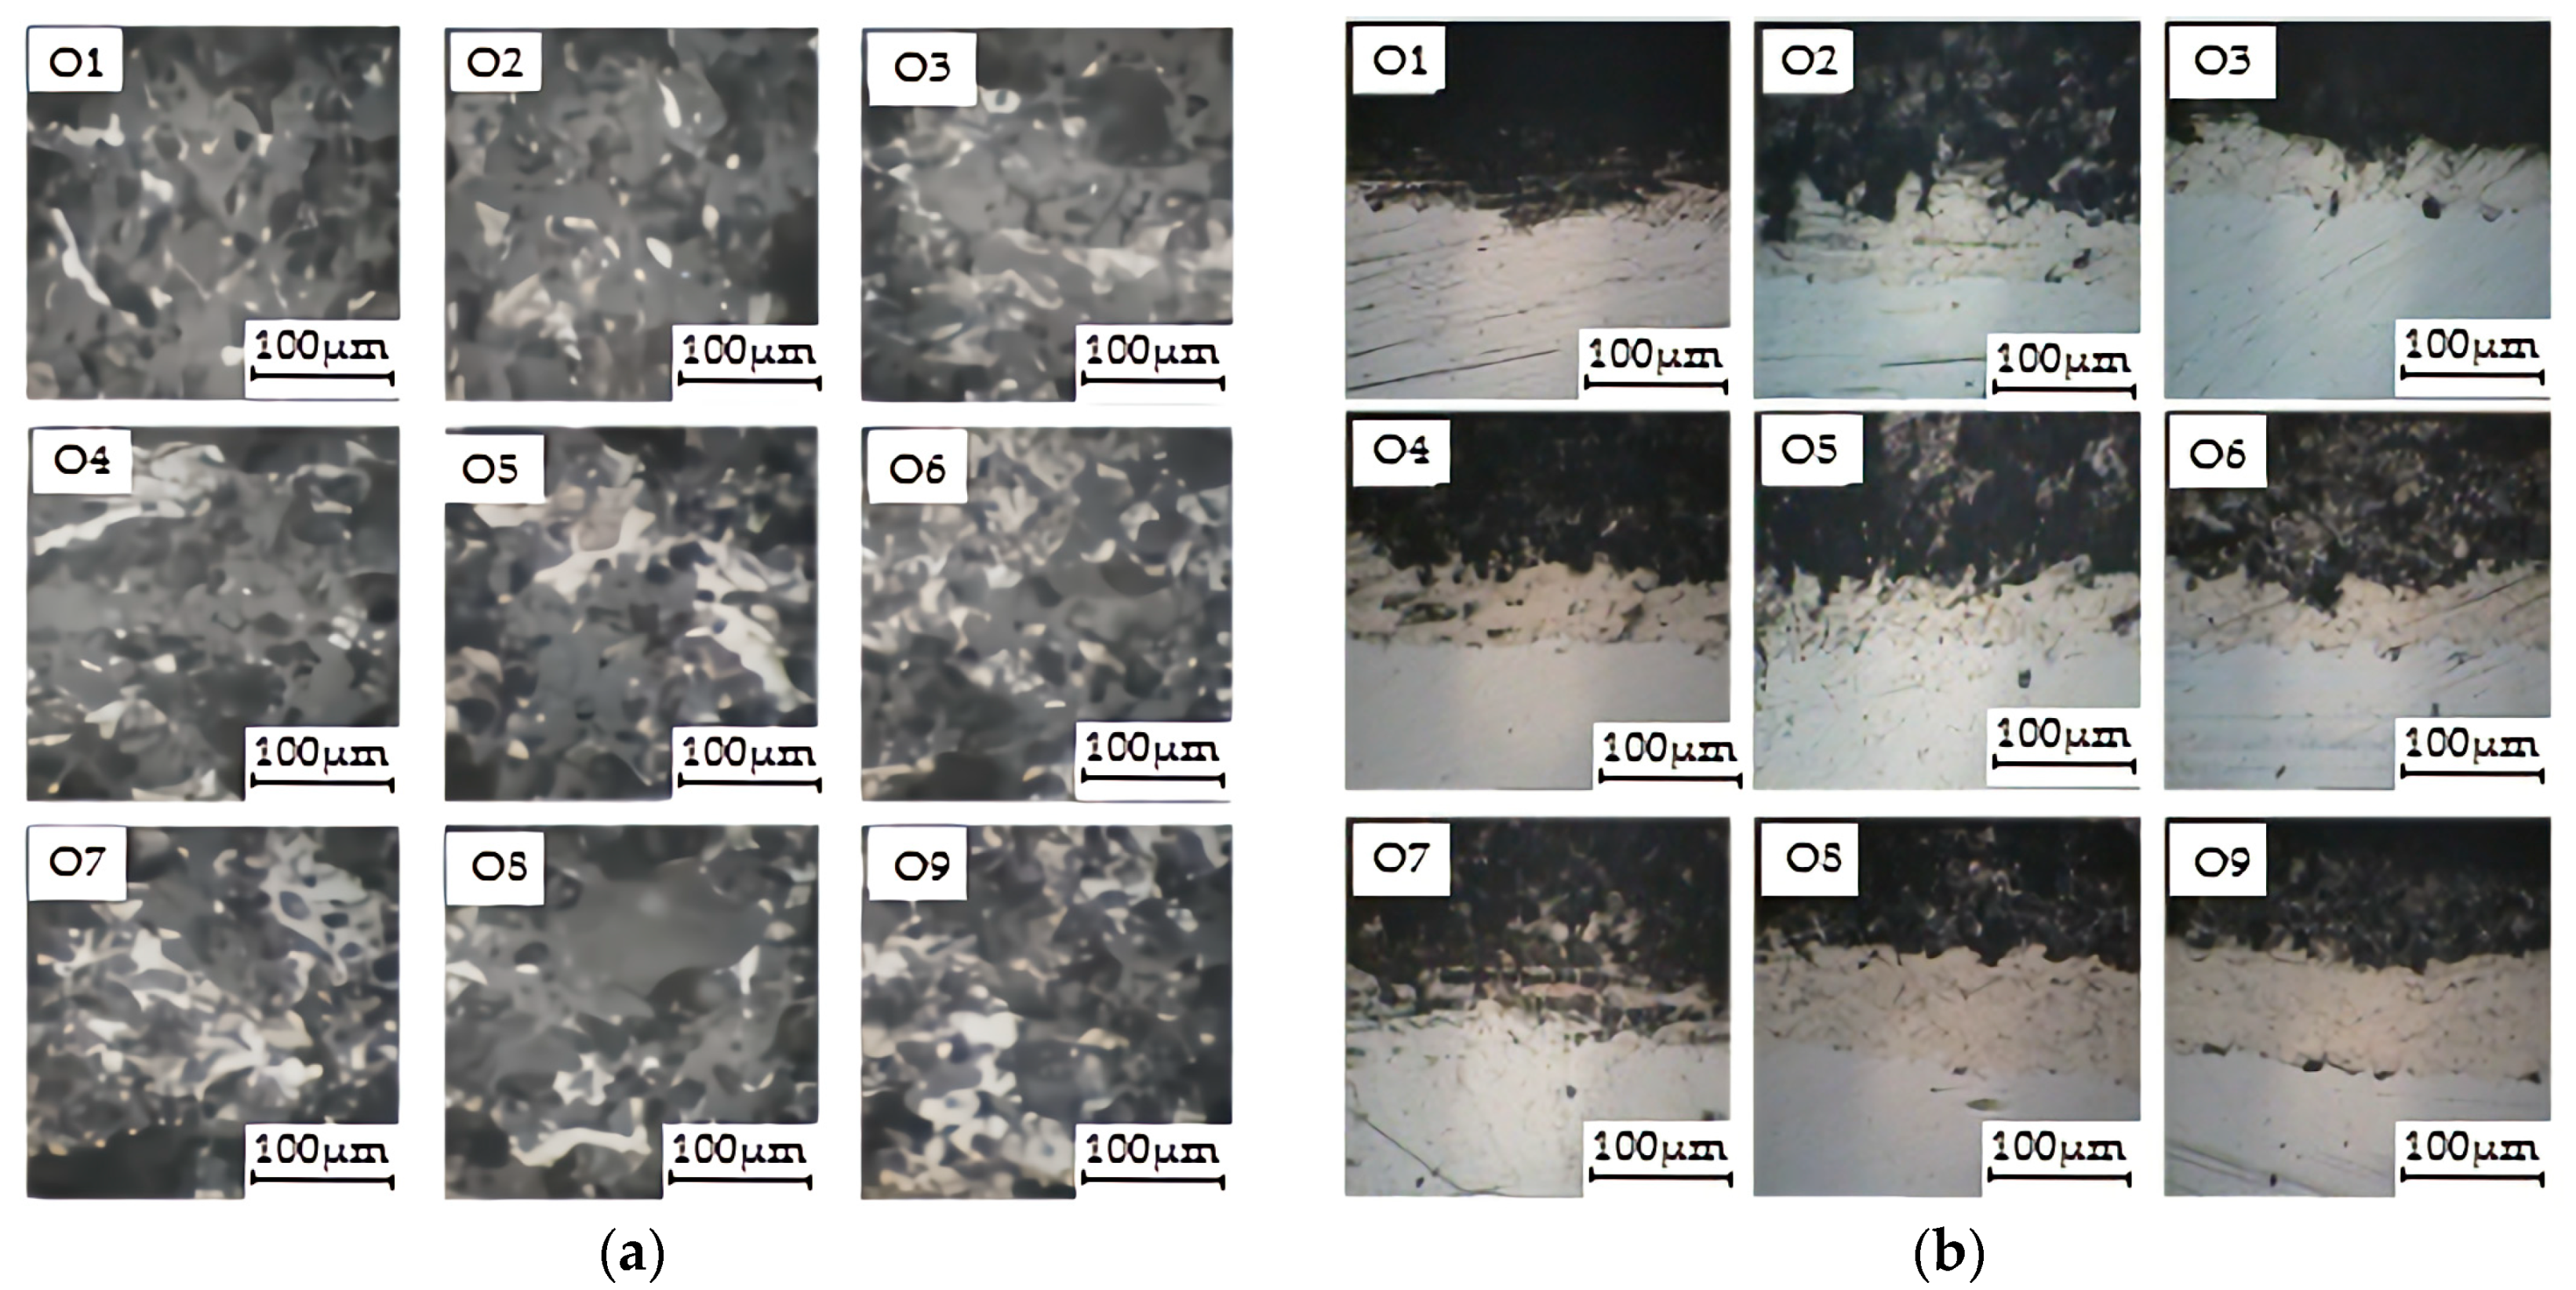
Figure 8.
SEM image of the coating surface.
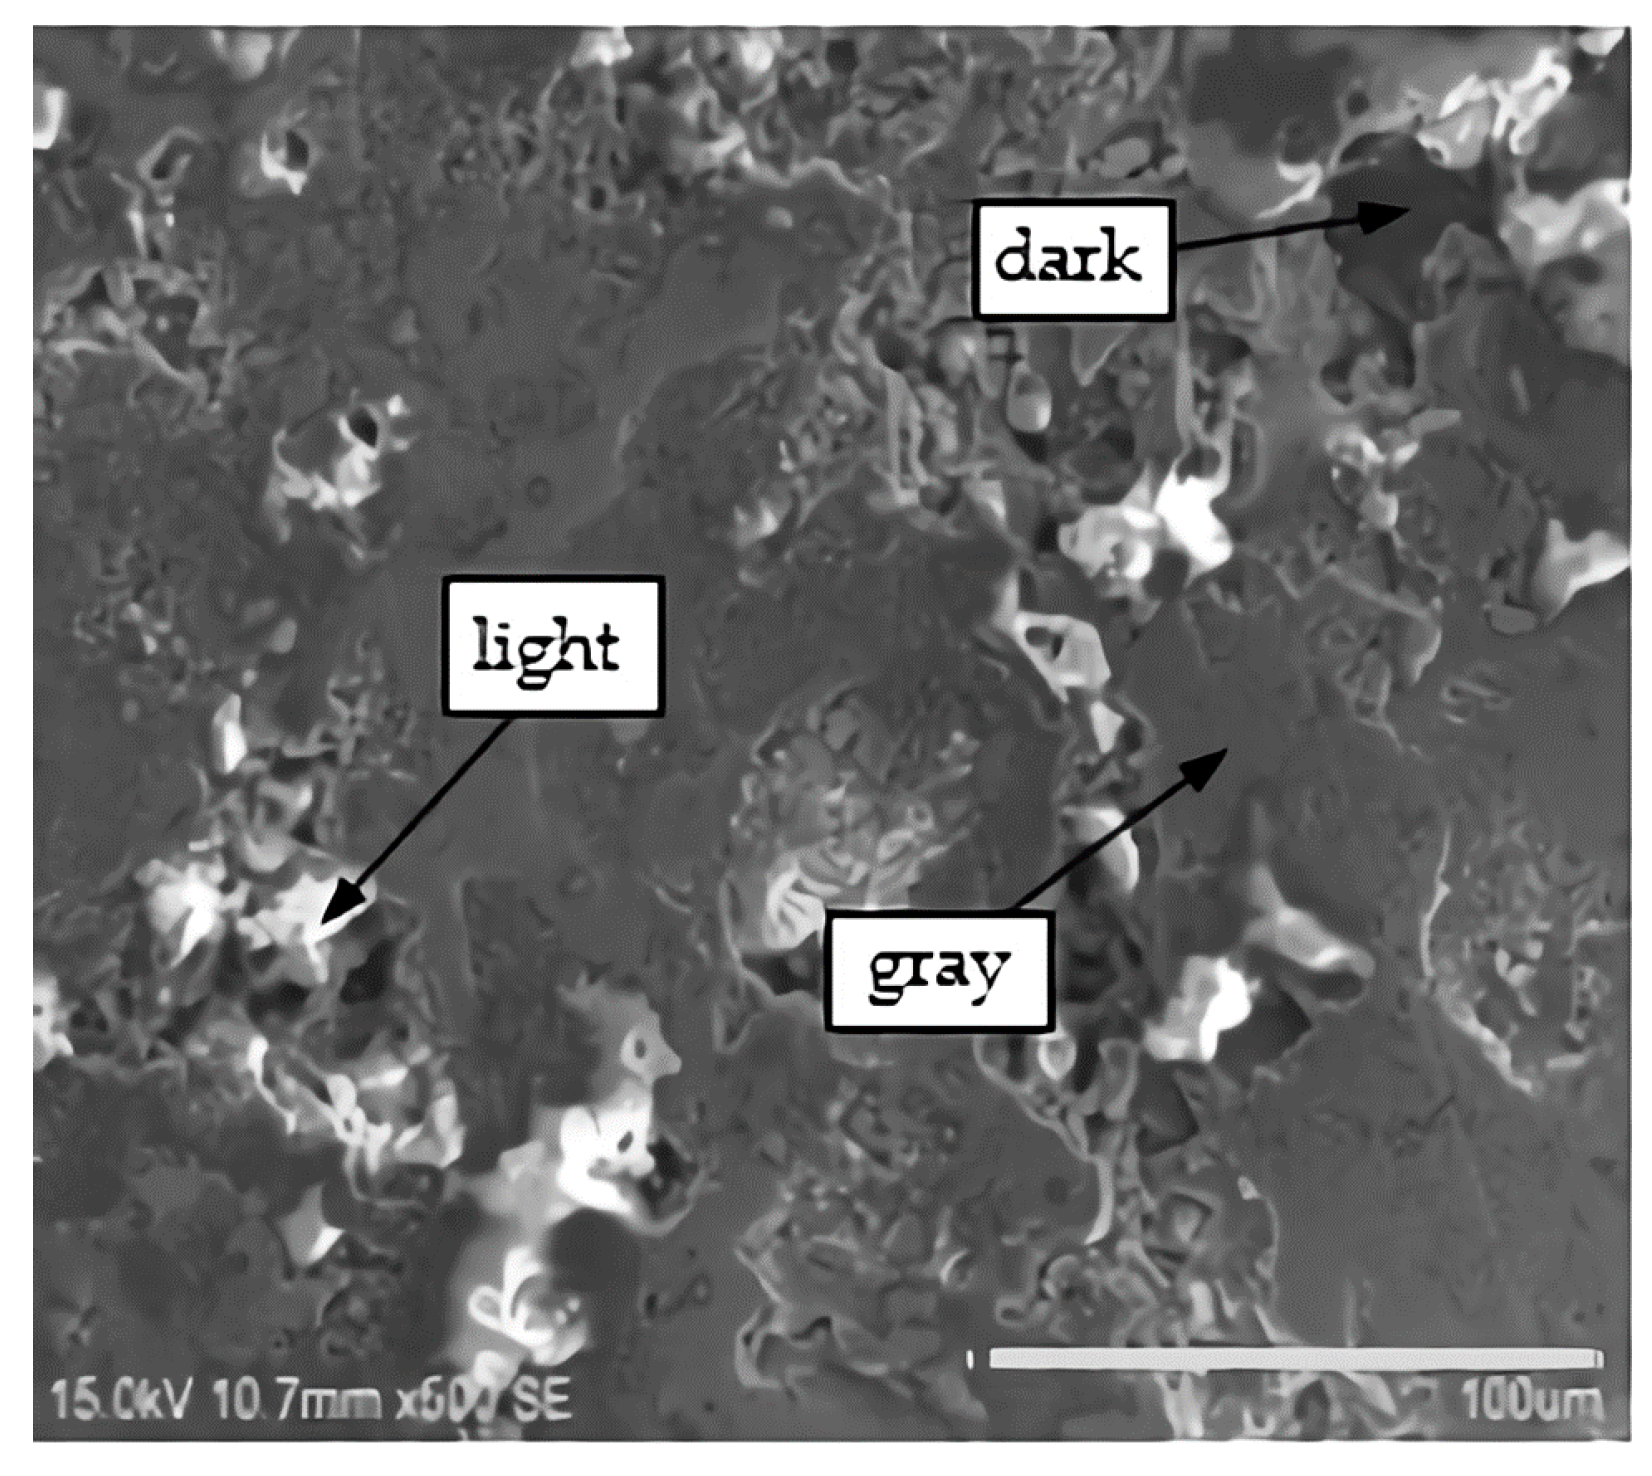
Figure 9.
The SEM images of the coating surface with corresponding energy-dispersive X-ray spectroscopy (EDS) spectra: (a) light region; (b) grey region; (c) dark region.
Figure 9.
The SEM images of the coating surface with corresponding energy-dispersive X-ray spectroscopy (EDS) spectra: (a) light region; (b) grey region; (c) dark region.
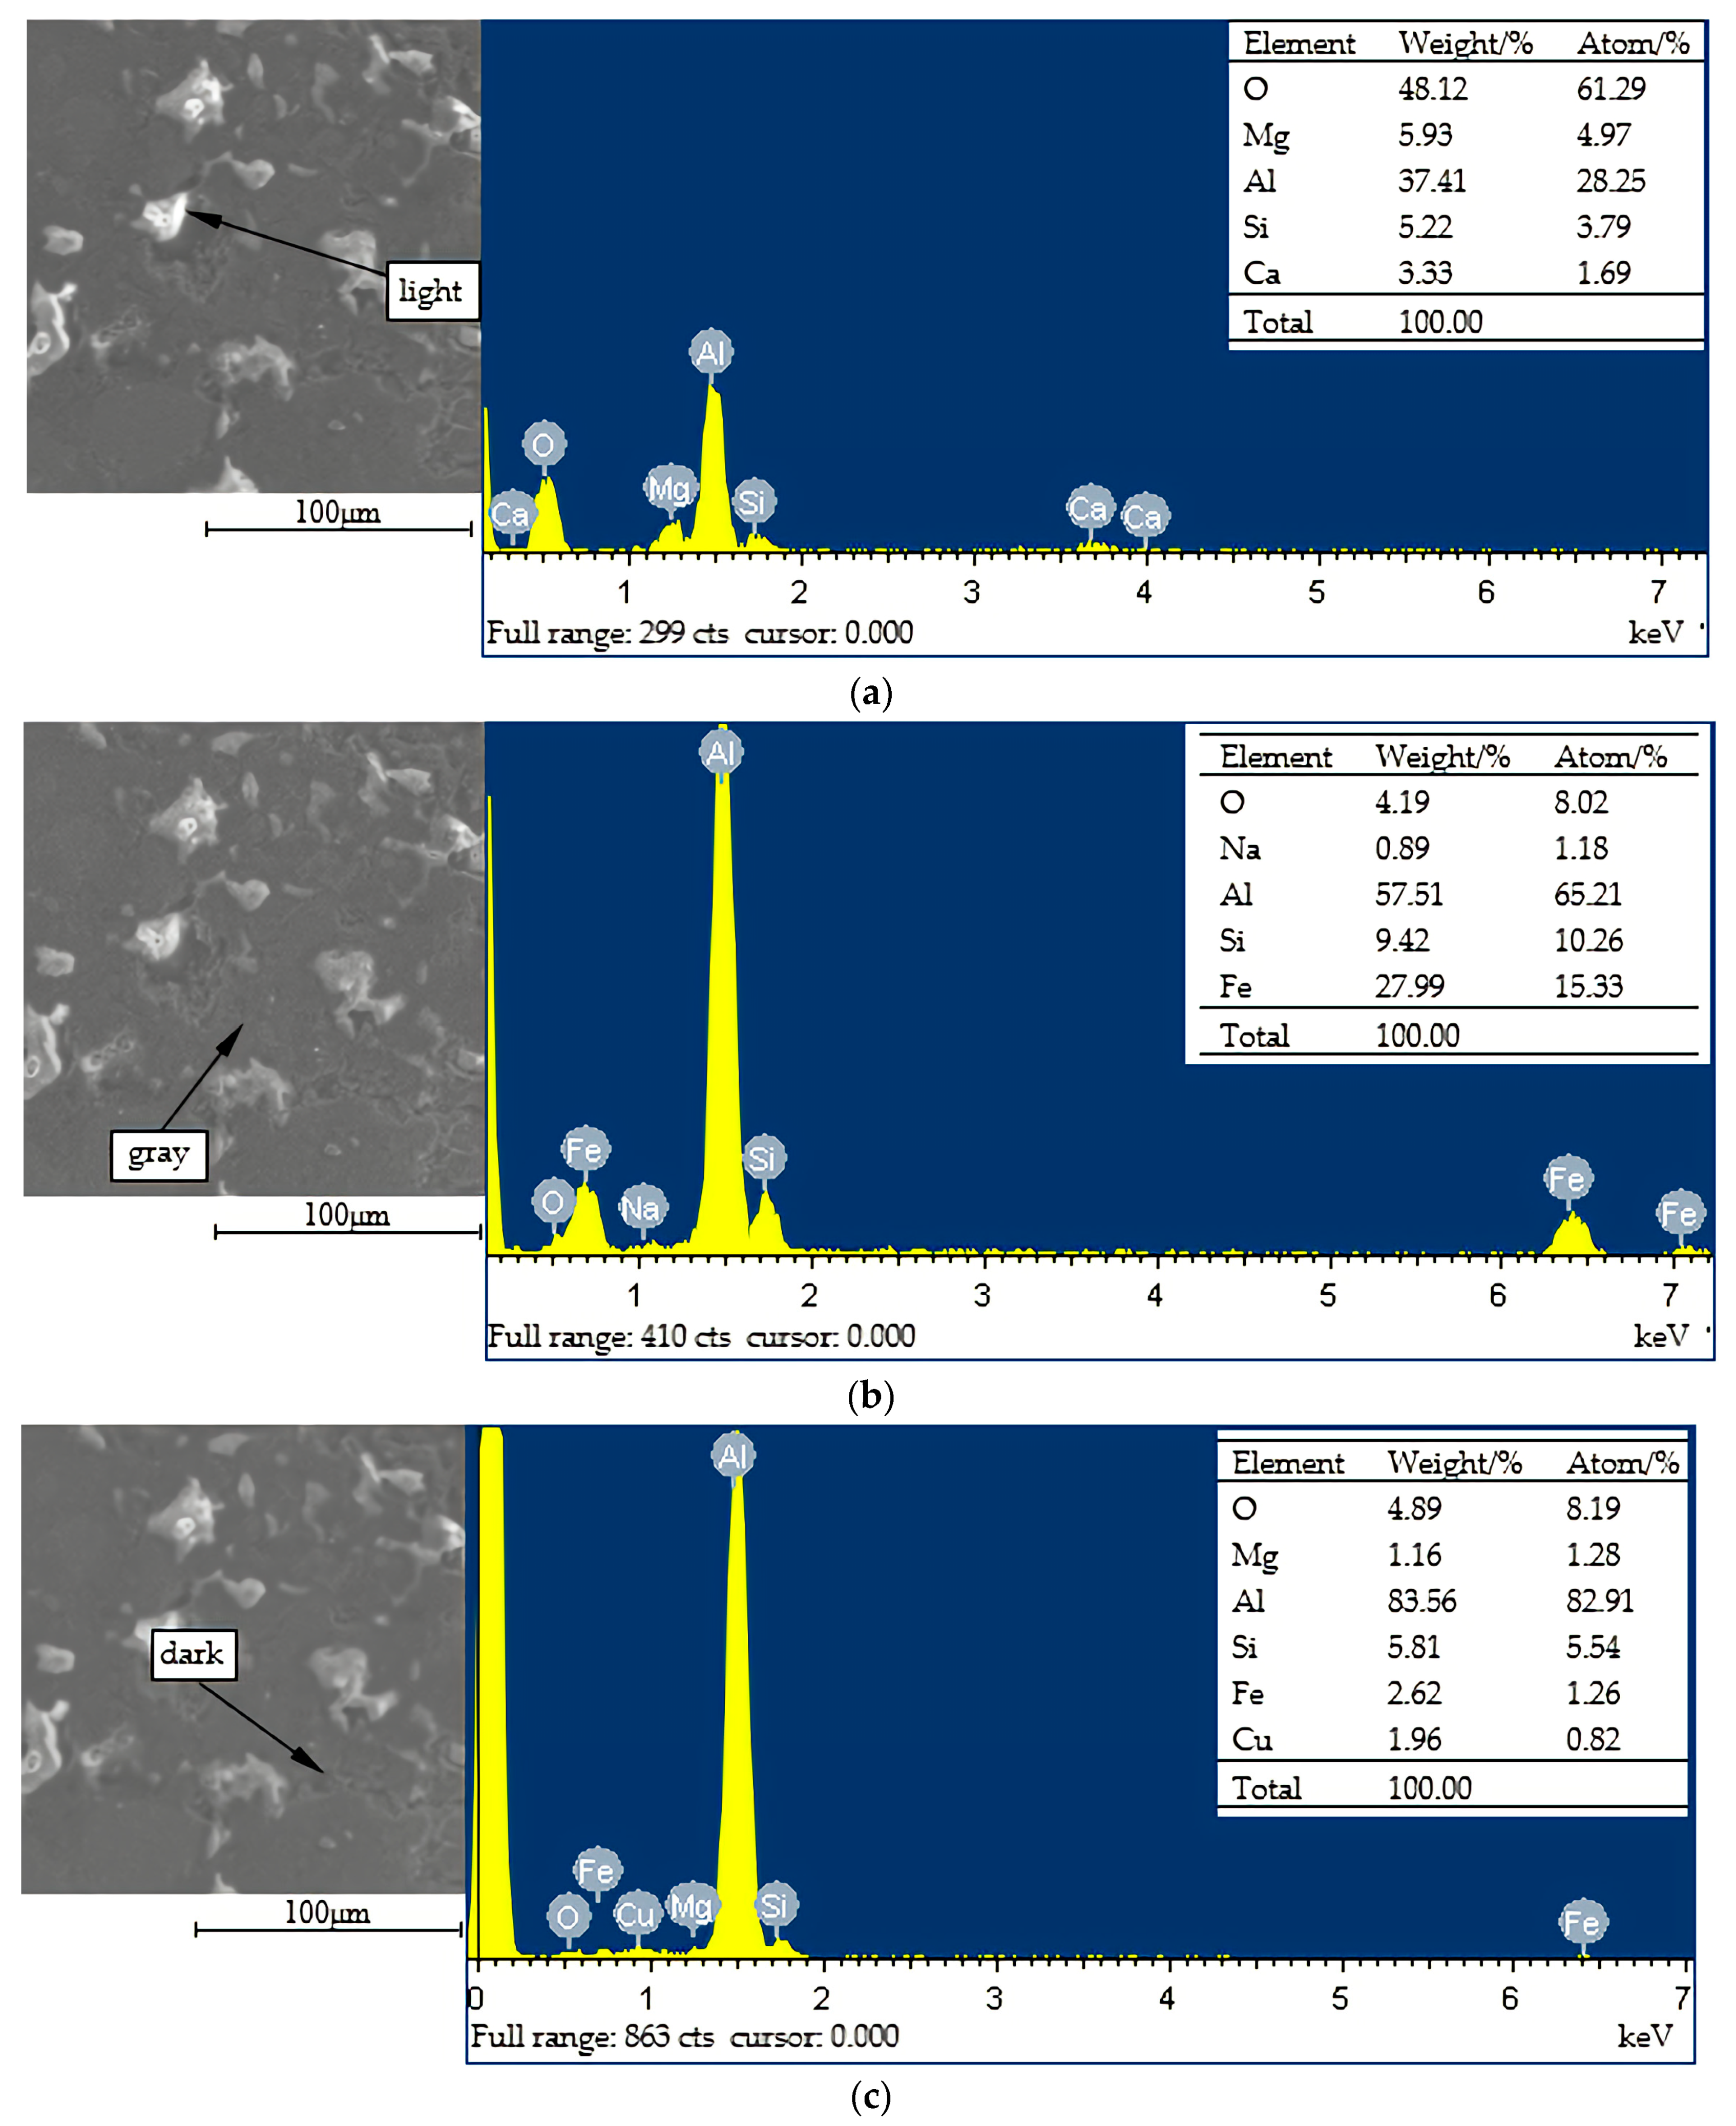
Figure 10.
XRD analysis results of original aluminum ash coating (OAAC).

Table 1.
Chemical components of the original aluminum ash (OAA).
| Element | Al | Fe | Ca | Cu | Si | Ti | Zn | Cl | Mn | Others |
| Wt.% | 61.802 | 13.301 | 4.372 | 2.167 | 10.143 | 0.986 | 0.743 | 1.137 | 1.661 | 3.688 |
Table 2.
Phases composition of OAA.
| Molecular Formula | Al | Al2O3 | AlN | AlO(OH) | SiO2 | Others |
| Semi-Quantitative (%) | 21 ± 3 | 5 ± 2 | 44 ± 3 | 7 ± 2 | 1 | 22 ± 3 |
Table 3.
Spray process parameters of bonding layer.
| Powder | Spray Voltage/V | Spray Current/A | Powder Flow Rate/g·min−1 | Main Gas Flow/slpm |
|---|---|---|---|---|
| Al/Ni | 55 | 550 | 24 | 33 |
Table 4.
The factors and their levels for L9 (34) orthogonal test.
| Levels | Factors | |||
|---|---|---|---|---|
| A Spray Voltage/V | B Spray Current/A | C Powder Flow Rate/g·min−1 | D Main Gas Flow/slpm | |
| 1 | 50 | 500 | 22 | 30 |
| 2 | 55 | 550 | 24 | 33 |
| 3 | 60 | 600 | 26 | 36 |
Table 5.
The X-ray fluorescence (XRF) analysis results of OAASP.
| Element | Al | Fe | Ca | Cu | Si | Cl | Ti | Zn | Others |
| Wt.% | 62.51 | 13.32 | 4.57 | 2.36 | 10.17 | 1.45 | 1.12 | 0.85 | 3.65 |
Table 6.
Orthogonal test results.
| No. | A | B | C | D | Microhardness/HV | Porosity/% | Abrasion Rate 10−3 g/min | Adhesive Strength/MPa | Comprehensive Score | |
|---|---|---|---|---|---|---|---|---|---|---|
| O1 | 1 | 1 | 1 | 1 | 104.95 | 0.14 | 29.76 | 11 | −59.82 | |
| O2 | 1 | 2 | 2 | 2 | 372.99 | 0.16 | 10.98 | 13 | −29.28 | |
| O3 | 1 | 3 | 3 | 3 | 391.61 | 0.16 | 16.85 | 4 | −28.08 | |
| O4 | 2 | 1 | 2 | 3 | 390.97 | 0.15 | 17.89 | 6 | −46.64 | |
| O5 | 2 | 2 | 3 | 1 | 655.23 | 0.21 | 9.76 | 10 | −39.39 | |
| O6 | 2 | 3 | 1 | 2 | 605.75 | 0.16 | 8.78 | 16 | −10.94 | |
| O7 | 3 | 1 | 3 | 2 | 611.02 | 0.19 | 20.27 | 16 | −35.12 | |
| O8 | 3 | 2 | 1 | 3 | 689.81 | 0.14 | 23.08 | 17 | −15.32 | |
| O9 | 3 | 3 | 2 | 1 | 624.44 | 0.15 | 12.40 | 12 | −18.58 | |
| k1 | −117.18 | −141.59 | −86.09 | −117.80 | – | |||||
| k2 | −96.97 | −84.00 | −94.50 | −75.35 | ||||||
| k3 | −69.03 | −57.60 | −102.59 | −90.04 | ||||||
| R | 48.16 | 83.99 | 16.50 | 42.44 | ||||||
| Factors primary to secondary | B > A > D > C | |||||||||
| Preferred scheme | B3A3D2C1 | |||||||||
Table 7.
The performance of coating prepared under preferred parameters.
| Spray Voltage/V | Spray Current/A | Powder Flow Rate/g·min−1 | Main Gas Flow/slpm | Micro Hardness/HV | Porosity/% | Abrasion Rate 10−3 g/min | Adhesive Strength/MPa |
|---|---|---|---|---|---|---|---|
| 60 | 600 | 22 | 33 | 606.54 | 0.16 | 12.86 | 16 |
Table 8.
Proportion of alumina in spray powder.
| Samples | OAASP/% | Al2O3/% |
|---|---|---|
| H0 | 100 | 0 |
| H10 | 90 | 10 |
| H20 | 80 | 20 |
| H30 | 70 | 30 |
| H40 | 60 | 40 |
| H50 | 50 | 50 |
Table 9.
Performance test results of OAAC with different ratios of Al2O3.
| Samples | Microhardness/HV | Porosity/% | Abrasion Rate 10−3 g/min | Adhesive Strength/MPa |
|---|---|---|---|---|
| H0 | 606.54 | 0.163 | 12.86 | 16.25 |
| H10 | 625.32 | 0.158 | 12.33 | 16.52 |
| H20 | 648.64 | 0.153 | 11.84 | 16.73 |
| H30 | 667.74 | 0.147 | 11.39 | 16.82 |
| H40 | 681.97 | 0.139 | 10.87 | 16.90 |
| H50 | 713.36 | 0.131 | 10.31 | 17.12 |
| H100 | 950–1000 | 0.1–0.12 | 7–7.5 | 20–25 |
© 2019 by the authors. Licensee MDPI, Basel, Switzerland. This article is an open access article distributed under the terms and conditions of the Creative Commons Attribution (CC BY) license (http://creativecommons.org/licenses/by/4.0/).
Share and Cite
MDPI and ACS Style
Ni, H.; Zhang, J.; Lv, S.; Wang, X.; Zhu, Y.; Gu, T. Preparation and Performance Optimization of Original Aluminum Ash Coating Based on Plasma Spraying. Coatings 2019, 9, 770. https://doi.org/10.3390/coatings9110770
AMA Style
Ni H, Zhang J, Lv S, Wang X, Zhu Y, Gu T. Preparation and Performance Optimization of Original Aluminum Ash Coating Based on Plasma Spraying. Coatings. 2019; 9(11):770. https://doi.org/10.3390/coatings9110770
Chicago/Turabian StyleNi, Hongjun, Jiaqiao Zhang, Shuaishuai Lv, Xingxing Wang, Yu Zhu, and Tao Gu. 2019. "Preparation and Performance Optimization of Original Aluminum Ash Coating Based on Plasma Spraying" Coatings 9, no. 11: 770. https://doi.org/10.3390/coatings9110770
Note that from the first issue of 2016, this journal uses article numbers instead of page numbers. See further details here.