Article

Formation Process of an LDHs Coating on Magnesium Alloy by a CO2 Pressurization Method

1
College of Materials Science and Chemical Engineering, Harbin Engineering University, Harbin 150001, China
2
College of Materials Chemical and Engineering, Heilongjiang Institute of Technology, Harbin 150050, China
3
Department of Research and Development, Avic Harbin Bearing Co. LTD, Harbin 150000, China
4
Institute of Metal Research, Chinese Academy of Sciences, Shenyang 110016, China
5
School of Mechanical Engineering, Changzhou University, Changzhou 213164, China
6
Corrosion and Protection Division, Shenyang National Laboratory for Materials Science, Northeastern University, Shenyang 110819, China
*
Author to whom correspondence should be addressed.
Coatings 2019, 9(1), 47; https://doi.org/10.3390/coatings9010047
Submission received: 29 November 2018 / Revised: 1 January 2019 / Accepted: 14 January 2019 / Published: 15 January 2019

Abstract

:
The formation process of LDHs (layered double hydroxides) coating on magnesium alloy by the CO2 pressurization method was studied. The micro-structure was observed by OM, SEM and GAXRD. The weighted gain curve, apparent activation energy, and CO2 solubility curve were all calculated by equations. The potentiodynamic polarization curve, hydrogen evolution data, and immersion were analyzed by an electrochemical method. The results show that the LDHs coating was formed layer-by-layer. The formation positions were initially on the α-Mg phase, and then on the β-Mg17Al12 phase. It was found to be the most compact after 30 min. The LDHs coating began to appear to have severe cracks and holes over time. The formation process of the LDHs coating can be divided into three stages: a rapid growth stage (0–10 min), slow growth stage (10–20 min), and periodic growth stage (30 min, 1 h). The apparent activation energies in each of the three stages are 21.78, 31.86 and 34.92 kJ mol−1, respectively. The LDHs coating has a compact micro-structure and better anti-corrosion at a pressure of 3 MPa, a temperature of 50 °C and a time of 30 min. The CO2 pressurization promotes a formation reaction rate and achieves a high formation efficiency and good formation stability under the condition of zero pollution.

1. Introduction

Magnesium alloys have extensive development potential in areas such as automobile, aerospace, electronics, medical treatment, and so on. The reason for this attention is due to the excellent performance of magnesium alloys, includes low-density, highly specific strength and stiffness, high-performance thermal conductivity and conductance, as well as excellent biological properties and easy-recycling properties [1]. However, magnesium alloy has poor powers of corrosion resistance. On the one hand, a porous oxide/hydroxide film formed on the surface of the magnesium alloys is unable to protect it from corrosion; on the other hand, the galvanic corrosion tends to be formed in the potential differences of the second, impurity and base phases. In addition, stress corrosion or fatigue, caused by residual internal stress, can accelerate the corrosion of magnesium alloys. The potential engineering applications of magnesium alloy are thus hindered, due to this poor corrosion resistance [2,3,4,5].
At present, there are two main approaches towards improving the corrosion resistance of magnesium alloy. One is to adjust the composition of magnesium alloys so as to prepare high-purity magnesium alloys [6,7], rare earth magnesium alloys [8,9,10,11], and to strengthen the corrosion resistance of the matrix. This material preparation method often requires a complex composition and high costs. Furthermore, alloying may also have a negative effect on its mechanical properties as well as its formability [12,13,14,15,16]. Therefore, surface treatment has so far been one of the most effective and convenient ways for improving corrosion resistance. Common surface treatments of magnesium alloys include micro-arc/anodizing, electroplating/electroless plating, laser surface treatment, chemical conversion treatment, organic coating treatment, surface infiltration treatment, and ion implantation [17,18,19]. Therein, chemical conversion treatment has been widely applied, due to its properties of low-energy consumption, low cost, simple equipment and easy operation. There are two main chemical conversion treatments, namely chromate and non-chromate treatment. Although chromate chemical conversion treatment has a high-performing corrosion resistance for magnesium alloys, hexavalent chromium (Cr6+) has been gradually banned, since it is toxic and harmful for the environment; hence the development of new ways towards chromium-free chemical conversion treatments [20,21,22]. Chromium-free acid salt treatment includes: phosphate conversion coating [23,24], phosphate-permanganate conversion coating [25,26,27], stannate conversion coating [28,29], vanadate conversion coating [30,31], cerium conversion coating [32,33], lanthanide conversion coating [34], hydrotalcite surface coating, and so forth [35,36]. Hydrotalcite coating has attracted much attention, due to its unique intercalation structure and its environmentally friendly properties [37,38,39,40,41,42,43,44,45,46,47,48,49,50]. Uan et al. [37,38,39,40,41,42,43] has conducted some research on hydrotalcite coatings prepared on magnesium alloys, by adopting a one-step method. Mg–Al–hydrotalcite layered double hydroxides (LDH) coatings were prepared by letting the carbonate/bicarbonate solutions stand at 50 °C for 24 h. Based on previous research, Uan adopted a two-step method by a 2 h CO2 and pH 11.5 treatment, to modify the chemical technique. It was found that the formation effect was improved by adjusting the PH value. However, the time was found to be relatively long, with a complex treatment process. Chen et al. [44,45,46,47,48] studied the preparation of Mg–Al hydrotalcite coatings on AZ31 Mg alloys, by a two-step method. The precursor film had cracks in the initial formation, with the LDH conversion coatings then forming densely and compactly. Although the processing time was shortened to two hours, the formation process was still relatively complex. Zhang et al. [49,50] put forward ion exchange and corrosion resistance properties by preparing MgAl–LDH coatings on Mg and Al alloys. There are three main shortcomings of the traditional methods in the preparation of hydrotalcite conversion coatings: a long preparation time is not conducive to the application of continuous industrial production; the introduction of carbonate into carbonate solution artificially requires frequent replenishment or replacement of the solution to maintain the concentration of the carbonate ions, requiring a lot of labor; the formation process is difficult to control. Therefore, solving the three aforementioned issues is the key to improving research on hydrotalcite coating surface treatment.
For this paper, the CO2 pressurization method was used to prepare the LDH coating on magnesium alloy. The formation process of the LDHs coating was found by analyzing the micro-structure, the weighted gain curve, the apparent activation energy, and the anti-corrosion properties of the LDHs coating. It was found that CO2 pressurization promotes the solubility of CO2 in increasing the aqueous solution, which promotes the formation reaction and stability of the LDHs coating. The LDHs coating was prepared with a pressure of 3 MPa, a temperature of 50 °C, and a time of 30 min, where it was found to have a compact micro-structure and better anti-corrosion properties. The CO2 pressurization method achieved a high formation efficiency, good formation stability, and zero pollution.

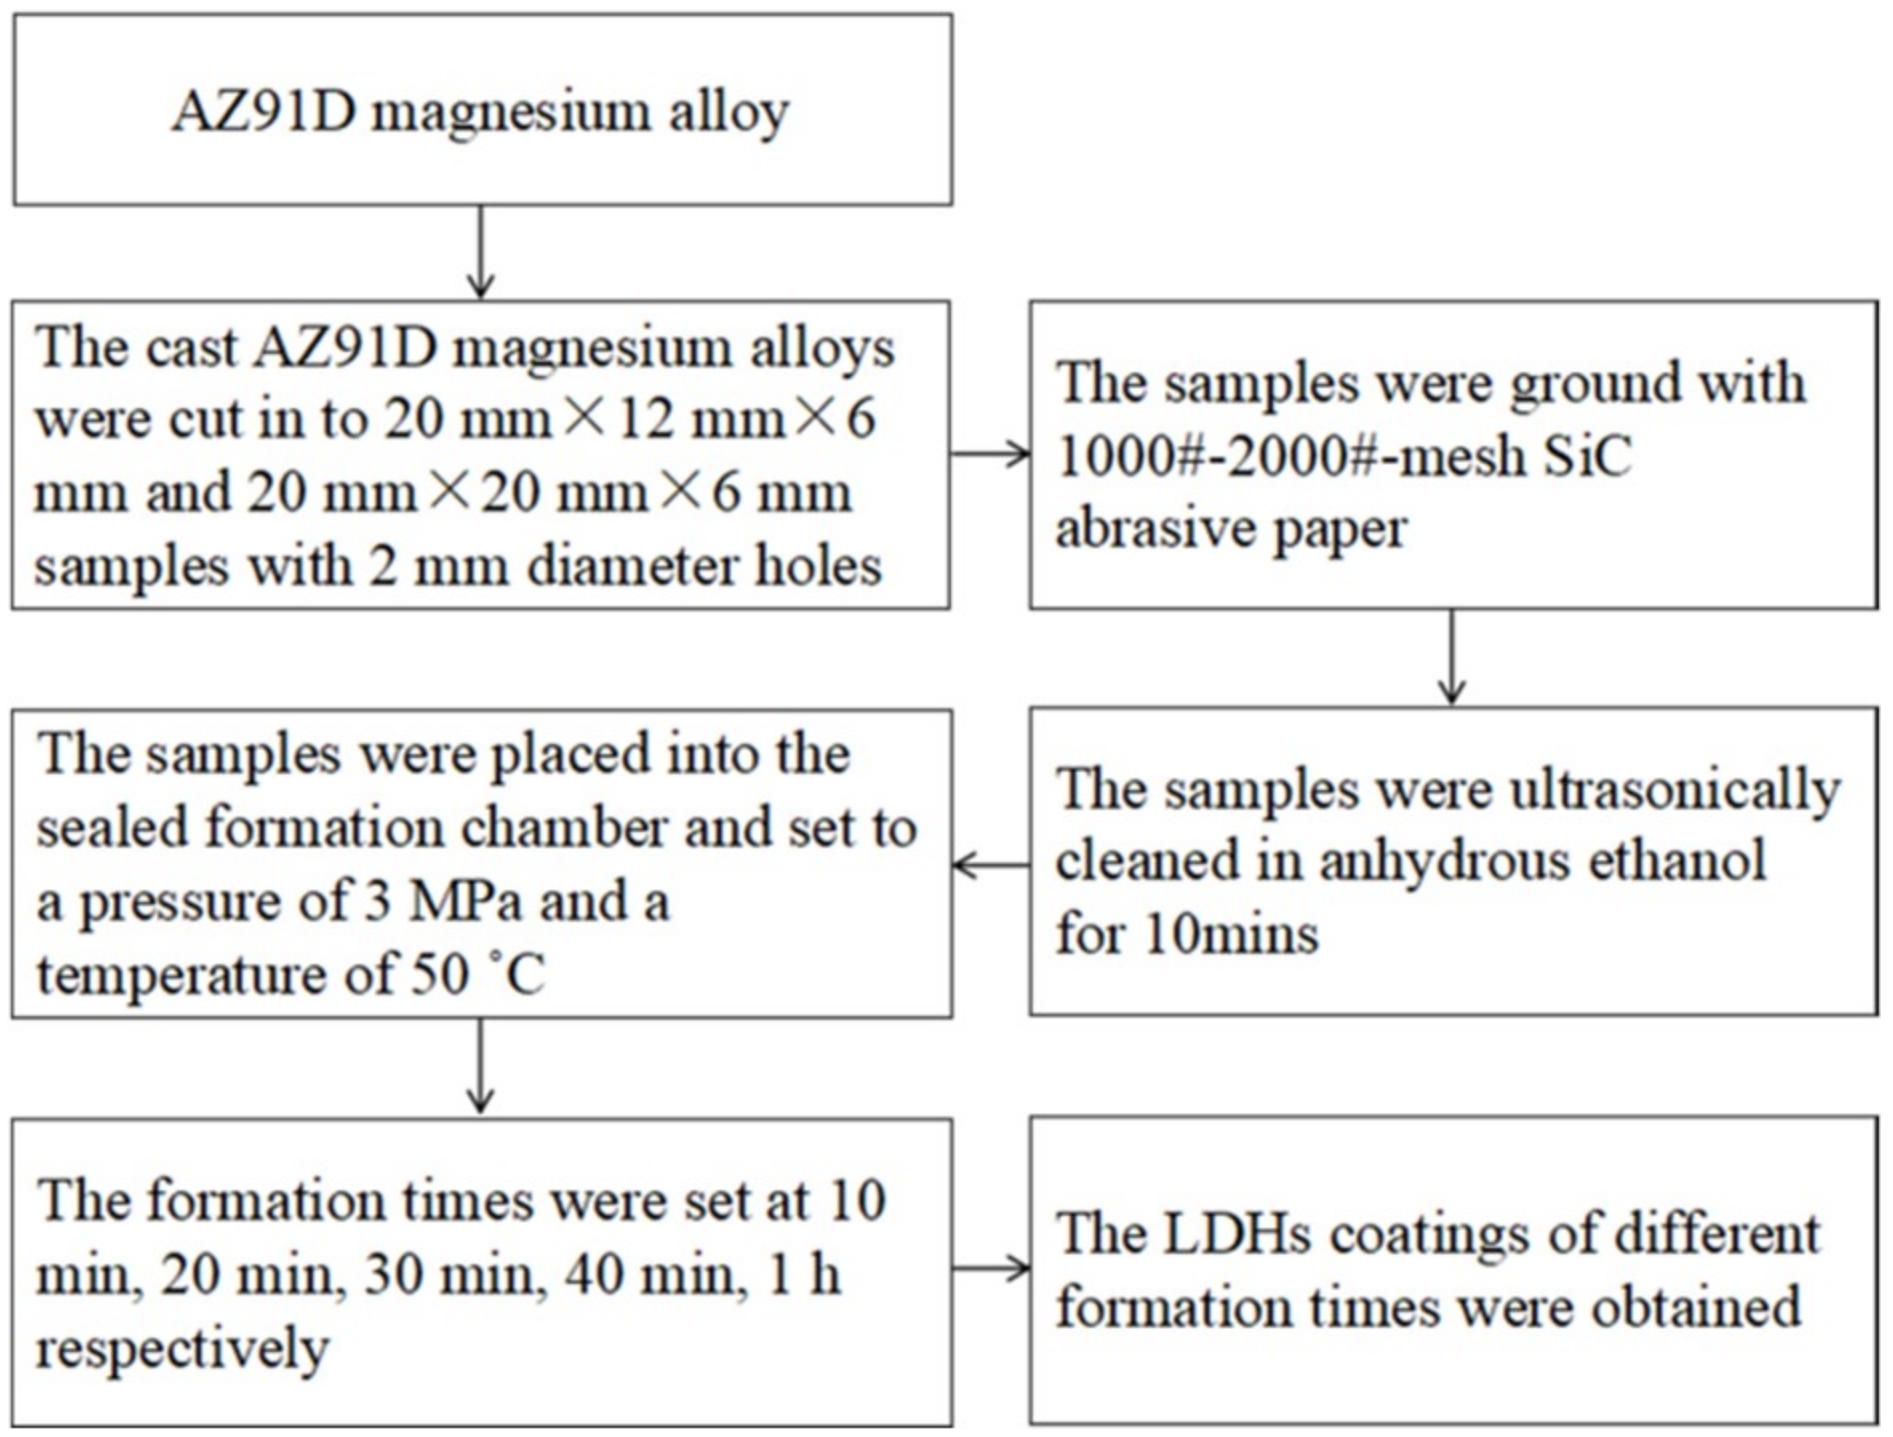
2. Materials and Methods

The composition percentage of the cast AZ91 magnesium alloy was 8.8 wt % Al, 0.69 wt % Zn, 0.212 wt % Mn, 0.02 wt % Si, 0.002 wt % Cu, 0.005 wt % Fe, and 0.001 wt % Ni. Cast AZ91 alloys were used in our experiment. The cast AZ91D magnesium alloys were cut into 20 mm × 12 mm × 6 mm, and 20 mm × 20 mm × 6 mm samples, with 2 mm diameter holes. The samples were ground with #1000–#2000-mesh SiC abrasive paper, and ultrasonically cleaned in anhydrous ethanol for 10 min.
CO2 was introduced in deionized water with a flow rate of 1 dm3·min−1 for 20 min, in order to form the CO32−/HCO3 ion solution. The pH of the bath was approximately 4.3 [37,38]. The 12 samples were placed into the sealed formation chamber, and then pressurized to 3 MPa by constantly pumping CO2 gas. The formation temperature was set at 50 °C, and the formation time was controlled at 10, 20, 30, 40 min and 1 h, respectively. The operation of the LDHs coating preparation is shown in Figure 1.
The morphology and composition of the LDHs coating were analyzed by a scanning electron microscope (SEM) Sigma-500 (Carl Zeiss, Jena, Germany) and grazing angle XRD D8-Discover (GAXRD, Bruker, Stuttgart, Germany) at Cu Kα1 (1.5405 Å), respectively. The GAXRD is mainly used to determine the diffraction peak of thin film specimens, with the grazing angle θs set within parameters of 5°, and by using small angle accessories to determine the diffraction peak of the sample. The grazing angle used in this experiment was 0.5°.
The weighted gain curve was calculated by using the following method. The samples were weighed by the analytical balance, with it before the treatment being denoted as W0. Then, the LDHs coatings were weighed at different periods of processing time, denoted as W′. The per-unit mass variation of the coating was denoted as (WW0)/S, which is (ΔW/S). The size of S for the coating was calculated by accurately measurements. The weighted gain curve can be obtained by the mass variation of the coatings and processing time. The CO2 solubility in deionized water was calculated by the equation of the state from BWRS [51], which has been widely applied with high accuracy.
The Tafel line in 3.5% NaCl solution was tested by adopting the software 263A M352, based on the Princeton model. A three-electrode system was applied, with a saturated potassium chloride electrode as the reference electrode, the platinum electrode as the supplementary electrode, and the samples as the working electrode. Through using the potentiodynamic scanning method, the samples were sealed by using paraffin, and exposed with a size of 10 mm × 10 mm, a scan rate of 0.333 mV s−1. The corrosion rate was obtained by collecting the volume of hydrogen generated from the reaction in the hydrogen-gathering device. The samples were placed in a beaker containing 3.5 wt % NaCl solution, and a water bath pot with a constant temperature (30 ± 1 °C). The immersion test was conducted to determine the corrosion grade of the AZ91D alloy with different times, using the macroscopic corrosion morphologies obtained using a digital camera. For the immersion test, the temperature was set at 30 ± 1 °C.

3. Results

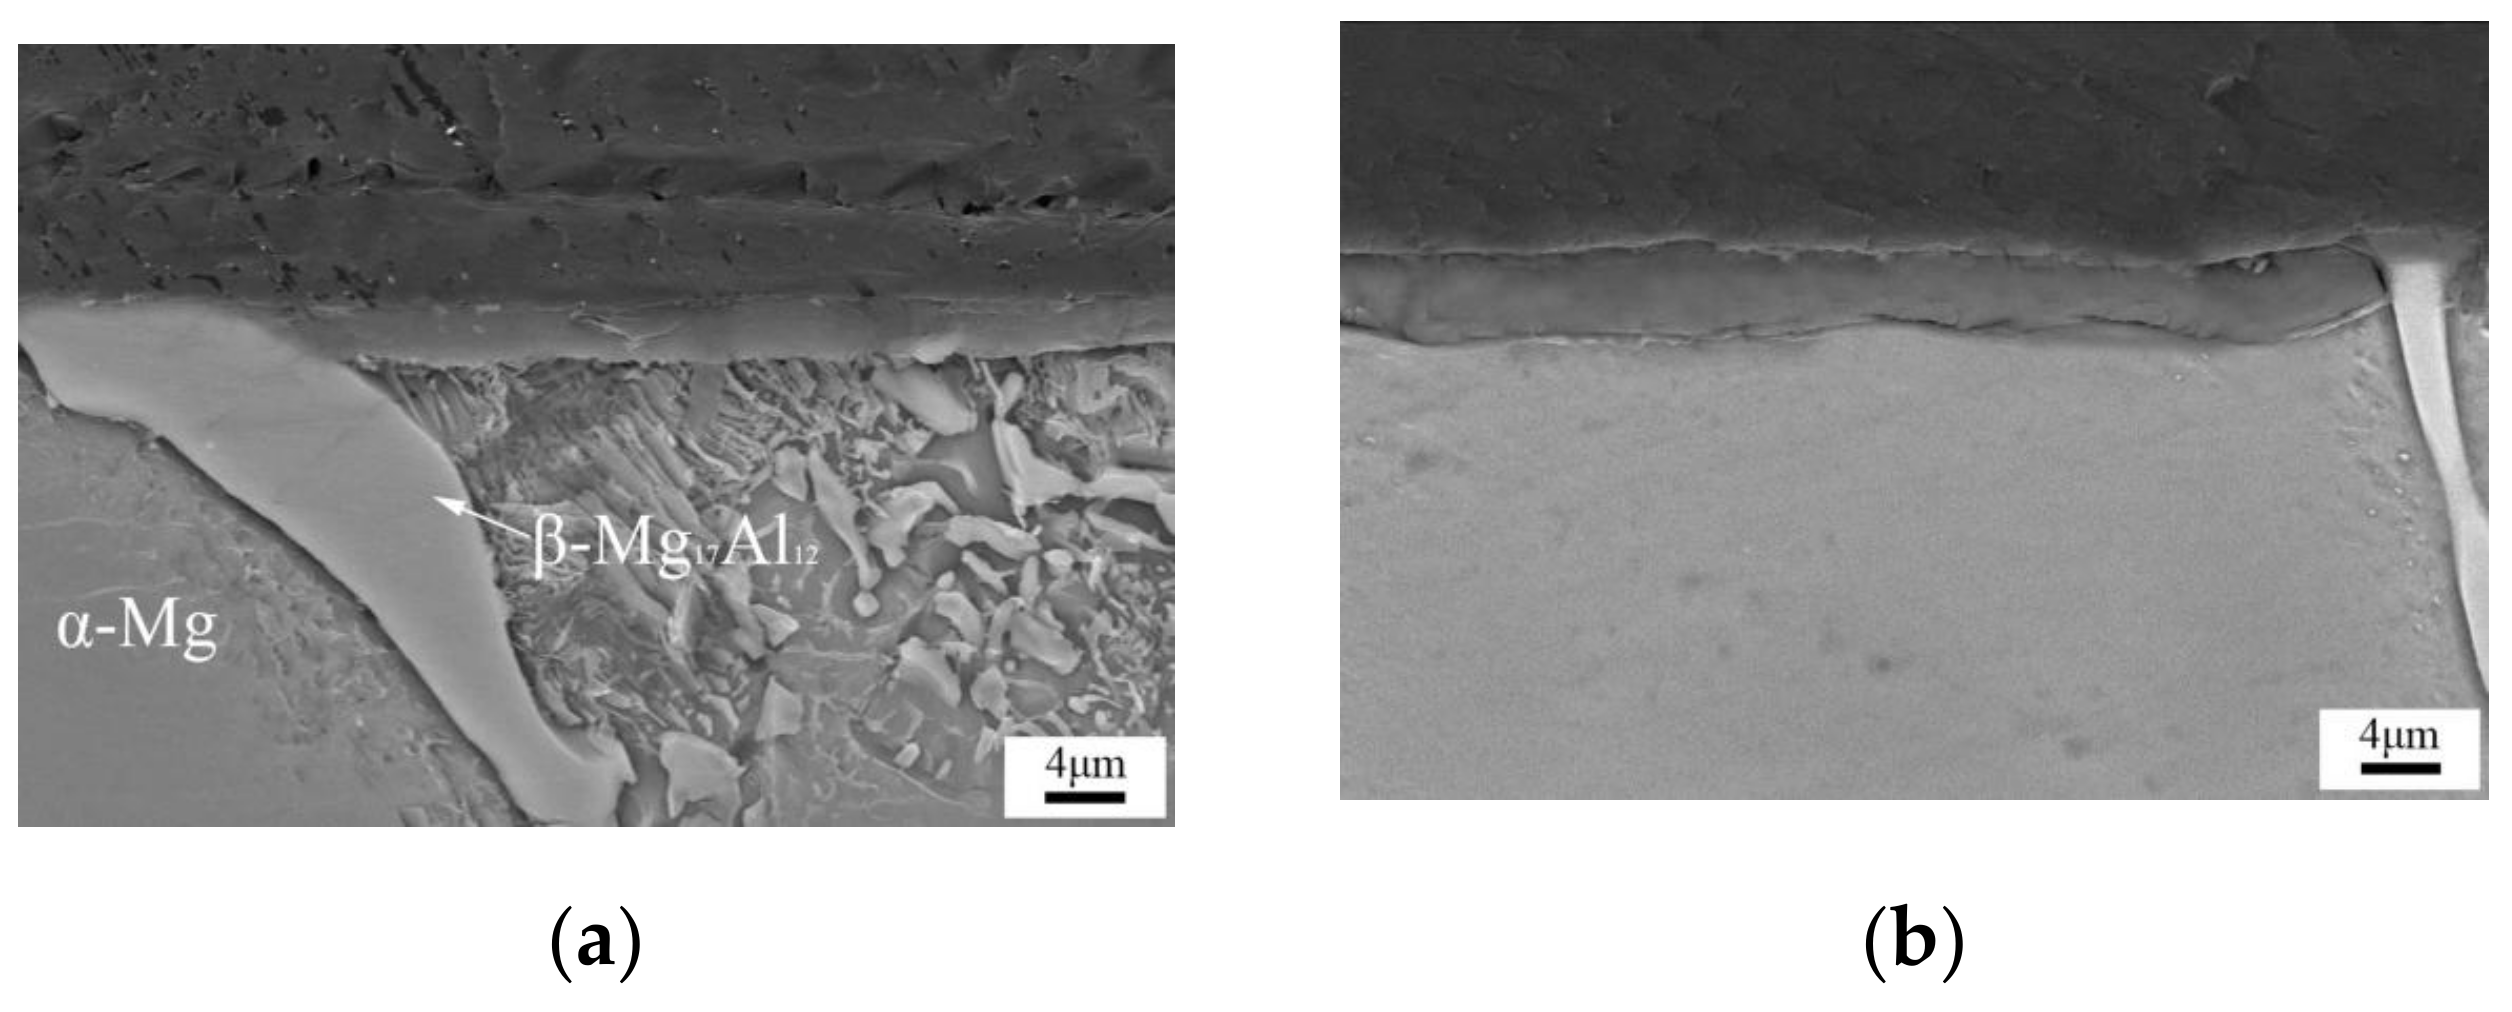
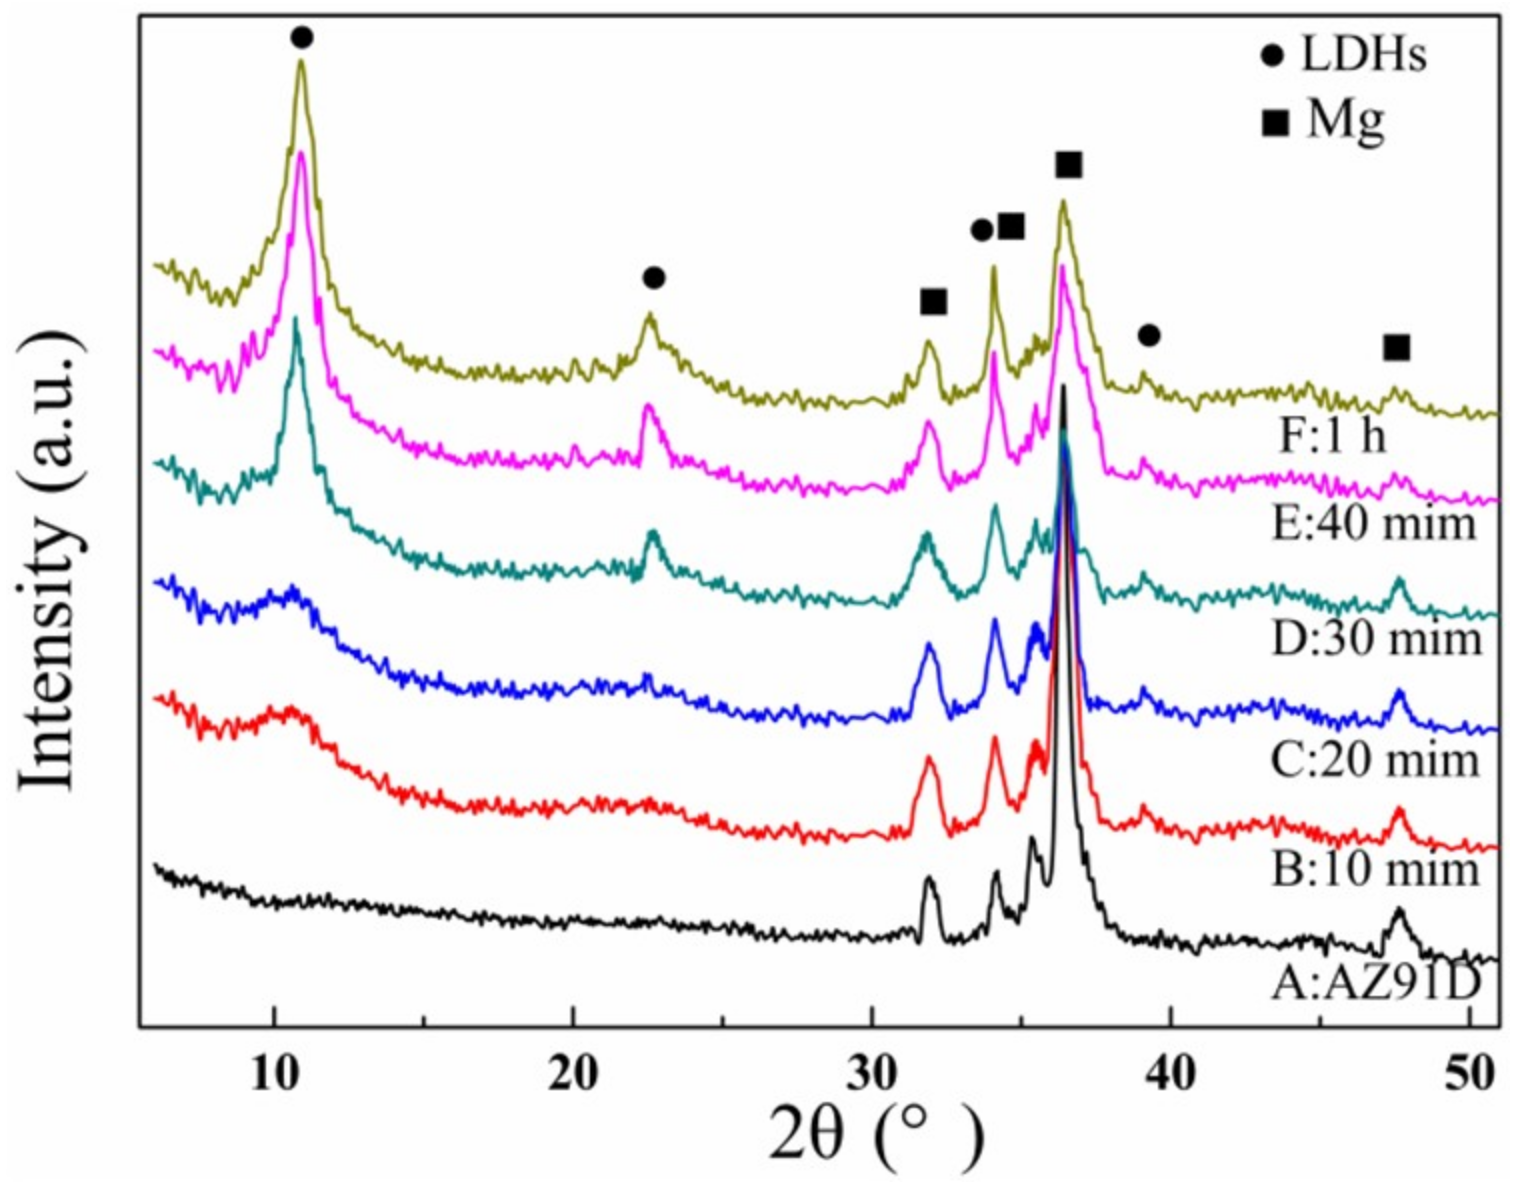
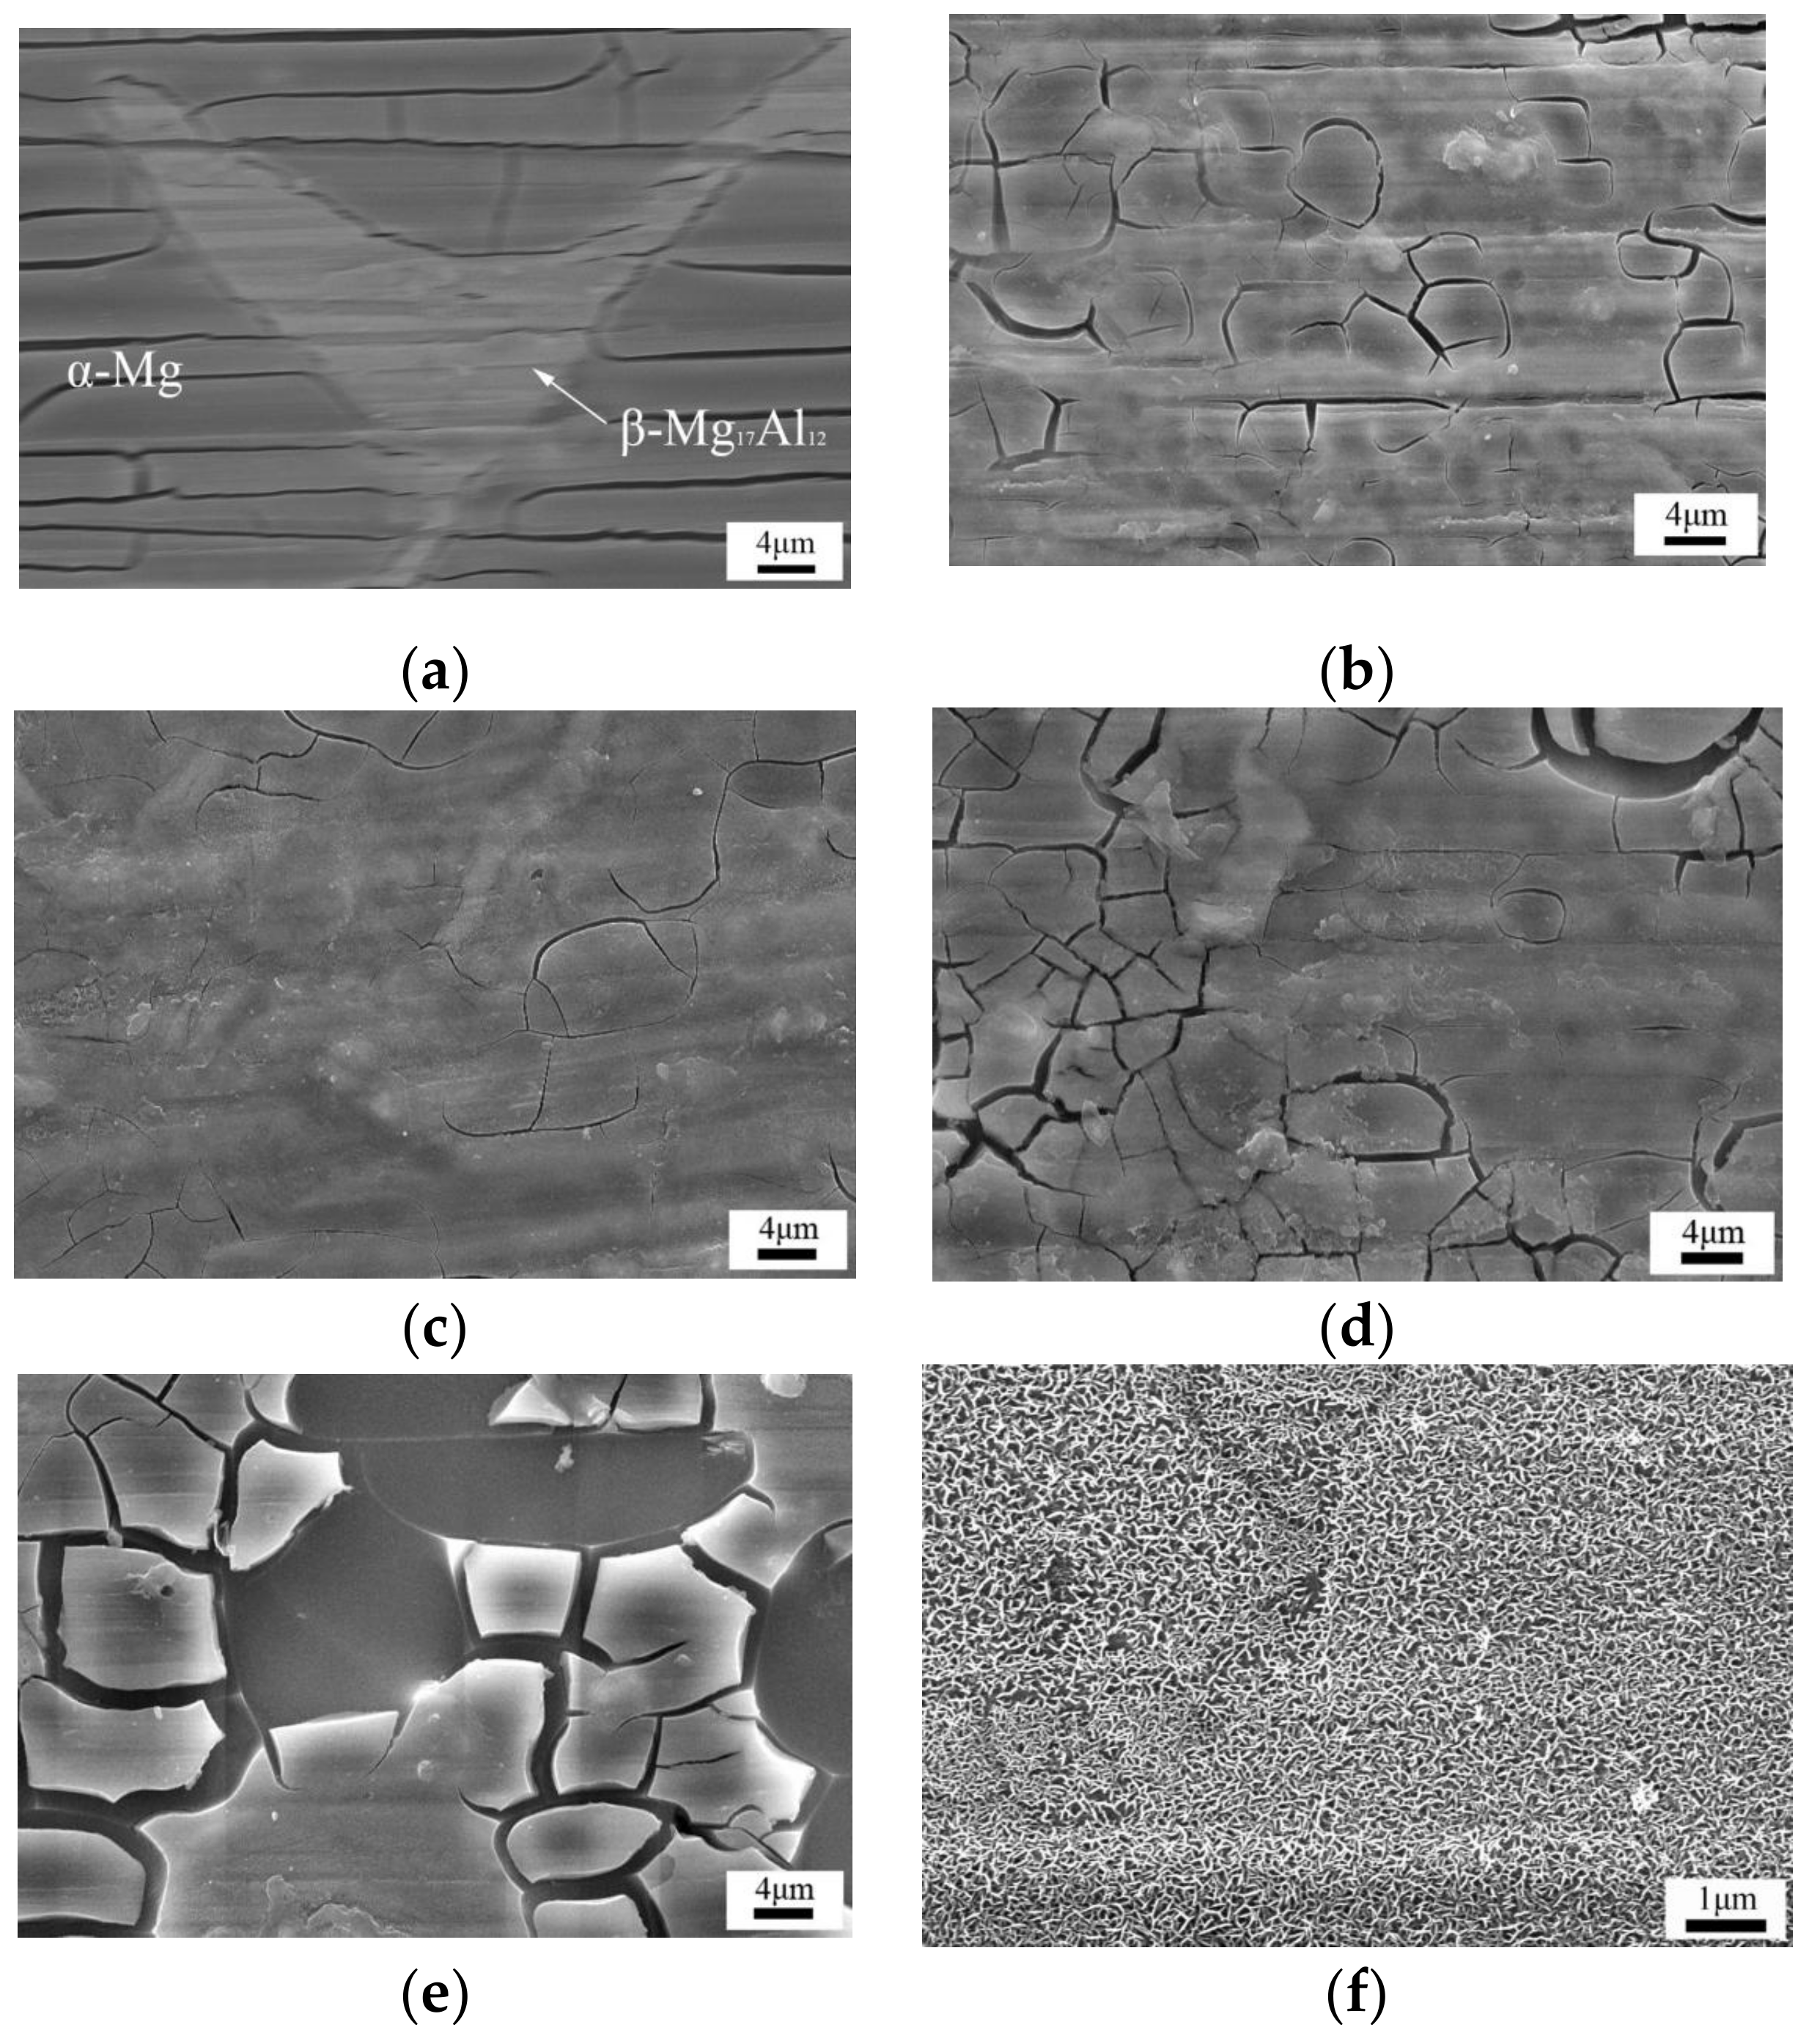
3.1. Micro-Structure

The surface and cross-section morphology of the LDHs coatings at different formation times is shown in Figure 2 and Figure 3, respectively. It can be seen that the formation characteristics of the LDHs coating are closely related to the second phase (β-Mg17Al12). At higher magnification, the petal-like morphology of the LDHs coating was observed in Figure 2f. The dimensions of the LDHs “particles” are about 0.05 μm. The result of the GAXRD patterns of the LDHs coatings at different formation times is shown in Figure 4.

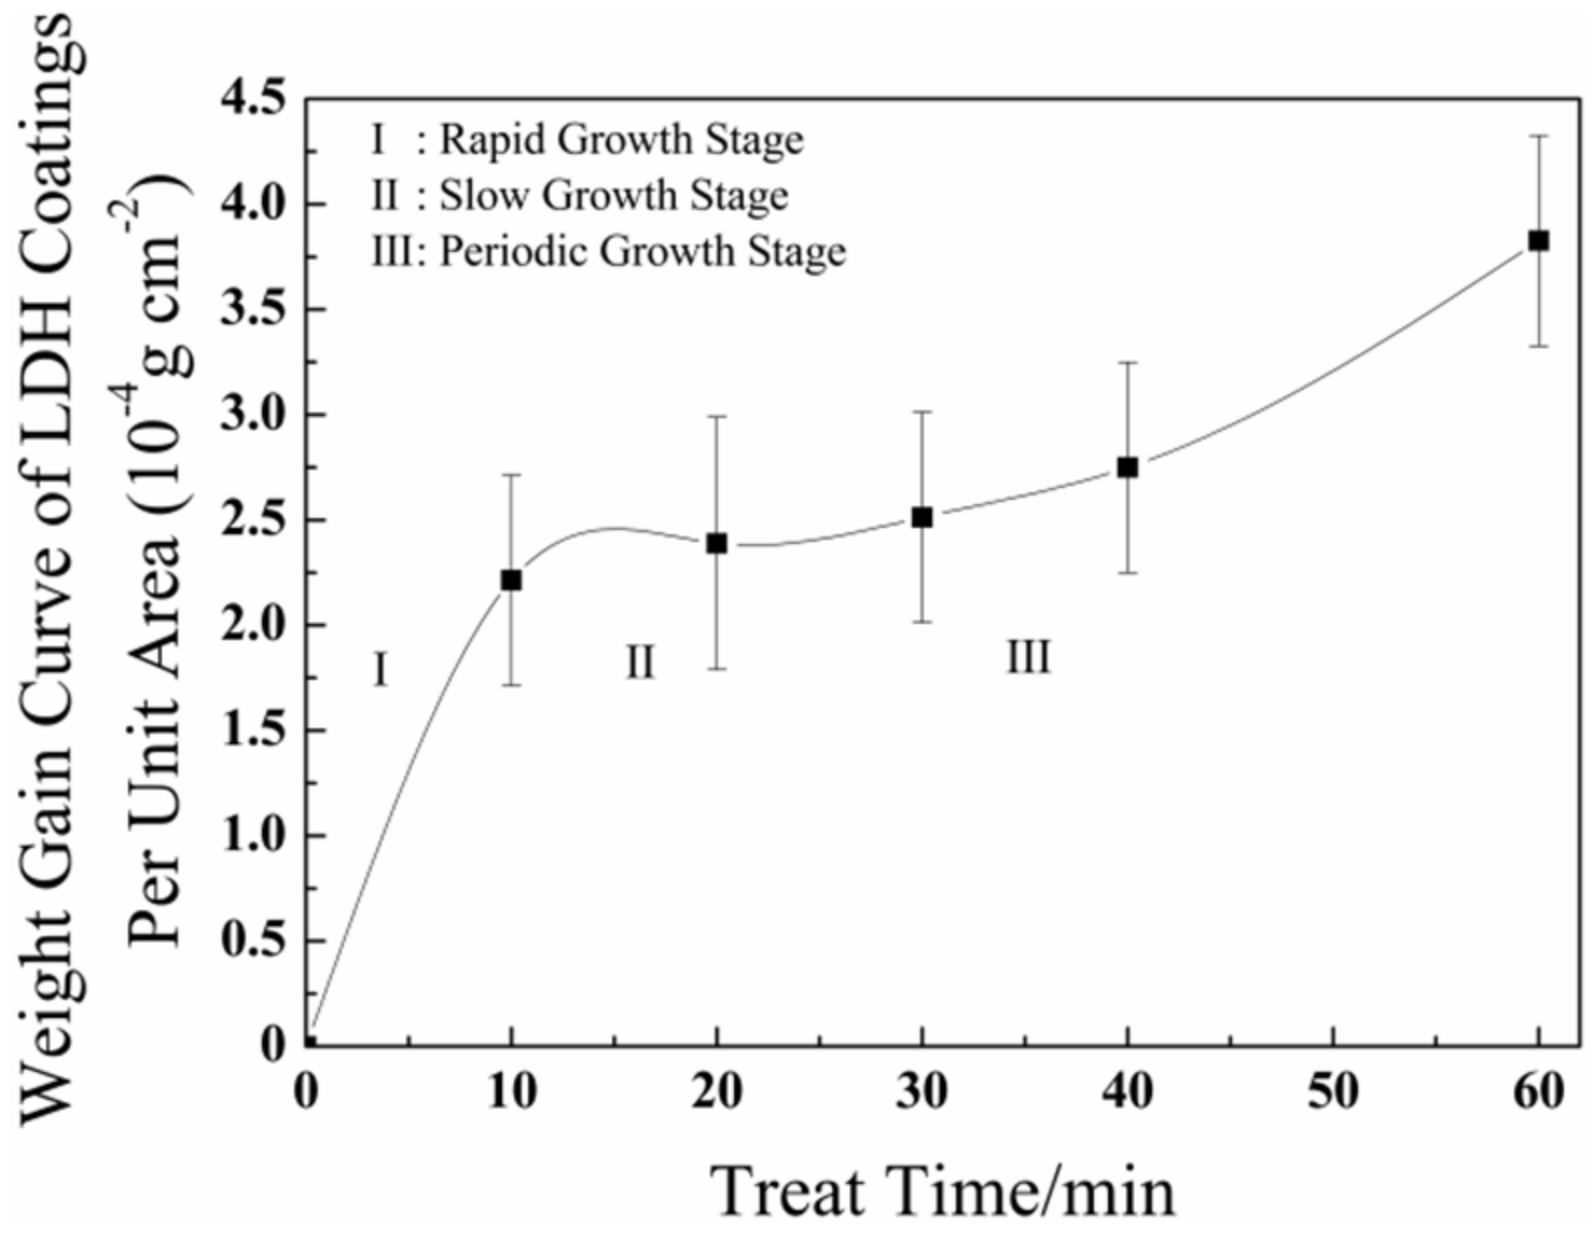
3.2. Weighted Gain Curve

The weighted gain curves were obtained in an immersion solution by measuring the relationship between the mass variation per unit coating, and the immersion time. The weighted gain curve of the different growth stages can be seen in Figure 5.

3.3. Apparent Activation Energy

Since the initial LDHs coating is mainly composed of Mg and Al hydroxide precipitation, the growth rate of the LDHs coating is determined by the reduction–reaction rate of OH in the micro-cathode region. The apparent activation energy Ea can be regarded as a constant in a certain range, since the formation reaction temperature is set. The increasing mass of the processing time per unit and the formation temperature will meet the equation as follows [52]:
ln ν 2 ν 1 = E a R ( 1 T 1 1 T 2 )
In Equation (1), v denotes the increasing mass of the coating per unit processing time (mg min−1). R is constantly set as 8.3143 J mol−1 K−1.
The apparent activation energy of the LDHs coatings was calculated in three growth stages, with a measurement of their increasing mass being taken at 30 and 50 °C for 10, 20 and 30 min, respectively, as shown in Table 1.

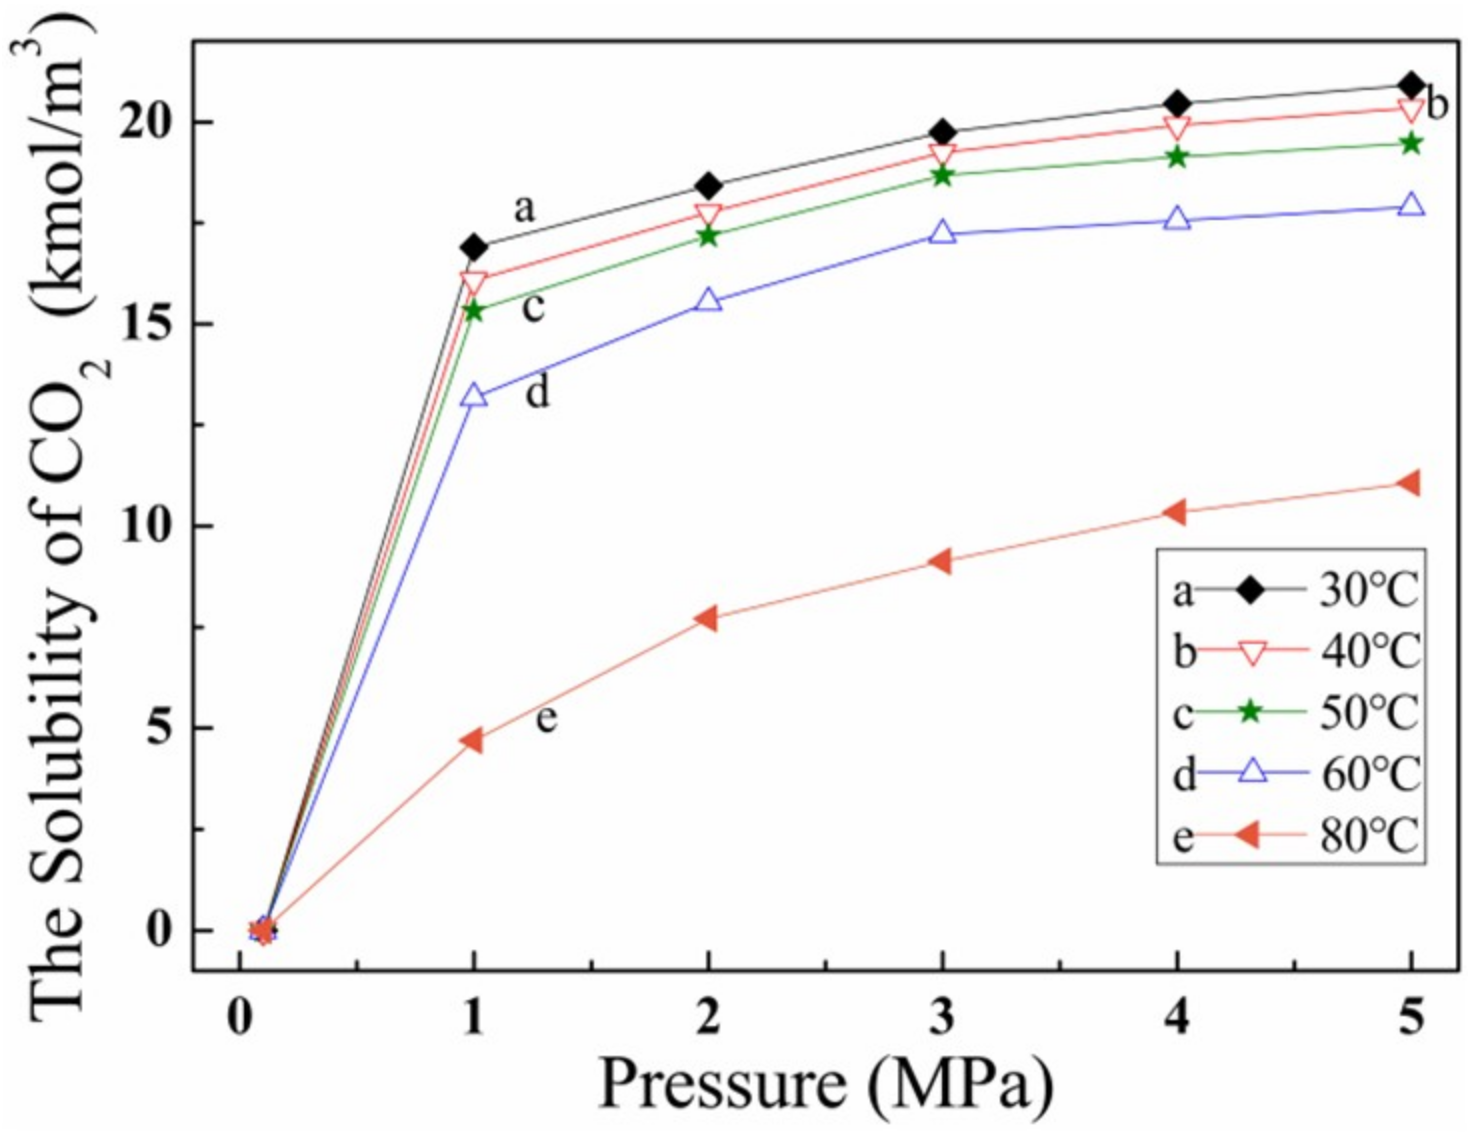
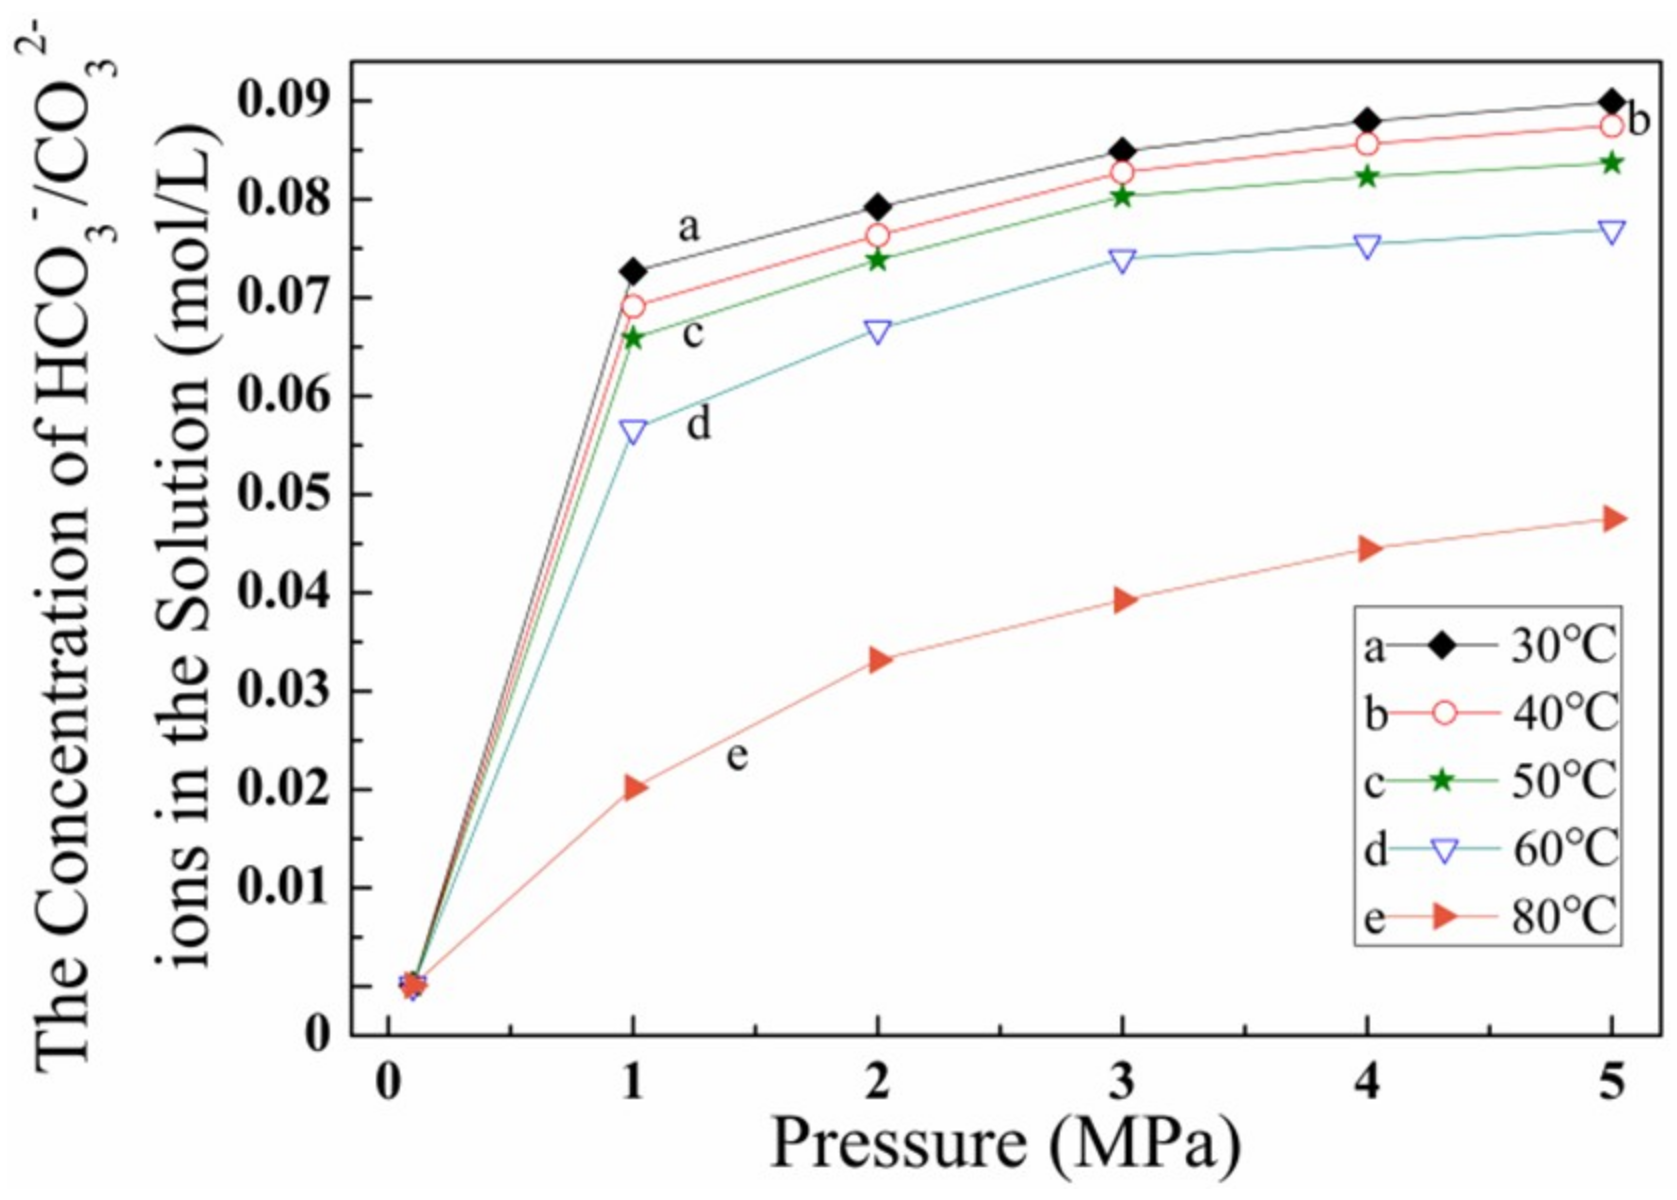
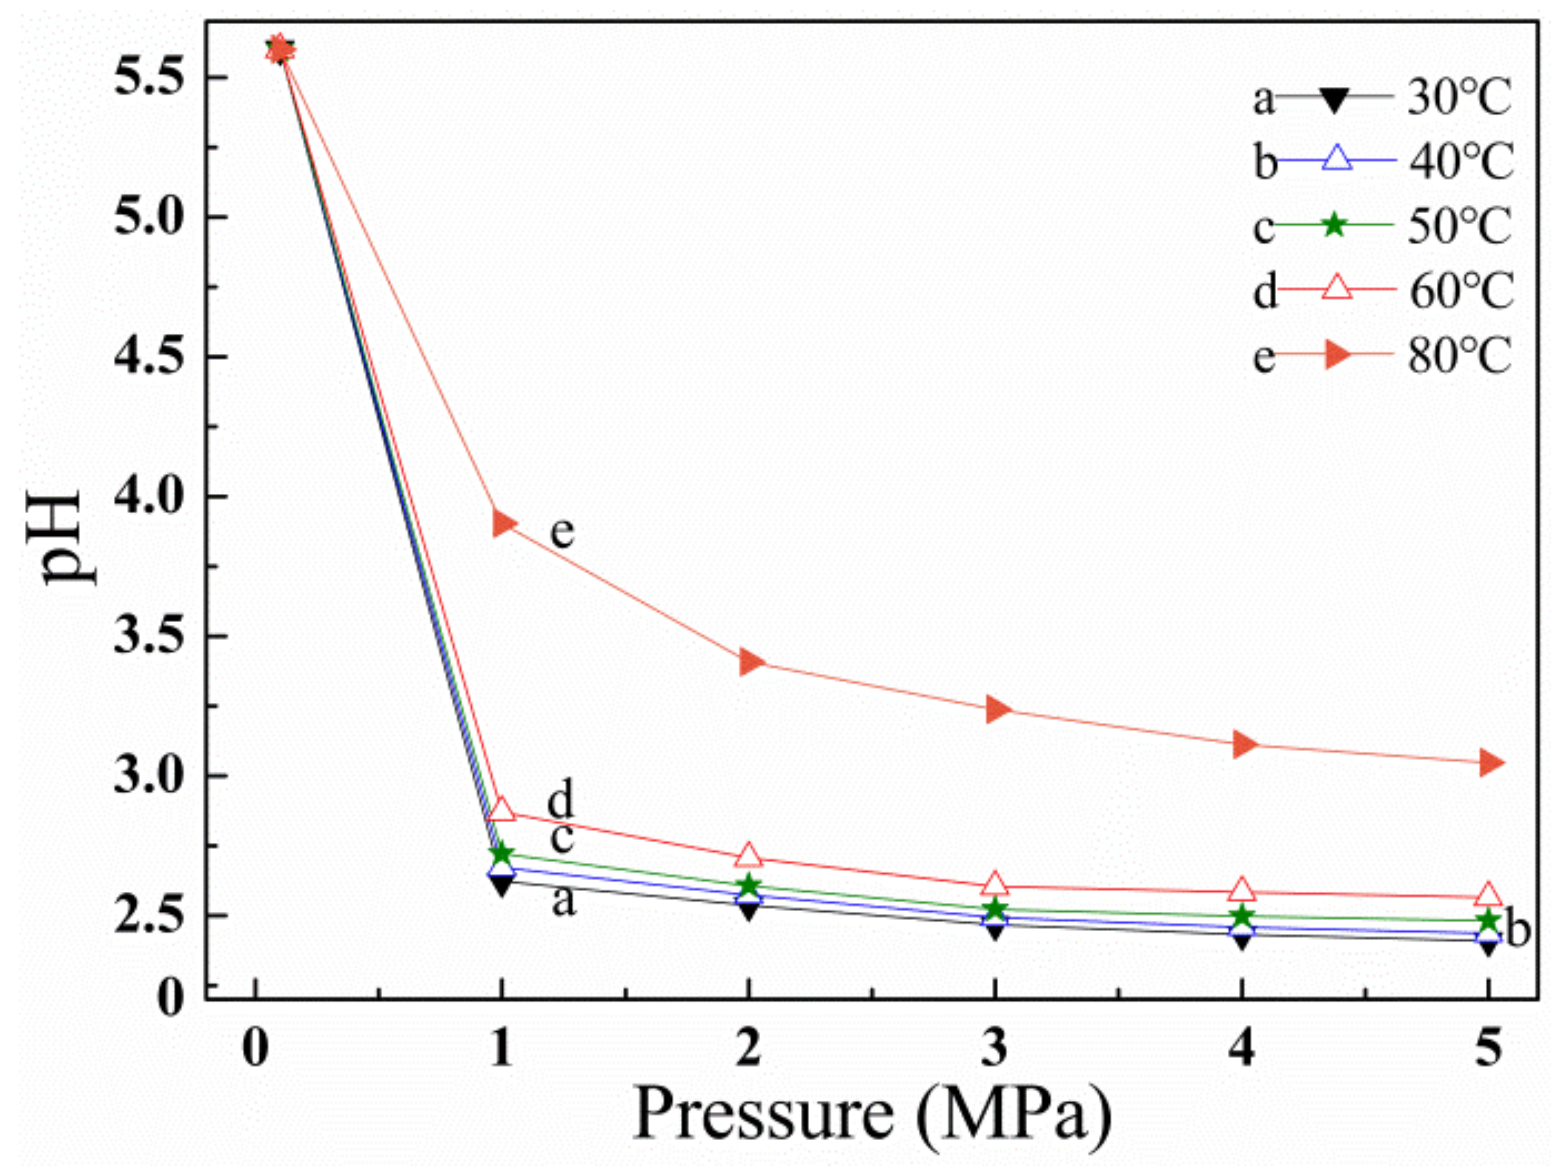
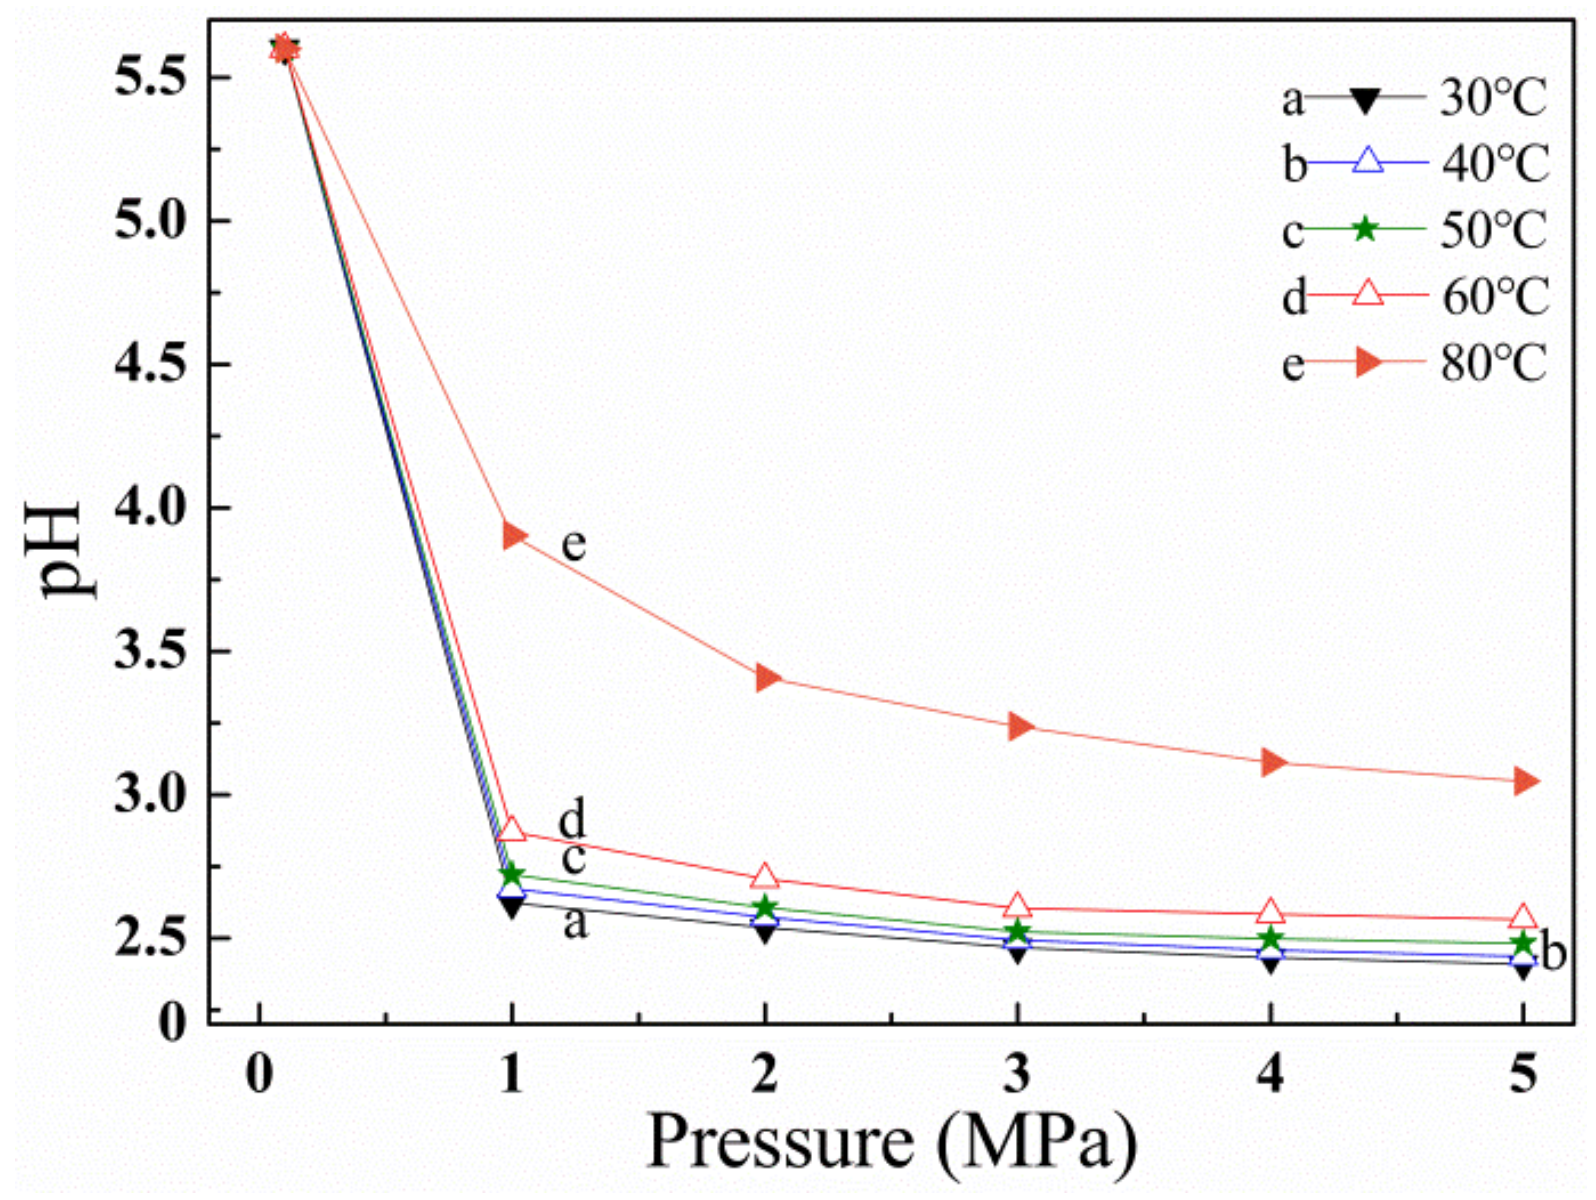
3.4. Effect of CO2 Solubility

CO2 solubility directly determines the formation effect of the LDHs coating, due to the formation solution itself being a carbonate/bicarbonate ions solution. Essentially, the solubility of gas-solutes is a matter of vapor–liquid equilibrium. According to the Second Law of Thermodynamics, if all spontaneous processes occur in an isothermal–isobaric closed system, the Free Gibb’s Energy of the system will decrease until the equilibrium state where the Free Gibb’s Energy of the system has reached the minimum. Therefore, if an isothermal–isobaric closed system achieves equilibrium, it can be considered that:
( dG ) T , P = 0
Equation (2) denotes the gas as gradually dissolving in the liquid, finally reaching a state of saturation. A gas–liquid equilibrium is then formed. Therefore, gas solubility can be defined as the solute concentration in a liquid solvent at gas–liquid equilibrium. In this formation system, the pressure and temperature directly affects the solubility of CO2. The solute density is usually described by the equation of the state. According to the BWRS equation, [51] the equation is as follows:
p = ρ R T + [ B 0 R T A 0 C 0 T 2 + D 0 T 3 E 0 T 4 ] ρ 2 + [ b R T a d T ] ρ 3 + α [ a + d T ] ρ 6 + c ρ 3 T 2 [ 1 + γ ρ 2 ] exp [ γ ρ 2 ]
In Equation (3), P is the pressure of the system, kPa; T is temperature of the system, K; ρ is the gas or liquid density, kmol m3; and R is the gas constant, R = 8.3143 KJ kmol−1 K−1).
{ ρ c i B 0 i = A 1 + B 1 ω i ; ρ c i 3 = A 7 + B 7 ω i ρ e i A 0 i R T c i = A 2 + B 2 ω i ; ρ c i 2 c i R T c i 3 = A 8 + B 8 ω i ρ e i A 0 i R T c i 3 = A 3 + B 3 ω i ; ρ c i 2 d i R T c i 2 = A 10 + B 10 ω i ρ c i 2 γ i = A 4 + B 4 ω i ; ρ c i 2 D 0 i R T c i 4 = A 9 + B 9 ω i ρ c i 2 b i = A 5 + B 5 ω i ; ρ c i 2 E 0 i R T c i 5 = A 11 + B 11 ω i e 3.8 ω i ρ c i 2 a i R T c i = A 6 + B 6 ω i }
In Equation (4), A0, B0, C0, D0, E0, a, b, c, d, α, and γ are the 11 parameters of the state equation. Each parameter of the pure component i can be calculated from its critical parameter, critical density, and eccentricity factor by Equation (4). In this equation, the universal constant (i = 1, 2, 3, …, 11) is shown in Table 2.
The solubility of CO2 was calculated by Equations (3) and (4) in CO2 pressurization, and is shown in Figure 6, where the solubility of CO2 increases along with the increase in pressure. CO2 pressurization directly affects the solubility of CO2, determining the concentration of CO32−/HCO3 ions, as well as the pH of the formation solution. The change in the concentration of the HCO3/CO32− ions was calculated by the ionization equation during the formation process, as shown in Figure 7. Corresponding to this, the pH was also calculated, as shown in Figure 8.

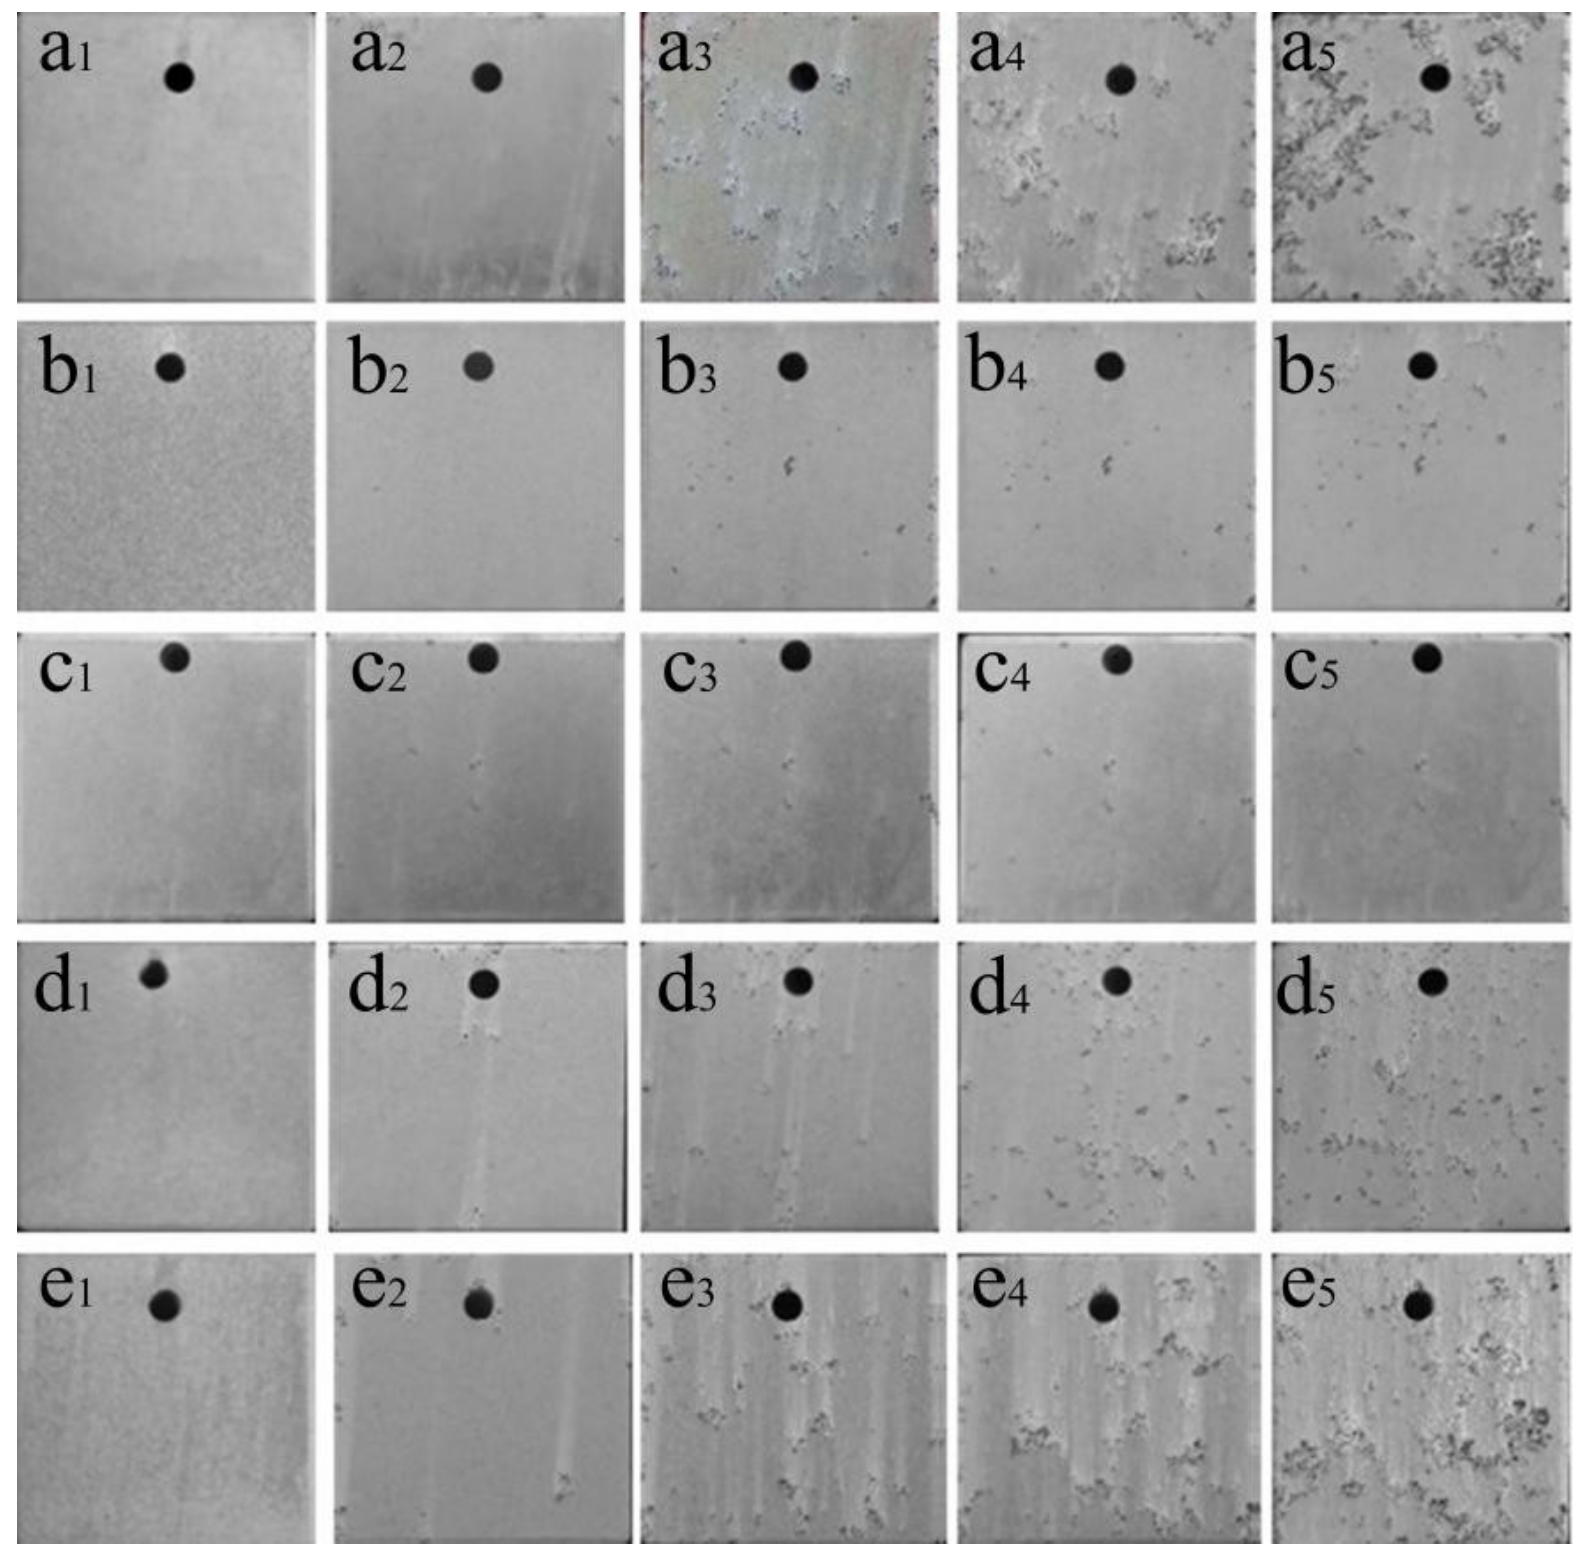
3.5. Anti-Corrosion Properties

The potentiodynamic polarization curves in the 3.5% NaCl solution of the LDHs coatings were tested by the three-electrode system, and these are shown in Figure 9. Using the Butler–Volmer equation, the corrosion potential Ecorr and the corrosion current icorr were determined based on the Tafel extrapolation method. The results are shown in Table 3. The hydrogen evolution data (HER) of the LDHs coatings at different formation times in 3.5% NaCl solution are shown in Figure 10. The immersion test results of 120 h were employed to evaluate the corrosion resistance of the LDHs coatings, and these are shown in Figure 11.

4. Discussion

4.1. Influence of the Micro-Structure on the Formation Process

The LDHs coatings were formed layer-by-layer from the micro-structural results. The initially formed positions were on the α-Mg phase, and subsequently, on the β-Mg17Al12 phase. The possible reason could be the potential differences between α-Mg and β-Mg17Al12. The β-Mg17Al12 phase became the cathode phase, thereby facilitating the dissolution of the α-Mg phase [49]. The coating was found to be the most even and compact after 30 min. The coating continued to grow between 40 min to 1 h, with severe cracks and holes appearing after 1 h. The results of the GAXRD patterns in Figure 4 are consistent with Figure 3.

4.2. Influence of Physical and Chemical Processes on the Formation Process

In essence, the formation process of the LDHs coating is a kind of physical and chemical process. The reaction process mainly includes an electrochemical reaction, an ionization reaction, and a formation reaction. The specific chemical reactions of formation within the LDHs coating are shown in Equations (5)–(11) [53,54,55,56].
CO 2 + H 2 O H 2 CO 3
Mg 2 e Mg 2 +
Al 3 e Al 3 +
2 H + + 2 e H 2 ( g ) / H 2 O + 2 e H 2 ( g ) + 2 OH
H 2 CO 3 HCO 3 + H +
H 2 CO 3 CO 3 2 + 2 H + ,
6 Mg 2 + + 2 Al 3 + + CO 3 2 + 16 OH + 4 H 2 O Mg 6 Al 2 ( OH ) 16 CO 3 · 4 H 2 O ,
The weighted gain curve and apparent activation energy shows that the formation process of the LDHs coatings can be divided into three stages, with the apparent activation energies being different at each of the three stages. The reason is the physical and chemical processes on the surface of the magnesium alloy are also different at each of these three stages. During the rapid growth stage (0–10 min), the existing uneven electrochemical regions were a result of the grain boundaries and dislocations on the surface of the magnesium alloy, with the higher energies of these regions easily forming many micro-batteries. Therefore, it was easy for coatings to grow and diffuse around these places [53]. Meanwhile, a large amount of OH is produced in the micro-cathode region, reaching the pH value required for the formation of LDHs, and resulting in the rapid formation of coatings (see Equation (11)). During the slow growth stage (10–20 min), the LDHs coatings appear to be stable, with the diffusion and migration of the electrons and O2 being affected by the formation of the LDHs coatings on the metal surface, thereby inhibiting the oxygen reduction reaction in the micro-cathode region, and resulting in the slow growth of the LDH coatings. During the periodic growth stage (30–60 min), the formation and dissolution reactions of the LDHs coatings tend to be balanced in a periodic state.
From the calculated values of the activation energy in the three stages, it can be seen that the activation energy was only 21.78 kJ mol−1 during the first stage. Thus, the formation rate is faster and it is seen as the rapid formation stage. A large amount of OH−1 is generated in the micro-cathode region, helping to facilitate the reduction reaction. In the second stage, the activation energy of the formation reaction was increased to 31.86 kJ mol−1, with the formation rate gradually slowing down. The reduction reaction in the micro-cathode region was weakened, due to the formation of the LDHs coating from the previous stage, which took 30 min to complete a growth cycle. The activation energy in the third stage was 34.92 kJ mol−1, which was kept constantly within a certain range of kJ mol−1. The formation reaction appeared to have greater difficulties than the first two stages, which were consistent with the results of the above analysis.

4.3. Influence of CO2 Pressurization on the Formation Process

The solubility of CO2 in water was increased concurrently with the pressure (Figure 6), leading to a series of changes in the physical and chemical processes. According to Le Chatelier’s principle, it led to the electrochemical reaction (Equation (5)) and the ionization reaction (Equations (9) and (10)) to the right, along with an increase in the concentration of hydrogen ions in the formation solution. The electrochemical reaction (Equations (6)–(8)) was promoted to the right. This is consistent with the change tendency of the HCO3/CO32− ion concentration calculated in Figure 7. The pH of the formation solution (Figure 8) decreased with the pressure, which also led to the electrochemical reactions (Equations (6)–(8)) to the right, and an acceleration in the dissolution of aluminum and magnesium ions. The acceleration of electrochemical and ionizational reactions promoted the formation reaction of the LDHs coatings (Equation (11)) on the magnesium alloy surface, with an increase in magnesium, aluminum, carbonate, and hydroxyl ions. The pressure of the formation system remained at a stable value, ensuring the stability of the formation system, and thus, implementing the stability of the formation process.

4.4. Influence of the Formation Time on the Anti-Corrosion Properties

The electrochemical test results showed that the anodic reaction of the LDHs coating was significantly inhibited (Figure 9). The icorr can be ranked by the series: 30 min < 20 min < 40 min < 1 h < 10 min < AZ91D. The icorr (8.92 μA cm−2) of the LDHs coating was lowest at 30 min. Meanwhile, the efficiency percentage (efficiency %) of the LDHs coating was highest in the same condition. The hydrogen evolution reaction at the cathode is the main reason for the corrosion of the magnesium alloys. Thus, the hydrogen evolution rate is proportional to the corrosion rate [57,58,59,60,61]. The hydrogen evolution process also shows the same result as the aforementioned reaction (Figure 10). The hydrogen evolution performance of the 30 min coating at 50 °C was 0.155 mL cm−2, due to the coating formation at 30 min being denser than those processed at other processing times.
The samples processed for 10 min and 1 h underwent severe corrosion, with a corrosion damage level of 3G. The level of the corrosion damage of samples processed for 20, 30 and 40 min were less severe, especially the sample processed for 30 min (Figure 11). The sample surface of the samples processed for 30 min essentially remained intact after immersion for 120 h, with only slight corrosion appearing during this time. The level of corrosion damage was evaluated as 7G, 7G, and 6G for samples processed for 20, 30 and 40 min, respectively. The results of the polarization curves, HER curves, and immersion tests consistently showed that AZ91D alloy had better anti-corrosion properties after 30 min of the CO2 pressurization method. In sum, the anti-corrosive performance of the LDHs coatings can be ranked in the increasing series: AZ91D < 10 min < 1 h < 40 min < 20 min < 30 min.

4.5. Comparison with the State-of-the-Art Technology

To further prove the formation effect of the CO2 pressurization method, comparisons were made between the CO2_3 MPa_0.5 h (30 min treatment sample) treatment and the currently mature preparation methods. The first comparison is the one step method, the samples were statically immersed in a bath at 50 °C for a particular period for 24 h, and it was denoted above as the CO2_24 h treatment [37]. The two-step method was then performed: the samples were placed in the solution through which CO2 gas was continuously bubbled for 2 h. This treatment is called the CO2_2 h treatment. A separate HCO3/CO32− solution were maintained at pH 11.5 by the dropwise addition of 1.25 M aqueous NaOH with vigorous stirring. The CO2_2 h treatment was immediately hydrothermally treated by dipping in a pH 11.5 HCO3/CO32− solution at 50 °C for 2 h. This was denoted by CO2_2 h/pH 11.5_2h [41]. For the perspective of the formation technology, the preparation efficiency of the CO2_3 MPa_0.5 h treatment was eight and 48 times higher than the CO2_2 h/pH 11.5_2 h and CO2_24 h treatments. For the perspective of anti-corrosion performance, the sample of the CO2_24 h treatment and the CO2_2 h/pH 11.5_2 h treatments showed multiple areas of corrosion, and the sample of CO2_3 MPa_0.5 h treatment was basically intact, after immersion for 48 h in 3.5% NaCl solution, as shown in Figure 12. The CO2_3 MPa_0.5 h treatment is observably better than the CO2_24 h and CO2_2 h/pH 11.5_2 h.

5. Conclusions

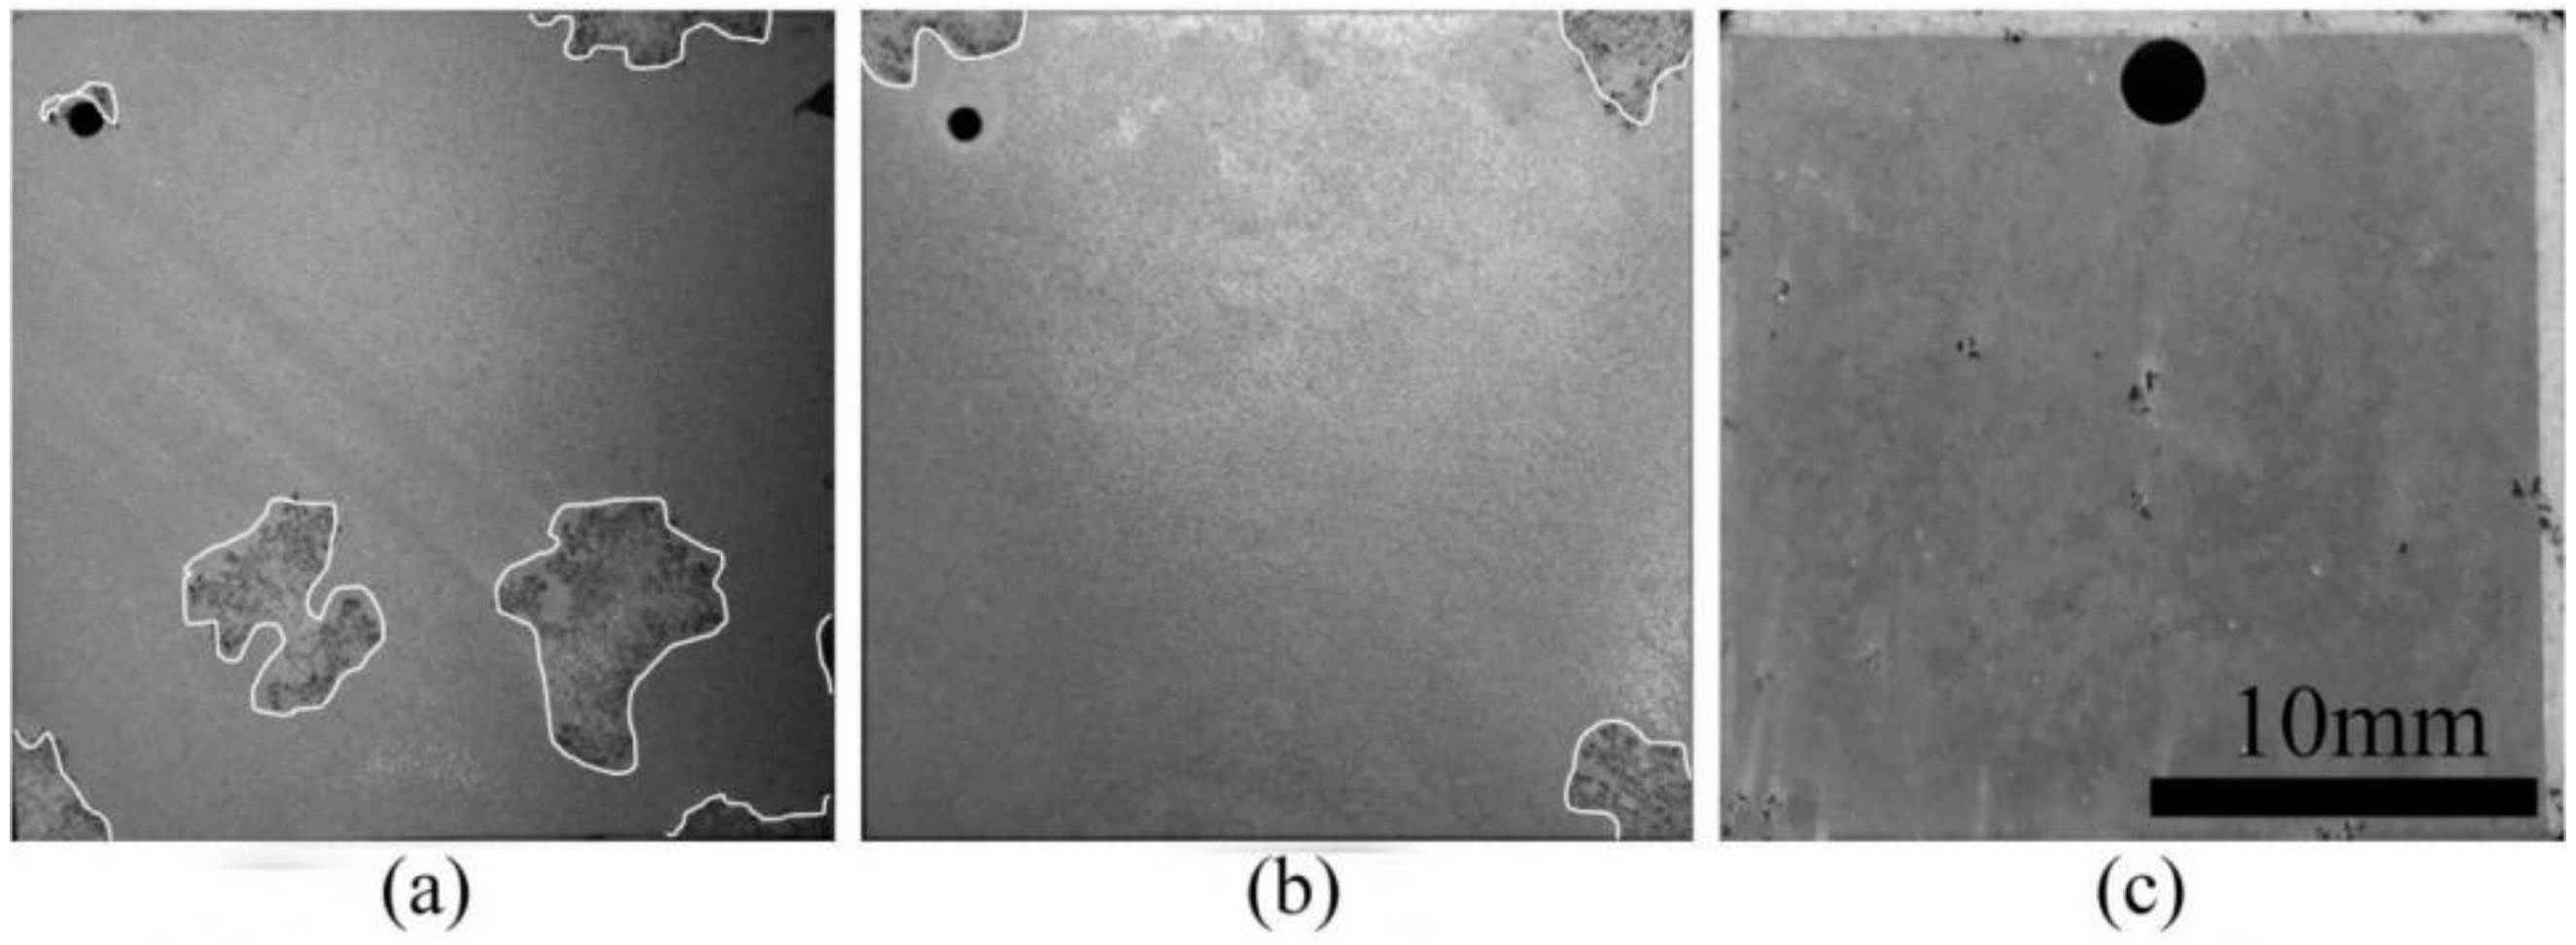
The initial formation position in the formation process of the LDHs coating on magnesium alloy is on the α-Mg phase, and subsequently on the β-Mg17Al12 phase. The most even and dense coating was found after 30 min, where the LDHs coating appeared to severe cracks and holes, and especially so after 1 h.
The formation process of the LDHs coating can be divided into three stages: a rapid growth stage, a slow growth stage, and a periodic growth stage. During the rapid growth stage (0–10 min), the weight of the LDHs coatings increasing rapidly, with a minimum value of activation energy (21.78 kJ mol−1). During the slow growth stage (10–20 min), the weight of the LDHs coatings grew stably, with a growing value of activation energy (31.86 kJ mol−1). Finally, during the periodic growth period, the formation and dissolution of the LDHs coatings tended to be balanced, with a maximum value of activation energy (34.92 kJ mol−1).
CO2 pressurization promotes the shifts of the ionization reaction and the electrochemical reaction to the right, thereby accelerating the formation reaction, which increases the formation reaction rate and formation stability.
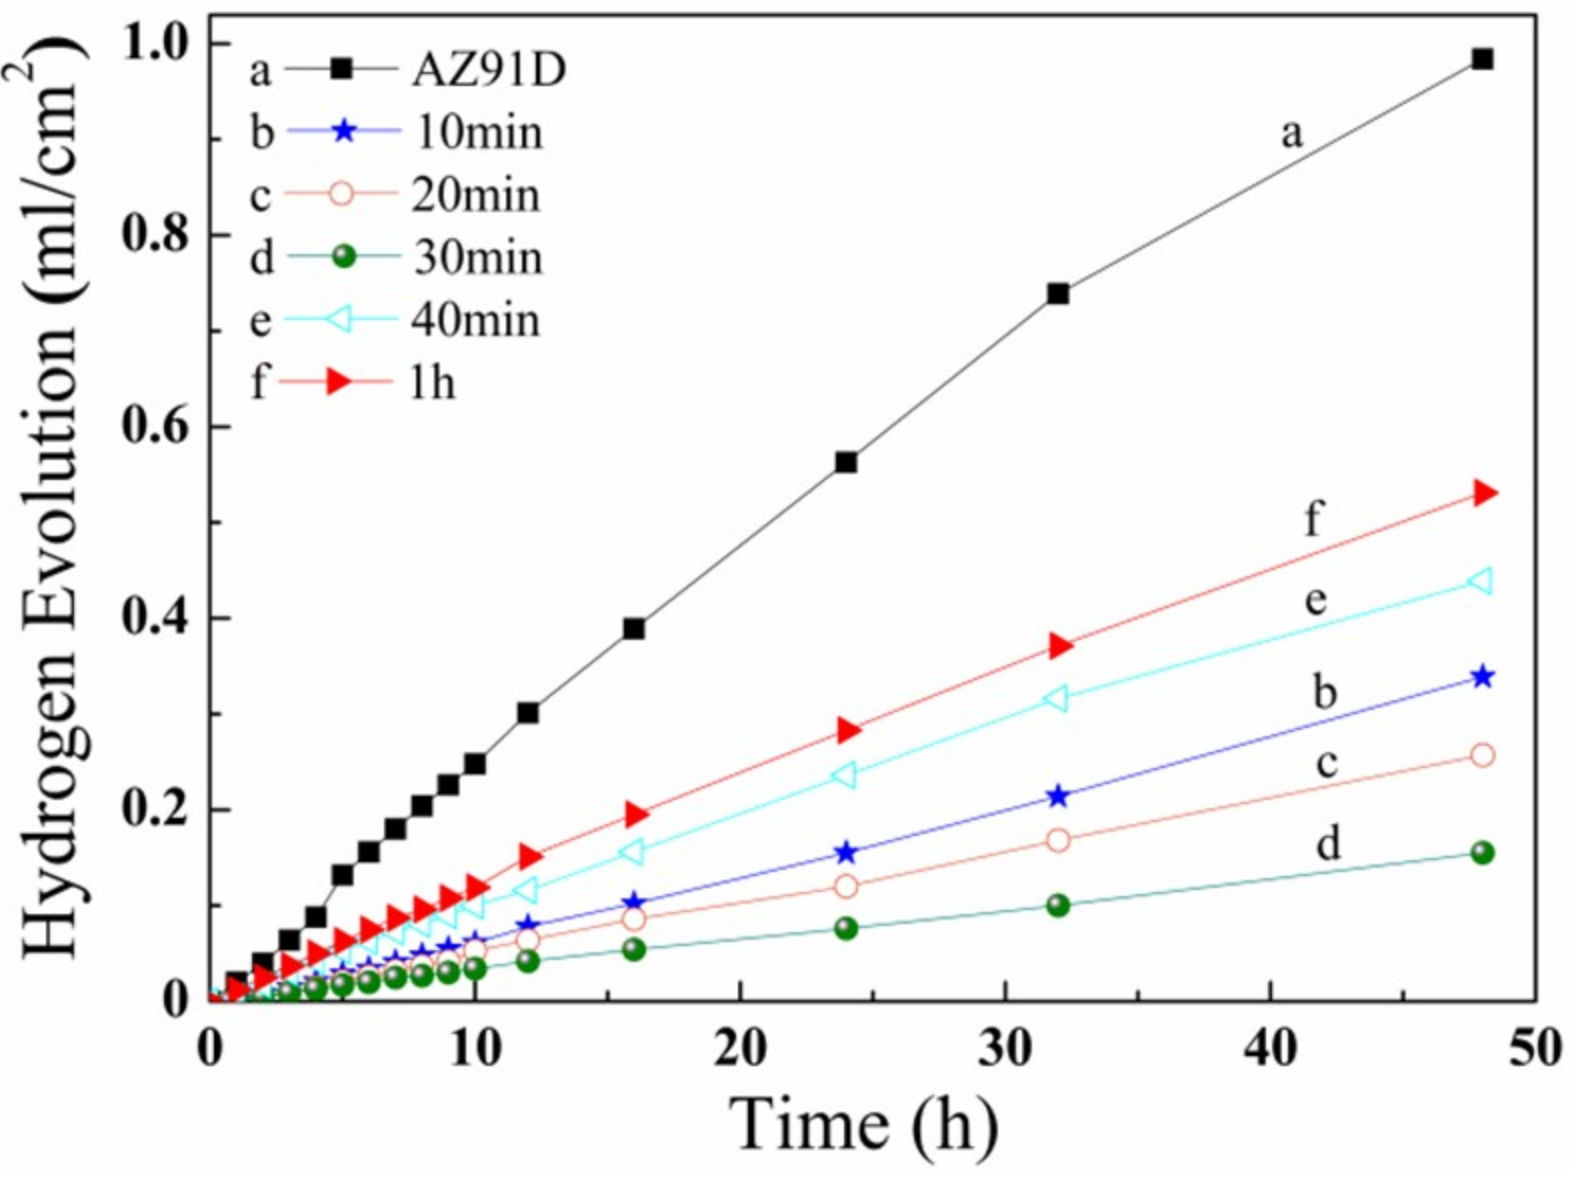
The anti-corrosion of the LDHs coating is gradually improved with the increase in formation time. The icorr (corrosion current) of the LDHs coating was minimal at 30 min, and had a higher efficiency percentage. The LDHs coating has a compact micro-structure, and better anti-corrosion at a pressure of 3 MPa, a temperature of 50 °C, and a time of 30 min. Comparing with the state-of-the-art technology, the CO2_3 MPa_0.5 h treatment is observably better than CO2_24 h and CO2_2 h/pH 11.5_2 h treatments.

Author Contributions

Conceptualization, X.Z. and T.Z.; Methodology, X.Z., J.W. and C.Z.; Software, X.Z., J.W. and C.Z.; Validation, X.Z., T.Z., G.M. and F.W.; Formal Analysis, X.Z., B.L. and T.Z.; Investigation, X.Z., C.Z., B.L., P.J. and T.Z.; Resources, X.W., B.L., B.B., T.Z. and G.M.; Data Curation, X.Z., B.L., T.Z., G.M. and F.W.; Writing—Original Draft Preparation, X.Z., J.W., C.Z., B.L., Y.Z. and C.Z.; Writing—Review & Editing, X.Z., Y.Z., P.J. and T.Z.; Visualization, X.Z., C.Z., P.J. and Y.Z; Supervision, B.B., B.L., T.Z., G.M. and F.W.; Project Administration, X.Z., B.L., T.Z. and F.W.; Funding Acquisition, X.C., B.L., T.Z. and F.W.

Funding

The research was funded by the National Program for the Young Top-notch Professionals, the National Natural Science Foundation of China (No. 51531007, 51771050, 51705038), and Foundation of Young Scholars in HLJIT (No. 2014QJ12).

Conflicts of Interest

The authors declare no conflict of interest.

References

  1. Chen, X.H.; Geng, Y.X.; Pan, F.S. Research Progress in Magnesium Alloys as Functional Materials. Rare Met. Mater. Eng. 2016, 45, 2269–2274. [Google Scholar] [CrossRef]
  2. Song, G.; Xu, Z. The surface, microstructure and corrosion of magnesium alloy AZ31 sheet. Electrochim. Acta 2010, 55, 4148–4161. [Google Scholar] [CrossRef]
  3. Shi, F.; Wang, C.Q.; Zhang, Z.M. Microstructures, corrosion and mechanical properties of as-cast MgZnY(Gd) alloys. Trans. Nonferrous Met. Soc. China 2015, 25, 2172–2180. [Google Scholar] [CrossRef]
  4. Atrens, A.; Song, G.L.; Liu, M. Review of recent devel-opments in the field of magnesium corrosion. Adv. Eng. Mater. 2015, 17, 400–453. [Google Scholar] [CrossRef]
  5. Cao, F.; Song, G.L.; Atrens, A. Corrosion and passivation of magnesium alloys. Corros. Sci. 2016, 111, 835–845. [Google Scholar] [CrossRef]
  6. Brown, R. International Mg Association 55th Annual World Conference. Light Met. Age. 1998, 56, 86–93. [Google Scholar]
  7. Eliezer, D.; Aghion, E.; Fores, F.H. Magnesium science, technology and applications. Adv. Perform. Mater. 1998, 5, 201–212. [Google Scholar] [CrossRef]
  8. Toshihide, T.; Yuji, N.; Nobuo, U.; Masahiro, K. Improvement of corrosion resistance of magnesium metal by rare earth elements. Electrochim. Acta 2007, 1, 117–121. [Google Scholar] [CrossRef]
  9. Song, Y.L.; Liu, Y.H.; Wang, S.H. Effect of cerium addition on microstructure and corrosion resistance of die cast AZ91 magnesium alloy. Mater. Corros. 2007, 3, 189–192. [Google Scholar] [CrossRef]
  10. Tong, G.D.; Liu, H.F.; Liu, Y.H. Effec of rare earth additions on microstructure and mechanical properties of AZ91 magnesium alloys. Trans. Nonferrous Met. Soc. China 2010, 20, 336–340. [Google Scholar] [CrossRef]
  11. Zhang, J.; Xu, M.; Teng, X.; Zuo, M. Effect of Gd addition on microstructure and corrosion behaviors of Mg-Zn-Y alloy. J. Magn. Alloy 2016, 4, 319–325. [Google Scholar] [CrossRef]
  12. Zhou, H.; Xu, W.Z.; Jian, W.W. A new metastable precipitate phase in Mg-Gd-Y-Zr alloy. Philos. Mag. 2014, 21, 2403–2409. [Google Scholar] [CrossRef]
  13. Zhou, H.; Wang, Q.D.; Guo, W.; Ye, B.; Jian, W.W.; Xu, W.Z.; Ma, X.L.; Moering, J. Finite element simulation and experimental investigation on homogeneity of Mg-9.8Gd-2.7Y-0.4Zr magnesium alloy processed by repeated-up setting. J. Mater. Process. Technol. 2015, 225, 310–317. [Google Scholar] [CrossRef]
  14. Zhou, H.; Cheng, G.M.; Ma, X.L.; Xu, W.Z.; Mathaudhu, S.N.; Wang, Q.D.; Zhu, Y.T. Effect of Ag on interfacial segregation in Mg-Gd-Y-(Ag)-Zr alloy. Acta Mater. 2015, 95, 20–29. [Google Scholar] [CrossRef]
  15. Liang, C.H.; Wang, S.S.; Huang, N.B. Effects of Lanthanum and Cerium Mixed Rare Earth Metal on Abrasion and Corrosion Resistance of AM60 Magnesium Alloy. Rare Metal Mater. Eng. 2015, 3, 521–526. [Google Scholar] [CrossRef]
  16. Zhou, H.; Ning, H.Y.; Ma, X.L. Microstructural evolution and mechanical properties of Mg-9.8Gd-2.7Y-0.4Zr alloy produced by repetitive upsetting. J. Mater. Sci. Technol. 2018, 34, 1067–1075. [Google Scholar] [CrossRef]
  17. Emley, E.F. Principles of Magnesium Technology; Pegamon Press: New York, NY, USA, 1966. [Google Scholar]
  18. Zhang, Y.; Yan, C.; Wang, F. Study on the environmentally friendly anodizing of AZ91D magnesium alloy. Surf. Coat. Technol. 2002, 1, 36–43. [Google Scholar] [CrossRef]
  19. Song, G.L. Recent progress in corrosion and protection of magnesium alloys. Adv. Eng. Mater. 2005, 7, 563–586. [Google Scholar] [CrossRef]
  20. Pommiers, S.; Frayret, J.; Castetbon, A. Alternative conversion coatings to chromate for the protection of magnesium alloys. Corros. Sci. 2014, 84, 135–146. [Google Scholar] [CrossRef]
  21. Jiang, X.; Guo, R.G.; Jiang, S.Q. Microstructure and corrosion resistance of Ce–V conversion coatingon AZ31 magnesium alloy. Appl. Surf. Sci. 2015, 341, 166–174. [Google Scholar] [CrossRef]
  22. Zeng, R.C.; Hu, Y.; Zhang, F. Corrosion resistance of cerium-doped zinc calcium phosphate chemical conversion coatings on AZ31 magnesium alloy. Trans. Nonferrous Met. Soc. 2016, 26, 472–483. [Google Scholar] [CrossRef] [Green Version]
  23. Chen, X.B.; Yang, H.Y.; Abbott, T.B. Corrosion protection of magnesium and itsalloys by metal phosphate conversion coatings. Surf. Eng. 2014, 30, 871–879. [Google Scholar] [CrossRef]
  24. Phuong, N.V.; Gupta, M.; Moon, S. Enhanced corrosion performance of magnesium phosphate conversion coating on AZ31 magnesium alloy. Trans. Nonferrous Met. Soc. 2017, 27, 1087–1095. [Google Scholar] [CrossRef]
  25. Jian, S.Y.; Chu, Y.R.; Lin, C.S. Permanganate conversion coating on AZ31 magnesium alloys with enhanced corrosion resistance. Corros. Sci. 2015, 93, 301–309. [Google Scholar] [CrossRef]
  26. Lee, Y.L.; Chu, Y.R.; Li, W.C. Effect of permanganate concentration on the formation and properties of phosphate/permanganate conversion coating on AZ31 magnesium alloy. Corros. Sci. 2013, 70, 74–81. [Google Scholar] [CrossRef]
  27. Mosiałek, M.; Mordarski, G.; Nowak, P. Phosphate–permanganate conversion coatings on the AZ81 magnesium alloy; SEM, EIS and XPS studies. Surf. Coat. Technol. 2011, 206, 51–62. [Google Scholar] [CrossRef]
  28. Yang, L.H.; Zhang, M.L.; Li, J.Q. Stannate conversion coatings on Mg–8Li alloy. J. Alloys Compd. 2009, 471, 97–200. [Google Scholar] [CrossRef]
  29. Lee, Y.L.; Chu, Y.R.; Chen, F.J. Mechanism of the formation of stannate and cerium conversion coatings on AZ91D magnesium alloys. Appl. Surf. Sci. 2013, 276, 578–585. [Google Scholar] [CrossRef]
  30. Ma, Y.B.; Li, N.; Li, D.Y.; Huang, X.M. Characteristics and corrosion studies of vanadate conversion coating formed on Mg–14 wt % Li–1 wt % Al–0.1 wt % Ce alloy. Appl. Surf. Sci. 2012, 261, 59–67. [Google Scholar] [CrossRef]
  31. Niu, L.Y.; Chang, S.H.; Tong, X. Analysis of characteristics of vanadate conversion coating on the surface of magnesium alloy. J. Alloy. Compd. 2014, 617, 214–218. [Google Scholar] [CrossRef]
  32. Loperena, A.P.; Lehr, I.L.; Saidman, S.B. Formation of a cerium conversion coating on magnesium alloy using ascorbic acid as additive. Characterisation and anticorrosive properties of the formed film. J. Magn. Alloy 2016, 4, 278–285. [Google Scholar] [CrossRef]
  33. Lei, L.; Shi, J.; Wang, X. Microstructure and electrochemical behavior of cerium conversion coating modified with silane agent on magnesium substrates. Appl. Surf. Sci. 2016, 376, 161–171. [Google Scholar] [CrossRef]
  34. Kong, G.; Liu, L.Y.; Lu, J.T. Study on lanthanum salt conversion coating modified with citric acid on hot dip galvanized steel. J. Rare Earths 2010, 28, 461–465. [Google Scholar] [CrossRef]
  35. Xu, S.; Liao, M.C.; Zeng, H.Y. Surface modification and dissolution behavior of Mg–Al hydrotalcite particles. J. Taiwan. Inst. Chem. Eng. 2015, 56, 174–180. [Google Scholar] [CrossRef]
  36. Wang, L.D.; Zhang, K.Y.; He, H.R. Enhanced corrosion resistance of MgAl hydrotalcite conversion coating on aluminum by chemical conversion treatment. Surf. Coat. Technol. 2013, 235, 484–488. [Google Scholar] [CrossRef]
  37. Lin, J.K.; Hsia, C.L.; Uan, J.Y. Characterization of Mg, Al-hydrotalcite conversion film on Mg alloy and Cl and CO32− anion-exchangeability of the film in a corrosive environment. Scr. Mater. 2007, 56, 927–930. [Google Scholar] [CrossRef]
  38. Lin, J.K.; Uan, J.Y. Formation of Mg, Al-hydrotalcite conversion coating on Mg alloy in aqueous HCO3/CO32− and corresponding protection against corrosion by the coating. Corros. Sci. 2009, 51, 1181–1188. [Google Scholar] [CrossRef]
  39. Uan, J.Y.; Lin, J.K.; Sun, Y.S. Surface coatings for improving the corrosion resistance and cell adhesion of AZ91D magnesium alloy through environmentally clean methods. Thin Solid Films 2010, 518, 7563–7567. [Google Scholar] [CrossRef]
  40. Uan, J.Y.; Lin, J.K.; Tung, Y.S. Direct growth of oriented Mg–Al layered double hydroxide film on Mg alloy in aqueous HCO3/CO32− solution. J. Mater. Chem. 2010, 20, 761–766. [Google Scholar] [CrossRef]
  41. Lin, J.K.; Jeng, K.L.; Uan, J.Y. Crystallization of a chemical conversion layer that forms on AZ91D magnesium alloy in carbonic acid. Corros. Sci. 2011, 53, 3832–3839. [Google Scholar] [CrossRef]
  42. Syu, J.H.; Uan, J.Y.; Lin, M.C. Optically transparent Li–Al–CO3 layered double hydroxide thin films on an AZ31 Mg alloy formed by electrochemical deposition and their corrosion resistance in a dilute chloride environment. Corros. Sci. 2013, 68, 238–248. [Google Scholar] [CrossRef]
  43. Yu, B.L.; Lin, J.K.; Uan, J.Y. Applications of carbonic acid solution for developing conversion coating on Mg alloy. Trans. Nonferrous Met. Soc. China 2010, 20, 1331–1339. [Google Scholar] [CrossRef]
  44. Chen, J.; Song, Y.W.; Shan, D.Y. In situ growth of Mg–Al hydrotalcite conversion film on AZ31 magnesium alloy. Corros. Sci. 2011, 53, 3281–3288. [Google Scholar] [CrossRef]
  45. Chen, J.; Song, Y.W.; Shan, D.Y. Study of the corrosion mechanism of the in situ grown Mg–Al–CO32− hydrotalcite film on AZ31 alloy. Corros. Sci. 2012, 65, 268–277. [Google Scholar] [CrossRef]
  46. Chen, J.; Song, Y.W.; Shan, D.Y. Modifications of the hydrotalcite film on AZ31 Mg alloy by phytic acid: The effects on morphology, composition and corrosion resistance. Corros. Sci. 2013, 74, 130–138. [Google Scholar] [CrossRef]
  47. Chen, J.; Xu, Q.; Song, Y.W. Characterization of the in situ growth manasseite/carbonates composite conversion film on Mg2Zn alloy. Mater. Lett. 2015, 150, 65–68. [Google Scholar] [CrossRef]
  48. Chen, J.; Song, Y.W.; Shan, D.Y. Influence of alloying elements and microstructure on the formation of hydrotalcite film on Mg alloys. Corros. Sci. 2015, 93, 90–99. [Google Scholar] [CrossRef]
  49. Zhang, F.; Liu, Z.G.; Zeng, R.C. Corrosion resistance of Mg-Al-LDH coating on magnesium alloy AZ31. Surf. Coat. Technol. 2014, 258, 1152–1158. [Google Scholar] [CrossRef]
  50. Zhang, F.; Zhang, C.L.; Song, L. Corrosion of in-situ grown MgAl-LDH coating on aluminum alloy. Trans. Nonferrous Met. Soc. China 2015, 25, 3498–3504. [Google Scholar] [CrossRef]
  51. Starljngke, K.E.; Han, M.S. Thermo data refined for LPG–14. Mixtures. Hydrocarb. Process. 1972, 51, 129–132. [Google Scholar]
  52. Liauo, C.S.; Huang, J.C. Relationship between apparent and true activation energies. Scripta Mater. 1998, 39, 873–879. [Google Scholar] [CrossRef]
  53. Zhang, T.; Shao, Y.W.; Meng, G.Z. Corrosion of hot extrusion AZ91 magnesium alloy; I-relation between the microstructure and corrosion behavior. Corros. Sci. 2011, 53, 1960–1968. [Google Scholar] [CrossRef]
  54. Song, G.L.; Atrens, A.; Wu, X.L.; Zhang, B. Corrosion behavior of AZ21, AZ501 and AZ91 in sodium chloride. Corros. Sci. 1998, 40, 1769–1791. [Google Scholar] [CrossRef]
  55. Cao, Y.; Li, G.; Li, X. Graphene/layered double hydroxide nanocomposite: Properties, synthesis and applications. Chem. Eng. J. 2016, 292, 207–223. [Google Scholar] [CrossRef]
  56. Alibakhshi, E.; Ghasemi, E.; Mahdavian, M.; Ramezanzadeh, B. A comparative study on corrosion inhibitive efect of nitrate and phosphate intercalated Zn-Al-layered double hydroxides (LDHs) nanocontainers incorporated into a hybrid silane layer and their efect on cathodic delamination of epoxy topcoat. Corros. Sci. 2017, 115, 159–174. [Google Scholar] [CrossRef]
  57. Song, G.L. Corrosion behavior of magnesium alloys and protection techniques. Surf. Eng. Light Alloy. 2010, 3–39. [Google Scholar] [CrossRef]
  58. Zhang, T.; Li, Y.; Wang, F.H. Roles of beta phase in the corrosion process of AZ91D magnesium alloy. Corros. Sci. 2006, 48, 1249–1264. [Google Scholar] [CrossRef]
  59. Fajardoa, S.; Frankel, G.S. A kinetic model explaining the enhanced rates of hydrogen evolution on anodically polarized magnesium in aqueous environments. Electrochem. Commun. 2017, 84, 36–39. [Google Scholar] [CrossRef] [Green Version]
  60. Thomas, S.; Medhekar, N.V.; Franke, G.S.; Birbilis, N. Corrosion mechanism and hydrogen evolution on Mg. Curr. Opin. Solid State Mater. Sci. 2015, 19, 85–94. [Google Scholar] [CrossRef]
  61. Song, D.; Ma, A.B.; Jiang, J.H. Corrosion behaviour of bulk ultra-fine grained AZ91D magnesium alloy fabricated by equal-channel angular pressing. Corros. Sci. 2011, 53, 362–373. [Google Scholar] [CrossRef]
Figure 1. Preparation flowchart of the layered double hydroxides (LDHs) coating prepared by CO2 pressurization.
Coatings 09 00047 g001
Figure 2. Surface morphologies of the LDHs coatings at different formation times; (a) 10 min, (b) 20 min, (c) 30 min, (d) 40 min, (e) 1 h (f) petal-like at 30 min.
Coatings 09 00047 g002
Figure 3. Cross-sectional morphologies of the LDHs coatings at different formation times; (a) 10 min, (b) 20 min, (c) 30 min, (d) 40 min, (e) 1 h.
Coatings 09 00047 g003aCoatings 09 00047 g003b
Figure 4. GAXRD patterns of the LDHs coatings at different formation times.
Coatings 09 00047 g004
Figure 5. Weighted gain curves of the LDHs coatings at different formation times.
Coatings 09 00047 g005
Figure 6. The solubility of CO2 for a CO2–H2O system at different temperatures and pressures.
Coatings 09 00047 g006
Figure 7. Concentration of the HCO3/CO32− ions in the formation solution at different temperatures and pressures.
Coatings 09 00047 g007
Figure 8. The pH curves of the formation solution at different temperatures and pressures.
Coatings 09 00047 g008
Figure 9. Polarization curves of the LDHs coatings at different formation times in 3.5% NaCl solution.
Coatings 09 00047 g009
Figure 10. Hydrogen evolution curves of the LDHs coatings at different formation times in 3.5% NaCl solution.
Coatings 09 00047 g010
Figure 11. Optical corrosion morphologies of the LDHs coatings at different formation times after 120 h of immersion testing in 3.5% NaCl solution: (a1) 10 min sample immersed for 0 h; (a2) 10 min sample immersed for 24 h; (a3) 10 min sample immersed for 48 h; (a4) 10 min sample immersed for 72 h; (a5) 10 min sample immersed for 120 h; (b1) 20 min sample immersed for 0 h; (b2) 20 min sample immersed for 24 h; (b3) 20 min sample immersed for 48 h; (b4) 20 min sample immersed for 72 h; (b5) 20 min sample immersed for 120 h; (c1) 30 min sample immersed for 0 h; (c2) 30 min sample immersed for 24 h; (c3) 30 min sample immersed for 48 h; (c4) 30 min sample immersed for 72 h; (c5) 30 min sample immersed for 120 h; (d1) 40 min sample immersed for 0 h; (d2) 40 min sample immersed for 24 h; (d3) 40 min sample immersed for 48 h; (d4) 40 min sample immersed for 72 h; (d5) 40 min sample immersed for 120 h; (e1) 1 h sample immersed for 0 h; (e2) 1 h sample immersed for 24 h; (e3) 1 h sample immersed for 48 h; (e4) 1 h sample immersed for 72 h; (e5) 1 h sample immersed for 120 h.
Coatings 09 00047 g011
Figure 12. The result of the comparison with the state-of-the-art technology of the immersion test in 3.5% NaCl solution: (a) CO2_24 h sample immersed for 48 h, (b) CO2_2 h/pH 11.5_2 h sample immersed for 48 h, (c) CO2_3 MPa_0.5 h sample immersed for 48 h.
Coatings 09 00047 g012
Table 1. Apparent activation energy at the three growth stages of the LDH coatings.
Condition10 min, 50 °C20 min, 50 °C30 min, 50 °C
Δm (mg)1.391.811.412.061.412.17
Ea
(KJ mol−1)
21.7831.8634.92
Table 2. The values of the general constants.
i A i B i
10.4430.115
21.284−0.921
30.3561.708
40.545−0.171
50.5280.349
60.4840.754
70.071−0.044
80.5041.322
90.0310.179
100.0730.463
110.006−0.022
Table 3. Electrochemical parameters of the LDHs conversion coatings at different times.
SampleEcorr (V vs. SCE)Icorr (μA cm−2)Efficiency %
AZ91D−1.41 (0.059)83.62 (1.67)-
10 min−1.39 (0.047)30.11 (1.69)63.99%
20 min−1.37 (0.031)10.53 (1.63)87.41%
30 min−1.36 (0.034)8.92 (1.63)89.33%
40 min1.38 (0.042)20.19 (1.73)75.86%
1 h−1.39 (0.47)28.73 (1.62)65.64%

