Evaluation of Thermal Degradation of DLC Film Using a Novel Raman Spectroscopy Technique


1
School of Mechanical Engineering, Guizhou University, Guiyang 550025, China
2
Department of Mechanical Engineering, Texas Tech University, Lubbock, TX 79409, USA
*
Author to whom correspondence should be addressed.
Coatings 2018, 8(4), 143; https://doi.org/10.3390/coatings8040143
Submission received: 5 March 2018
/
Revised: 28 March 2018
/
Accepted: 4 April 2018
/
Published: 16 April 2018
Abstract
:Diamond-like carbon (DLC) films are extensively used in various industries due to their superior protective and lubrication properties. However, DLC films including sp2 and sp3 carbon bonding are metastable materials, which can be thermally degraded (or graphitized) at elevated temperature. In this study, a novel Raman spectroscopy technique was developed to evaluate the in-situ thermal stability of DLC films. When a laser beam is applied onto a DLC film, the surface temperature can increase depending on the laser power, laser duration time, and surface reflectivity. Based on this laser heating concept, the Raman spectrum data of DLC films (i.e., G peak position and width) were obtained at the controlled Raman laser power, which enabled to determine the critical temperature to initiate the thermal degradation of DLC films. Two different designs of DLC film (i.e., types A and B with different initial sp2-to-sp3 ratio) were prepared and their thermal stability was evaluated using the proposed Raman spectroscopy technique. From the systematic data analysis and comparison, it could be observed that the type-A DLC film showed the significant change of Raman parameters (i.e., G peak position and width) at lower laser power value (=lower temperature) than the type-B DLC film, which indicated that the type-B DLC film had better thermal stability.
1. Introduction
DLC films are widely used as a surface protective coating for many engineering and scientific devices due to the superior properties including enhanced mechanical strength, chemical inertness, self-lubricity, bio-compatibility, and low fabrication temperature. With these excellent properties, DLC films have been applied to the surface of cutting tools, razors, artificial joints, and components of internal combustion (IC) engine, solar panels, aircrafts, spacecrafts, and hard disk drives (HDD) [1,2,3,4,5]. Researchers found that a lubricated DLC film with ester containing oilcan decrease the coefficient of friction to ~0.006 [1]. When this superlubricity technology was applied to the valve lifter in automobile engine, the engine showed significant reduction of friction by more than 45% at the engine speed of 2000 rpm [1]. For the case of cutting tool material (i.e., carbide) that made sliding contact against aluminum alloy, the DLC coating could reduce the friction coefficient to ~0.1. In addition, the anti-adhering property of DLC film could reduce the formation of built-up edge, thereby increasing the cutting tool life [2]. DLC films can also act as an effective solid lubricant for the devices in which liquid type lubricants are not applicable. Vanhulsel et al. prepared highly hydrogenated DLC films on steel substrates that are used in spacecraft components and performed the ball-on-disk experiment. It was observed that the friction coefficient could be decreased to ~0.007 in vacuum condition [3].
It is known that material properties of DLC films can be adjusted by changing its sp2-to-sp3 bonding ratio as well as by including various additives. The sp3 bonding of carbon atoms provides diamond characteristics, while the sp2 bonding represents graphite structure. Accordingly, DLC films with higher fraction of sp3 bonding typically have higher mechanical strength and hardness, and vice versa. Based on contemporary DLC films, the tetrahedral amorphous carbon (abbreviated as ta-C) with the sp3 bonding fraction of ~80% enables to make the hardest amorphous carbon films (abbreviated as a-C), which can be prepared by filtered cathodic vacuum arc (FCVA), mass selected ion beam (MSIB), and pulsed laser deposition (PLD) methods [5].
Amorphous carbon is metastable and can change to a more graphitic state at elevated temperatures [6]. The higher sp3 bonding fraction leads to more thermal stability on amorphous carbon film. It has been reported that a DLC film prepared by PLD on Si substrate begins to show its thermal degradation at the temperature of 400 °C [7]. Interestingly, researchers heated a hydrogen-free ta-C film up to the temperature of 727 °C in vacuum for an hour, but no atomic structural change was found in the film [8]. It is noted that during the heating process, the transformation from sp3 to sp2-bonded carbon occurs only when the sp2 cluster size is big enough. The volume available for sp2 clustering increases with the decreasing of the sp3 fraction, which is the reason why the critical temperature to initiate the graphitization process on a DLC film becomes lowered with the decreasing sp3 fraction [9]. Liu et al. conducted pin-on-disk contact experiments using the DLC films deposited on SiC substrate. The graphitization rate decreased at low temperature conditions, which was attributed to the suppression of temperature rise at contact spots [10]. In addition, Lee et al. applied the theoretical mechanics and heat transfer models to simulate the micro-wear mechanism of DLC film under sliding contact. The simulation results showed that under the maximum contact pressure of 0.59–2.21 GPa the surface temperature of DLC film increased to 211.2–516.3 °C. It was claimed that the microwear of the DLC film could be caused by both mechanical stress and thermal degradation of DLC films [11]. Once a DLC film experiences the graphitization process, its mechanical strength can be significantly degraded, which consequently can lead to critical failure or malfunction of the devices. This thermomechanical wear mechanism of DLC film was verified through novel experiments and instrumentation. He et al. investigated the wear on the scratched and burnished DLC films on a head slider in HDD through micro-Raman spectroscopy, X-ray Photoelectron Spectroscopy (XPS), and nano-scratch experiments. Their results confirmed that the thermal degradation (i.e., graphitization) of DLC film could be caused by the mechanical stress and frictional temperature rise during the sliding surface contact [12]. In the HDD industry, amorphous DLC film has always been a crucial technology to secure head-media-spacing (HMS) budget and improve product reliability. Recently, the thermal flying height control (TFC) and the heat assisted magnetic recording (HAMR) technologies were applied to HDD design to achieve higher recording density [13,14,15], in which the thermal stability of DLC film could be more challenging to overcome.
In this study, a new Raman spectroscopy technique was developed to measure the critical temperature to initiate the graphitization process on amorphous DLC film. For the two types of DLC films, the Raman laser power gradually increased from 50 mW to 1.3 W so that the change in G and D peaks could be systematically measured and compared. From the measured Raman data and the calculated temperature rise on DLC film by laser heating, the critical temperature for graphitization process could be determined.
2. Materials and Methods
Two different designs of amorphous DLC film (called type-A & type-B) that were applied onto the surface of a commercial head slider in HDD were investigated with regard to their thermal stabilities. The thickness of DLC film was 2 nm with sp3 bonding fraction of ~80%. The two types of DLC film sample were prepared by different manufacturing processes. Type-A was made using the Plasma Enhanced Chemical Vapor Deposition (PECVD) method, while type-B DLC film was obtained using the Filtered Cathodic Arc (FCA) deposition method. Considering DLC properties are highly sensitive to the manufacturing method and parameters (i.e., Ar flow rate, Bias voltage, or incident energy or incident angle of carbon ion beam, etc.), the two types of DLC film sample should have different physical and chemical properties, which accordingly lead to different thermal stability. This study focused mainly on the development of new Raman spectroscopy technique to evaluate and compare the thermal stability of DLC film.
As shown in Figure 1, a customized micro-Raman spectroscopy instrument with the back scattering configuration was used to measure the critical temperature to initiate the thermal degradation of DLC films. The laser source had the wavelength of 514.5 nm and its focused beam on the sample surface had a diameter of 10 μm. A holographic notch filter was applied to get rid of the Rayleigh scattering line. An 1800 line/mm grating was used to disperse the reflected laser light onto a linear CCD camera that has 1204 pixels for collecting the spectrum. The spectral resolution of the system was 2.0 cm−1 and the precision was 0.2 cm−1 [16]. Figure 2 shows the optical microscope image of the tested head slider sample. The laser source was applied to the read/write sensor area, i.e., red-circle zone in Figure 2a, where the transparent DLC film was deposited over the underlying permalloy substrate, i.e., the white stripe area in Figure 2b.
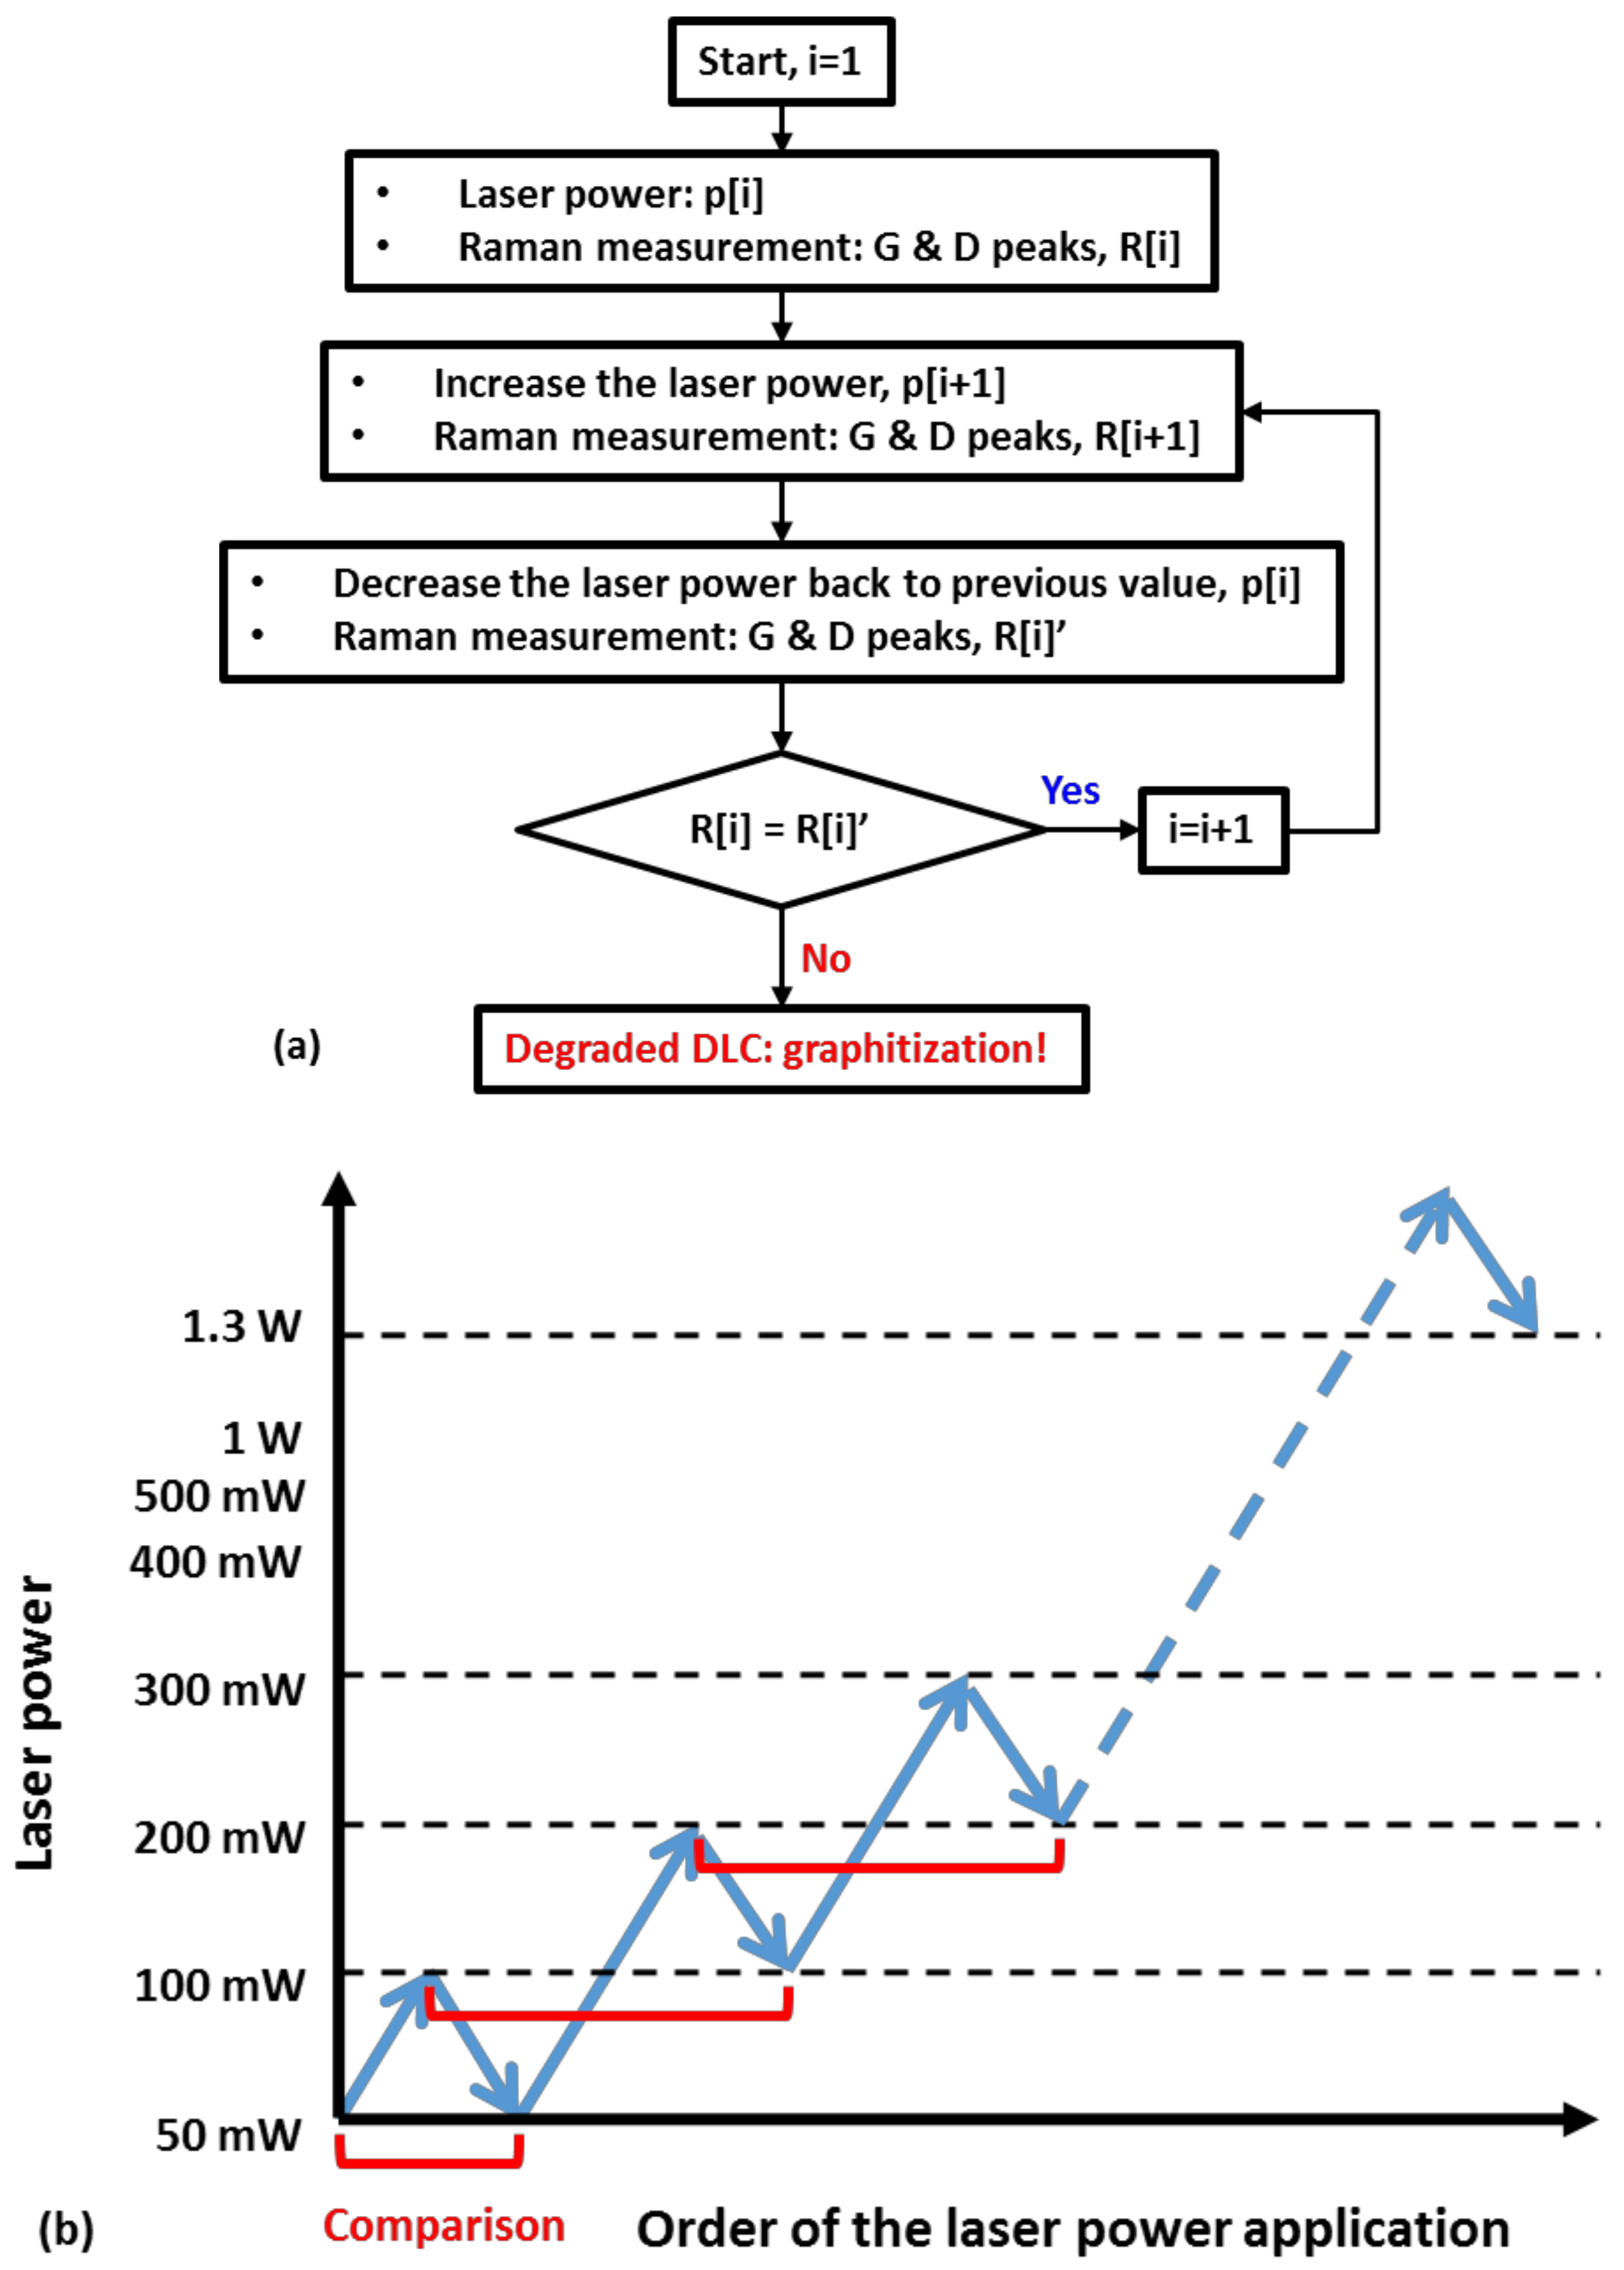
Considering the laser beam heats the sample surface, the laser power in Raman spectroscopy instrument was used to control the temperature of DLC films. In the experiment the laser power was increased from 50 mW to 1.3 W. The minimum laser power of 50 mW was chosen because it does not generate significant temperature rise on the DLC film, which accordingly enabled us to obtain the original DLC bonding structure from the measured Raman spectra. To ensure the accuracy of the Raman characterization, the measurement was performed on the same location of the DLC film, and at each laser power condition the average spectrum was used to get rid of the noise peaks. Figure 3 shows the descriptive scheme of the new Raman spectroscopy technique to measure the critical laser power to initiate the thermal degradation of DLC film. Firstly, the experiment starts with the laser power of 50 mW, p[i], and the Raman data (i.e., G peak position and width) of the DLC film is obtained, R[i]. Next, the laser power is increased by a specific value, p[i+1], and the Raman data is obtained, R[i+1]. After then, the laser power is decreased back to the previous value, p[i], and the corresponding Raman data is measured again, R[i]’, which is compared to the previous Raman data, R[i]. If R[i]’ shows significant difference from R[i] in terms of G peak position and width, it indicates that the increased power p[i+1] would have changed the atomic structure of DLC film. Accordingly, this laser power could be used to calculate the critical temperature to initiate the thermal degradation of the DLC film. On the other hand, if the Raman data does not change, R[i] = R[i]’, the experiment moves to next loop with increasing laser power. It is noted that for the Raman measurement at each laser power, the data acquisition time (or heating time) was 3 min, and the three consecutive measurements were conducted providing the averaged results of Raman parameters of DLC film. The peak curve fitting of the raw Raman spectra was conducted using PeakFit® software (Systat Software Inc., San Jose, CA, USA), which could provide the bonding structure information like sp2 and sp3 bonding.
3. Results and Discussion
3.1. Micro-Raman Spectroscopy Characterization: G Peak Position and Width
From the Raman spectrum of amorphous DLC film, two characteristic bands called the D and G bands are obtained, which are usually located at around 1350 cm−1 and 1560 cm−1 in the spectrum, respectively. Figure 4 shows representative Raman spectra for type-A DLC film before and after its thermal degradation. Using the peak fitting technique, the D and G peaks could be extracted from the raw spectrum. It is known that the G band is caused by the stretching mode of C–C single bond, while the D band is caused by the breathing mode of carbon rings, i.e., mostly at the boundaries of the sp2 clusters [5]. Accordingly, the characteristics of the G and D bands can be used to analyze the change in bond structure of amorphous DLC film. In particular, for the G band, the peak location and the full width at half maximum (FWHM, or simply called G peak width) are directly related to the carbons’ bonding structure. The G peak position increases with the sp2/sp3 bonding ratio, while the G peak width is inversely proportional to the number and size of sp2 clusters inside the amorphous DLC film [17,18]. For example, comparing the Raman spectra of DLC film before and after thermal degradation in Figure 4, the thermally degraded (or graphitized) DLC (Figure 4b) shows higher G peak position and narrower G peak width than the original DLC (Figure 4a). Therefore, in this study, the two parameters of G band, i.e., G peak position and width, were measured and used to discuss the thermal degradation of amorphous DLC film.
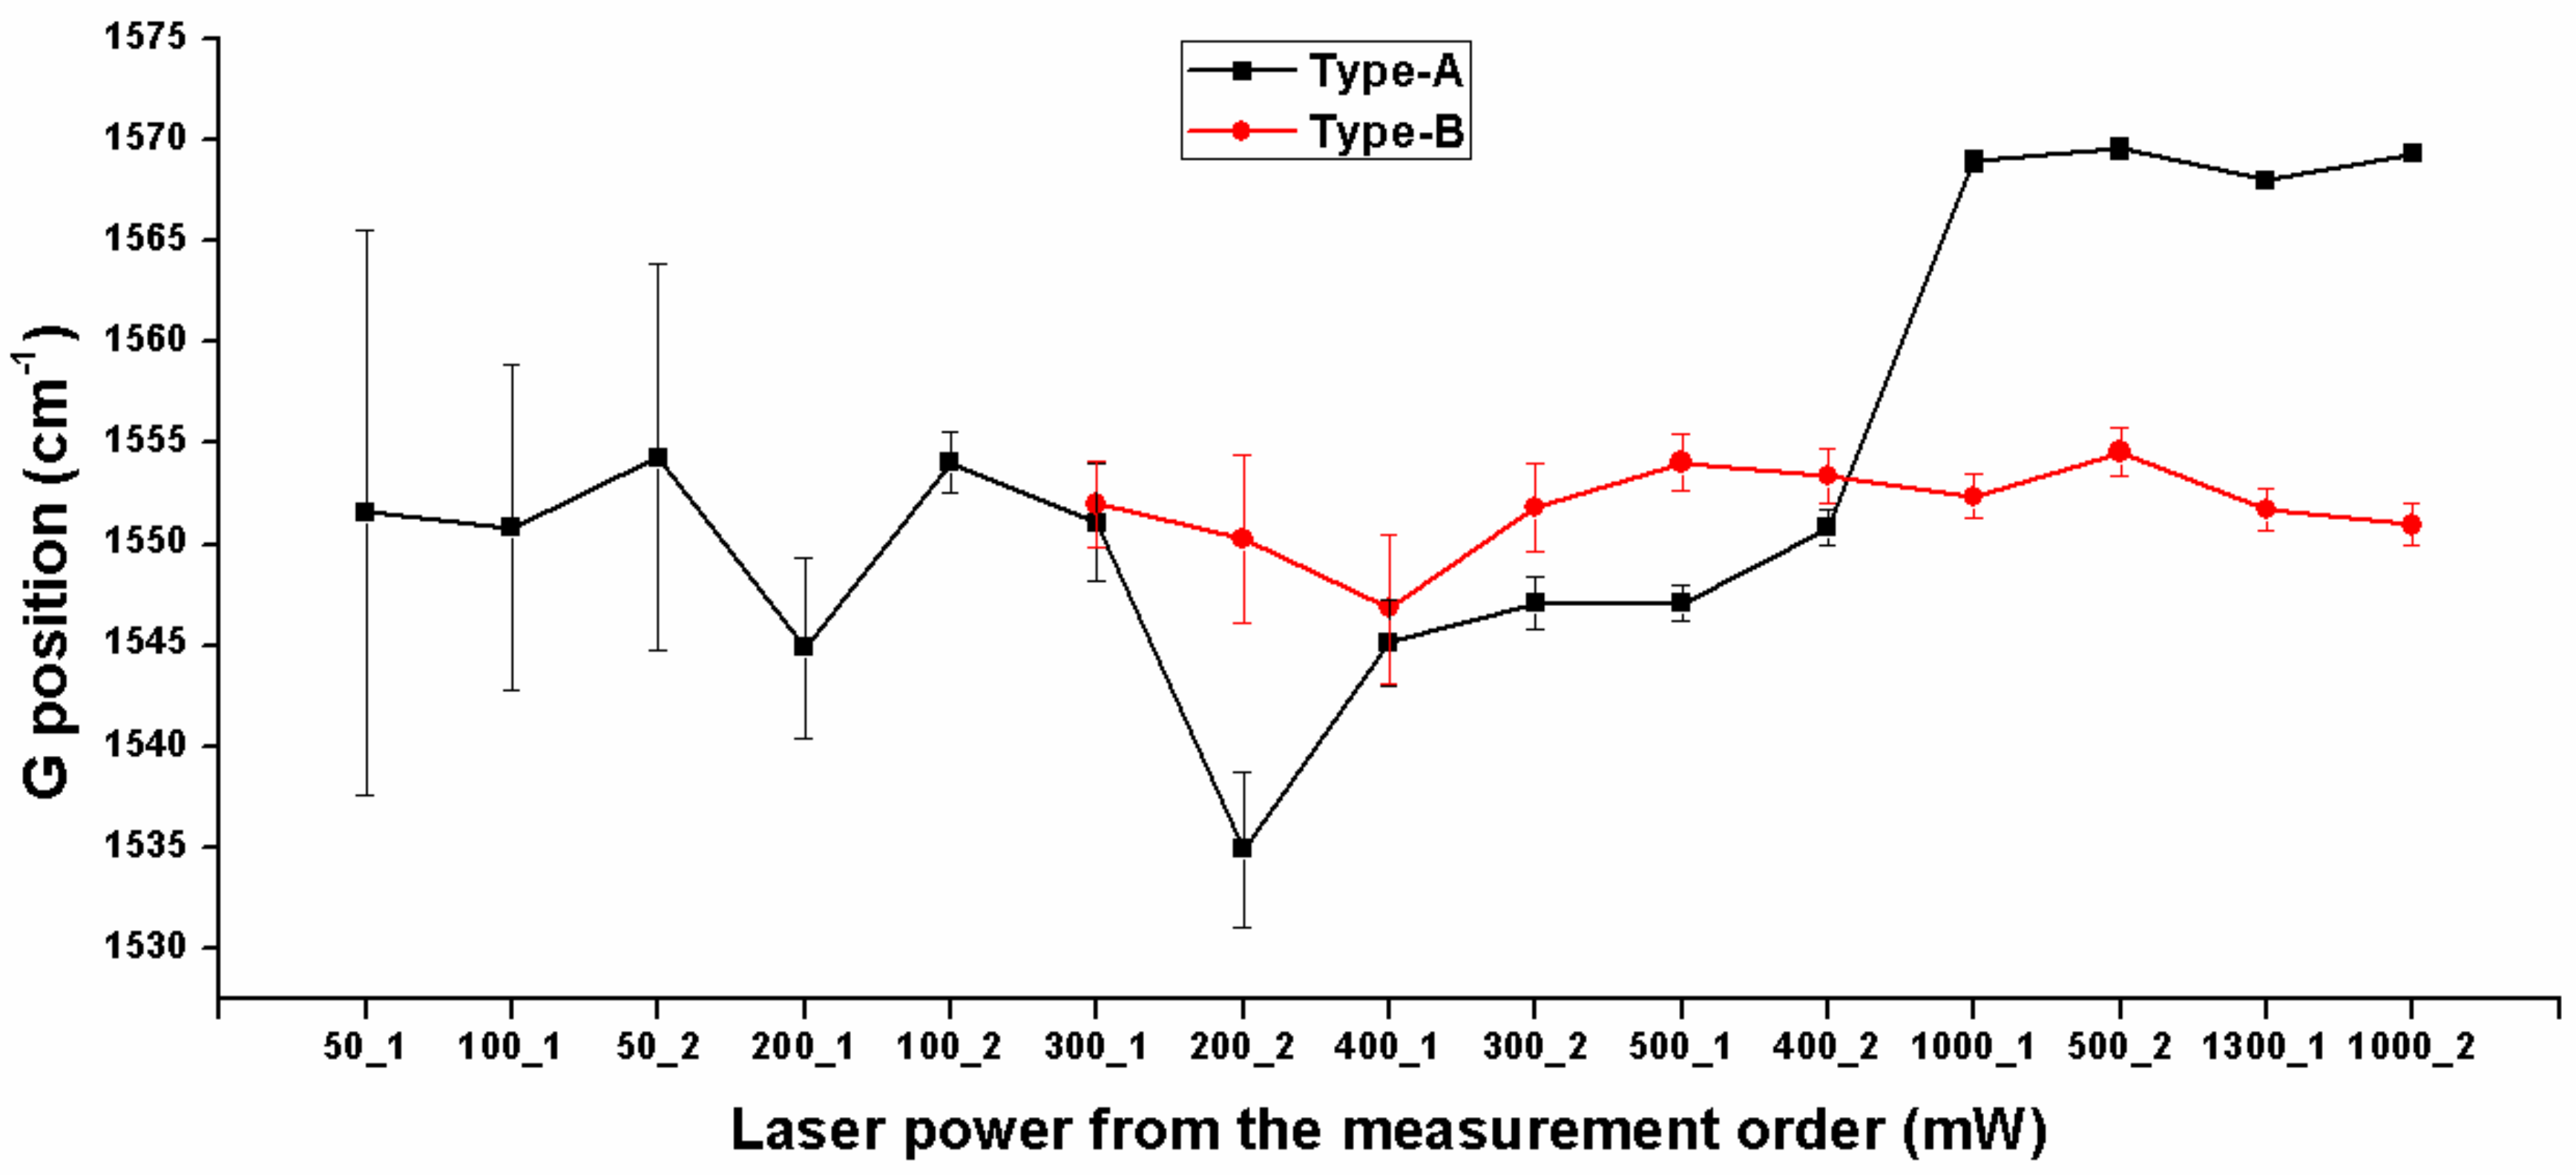
Figure 5 shows the measured G peak position values with respect to the laser power, where the black-square and red-circle symbols are the type-A and type-B DLC film, respectively, and the error bars represent one standard derivation of the peak fitting results determined by PeakFit® software. The bigger standard deviation at lower laser power would be attributed to the weaker Raman spectra signal. The type-A DLC film sample produced reasonable Raman spectra at the laser power from 50 mW to 1.3 W, whereas the Raman spectra signal for the type-B DLC film sample was pretty weak at low laser power condition. For this reason, the Raman parameters of the type-B DLC film could be measured at laser power greater than 200 mW. It is noted that the x-axis in Figure 5 is the applied laser power of Raman measurement following the methodology described in Figure 3, which enables one to check the thermal degradation of DLC film at the specified laser power. Examining the measured G peak position values in Figure 5, first, it was observed that the initial G peak position was ~1552 cm−1 for both types of DLC films, which is in agreement with the reported Raman data for similar DLC samples [19]. Next, for the case of the type-A DLC film, its G peak position did not show significant change until the laser power reached 500 mW. However, when the laser power increased to 1 W, the G peak position significantly jumped from 1547.1 to 1568.9 cm−1. This indicates that the sp2 bonding fraction in the type-A DLC film steeply increased at the laser power of 1 W leading to the conclusion that the type-A DLC film developed significant graphitization process or thermal degradation. After then, even at the higher laser power, the G peak position did not return to the previous point but permanently changed to the high value close to 1568.9 cm−1. From these trends of G peak position values, it could be found that the critical laser power to initiate the thermal degradation on the type-A DLC film would be in between 0.5 and 1 W. At the highest laser power of 1.3 mW, the type-A DLC film still showed the degraded condition, whose G peak position remained almost the same as the value at 1 W. Lastly, for the case of type-B DLC film, it was observed that its G peak position value stayed at the constant value of ~1551.8 cm−1 at all laser powers, which indicates that the type-B DLC film did not undergo any significant change in bond structure and accordingly showed reasonable thermal stability under the tested laser power range [17].
Figure 6 plots the measured G peak width values with respect to the laser power. First, the type-A DLC film showed an overall degreasing trend from 125.3 to 47.8 cm−1 with the laser power, which implies that the sp2 clusters in the type-A DLC film would become larger by the laser heating. In particular, the type-A DLC film made the significant decrease of G peak width at the two laser power values of 400 mW and 1 W. Based on the comparison data between the G peak position and width for the type-A DLC film, it could be found that their overall trend with the laser power was in agreement (i.e., the higher laser power caused its thermal degradation) but the change in sp2 clusters did not always lead to the change of sp2/sp3 bonding ratio. Considering some sp2-bonded carbons in the DLC film would not have formed clusters, it is possible that the trend of G peak position with the laser power could not comply with the trend of G peak width exactly. Next, the type-B DLC film showed a constant G peak width value close to 63.2 cm−1 throughout the measurements, which indicates that the size and number of sp2 clusters in the type-B DLC film did not change significantly at the range of applied laser power.
Based on the results of Figure 5 and Figure 6, it could be confirmed that the thermal stability of a DLC film can be conveniently determined by the proposed scheme that uses Raman spectroscopy. In this experiment comparing the two designs of DLC film, it was found that the type-B DLC film has better thermal stability than the type-A DLC film. The critical temperature to initiate the thermal degradation of the type-A DLC film can be calculated using the corresponding laser power, which is described in the following section.
3.2. Caculation of Temperature Rise by Laser Heating
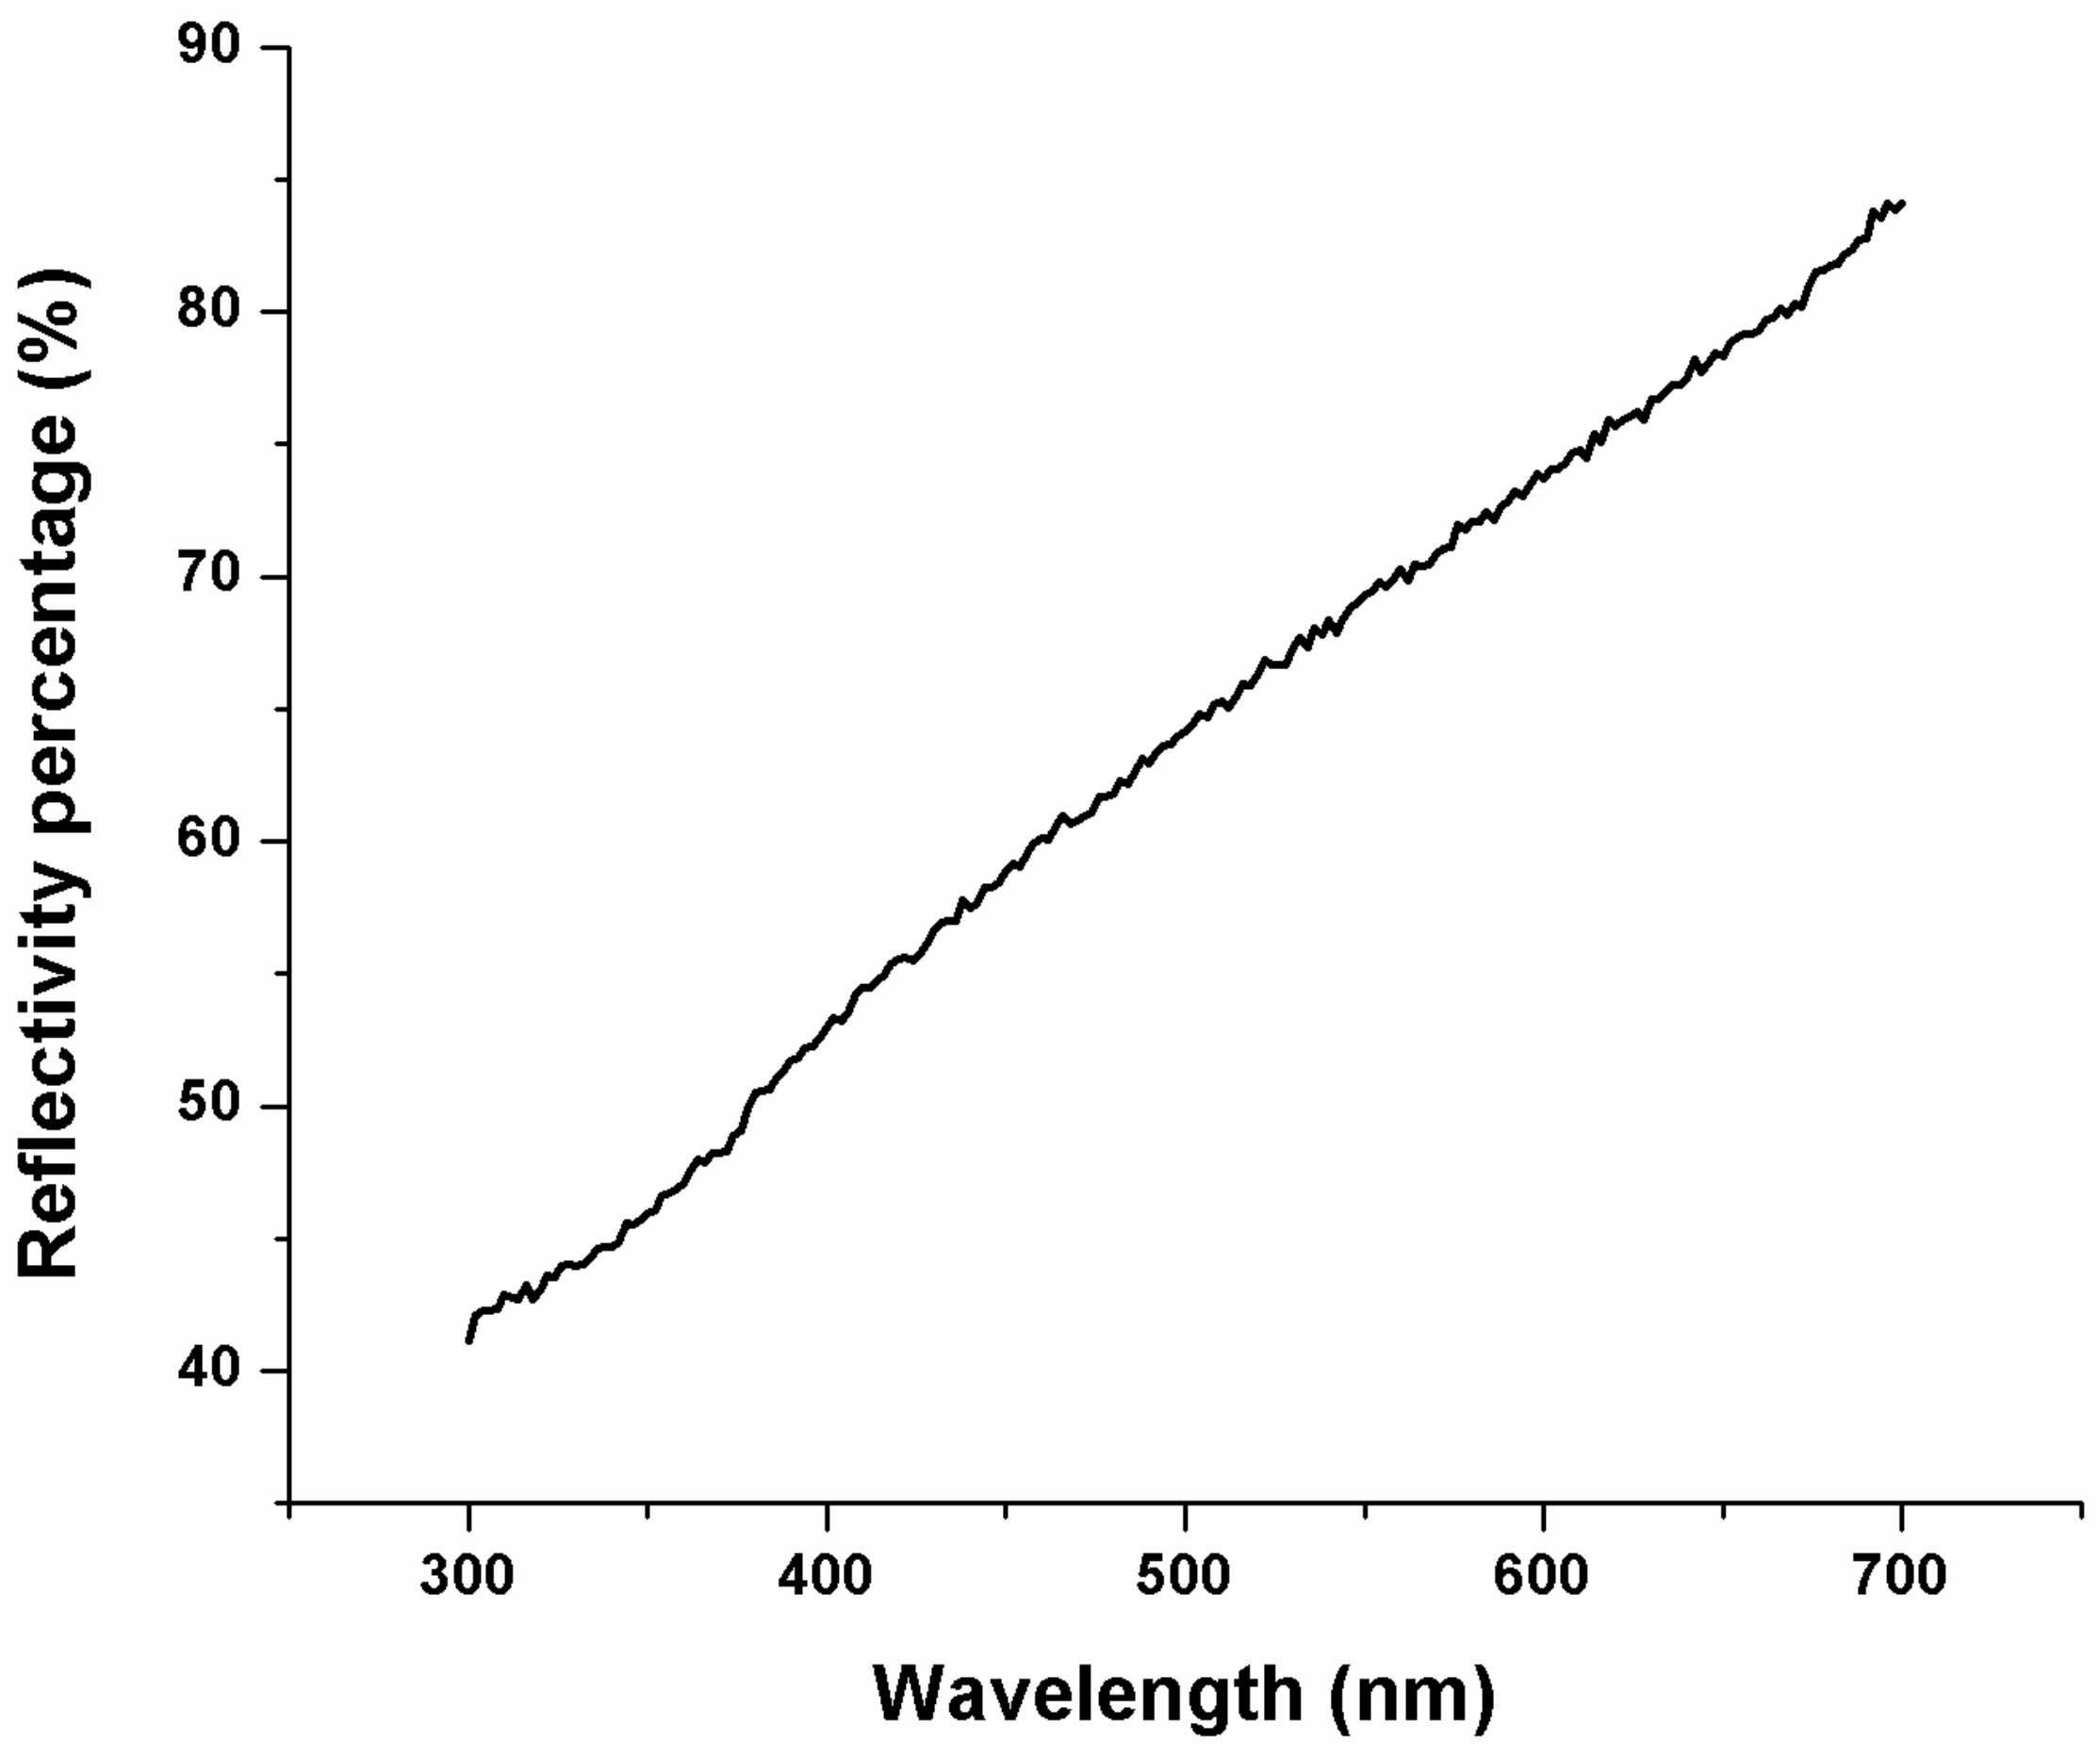
When a laser source is applied onto a solid surface, the amount of adsorbed heat energy is dependent on its reflectivity R. In this experiment, the reflectivity of the tested head slider sample was measured using UV-3600 UV-VIS spectrophotometer by Shimadzu Scientific Instruments® (Shimadzu Corporation, Kyoto, Japan). As shown in Figure 2, the reflectivity was obtained at the same spot as the Raman measurement. Figure 7 shows the measured reflectivity values with respect to the wavelength. Since the wavelength of the Raman laser was 514.4 nm, it could be determined that the actual reflectivity during the Raman spectroscopy measurement would be ~0.655. It is noted that as the DLC film of the tested head slider sample was close to diamond characteristics with sp3 bonding fraction of ~80%, they could be assumed to be transparent and thus most of the laser source could be directly transmitted to the underlying permalloy (NiFe) substrate [20]. This means that the measured reflectivity value in Figure 7 would be actually obtained from the underlying permalloy substrate. Accordingly, under the Raman laser application, the underlying permalloy substrate would be heated first, which in turn increases the temperature of the upper DLC film.
Assuming the permalloy substrate can be modeled as a homogeneous half-space on which a continuous and uniform circular heat source is applied, the maximum steady state temperature rise ∆ss can be calculated by the formula below [21]:
where R is the reflectivity of the tested head slider sample (or permalloy substrate), Q is the laser power, a is the laser beam diameter, and k is the thermal conductivity of permalloy. Table 1 summarizes the calculated surface temperature of the DLC films, Ts, during the Raman spectroscopy measurements, which was based on the input parameters of R = 0.655, Q = 50 mW~1.3 W, a = 10 μm, k = 15 W/mK, and initial surface temperature Ti = 20 °C.
Examining the results in Table 1 in relation to the critical laser power to cause sudden change in G peak position (Figure 5) and width (Figure 6), it was found that the type-A DLC film underwent a significant graphitization process at temperatures between 386.1 and 752.1 °C, while its sp2 clusters became larger at temperatures between 239.6 and 312.8 °C. This calculated temperature for the thermal degradation of DLC film was in agreement with the values reported by other researchers [7,8,9].
4. Conclusions
In this study, a novel Raman spectroscopy technique was proposed to evaluate the thermal degradation (or graphitization process) of DLC films, where the Raman laser power was used to control the sample temperature. For the two types of amorphous DLC films (type A & B), two Raman parameters (i.e., G peak position and width) were measured with respect to the laser power from 50 mW to 1.3 W. It was observed that the type-A DLC film showed a sudden increase of G peak position at the laser power of 1W, which indicates that its sp2-to-sp3 bond ratio significantly increased between the temperatures of 386.1 and 752.1 °C, while the G peak width of the type-A DLC film experienced a sudden drop at the laser power of 400 mW, which indicated that its sp2 clusters became significantly larger between the temperatures 239.6 and 312.8 °C. Compared to the type-A DLC film, the type-B DLC film did not show any significant change in G peak position or width throughout the experiment, which implies that the type-B DLC film had better thermal stability. Therefore, from the results of this study, it was found not only that the proposed Raman spectroscopy technique can be useful to evaluate the thermal stability of DLC films, but it also can be a convenient tool to compare the robustness of DLC design. In addition, the critical temperature to initiate the thermal degradation of DLC film can also be simply determined using the Equation (1).
Acknowledgments
This research was supported by grants from Seagate Technology under Agreement Number 152280, and startup research grant from Guizhou University under agreement Number (2017) 25. The authors gratefully acknowledge these supports.
Author Contributions
Muyang He and Changdong Yeo conceived and designed the experiments; Muyang He performed the experiments and temperature calculation; Muyang He and Changdong Yeo conducted data analysis and wrote the paper.
Conflicts of Interest
The authors declare no conflict of interest. The funding sponsors had no role in the design of the study; in the collection, analyses, or interpretation of data; in the writing of the manuscript, and in the decision to publish the results.
References
- Kano, M. Super low friction of DLC applied to engine cam follower lubricated with ester-containing oil. Tribol. Int. 2006, 39, 1682–1685. [Google Scholar] [CrossRef]
- Fukui, H.; Okida, J.; Omori, N.; Moriguchi, H.; Tsuda, K. Cutting performance of DLC coated tools in dry machining aluminum alloys. Surf. Coat. Technol. 2004, 187, 70–76. [Google Scholar] [CrossRef]
- Vanhulsel, A.; Velasco, F.; Jacobs, R.; Eersels, L.; Havermans, D.; Roberts, E.W.; Sherrington, I.; Anderson, M.J.; Gaillard, L. DLC solid lubricant coatings on ball bearings for space applications. Tribol. Int. 2007, 40, 1186–1194. [Google Scholar] [CrossRef]
- Österle, W.; Klaffke, D.; Griepentrog, M.; Gross, U.; Kranz, I.; Knabe, C. Potential of wear resistant coatings on Ti-6Al-4V for artificial hip joint bearing surfaces. Wear 2008, 264, 505–517. [Google Scholar] [CrossRef]
- Robertson, J. Diamond-like amorphous carbon. Mater. Sci. Eng. R Rep. 2002, 37, 129–281. [Google Scholar] [CrossRef]
- Grill, A. Diamond-like carbon: state of the art. Diam. Relat. Mater. 1999, 8, 428–434. [Google Scholar] [CrossRef]
- Jung, H.; Park, H.; Sik, S.; Yeo, S. The structural and electron field emission characteristics of pulsed laser deposited diamond-like carbon films with thermal treatment. Thin Solid Films 1999, 356, 151–156. [Google Scholar] [CrossRef]
- McKenzie, D.R.; Yin, Y.; Marks, N.A.; Davis, C.A.; Pailthorpe, B.A.; Amaratunga, G.A.J.; Veerasamy, V.S. Hydrogen-free amorphous carbon preparation and properties. Diam. Relat. Mater. 1994, 3, 353–360. [Google Scholar] [CrossRef]
- Lifshitz, Y. Carbon forms structured by energetic species: Amorphous, nanotubes, and crystalline. In The Dekker Encyclopedia of Nanoscience and Nanotechnology; Nalwa, H.S., Ed.; CRC Press: New York, NY, USA, 2014; pp. 1369–1378. ISBN 978-1-4398-9134-6. [Google Scholar]
- Liu, Y.; Erdemirb, A.; Meletis, E.I. Influence of environmental parameters on the frictional behavior of DLC coatings. Surf. Coat. Technol. 1997, 94–95, 463–468. [Google Scholar] [CrossRef]
- Lee, S.; Yeo, C.-D. Microwear mechanism of head carbon film during head disk interface sliding contact. Tribol. Int. 2012, 45, 30–37. [Google Scholar] [CrossRef]
- He, M.; Lee, S.; Yeo, C.-D. Investigating atomic structure of thin carbon film under mechanical stress and frictional heat generation. Surf. Coat. Technol. 2015, 261, 79–85. [Google Scholar] [CrossRef]
- Rottmayer, R.E.; Batra, S.; Buechel, D.; Challener, W.A.; Hohlfeld, J.; Kubota, Y.; Li, L.; Lu, B.; Mihalcea, C.; Mountfield, K.; et al. Heat-Assisted Magnetic Recording. IEEE Trans. Magn. 2006, 42, 2417–2421. [Google Scholar] [CrossRef]
- Pathem, B.K.; Guo, X.C.; Rose, F.; Wang, N.; Komvopoulos, K.; Schreck, E.; Marchon, B. Carbon overcoat oxidation in heat-assisted magnetic recording. IEEE Trans. Magn. 2013, 49, 3721–3724. [Google Scholar] [CrossRef]
- Suk, M.; Miyake, K.; Kurita, M.; Tanaka, H.; Saegusa, S.; Robertson, N. Verification of thermally induced nanometer actuation of magnetic recording transducer to overcome mechanical and magnetic spacing challenges. IEEE Trans. Magn. 2005, 41, 4350–4352. [Google Scholar] [CrossRef]
- Ahmad, I.; Holtz, M.; Faleev, N.N.; Temkin, H. Dependence of the stress-temperature coefficient on dislocation density in epitaxial GaN grown on a-Al2O3 and 6H-SiC substrates. J. Appl. Phys. 2004, 95, 1692–1697. [Google Scholar] [CrossRef]
- Lewis, W.A. The use of Raman spectroscopy to monitor the quality of carbon overcoats in disk drive industry. In Handbook of Raman Spectroscopy; Lewis, I.R., Edwards, H.G.M., Eds.; Marcel Dekker, Inc.: New York, NY, USA, 2001; pp. 975–998. ISBN 0-8247-0557-2. [Google Scholar]
- Ferrari, A.C. Diamond-like carbon for magnetic storage disks. Surf. Coat. Technol. 2004, 180–181, 190–206. [Google Scholar] [CrossRef]
- Tamor, M.A.; Vassel, W.C. Raman “fingerprinting” of amorphous carbon films. J. Appl. Phys. 1994, 76, 3823–3830. [Google Scholar] [CrossRef]
- Nakahigashi, T.; Tanaka, Y.; Miyake, K.; Oohara, H. Properties of flexible DLC film deposited by amplitude-modulated RF P-CVD. Tribol. Int. 2004, 37, 907–912. [Google Scholar] [CrossRef]
- Kennedy, F.E.B. Frictional heating and contact temperatures. In Modern Tribology Handbook; Bhushan, B., Ed.; CRC Press: New York, NY, USA, 2000; Volume 1, pp. 227–264. ISBN 978-0-8493-8403-5. [Google Scholar]
Figure 1.
Schematic of micro-Raman instrument.
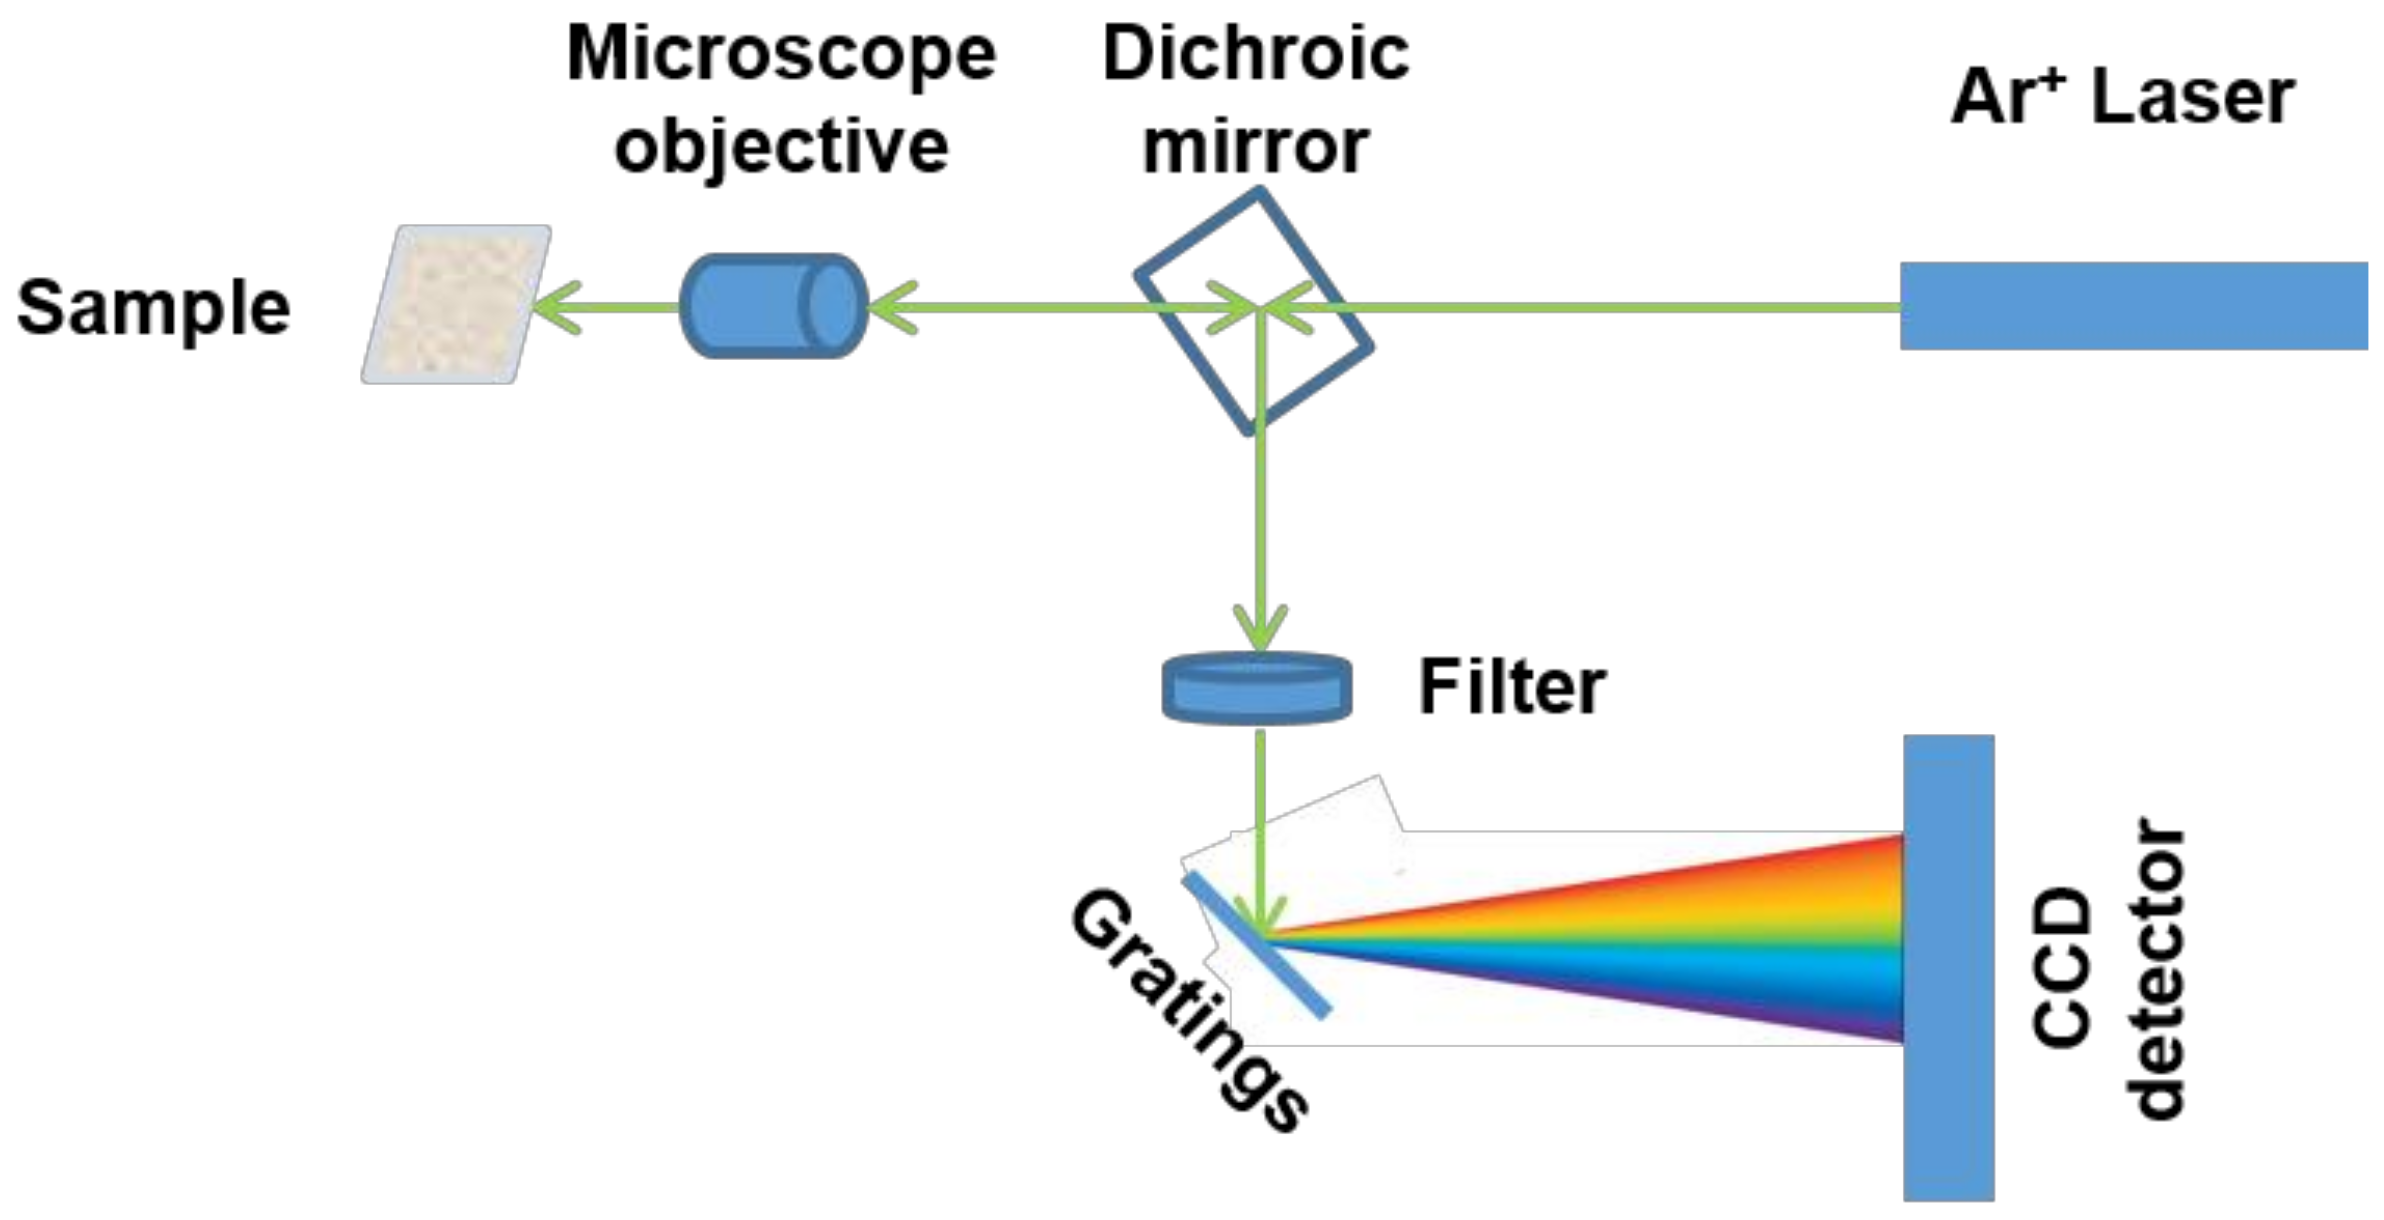
Figure 2.
The optical microscope image of the tested head slider sample: (a) The head slider sample having a transparent DLC film on surface; (b) The Raman spectrum and reflectivity were measured on the NiFe substrate area (white stripe zone).
Figure 2.
The optical microscope image of the tested head slider sample: (a) The head slider sample having a transparent DLC film on surface; (b) The Raman spectrum and reflectivity were measured on the NiFe substrate area (white stripe zone).
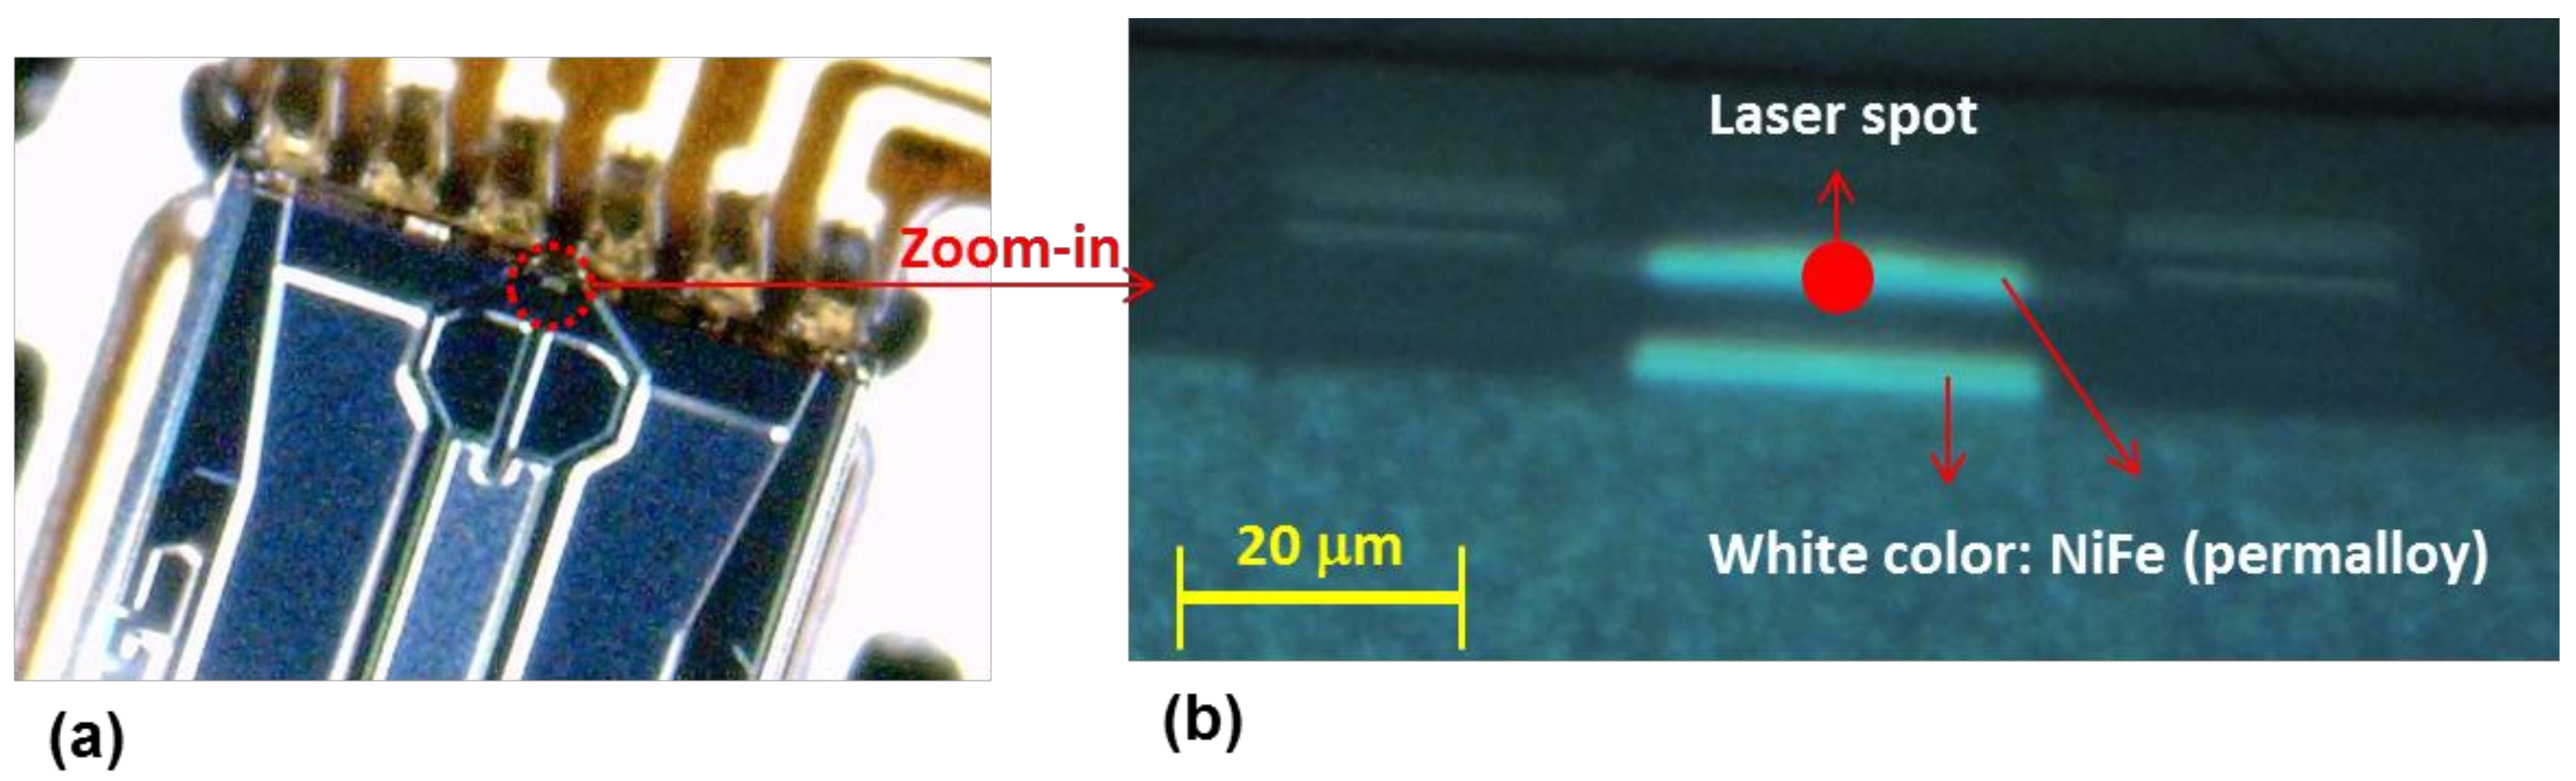
Figure 3.
New Raman spectroscopy technique to determine the thermal degradation of DLC film: (a) Flow chart to Raman experiment; (b) the laser power setting used in this experiment.
Figure 3.
New Raman spectroscopy technique to determine the thermal degradation of DLC film: (a) Flow chart to Raman experiment; (b) the laser power setting used in this experiment.

Figure 4.
The measured Raman spectrum for type-A DLC film (a) before and (b) after thermal degradation at the laser power of 1 W. The 3 small peaks around 1300 cm-1 are caused by the lab-made Raman instrument.
Figure 4.
The measured Raman spectrum for type-A DLC film (a) before and (b) after thermal degradation at the laser power of 1 W. The 3 small peaks around 1300 cm-1 are caused by the lab-made Raman instrument.
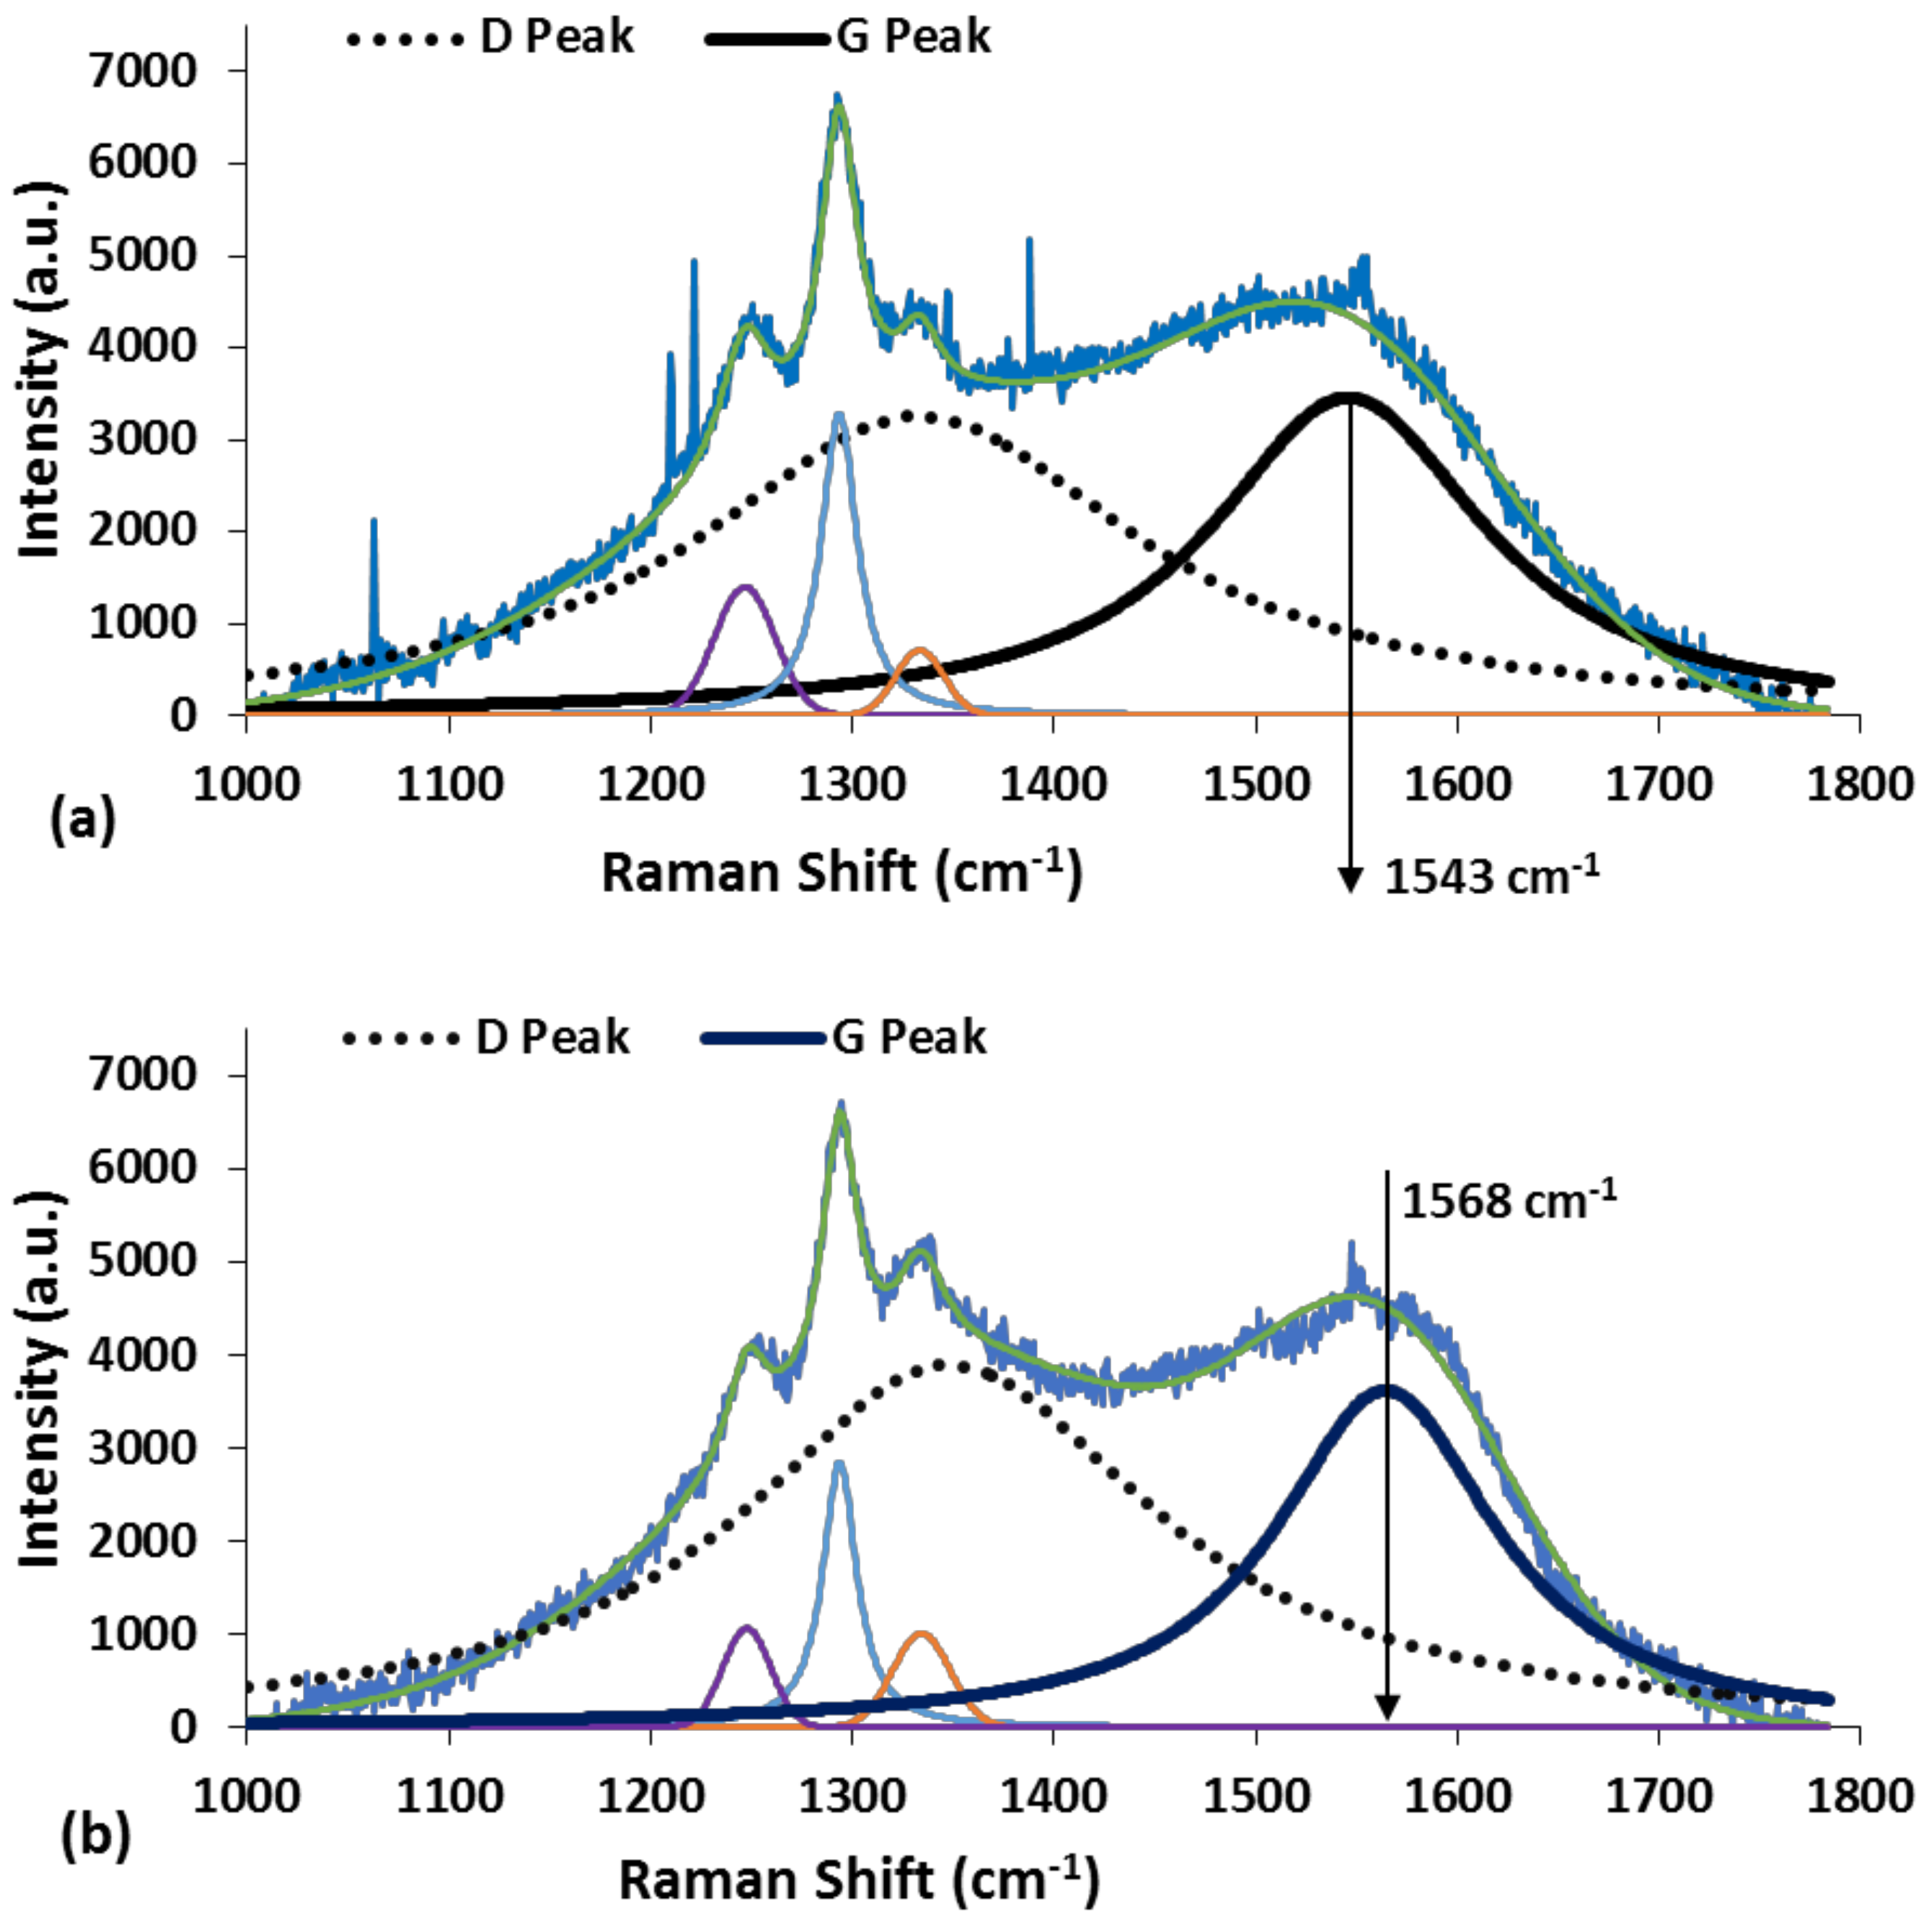
Figure 5.
The measured G peak position for the two types of DLC film with respect to laser power, where the x-axis is the input laser power in the order of measurement. Note: For the mark of x-axis, the first number is the input laser power and the second number is the order of measurement (e.g., ‘50_2’ means the 2nd measurement at the laser power of 50 mW).

Figure 6.
The measured G peak width (FWHM) for the two types of DLC film with respect to laser power, where the x-axis the input laser power in the order of measurement. Note that on the x-axis, the first number is the input laser power and the second number is the order of measurement (e.g., ‘50_2’ means the 2nd measurement at the laser power of 50 mW).
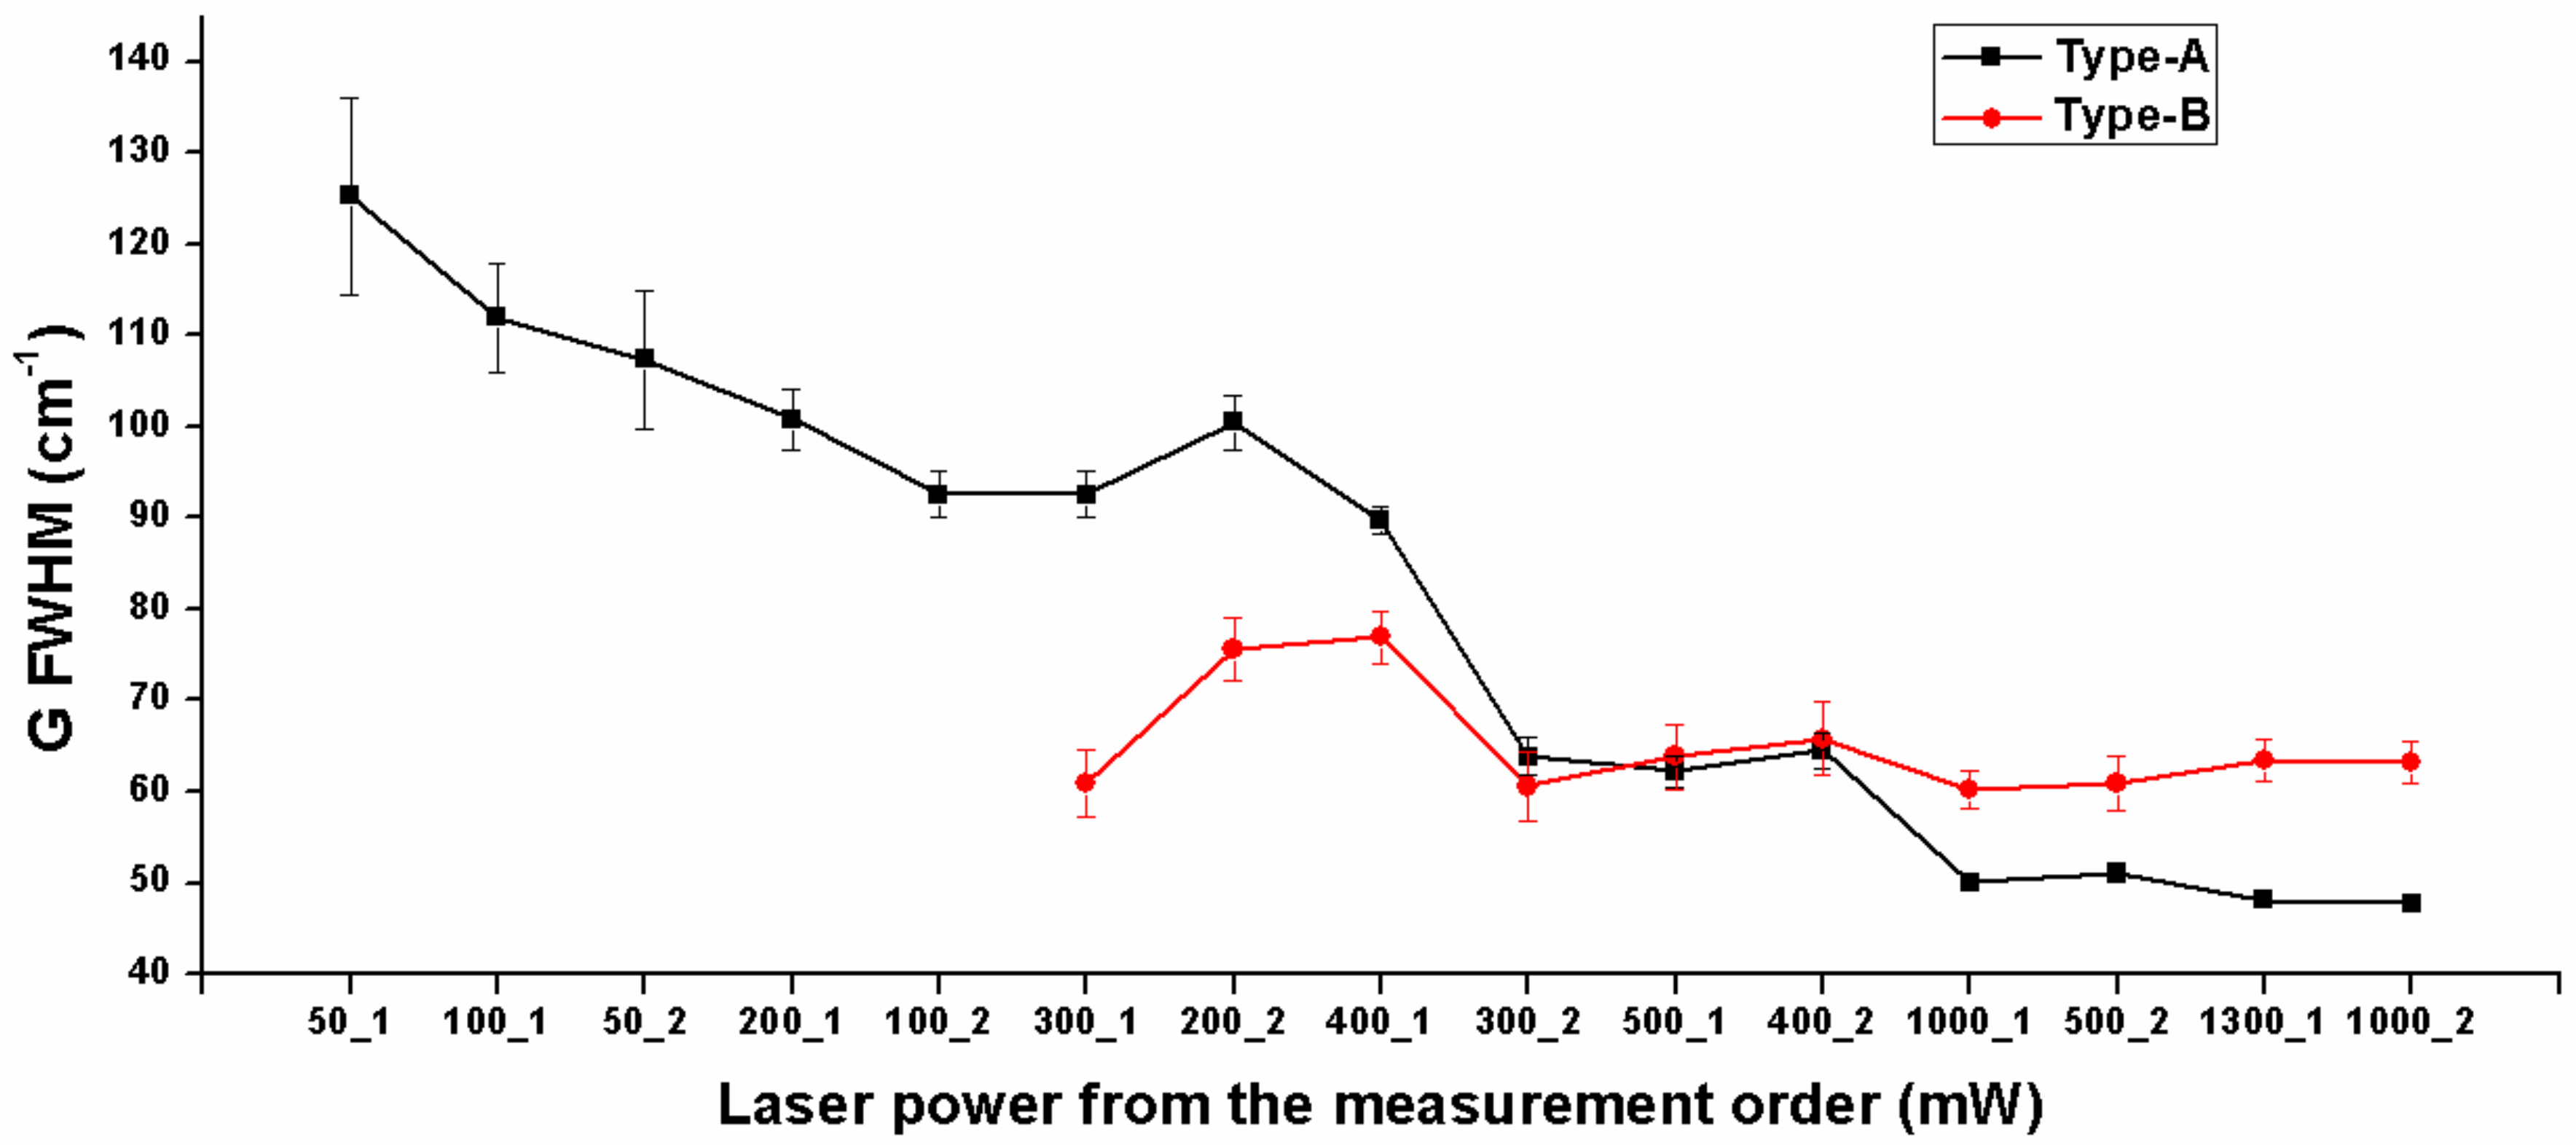
Figure 7.
The measured reflectivity for the head slider sample based on the area of permalloy substrate.
Figure 7.
The measured reflectivity for the head slider sample based on the area of permalloy substrate.


Table 1.
The calculated surface temperature of the DLC film at different laser powers.
| Laser Power (mW) | Ts of DLC Film (°C) |
|---|---|
| 50 | 56.6 |
| 100 | 93.2 |
| 200 | 166.4 |
| 300 | 239.6 |
| 400 | 312.8 |
| 500 | 386.1 |
| 1000 | 752.1 |
| 1300 | 971.7 |
© 2018 by the authors. Licensee MDPI, Basel, Switzerland. This article is an open access article distributed under the terms and conditions of the Creative Commons Attribution (CC BY) license (http://creativecommons.org/licenses/by/4.0/).
Share and Cite
MDPI and ACS Style
He, M.; Yeo, C. Evaluation of Thermal Degradation of DLC Film Using a Novel Raman Spectroscopy Technique. Coatings 2018, 8, 143. https://doi.org/10.3390/coatings8040143
AMA Style
He M, Yeo C. Evaluation of Thermal Degradation of DLC Film Using a Novel Raman Spectroscopy Technique. Coatings. 2018; 8(4):143. https://doi.org/10.3390/coatings8040143
Chicago/Turabian StyleHe, Muyang, and Changdong Yeo. 2018. "Evaluation of Thermal Degradation of DLC Film Using a Novel Raman Spectroscopy Technique" Coatings 8, no. 4: 143. https://doi.org/10.3390/coatings8040143
Note that from the first issue of 2016, this journal uses article numbers instead of page numbers. See further details here.