Oxidation Simulation of Thermal Barrier Coatings with Actual Microstructures Considering Strength Difference Property and Creep-Plastic Behavior

Abstract
:1. Introduction
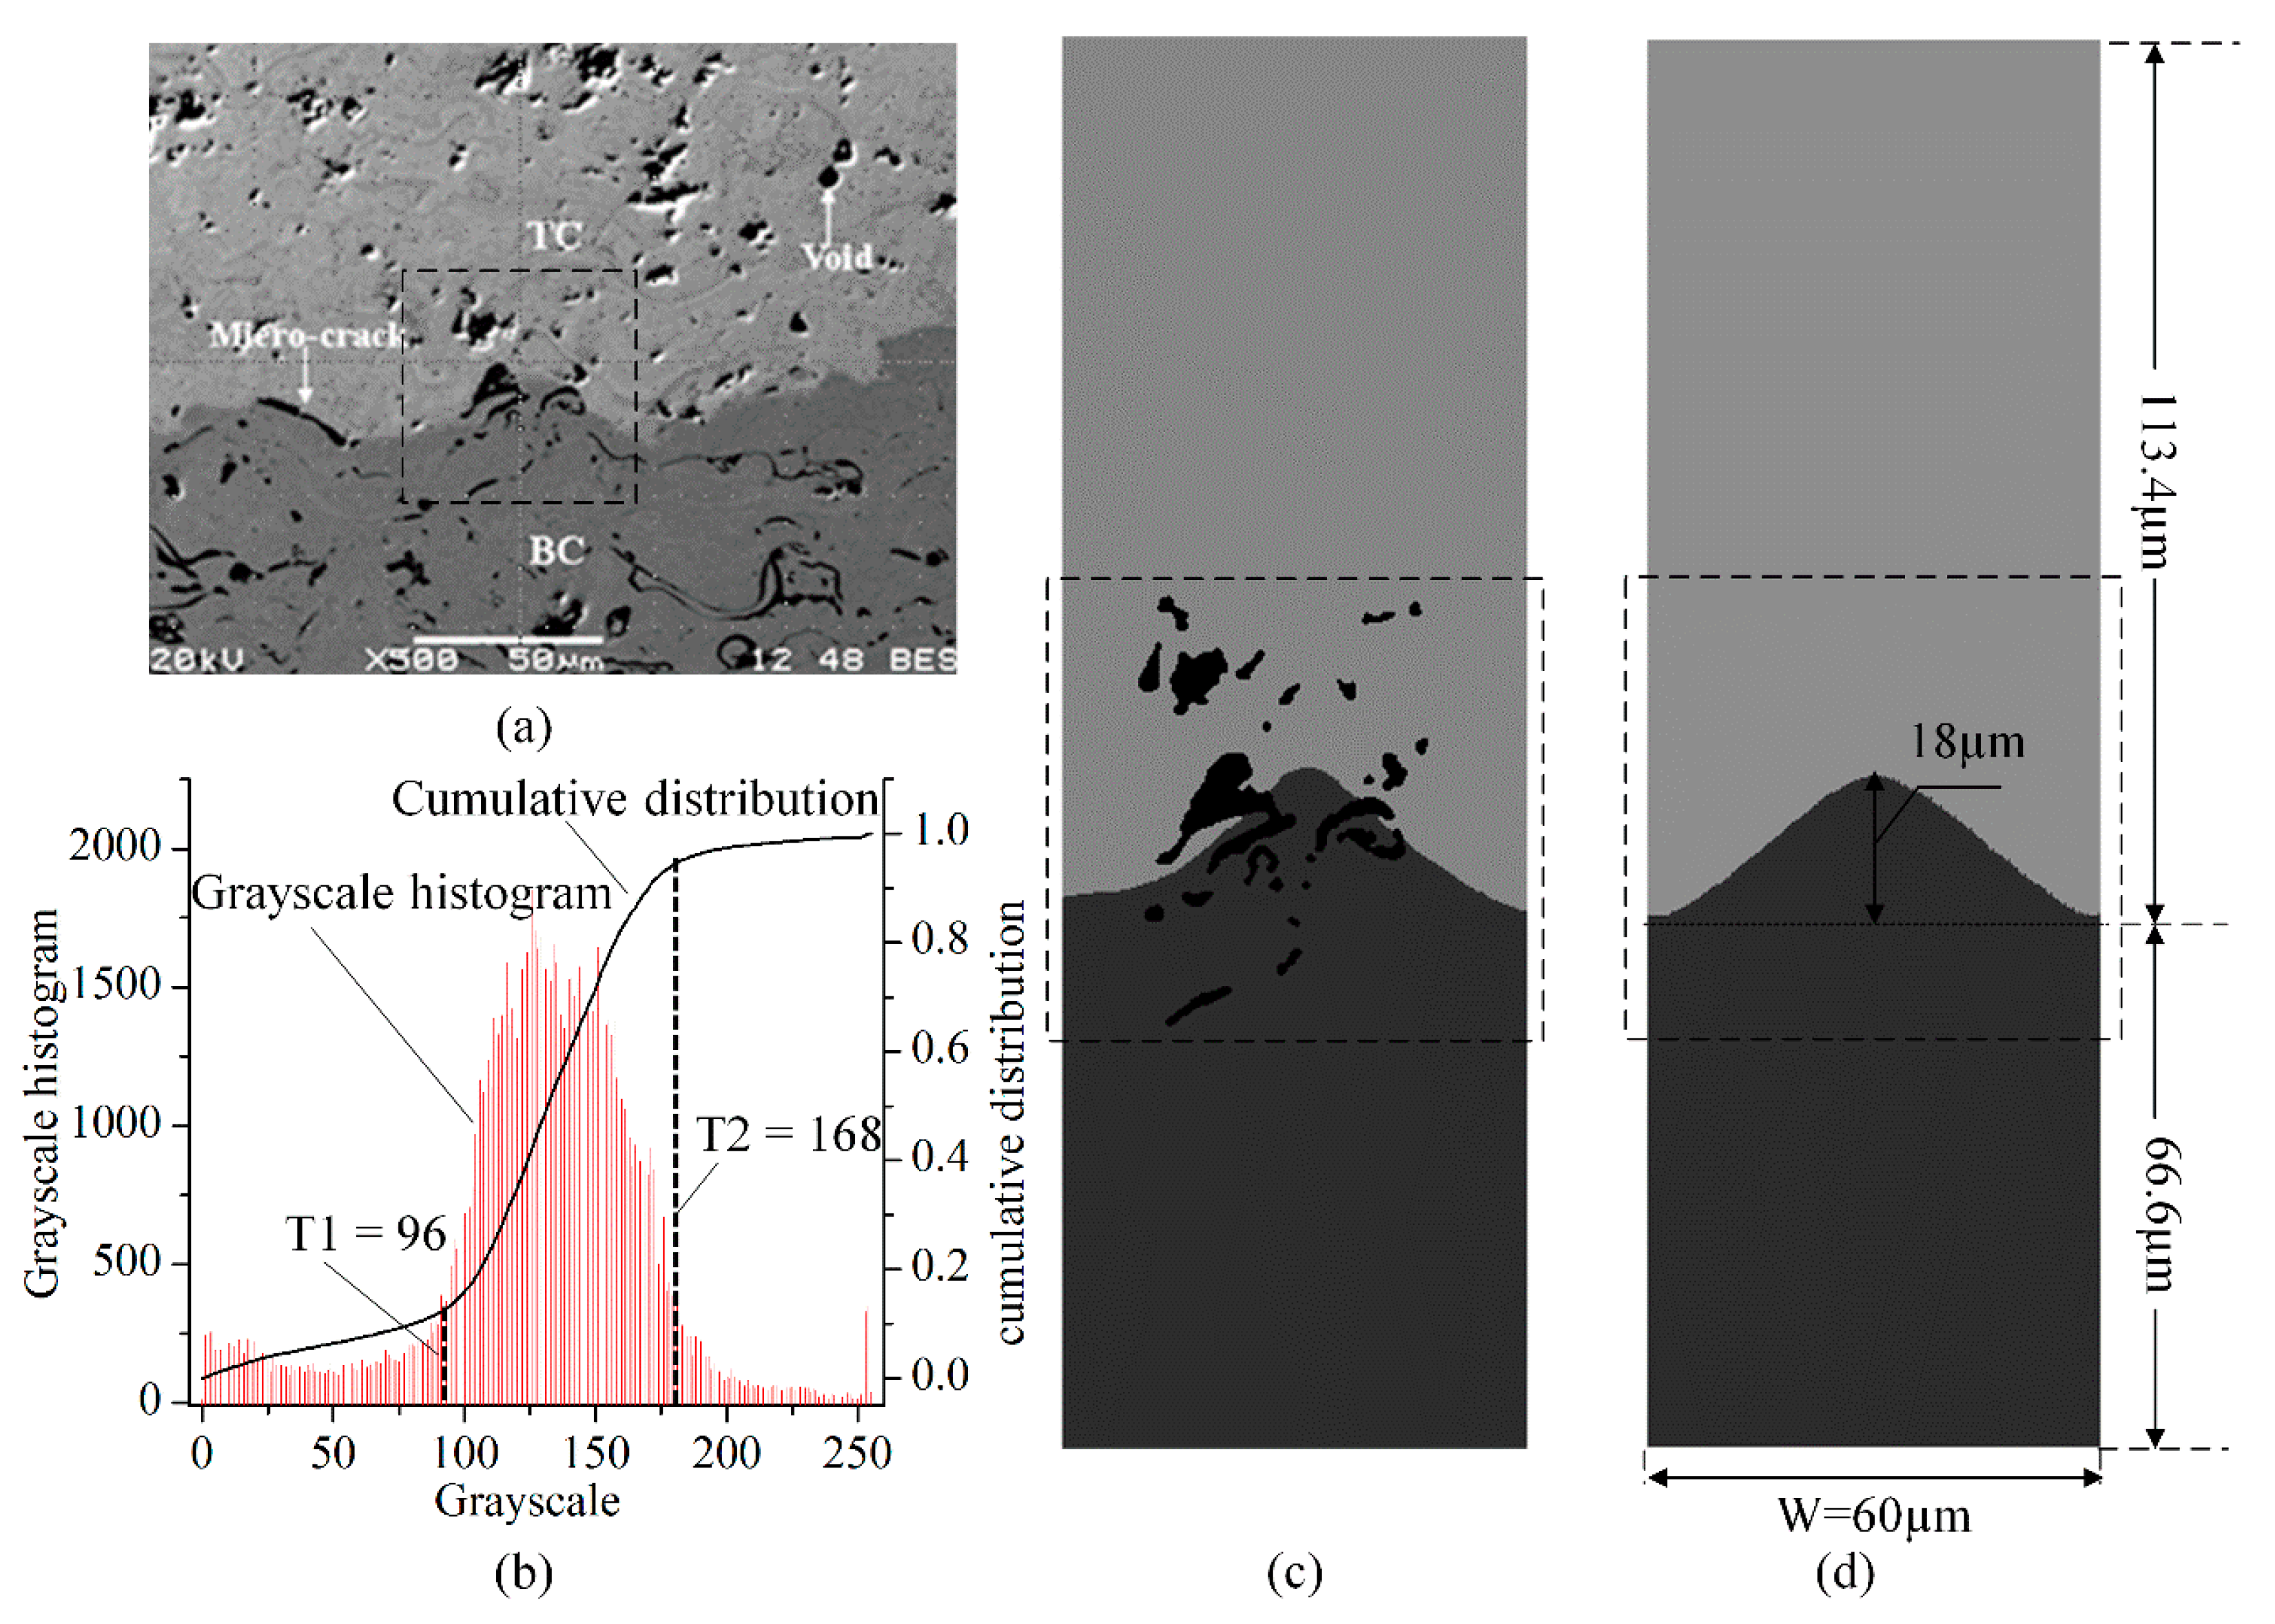
- The microstructures of TBC, including complex interface morphology and randomly distributed microdefects;
- The mechanical behavior, for instance, the creep and plastic deformation often occurs during service;
- TGO growth, resulting from the oxidation of BC, which causes permanent volumetric swelling and mechanical property mismatch, such as the significant thermal expansion differences among TC, TGO and BC.
2. Methodology
2.1. SEM Image Based Direct FE Mesh Reconstruction
2.2. Mechanical Behavior Modeling
2.3. Diffusion Oxidation Scheme for TGO Growth
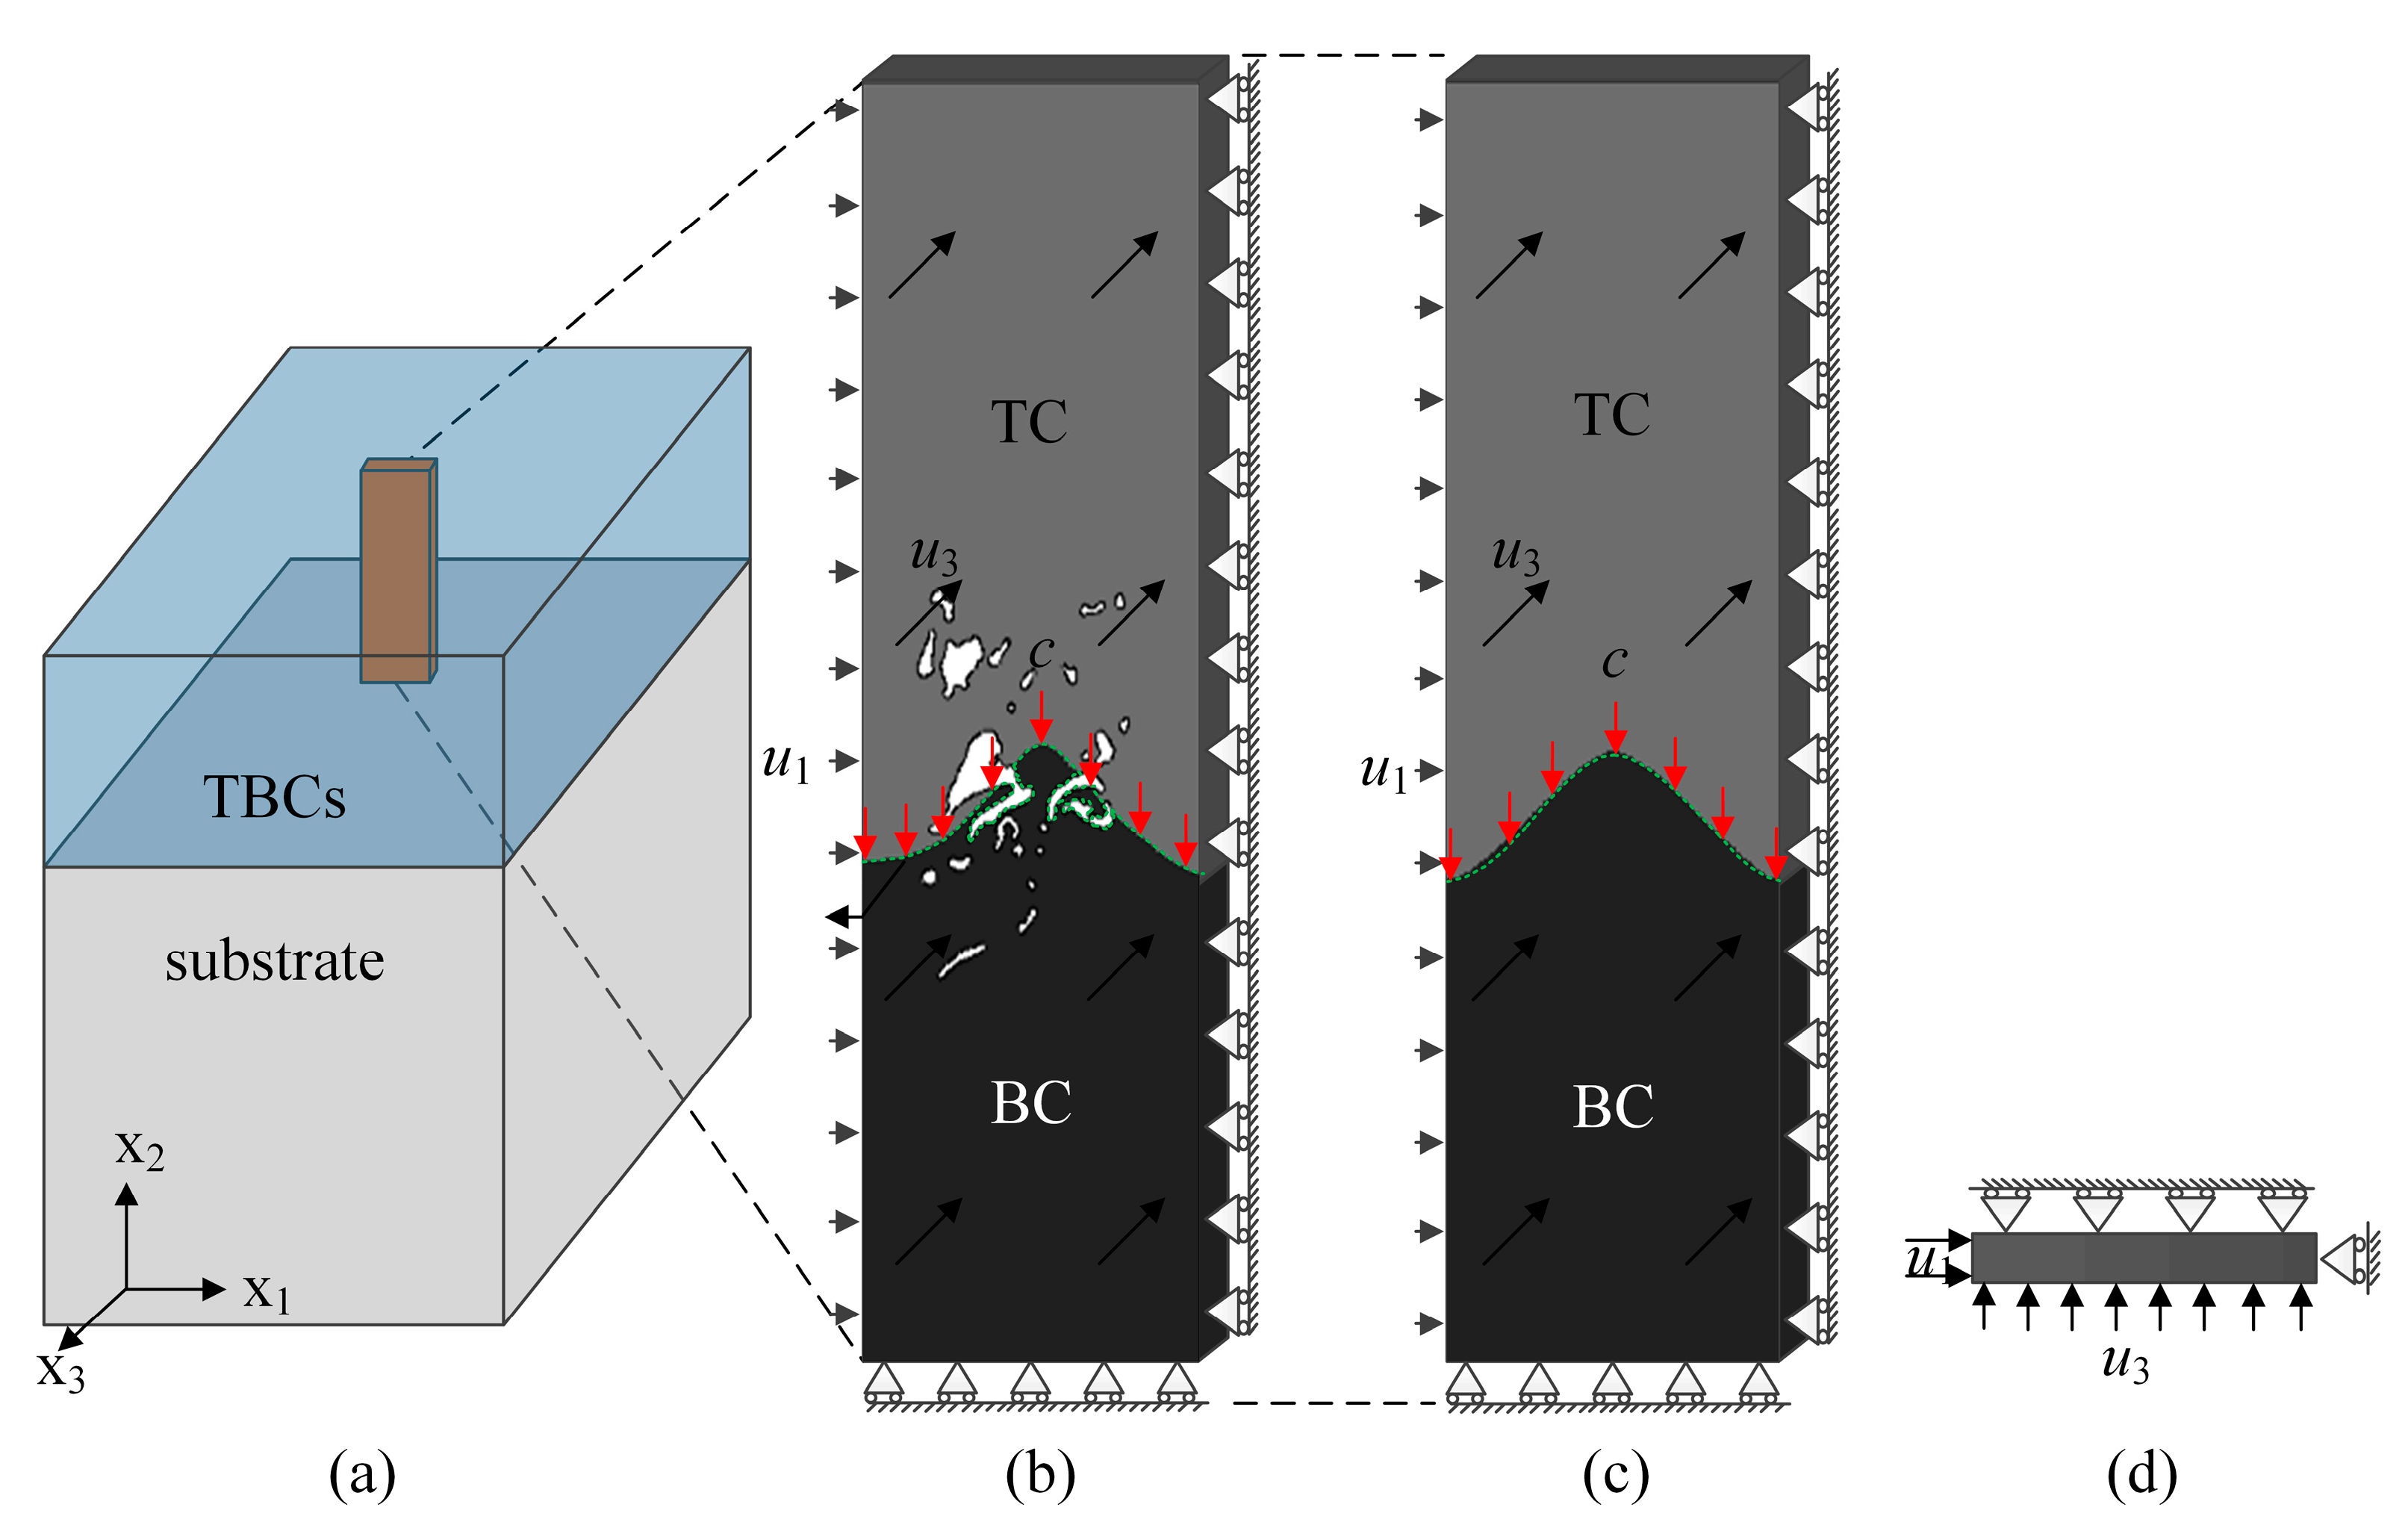
2.4. Boundary Condition for Oxidation of TBC
3. Results
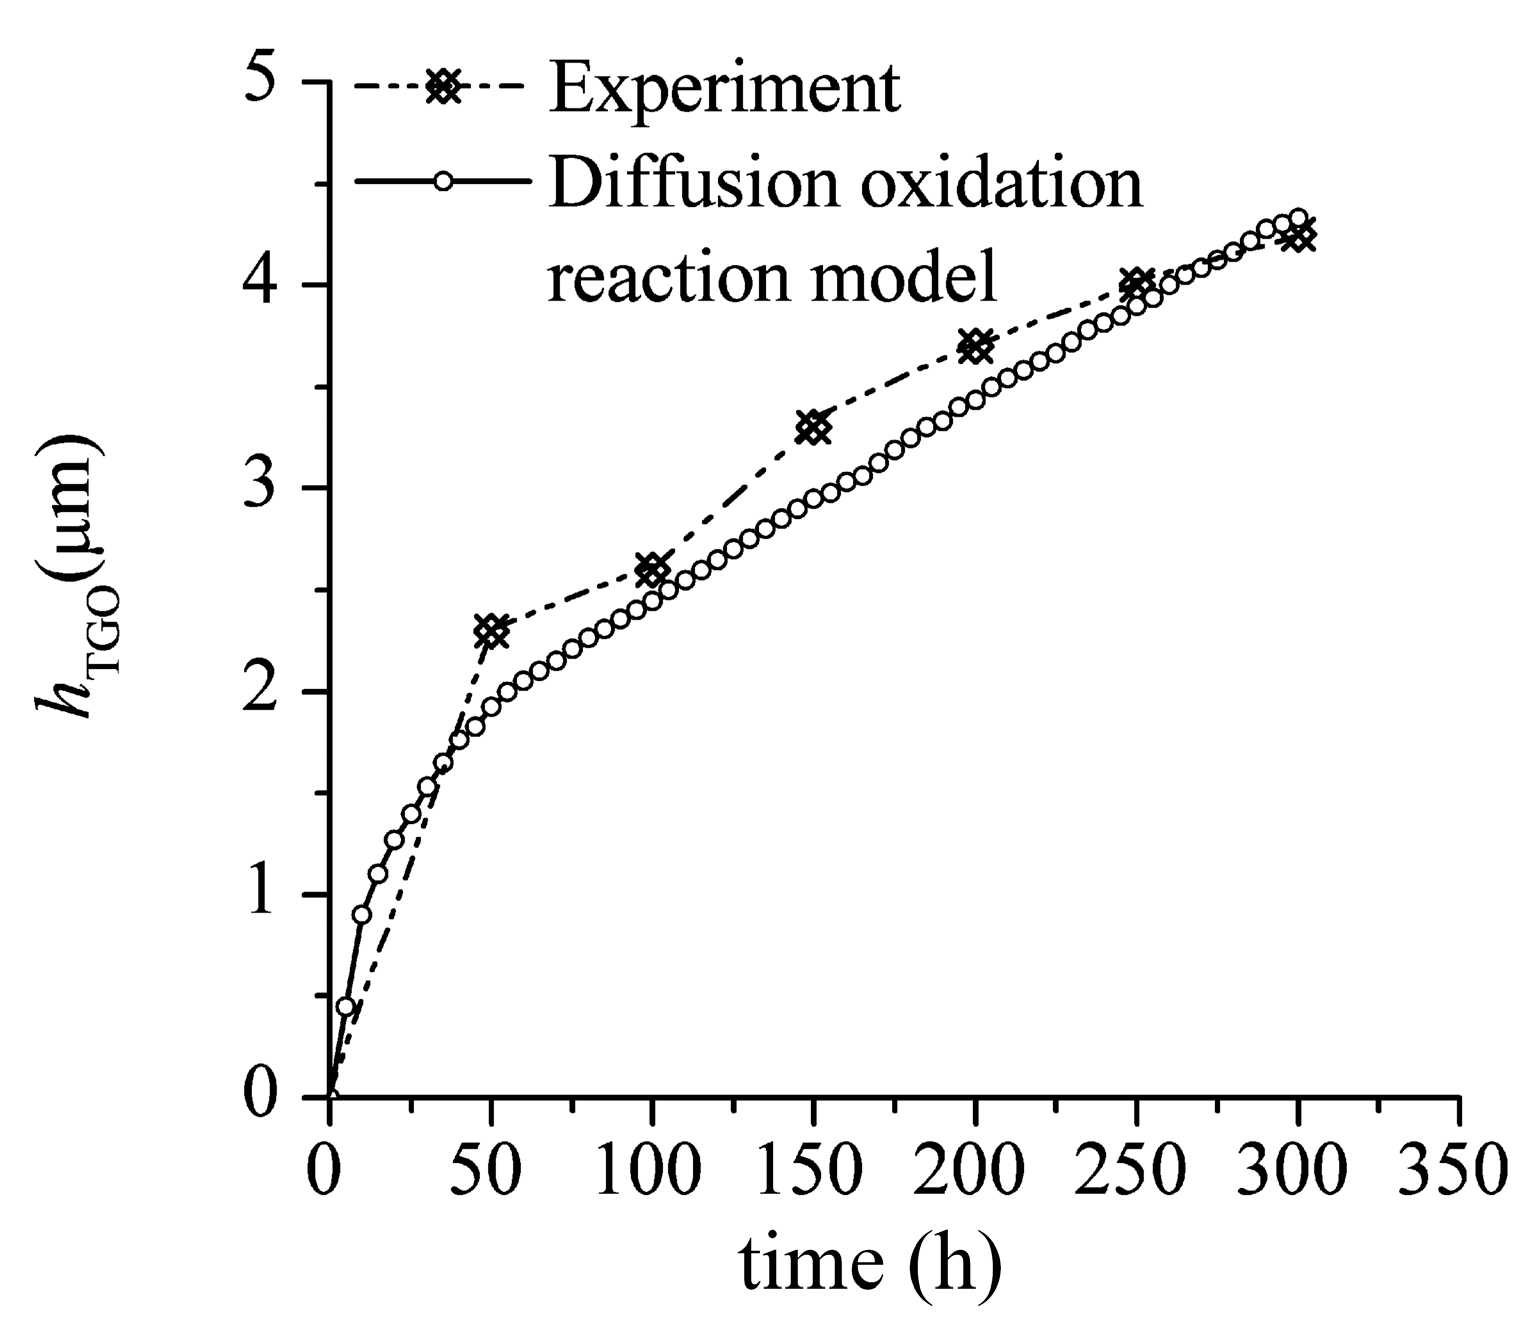
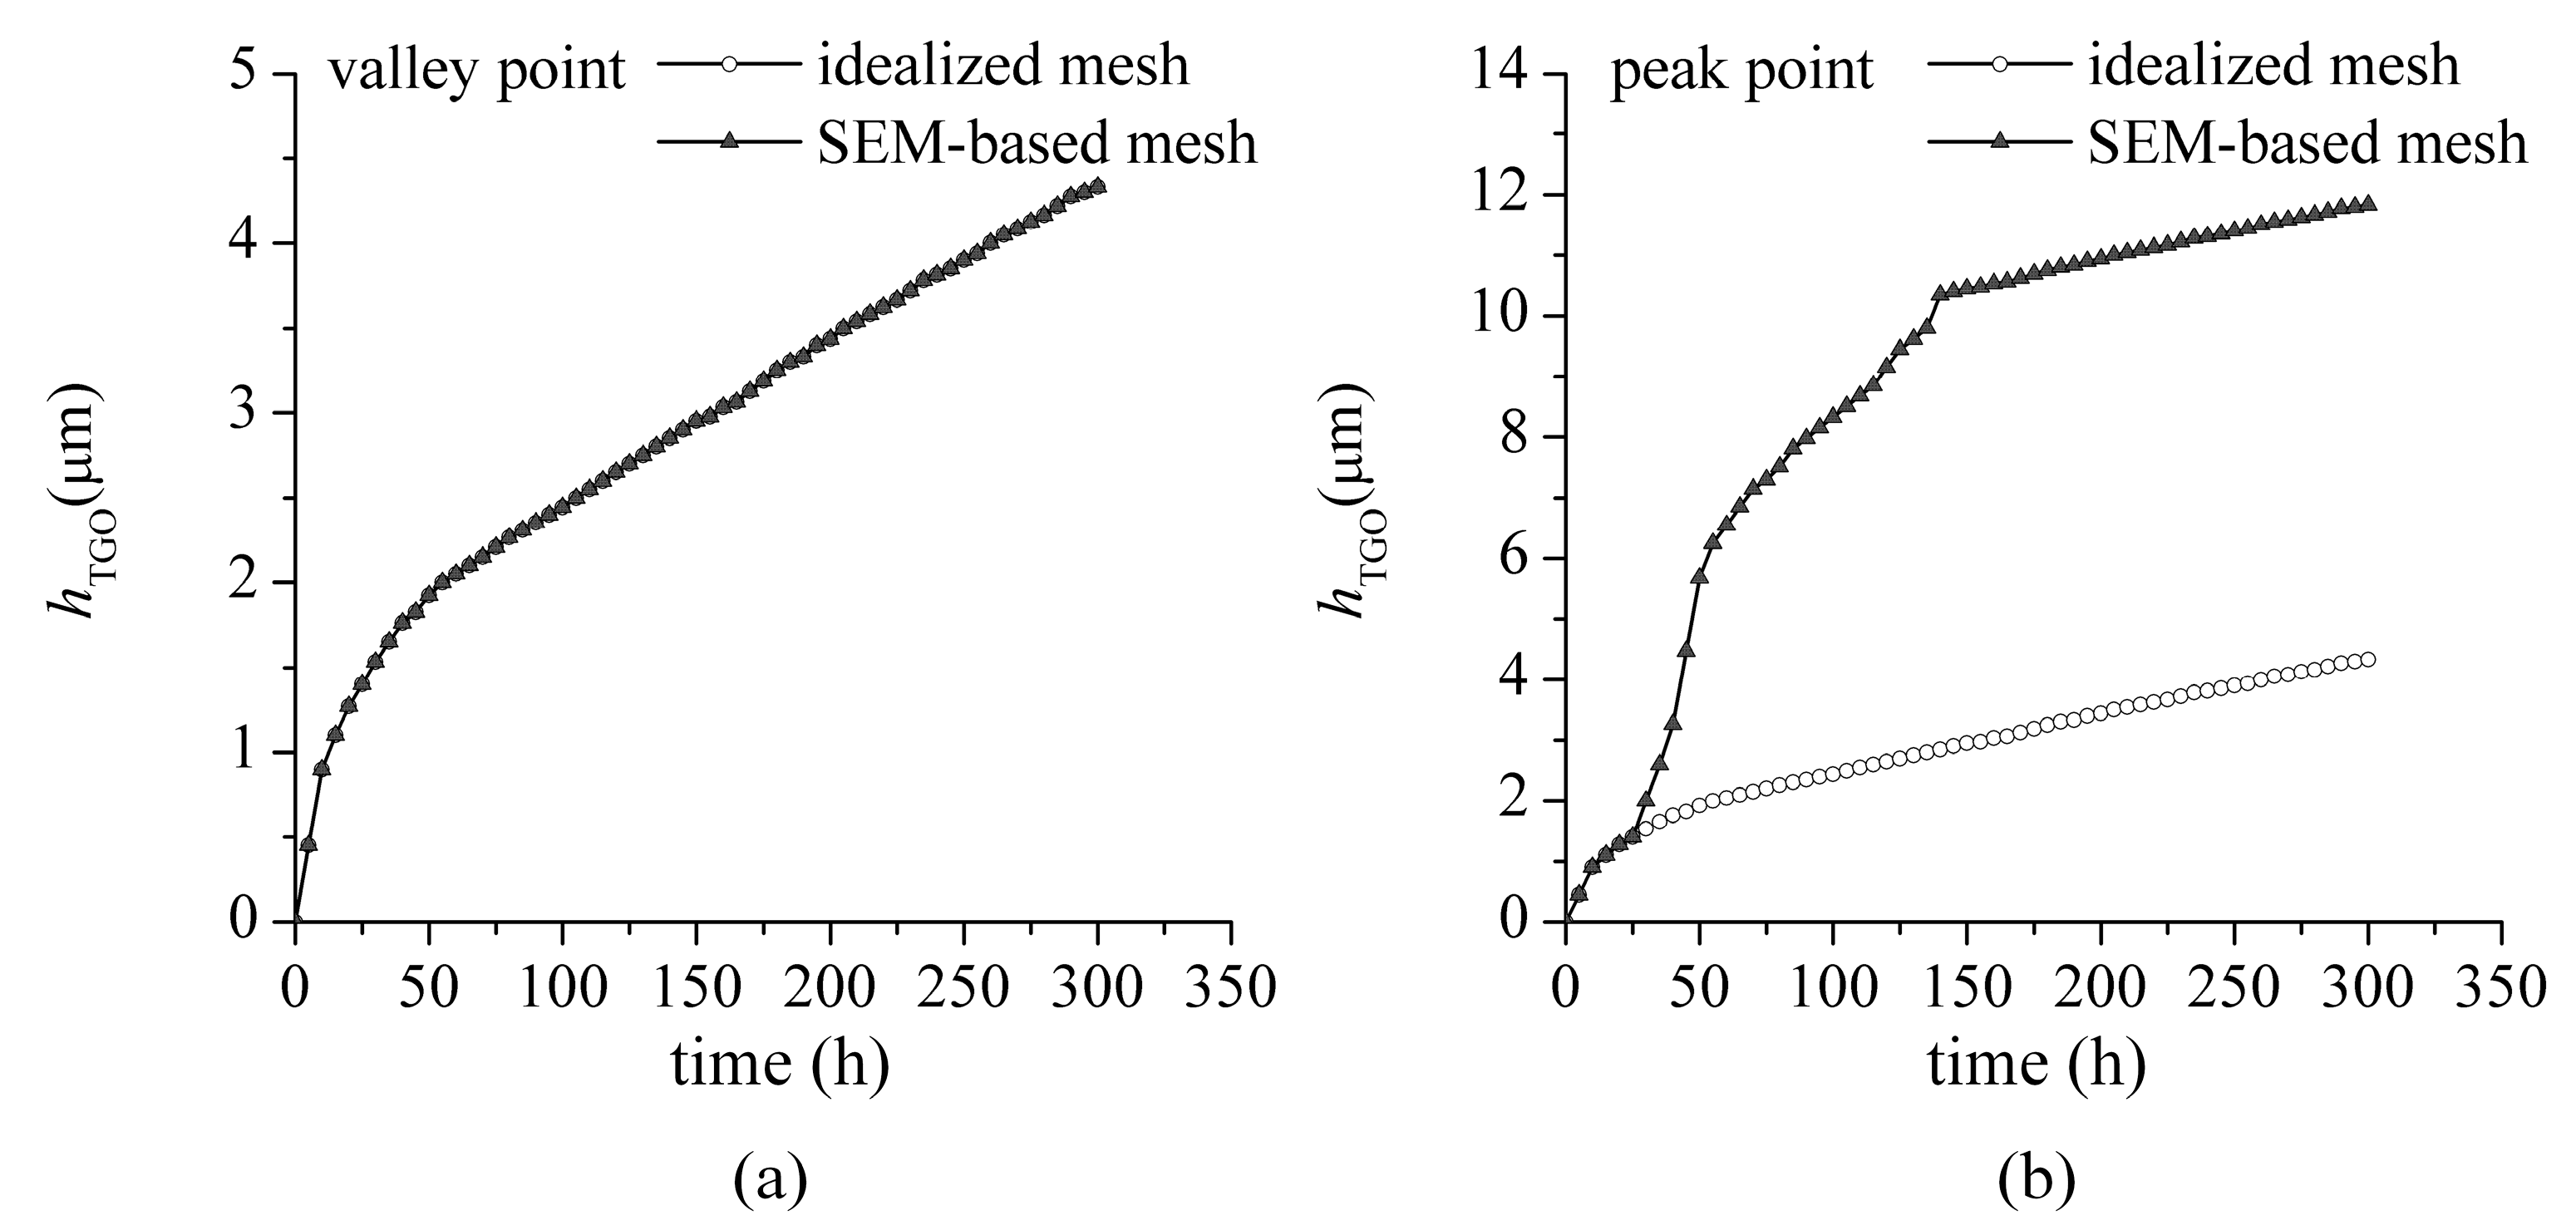
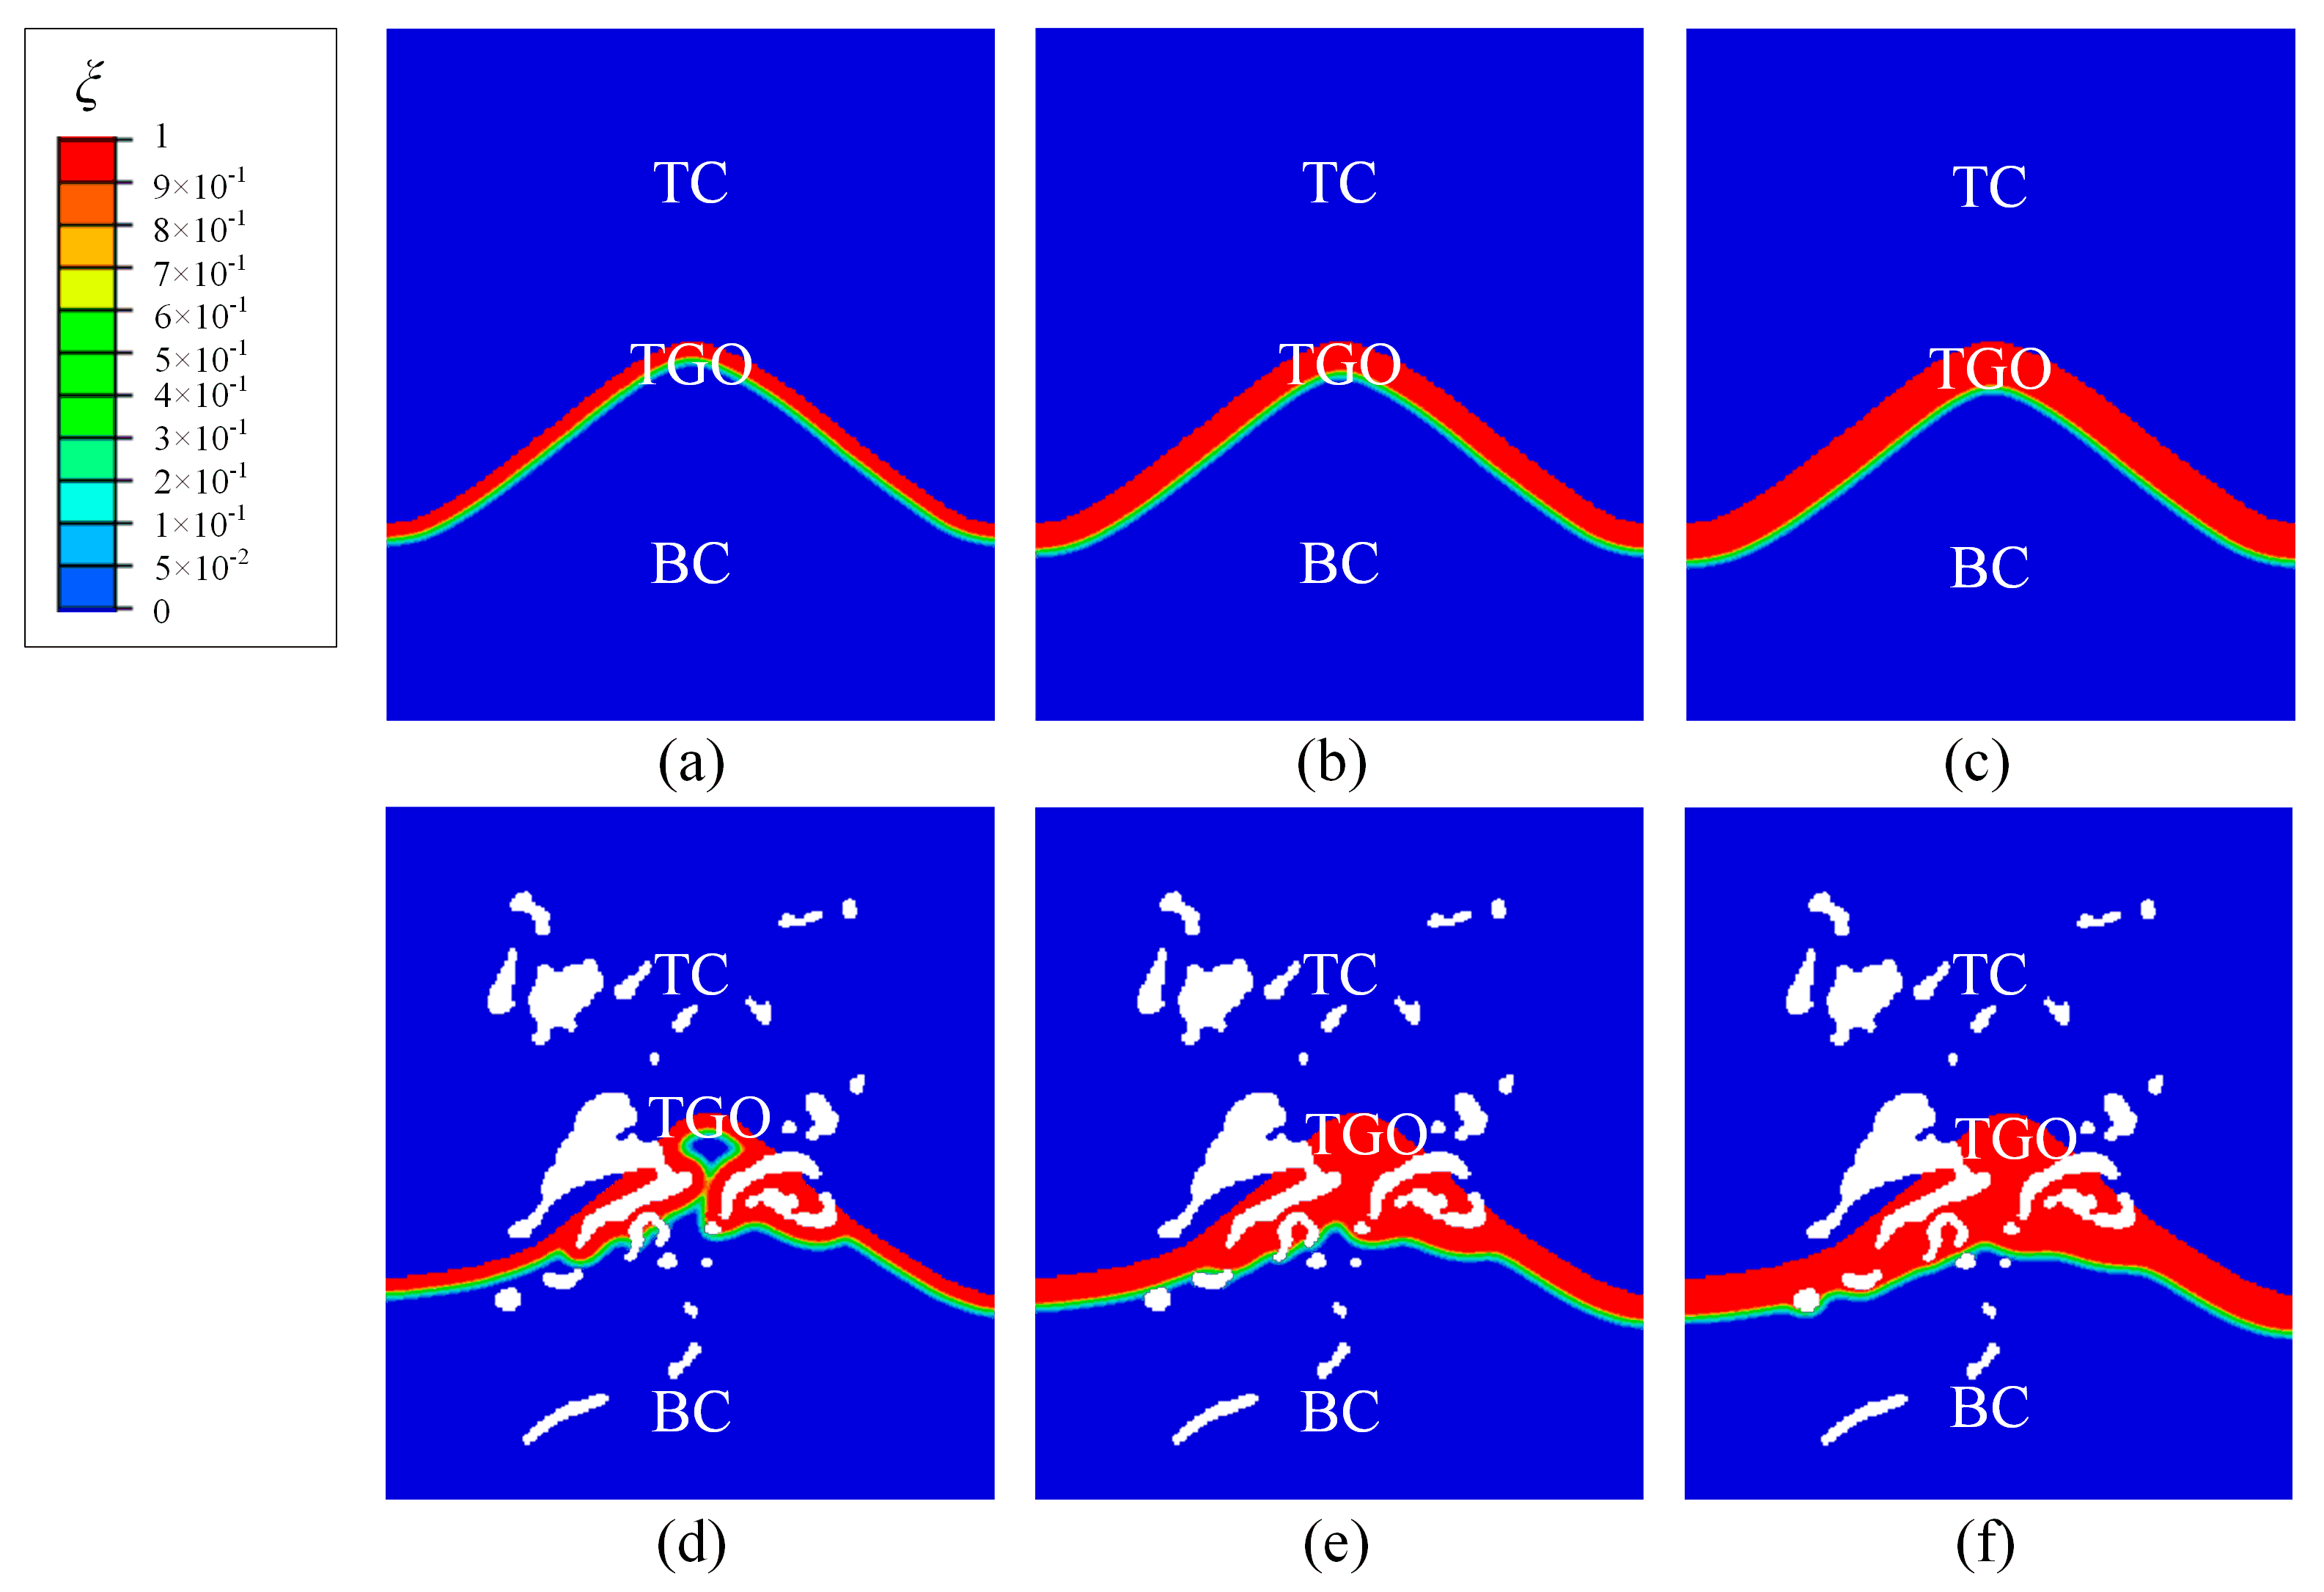
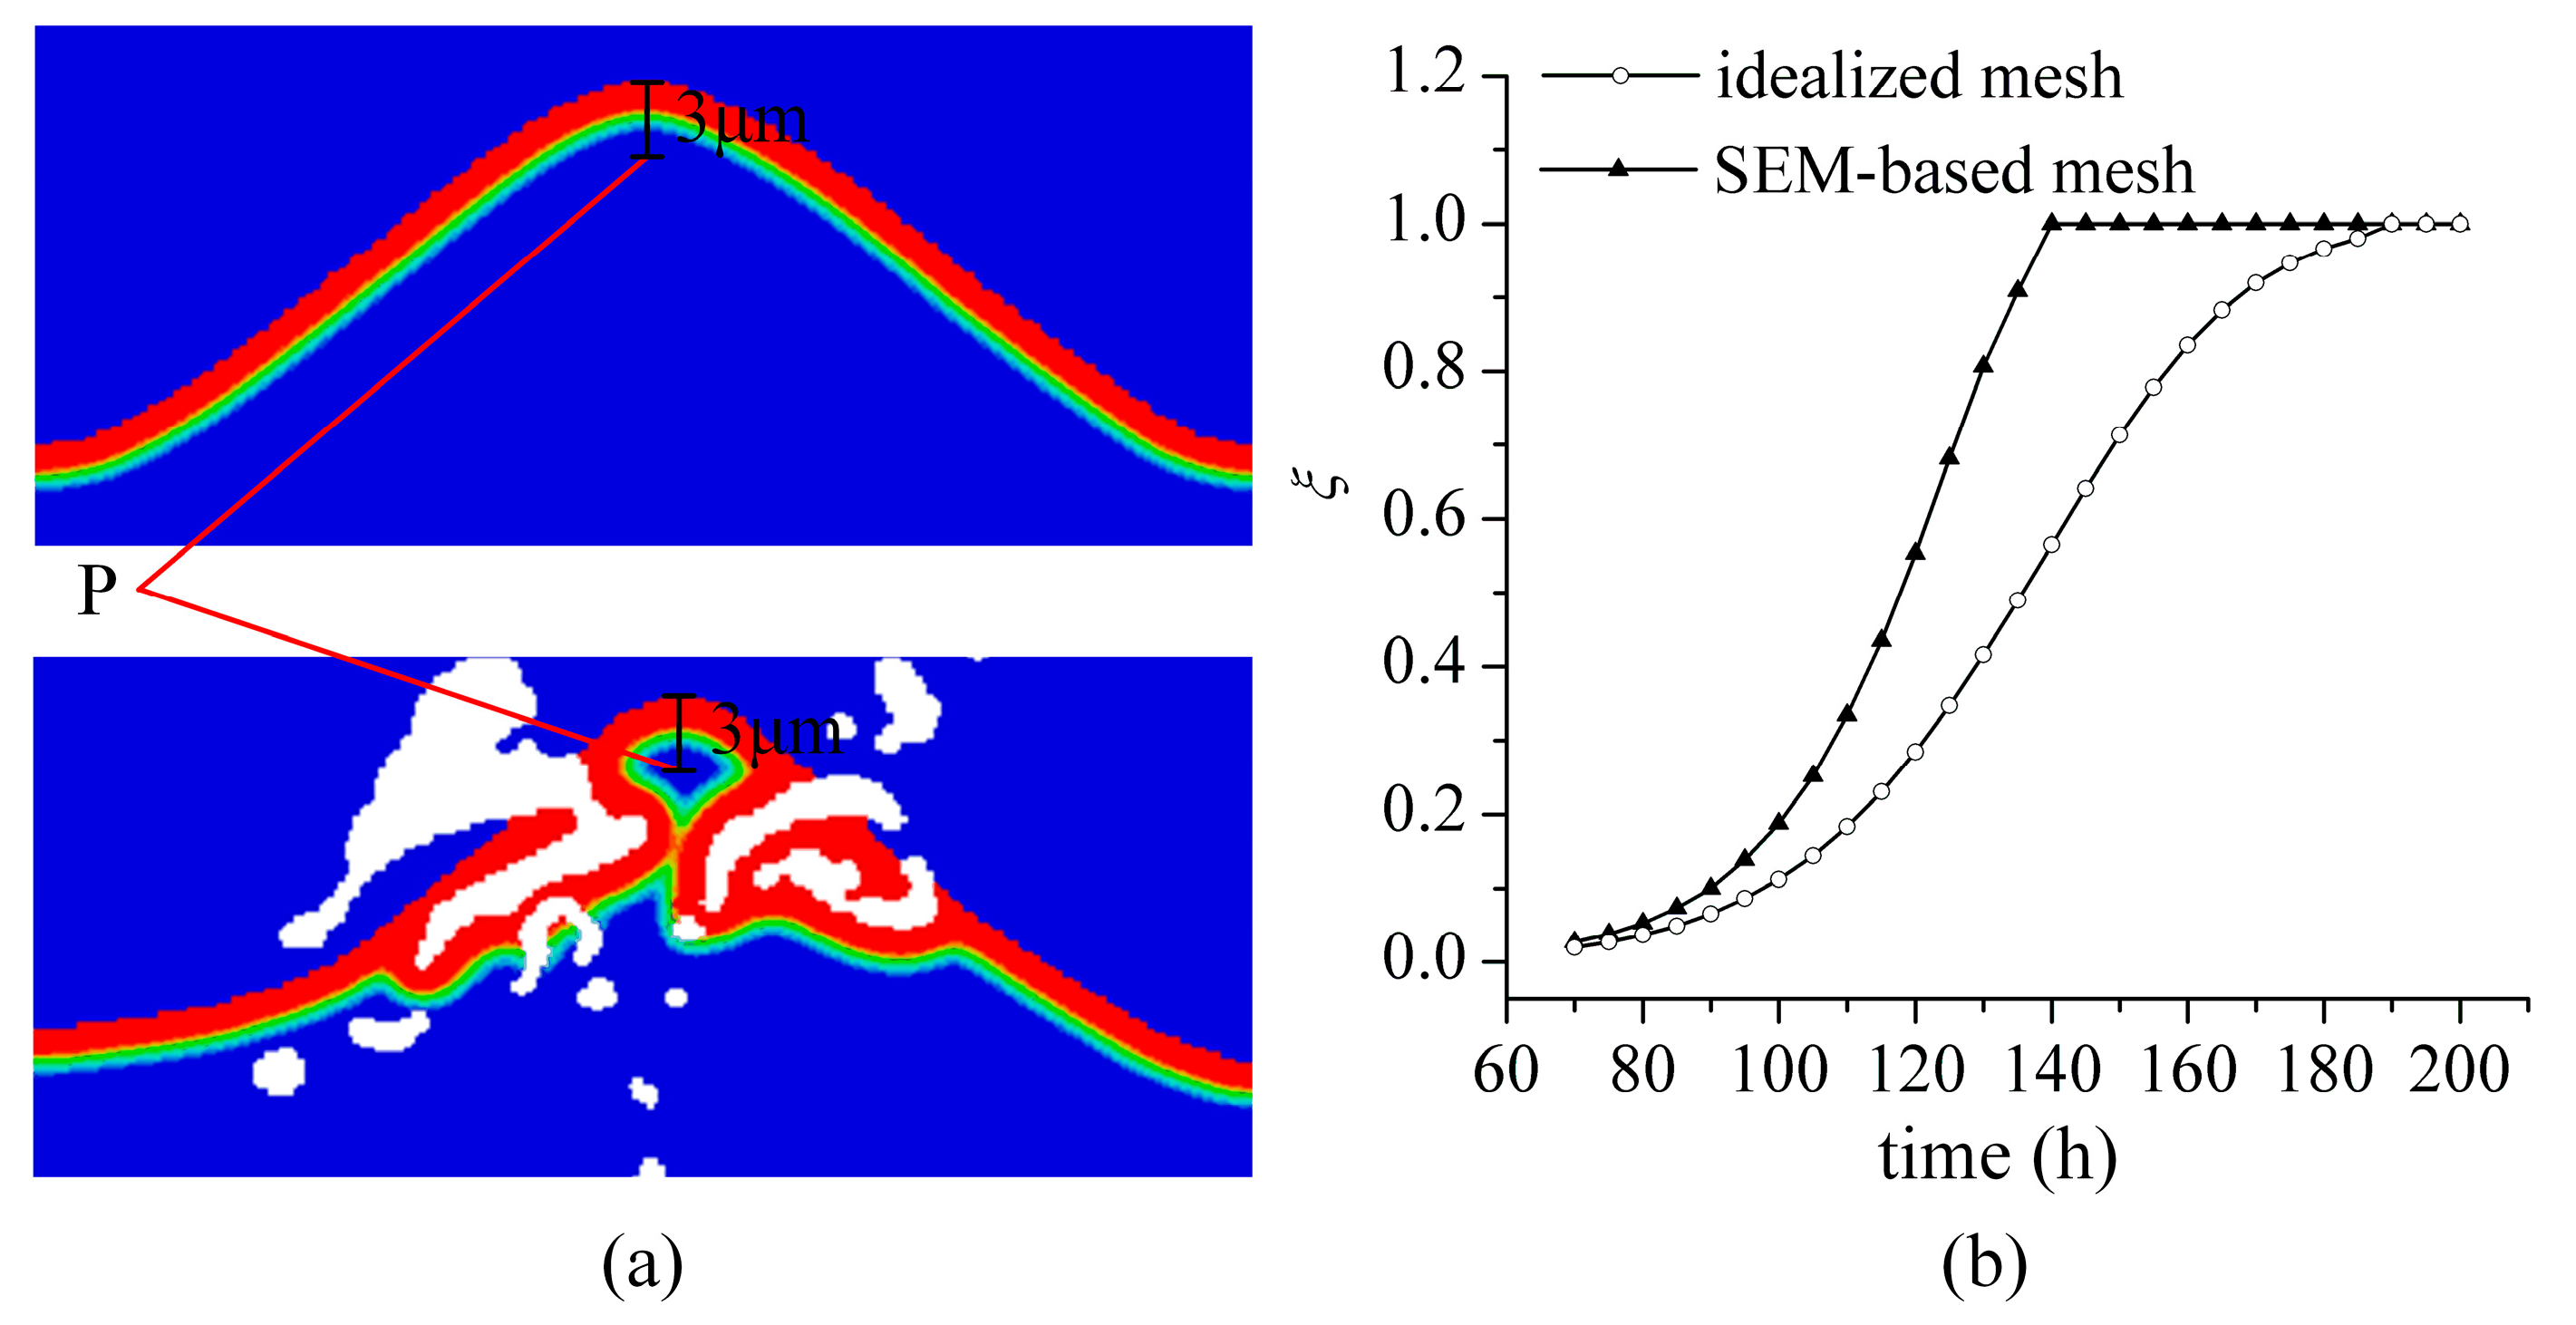
3.1. TGO Growth
3.2. Stress Evolution
3.2.1. Stress Evolution Affected by Microstructure Features
3.2.2. Stress Evolution Affected by Mechanical Behavior
4. Conclusions
- The interface defects increase the surface-area-to-volume ratio of BC exposed to oxygen anion. It leads to the non-uniform growth of TGO in the actual microstructures. It has also been observed in experimental studies (see Figure 3b in Reference [28]).
- The interface defects significantly affects the magnitude and distribution of interface stress. The consideration of actual microstructure features is helpful for the accurate evaluation of interface stress for TBC.
- The mechanical behavior strongly affects stress evolution in TBC. The sizable creep deformation of TGO and BC can significantly relax the growth stress and leads to the approximate zero-stress state during the continuous high temperature stage. When the SD property of TC is considering, the plastic deformation easily occurs in the TC layer. It leads to the considerable reduction of stress-level in the TC layer.
Author Contributions
Funding
Acknowledgments
Conflicts of Interest
Appendix A

Appendix A.1. Stress-Update at Main Plain
Appendix A.2. Stress-Update at Corner
Appendix A.3. Stress-Update at Apex
Appendix B
References
- Padture, N.P. Advanced structural ceramics in aerospace propulsion. Nat. Mater. 2016, 15, 804–809. [Google Scholar] [CrossRef] [PubMed]
- Kumar, V.; Balasubramanian, K. Progress update on failure mechanisms of advanced thermal barrier coatings: A review. Prog. Org. Coat. 2016, 90, 54–82. [Google Scholar] [CrossRef]
- Maurel, V.; Busso, E.P.; Frachon, J.; Besson, J.; N’Guyen, F. A methodology to model the complex morphology of rough interfaces. Int. J. Solids Struct. 2014, 51, 3293–3302. [Google Scholar] [CrossRef]
- Moridi, A.; Azadi, M.; Farrahi, G.H. Thermo–mechanical stress analysis of thermal barrier coating system considering thickness and roughness effects. Surf. Coat. Technol. 2014, 243, 91–99. [Google Scholar] [CrossRef]
- Ahmadian, S.; Browning, A.; Jordan, E.H. Three-dimensional X-ray micro-computed tomography of cracks in a furnace cycled air plasma sprayed thermal barrier coating. Scr. Mater. 2015, 97, 13–16. [Google Scholar] [CrossRef]
- Nayebpashaee, N.; Seyedein, S.H.; Aboutalebi, M.R.; Sarpoolaky, H.; Hadavi, S.M.M. Finite element simulation of residual stress and failure mechanism in plasma sprayed thermal barrier coatings using actual microstructure as the representative volume. Surf. Coat. Technol. 2016, 291, 103–114. [Google Scholar] [CrossRef]
- Wei, S.; Qun-Bo, F.; Fu-Chi, W.; Zhuang, M. Modeling of micro-crack growth during thermal shock based on microstructural images of thermal barrier coatings. Comput. Mater. Sci. 2009, 46, 600–602. [Google Scholar] [CrossRef]
- Huang, M.; Li, Y.-M. X–ray tomography image–based reconstruction of microstructural finite element mesh models for heterogeneous materials. Comput. Mater. Sci. 2013, 67, 63–72. [Google Scholar] [CrossRef]
- Demasi-Marcin, J.T.; Sheffler, K.D.; Bose, S. Mechanisms of degradation and failure in a plasma-deposited thermal barrier coating. J. Eng. Gas. Turb. Power 1990, 112, 521–526. [Google Scholar] [CrossRef]
- Rejda, E.F.; Socie, D.F.; Itoh, T. Deformation behaviour of plasma-sprayed thick thermal barrier coatings. Surf. Coat. Technol. 1999, 113, 218–226. [Google Scholar] [CrossRef]
- Yu, M.-H. Unified strength theory (UST). In Unified Strength Theory and Its Applications; Springer: Singapore, 2018; pp. 151–190. [Google Scholar]
- Lin, C.; Li, Y.M. A return mapping algorithm for unified strength theory model. Int. J. Numer. Methods Eng. 2015, 104, 749–766. [Google Scholar] [CrossRef]
- Lin, C.; Sun, Q.; Chai, Y.; Chen, H.L.; Li, Y.M. Stress evolution in top coat of thermal barrier coatings by considering strength difference property in tension and compression. Surf. Coat. Technol. 2017, 329, 86–96. [Google Scholar] [CrossRef]
- He, M.Y.; Hutchinson, J.W.; Evans, A.G. Simulation of stresses and delamination in a plasma-sprayed thermal barrier system upon thermal cycling. Mater. Sci. Eng. A 2003, 345, 172–178. [Google Scholar] [CrossRef]
- Busso, E.P.; Qian, Z.Q.; Taylor, M.P.; Evans, H.E. The influence of bondcoat and topcoat mechanical properties on stress development in thermal barrier coating systems. Acta Mater. 2009, 57, 2349–2361. [Google Scholar] [CrossRef]
- Seiler, P.; Bäker, M.; Rösler, J. Multi-scale failure mechanisms of thermal barrier coating systems. Comput. Mater. Sci. 2013, 80, 27–34. [Google Scholar] [CrossRef]
- Bäker, M. Influence of material models on the stress state in thermal barrier coating simulations. Surf. Coat. Technol. 2014, 240, 301–310. [Google Scholar] [CrossRef]
- Caliez, M.; Feyel, F.; Kruch, S.; Chaboche, J.L. Oxidation induced stress fields in an EB-PVD thermal barrier coating. Surf. Coat. Technol. 2002, 157, 103–110. [Google Scholar] [CrossRef]
- Frost, H.J.; Ashby, M.F. Deformation Mechanism Maps: The Plasticity and Creep of Metals and Ceramics; Pergamon Press: Oxford, UK, 1982. [Google Scholar]
- Lin, C.; Li, Y.M. Interface stress evolution considering the combined creep-plastic behaviour in thermal barrier coatings. Mater. Des. 2016, 89, 245–254. [Google Scholar] [CrossRef]
- Busso, E.P.; Lin, J.; Sakurai, S.; Nakayama, M. A mechanistic study of oxidation-induced degradation in a plasma-sprayed thermal barrier coating system. Part I: Model formulation. Acta Mater. 2001, 49, 1515–1528. [Google Scholar] [CrossRef]
- Zhao, L.G.; O’Dowd, N.P.; Busso, E.P. A coupled kineticconstitutive approach to the study of high temperature crack initiation in single crystal nickel-base superalloys. J. Mech. Phys. Solids 2006, 54, 288–309. [Google Scholar] [CrossRef]
- Ulm, F.J.; Coussy, O.; Kefei, L.; Larive, C. Thermo-chemo-mechanics of ASR expansion in concrete structures. J. Eng. Mech. 2000, 126, 233–242. [Google Scholar] [CrossRef]
- Chu, H.N. High-frequency extensional vibrations of sandwich plates. J. Acoust. Soc. Am. 1962, 34, 1184–1190. [Google Scholar] [CrossRef]
- Loeffel, K.; Anand, L.; Gasem, Z.M. On modeling the oxidation of high-temperature alloys. Acta Mater. 2013, 61, 399–424. [Google Scholar] [CrossRef]
- Cheng, J.; Jordan, E.H.; Barber, B.; Gell, M. Thermal/residual stress in an electron beam physical vapor deposited thermal barrier coating system. Acta Mater. 1998, 46, 5839–5850. [Google Scholar] [CrossRef]
- Wereszczak, A.A.; Hemrick, J.G.; Kirkland, T.P.; Haynes, J.A.; Fitzgerald, T.J.; Junkin, J.E. Stress relaxation of MCrAlY bond coat alloys as a function of temperature and strain. In Proceeding of the ASME 1998 International Gas Turbine and Aeroengine Congress and Exhibition, Stockholm, Sweden, 2–5 June 1998; ASME: West Conshohocken, PA, USA, 1998. [Google Scholar]
- Quested, P.N.; Brooks, R.F.; Chapman, L.; Morrell, R.; Youssef, Y.; Mills, K.C. Measurement and estimation of thermophysical properties of nickel based superalloys. Mater. Sci. Technol. 2009, 25, 154–162. [Google Scholar] [CrossRef]
- Padture, N.P.; Gell, M.; Jordan, E.H. Thermal barrier coatings for gas-turbine engine applications. Science 2002, 296, 280–284. [Google Scholar] [CrossRef] [PubMed]
- De Souza Neto, E.A.; Peric, D.; Owen, D.R. Computational Methods for Plasticity: Theory and Applications; John Wiley & Sons: Chichester, UK, 2008; ISBN 9780470694626. [Google Scholar]


| T(K) | TC | Substrate | ||||
|---|---|---|---|---|---|---|
| E (GPa) [26] | v [26] | α (10−6/°C) [26] | σt (GPa) [9] | σc (GPa) [9] | α (10−6/°C) [26] | |
| 293 | 48 | 0.1 | 9.7 | 0.40 | 0.172 | 14.8 |
| 473 | 47 | 0.1 | 9.8 | − | − | 15.2 |
| 673 | 44 | 0.1 | 9.9 | − | − | 15.6 |
| 873 | 40 | 0.11 | 9.9 | − | − | 16.2 |
| 1073 | 34 | 0.11 | 10 | − | − | 16.9 |
| 1273 | 26 | 0.12 | 10.1 | − | − | 17.2 |
| 1373 | 22 | 0.12 | 10.1 | − | − | 17.6 |
| T(K) | BC | ||||||
|---|---|---|---|---|---|---|---|
| EBC (GPa) [26] | vBC [26] | αBC (10−6/°C) [26] | σy, BC (MPa) [26] | ABC (MPa−2.2s−1) [27] | ρBC [27] | QBC (J/mol) [27] | |
| 293 | 200 | 0.3 | 12.3 | 426 | 6.31 × 10⁻⁶ | 2.2 | 165,000 |
| 473 | 190 | 0.3 | 13.2 | 412 | − | − | − |
| 673 | 175 | 0.31 | 14.2 | 396 | − | − | − |
| 873 | 160 | 0.31 | 15.2 | 362 | − | − | − |
| 1073 | 145 | 0.32 | 16.3 | 284 | − | − | − |
| 1273 | 120 | 0.33 | 17.2 | 202 | − | − | − |
| 1373 | 110 | 0.33 | 17.7 | 114 | − | − | − |
| T(K) | TGO | ||||||
|---|---|---|---|---|---|---|---|
| ETGO (GPa) [26] | vTGO [26] | αTGO (10−6/°C) [26] | σy, TGO (GPa) [14] | ATGO (MPa−2.3s−1) [15] | ρTGO [15] | QTGO (J/mol) [15] | |
| 293 | 400 | 0.23 | 8 | 10 | 6.8 × 10³ | 2.3 | 424,000 |
| 473 | 390 | 0.23 | 8.2 | 10 | − | − | − |
| 673 | 380 | 0.24 | 8.4 | 10 | − | − | − |
| 873 | 370 | 0.24 | 8.7 | 10 | − | − | − |
| 1073 | 355 | 0.25 | 9 | 10 | − | − | − |
| 1273 | 325 | 0.25 | 9.3 | 1 | − | − | − |
| 1373 | 320 | 0.25 | 9.5 | 1 | − | − | − |
| Diffusion and oxidation parameters | Symbols | Values |
|---|---|---|
| Reference diffusion coefficients of oxygen in BC [25] | D0, BC (m2/s) | 7.5 × 10⁻⁹ |
| Reference diffusion coefficients of oxygen in TGO [25] | D0, TGO (m2/s) | 7.5 × 10⁻⁹ |
| Oxygen anion diffusion activation energies of BC [25] | Qd, TGO (kJ/mol) | 100 |
| Oxygen anion diffusion activation energies of TGO [25] | Qd, TGO (kJ/mol) | 100 |
| Ideal gas constant | R (kJ/(mol × K)) | 8.13 × 10⁻³ |
| Chemical potential of oxygen molecule in the Standard state [25] | (kJ/mol) | 0 |
| Chemical potential of oxygen anion in the Standard state [25] | μ0 (kJ/mol) | 112 |
| Standard atmospheric pressure | p0 (MPa) | 0.1 |
| Partial pressure of oxygen molecule in gas [25] | P (MPa) | 0.021 |
| Maximum mole concentration of oxygen anion Per unit volume [25] | cmax (mol/m3) | 0.08 × 10⁶ |
| Moles of oxygen anion consumed to generate Unit volume TGO [25] | κ (mol/m3) | 0.24 × 10⁶ |
| Reference thermodynamic temperature | Tref (K) | 1373 |
© 2018 by the authors. Licensee MDPI, Basel, Switzerland. This article is an open access article distributed under the terms and conditions of the Creative Commons Attribution (CC BY) license (http://creativecommons.org/licenses/by/4.0/).
Share and Cite
Lin, C.; Chai, Y.; Li, Y. Oxidation Simulation of Thermal Barrier Coatings with Actual Microstructures Considering Strength Difference Property and Creep-Plastic Behavior. Coatings 2018, 8, 338. https://doi.org/10.3390/coatings8100338
Lin C, Chai Y, Li Y. Oxidation Simulation of Thermal Barrier Coatings with Actual Microstructures Considering Strength Difference Property and Creep-Plastic Behavior. Coatings. 2018; 8(10):338. https://doi.org/10.3390/coatings8100338
Chicago/Turabian StyleLin, Chen, Yijun Chai, and Yueming Li. 2018. "Oxidation Simulation of Thermal Barrier Coatings with Actual Microstructures Considering Strength Difference Property and Creep-Plastic Behavior" Coatings 8, no. 10: 338. https://doi.org/10.3390/coatings8100338
APA StyleLin, C., Chai, Y., & Li, Y. (2018). Oxidation Simulation of Thermal Barrier Coatings with Actual Microstructures Considering Strength Difference Property and Creep-Plastic Behavior. Coatings, 8(10), 338. https://doi.org/10.3390/coatings8100338