1. Introduction
Amorphous alloy, which is also known as metallic glass, is a type of metallic material that is disordered in long-range, but ordered in short-range at the atomic level. The particularity of its atomic arrangement differs the performance of amorphous alloy from the traditional crystalline alloyed materials. When compared with the crystalline alloy with same composition, amorphous alloy exhibits excellent physical, chemical, and mechanical properties [
1,
2,
3]. However, the high cost and difficulties in producing large dimensioned amorphous alloy restrict its wider applications in industry [
4,
5]. With the help of laser processing technology, the preparation of amorphous coating on the surface of traditional crystalline materials is an effective and feasible way to overcome the limitation of shape and size, reduce the material cost, and expand the application fields [
6,
7]. Amorphous coating can be obtained by applying a high power laser beam, with or without additional feeding material, on the surface of crystalline substrate at a very fast scanning speed, so that a thin layer of material is melted and cooled down at a very high rate. When certain metallurgical conditions are met, amorphous coating will be formed on the surface of crystalline substrate. Amorphous coating often exhibits high microhardness, excellent corrosion resistance and wearing resistance, and it also presents extensive potential industrial applications, such as in nuclear energy, thermal power, chemical plant, shipping, and sewage disposal systems, etc. [
8].
In order to obtain amorphous coating, the cooling rate of the molten material needs to reach a critical value as per specific alloy [
9]. However, during the laser remelting/cladding process, the laser scanning speed is very fast, so that it is difficult to measure the temperature change through traditional thermocouple or infrared thermometer [
10,
11]. Meanwhile, due to the uneven heating and cooling, the amorphous coating that was prepared by laser surface processing technology has a high residual stress peak with gradient distribution characteristic. Accordingly, it is difficult to accurately measure the stress distribution.
On the basis of significant advancement of modern computing technology, numerical simulation has showed its great potential to solve these problems. The studies on the numerical simulation of laser cladding process have been reported in recent years and the results have demonstrated that numerical simulation is an effective tool for predicting the thermal behavior of materials during the laser cladding process. Parisa Farahmand et al. developed a three-dimensional (3D) transient uncoupled thermo-elastic-plastic model to simulate the thermal process and thermally induced residual stress in the laser cladding process. The numerical and experimental results indicated that the model accurately predicted the characteristics of the laser cladding process [
12]. Youxiang Chew et al. conducted the thermal and mechanical analyses for the laser cladding of single clad and double adjacent clads while using the finite element method. The numerical results of the thermal and residual stress field were compared with heat affected zone (HAZ) profiles on the cross sectional view and X-ray diffraction (XRD) stress measurements, respectively [
13]. Recently, the element birth and death method was introduced to simulate the powder feeding for the laser cladding process, in which the elements for the clad were “killed” before cladding by multiplying their stiffness by a severe reduction factor, and thus equivalently deactivating their load, mass, and specific heat. Those elements were reactivated with the scanning speed afterwards. It was concluded that the element birth and death method presented a higher accuracy [
14,
15].
In this paper, nickel based amorphous coating was prepared by laser cladding process. The temperature field distribution was simulated while using “element birth and death” method in ANSYS finite element software (16.0, Ansys, Inc., Berkeley, CA, USA), and the stress field distribution was then obtained by the indirect method. The temperature and the stress fields were verified by comparing cross-sectional profile and X-ray stress measurement, respectively.
2. Materials and Methods
The (Ni
0.6Fe
0.4)
65B
18Si
10Nb
4C
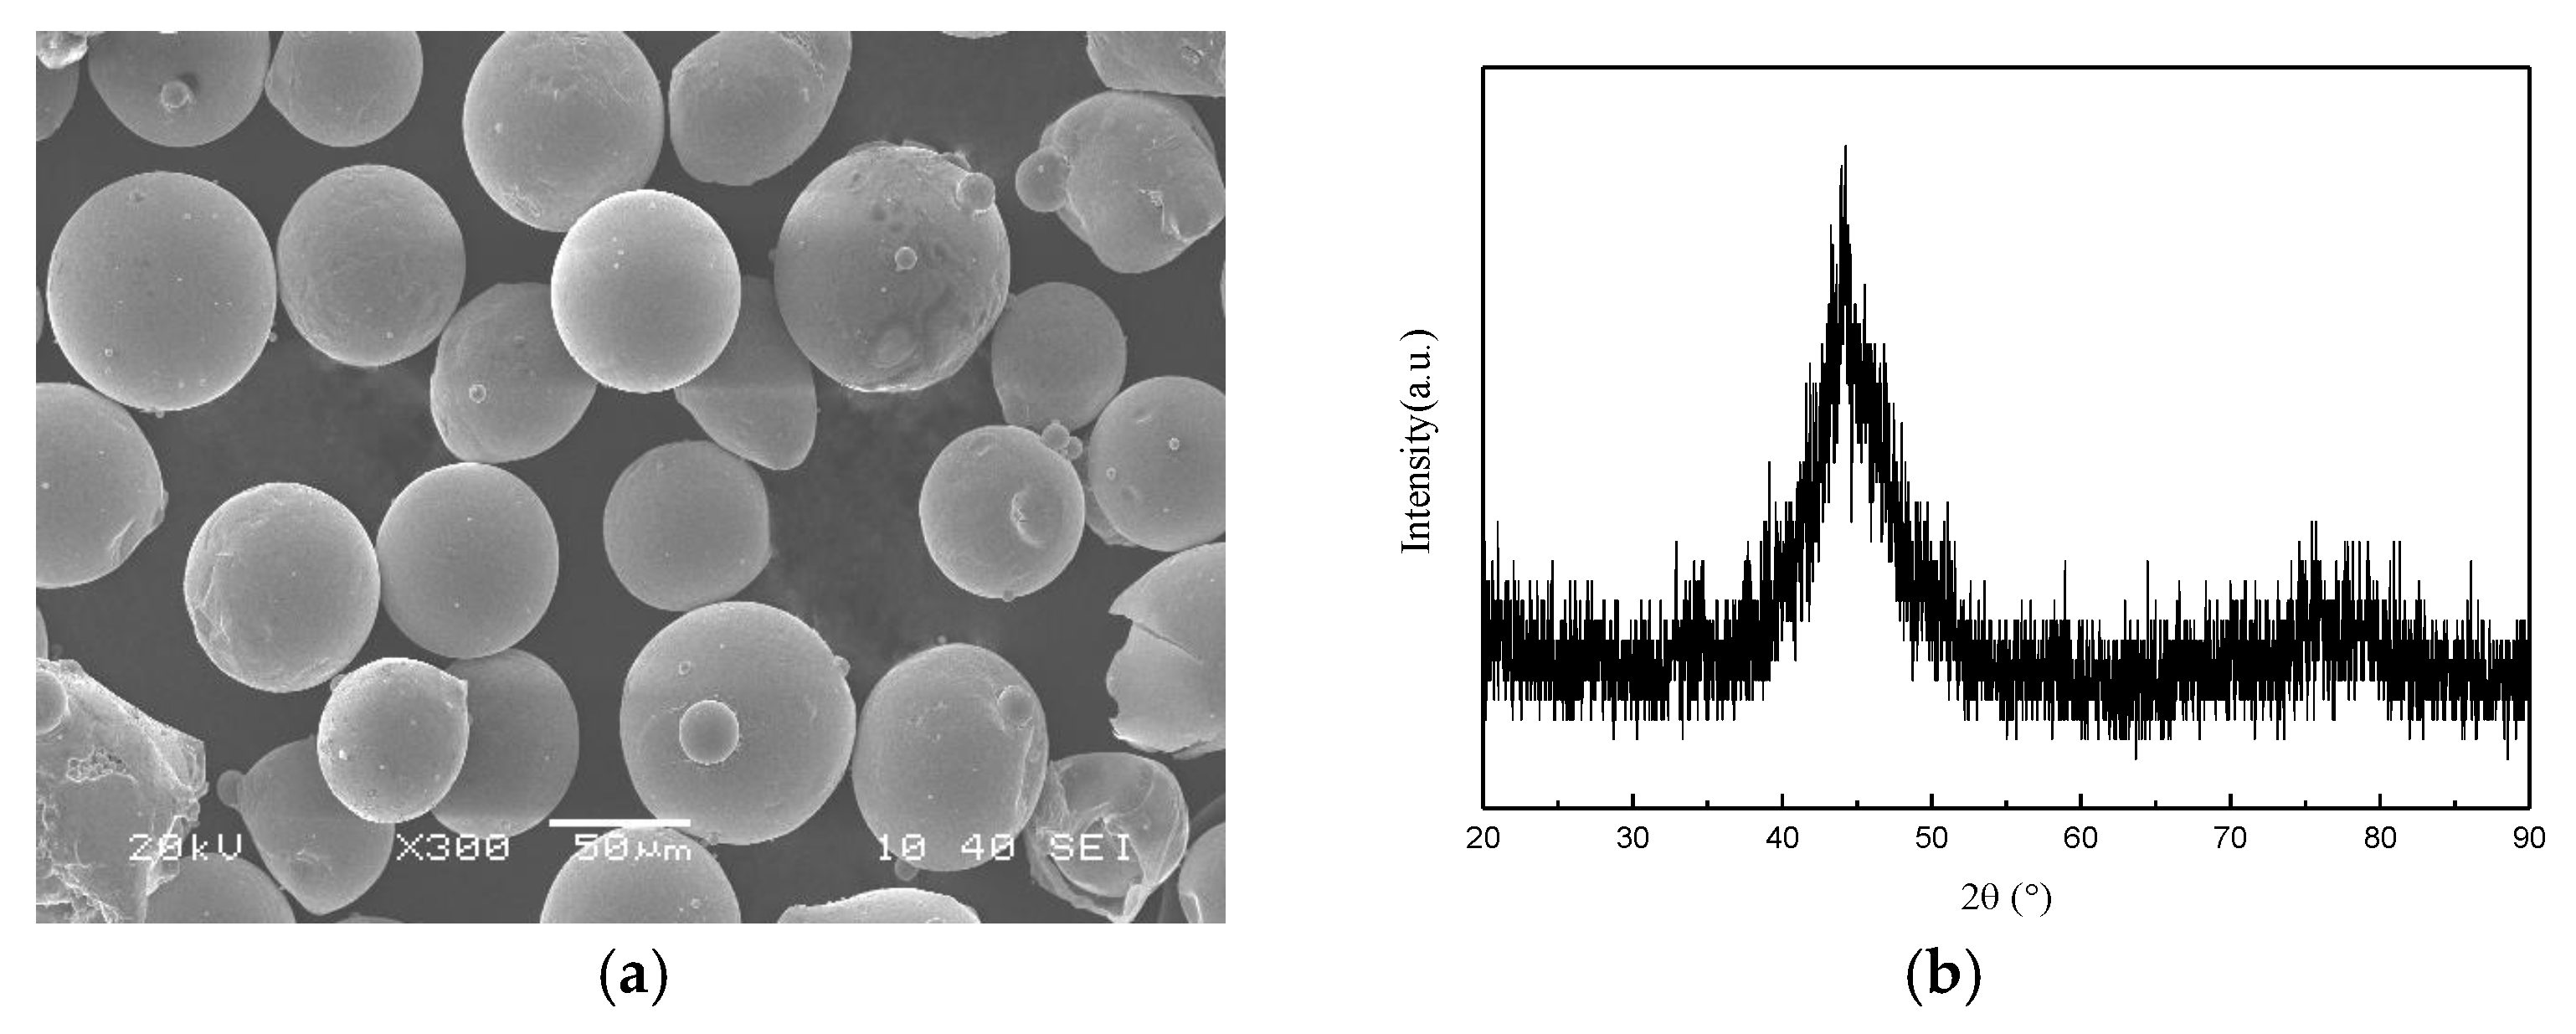
3 (at.%) alloy powders that were used in this study were obtained by high pressure argon atomization. The macroscopic appearance of the powder and its X-ray diffraction (XRD, Shimadzu Corporation, Kyoto, Japan) pattern are shown in
Figure 1. As shown in
Figure 1a, the powder granules are very uniform with spherical shape. The powder diameter is in the range of 50–75 μm, which ensures the fluency of powder transmission during cladding process. As shown in
Figure 1b, the XRD spectrum of the powder shows a widened diffuse scattering peak around 44° with some faint crystal peaks embedded, indicating that the Ni-Fe-B-Si-Nb-C alloy powder that was used in the cladding is mainly amorphous and contains very few crystalline phases. The base material used in this research is AISI 1045 steel with a hardness of ~200 HV and its chemical compositions is shown in
Table 1.
Before laser cladding experiment, the powder was dried at 200 °C to remove moisture. The cladding scanning speed and power of laser were 64 mm/s and 3600 W, respectively. The feeding rate of powder was 19 g/min. The distance between laser cladding nozzle and substrate surface was 15 mm. After laser cladding, the composition of the central phase of the coating was analyzed by XRD (40 kV, Cu Kα radiation, scanning range 20°–90°, scanning speed 4°/min, step size 0.02°). The microstructure of the coating was observed by scanning electron microscopy (SEM, Carl Zeiss Microscopy GmbH, Jena, Germany).
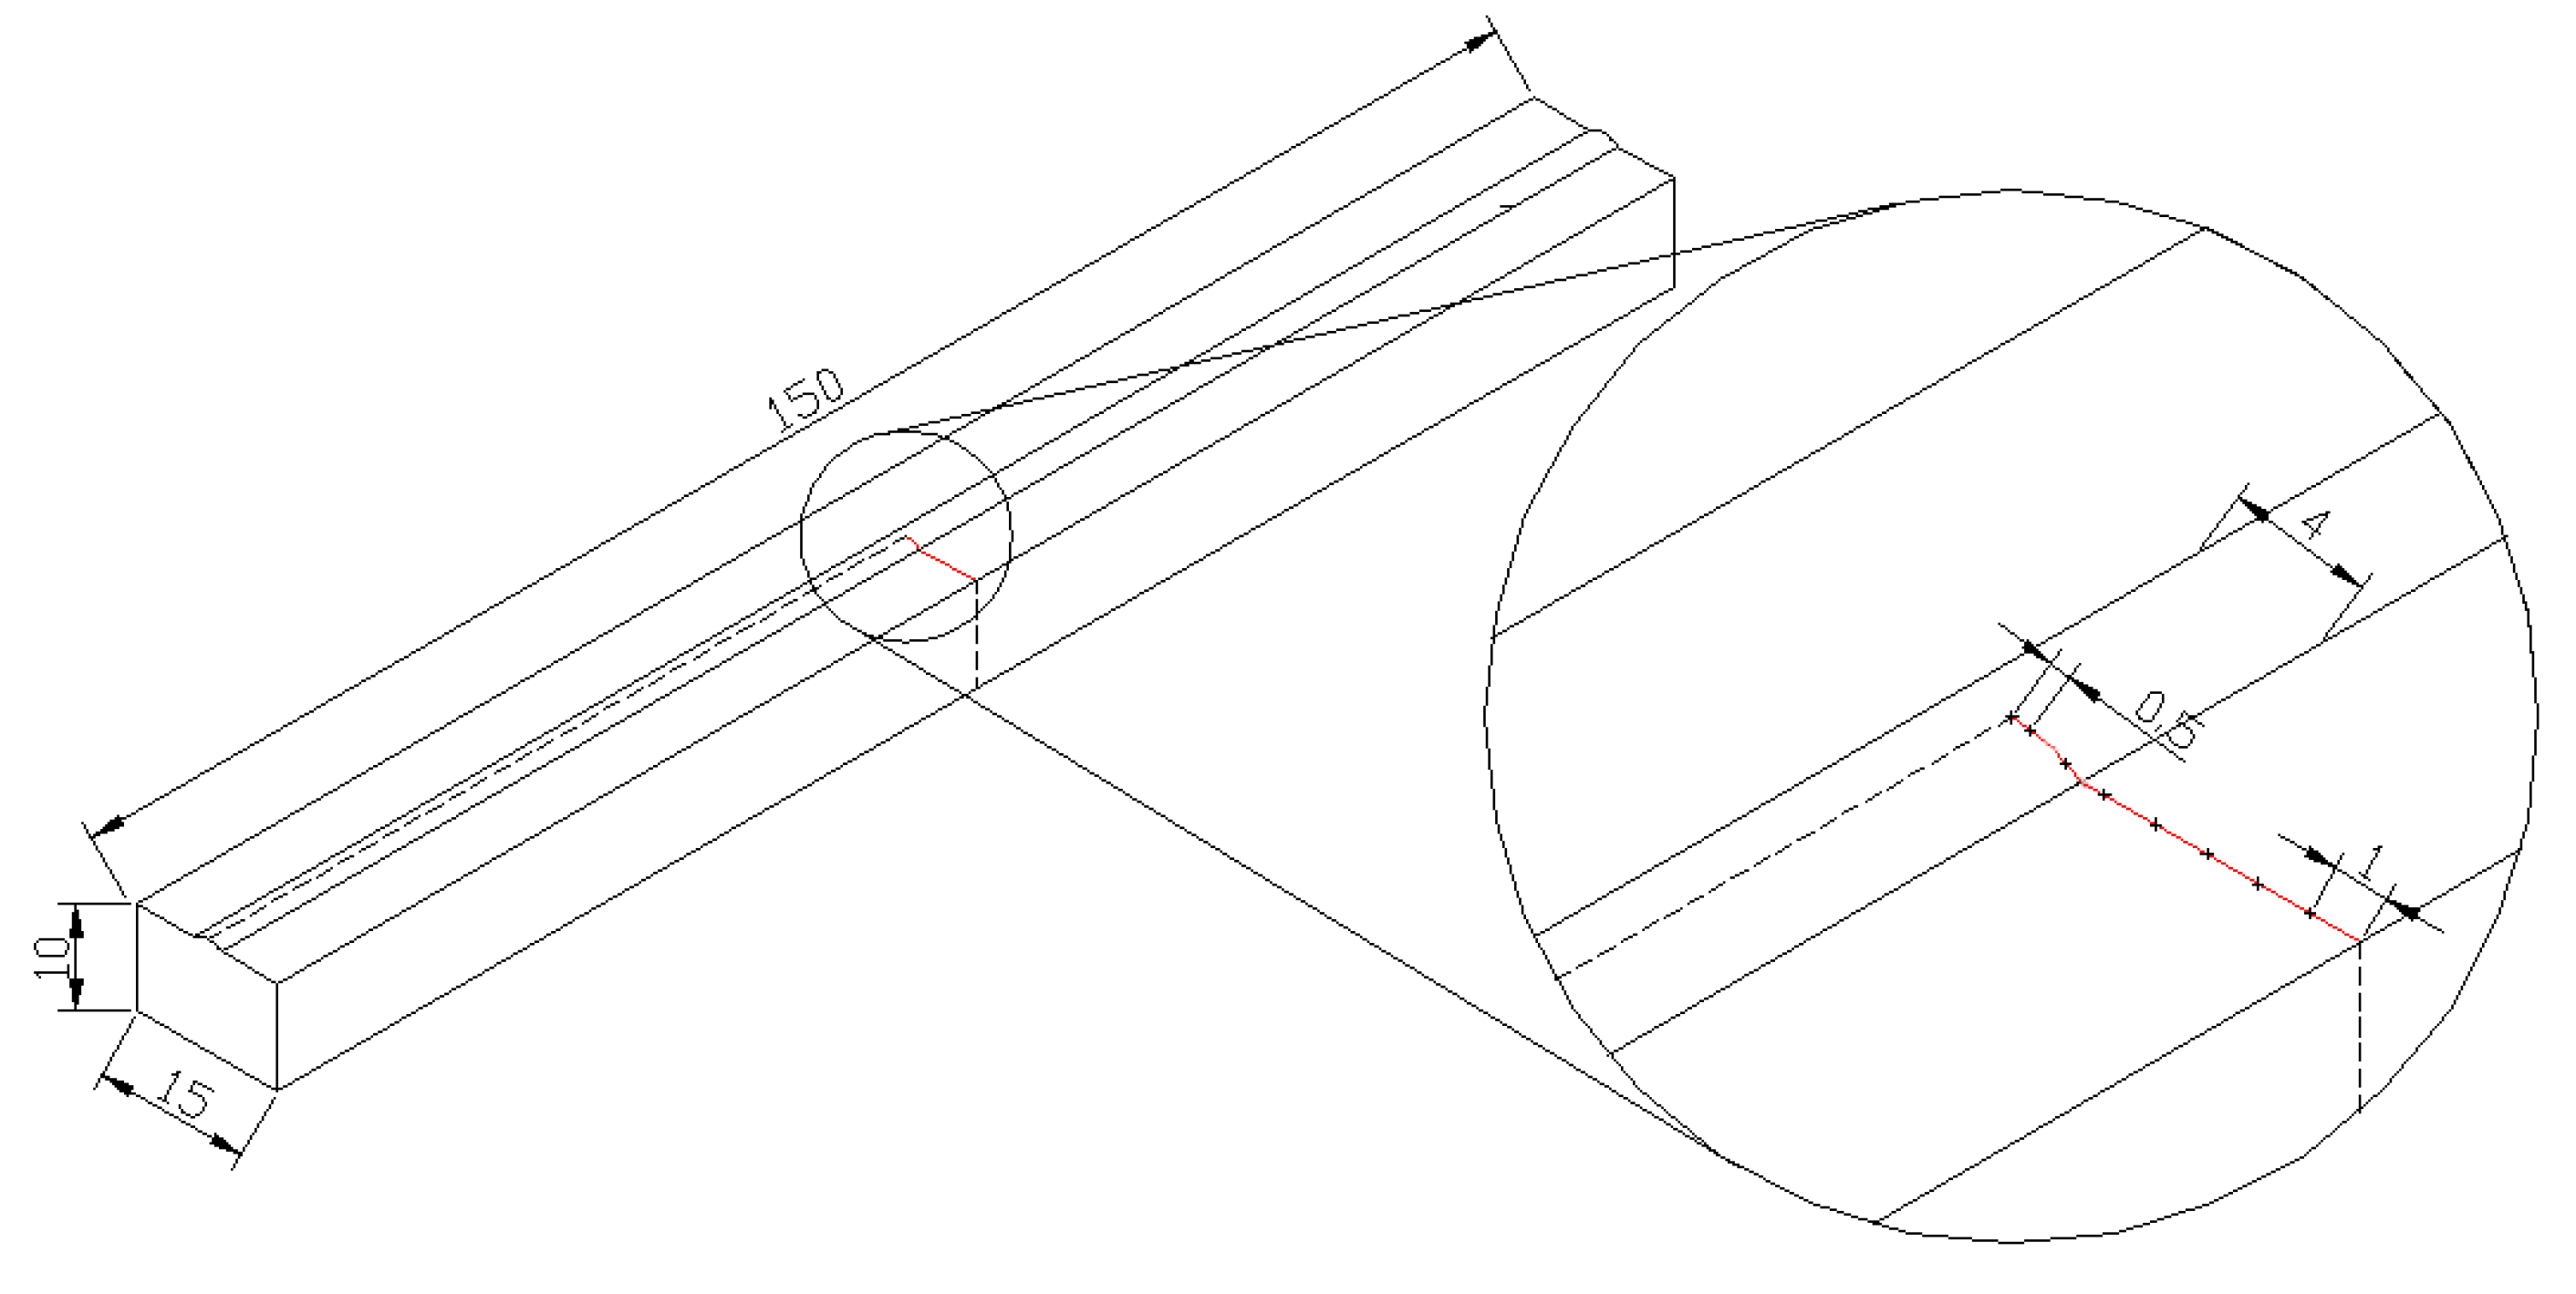
X-350A X-ray stress tester (Aster Stress Technology Co., Ltd., Handan, Hebei, China) was used to measure the residual stress of the clad and substrate. The test positions are distributed as shown in
Figure 2.
Lx was the test area along the path perpendicular to the laser cladding scan direction. The starting point was 0.5 mm away from the center axis, and the test points were separated by 1 mm for longitudinal and transverse residual stress measurement.
3. Microstructure and Phase Composition of Coating
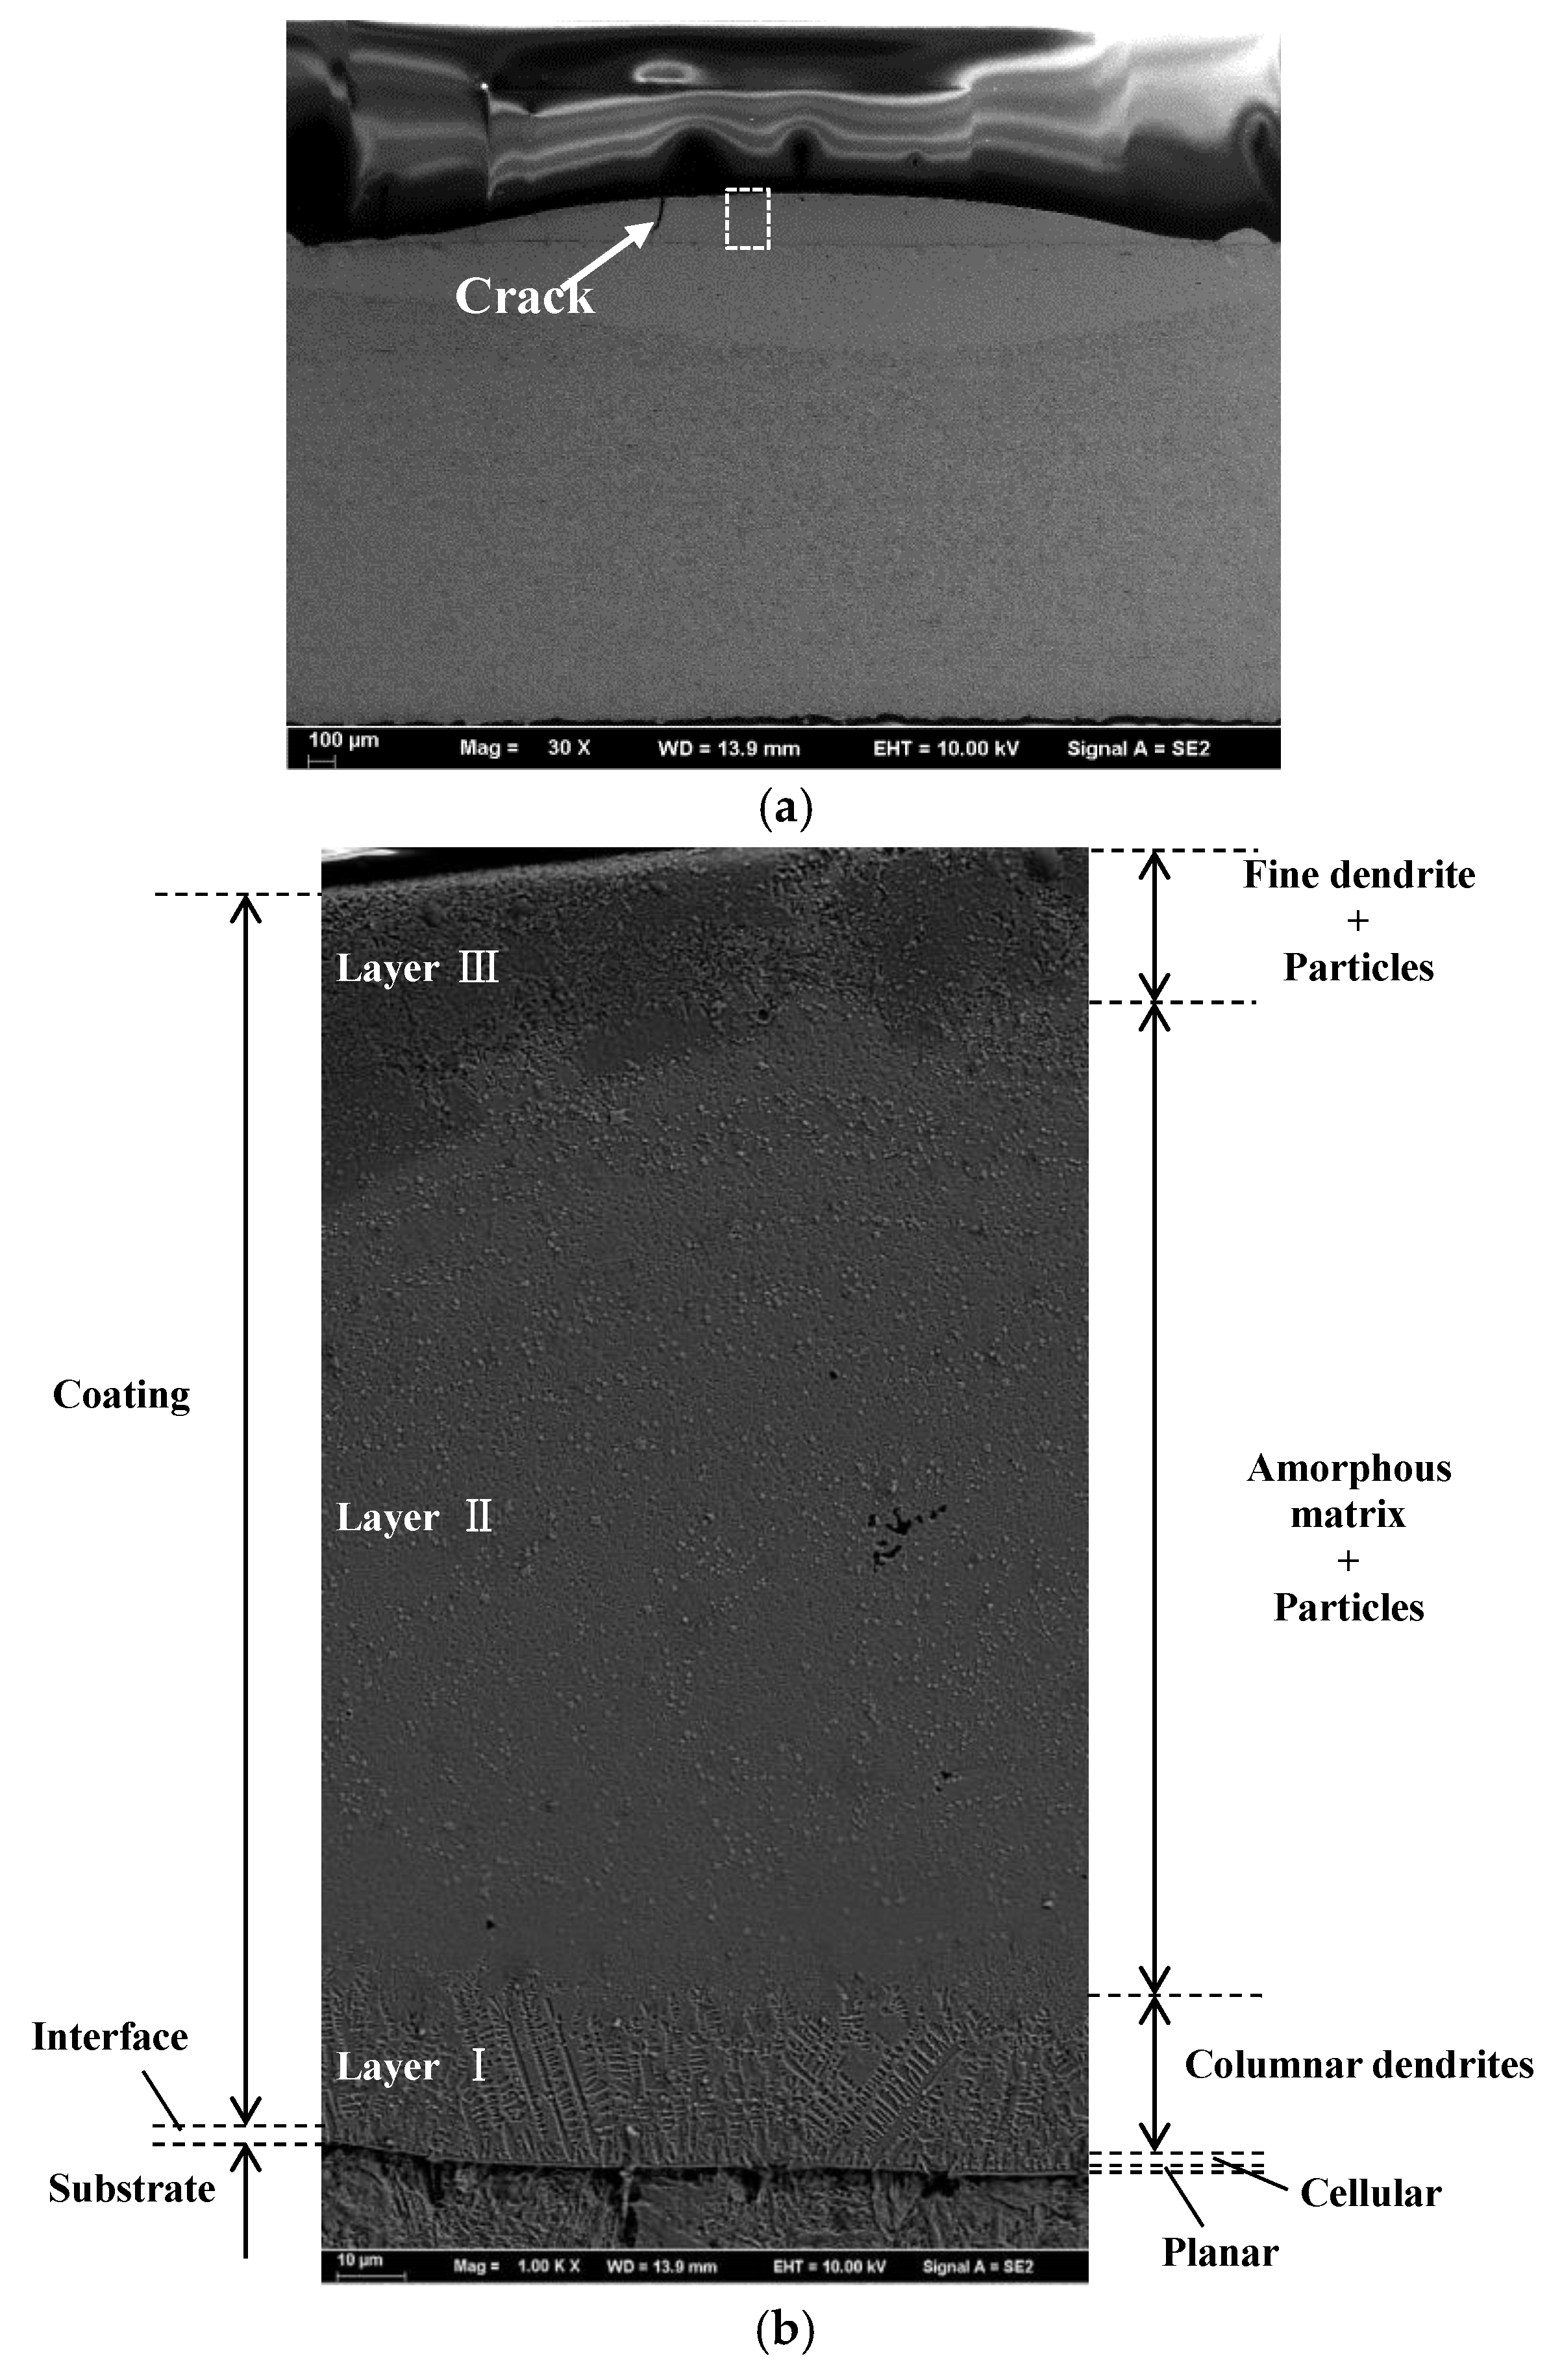
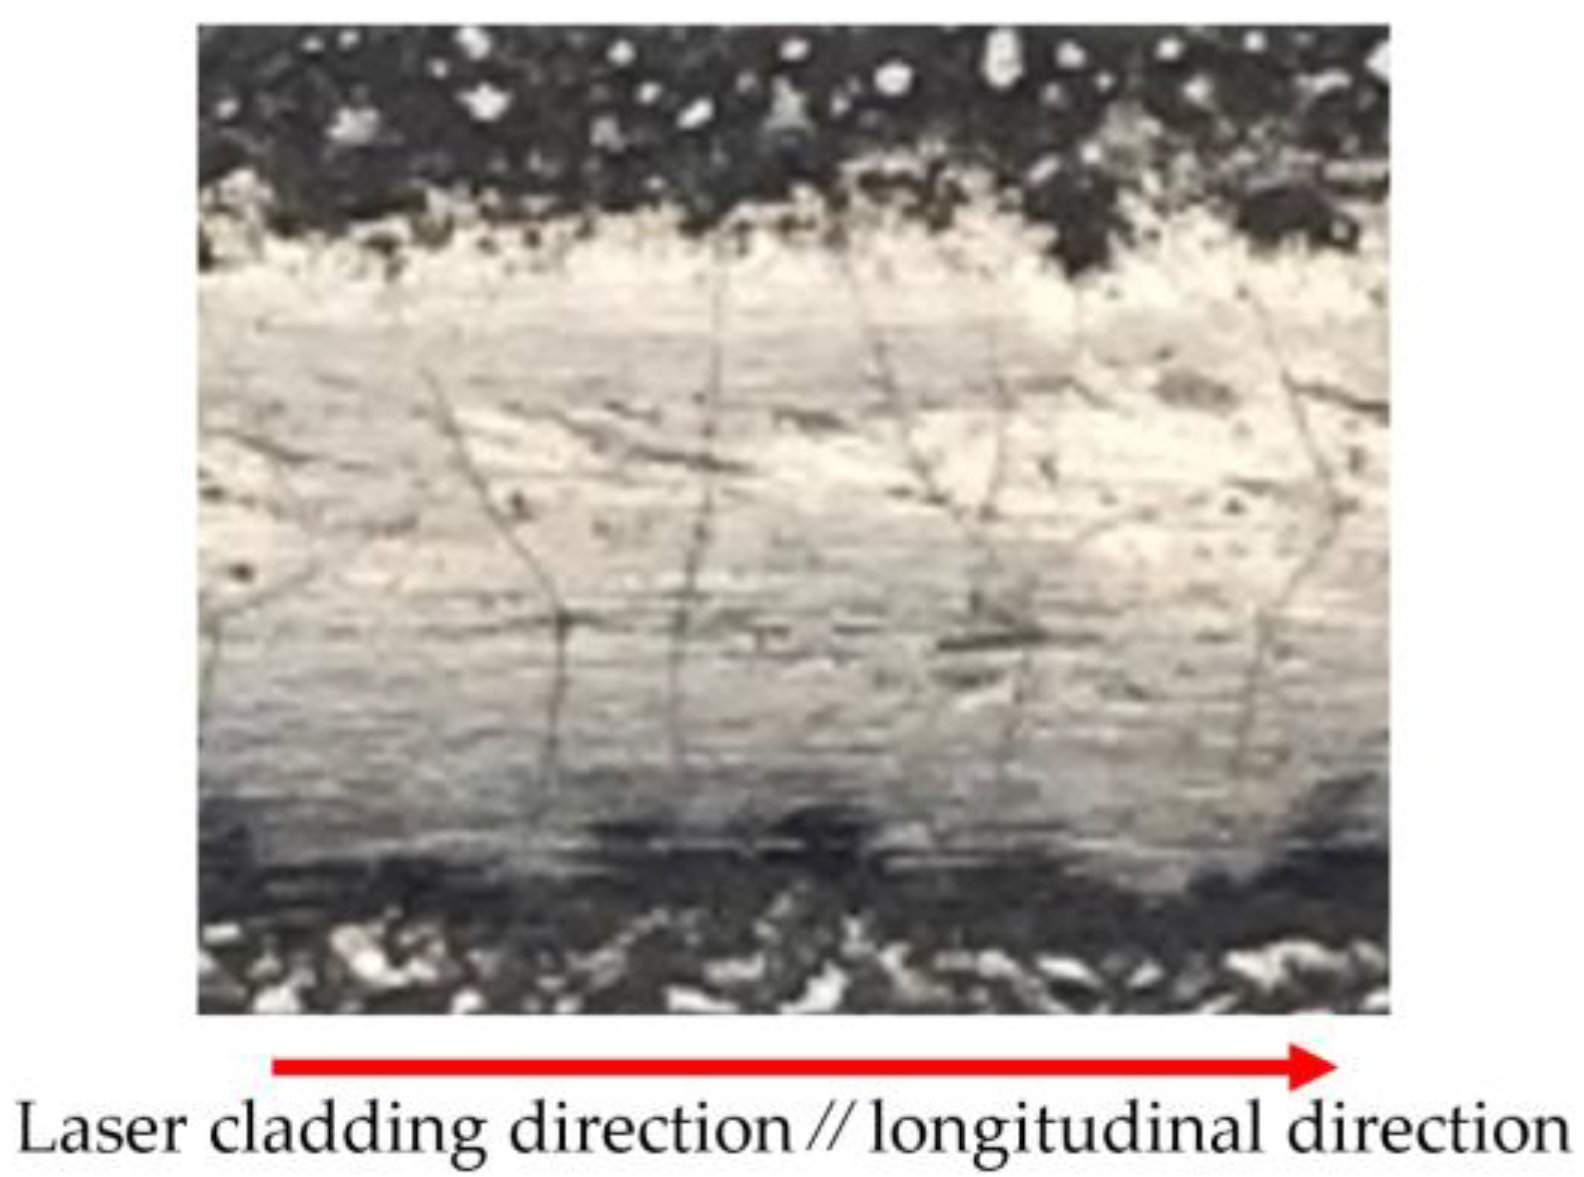
Figure 3a shows the morphology of the laser cladded coating on the cross-sectional view. The thickness of the coating is about 0.2 mm. The fusion line between the coating and the substrate is relatively stable and no obvious dilution can be observed. There is also a crack formed in the coating.
Figure 3b shows the microstructure within the white dotted rectangle in
Figure 3a. The microstructure can be divided into three regions: coating, coating/substrate fusion zone, and the substrate. There exists different microstructure in different regions of coating. They are columnar dendrites (Layer I), amorphous phase + NbC particles (Layer II), and fine dendrites + NbC particles (Layer III).
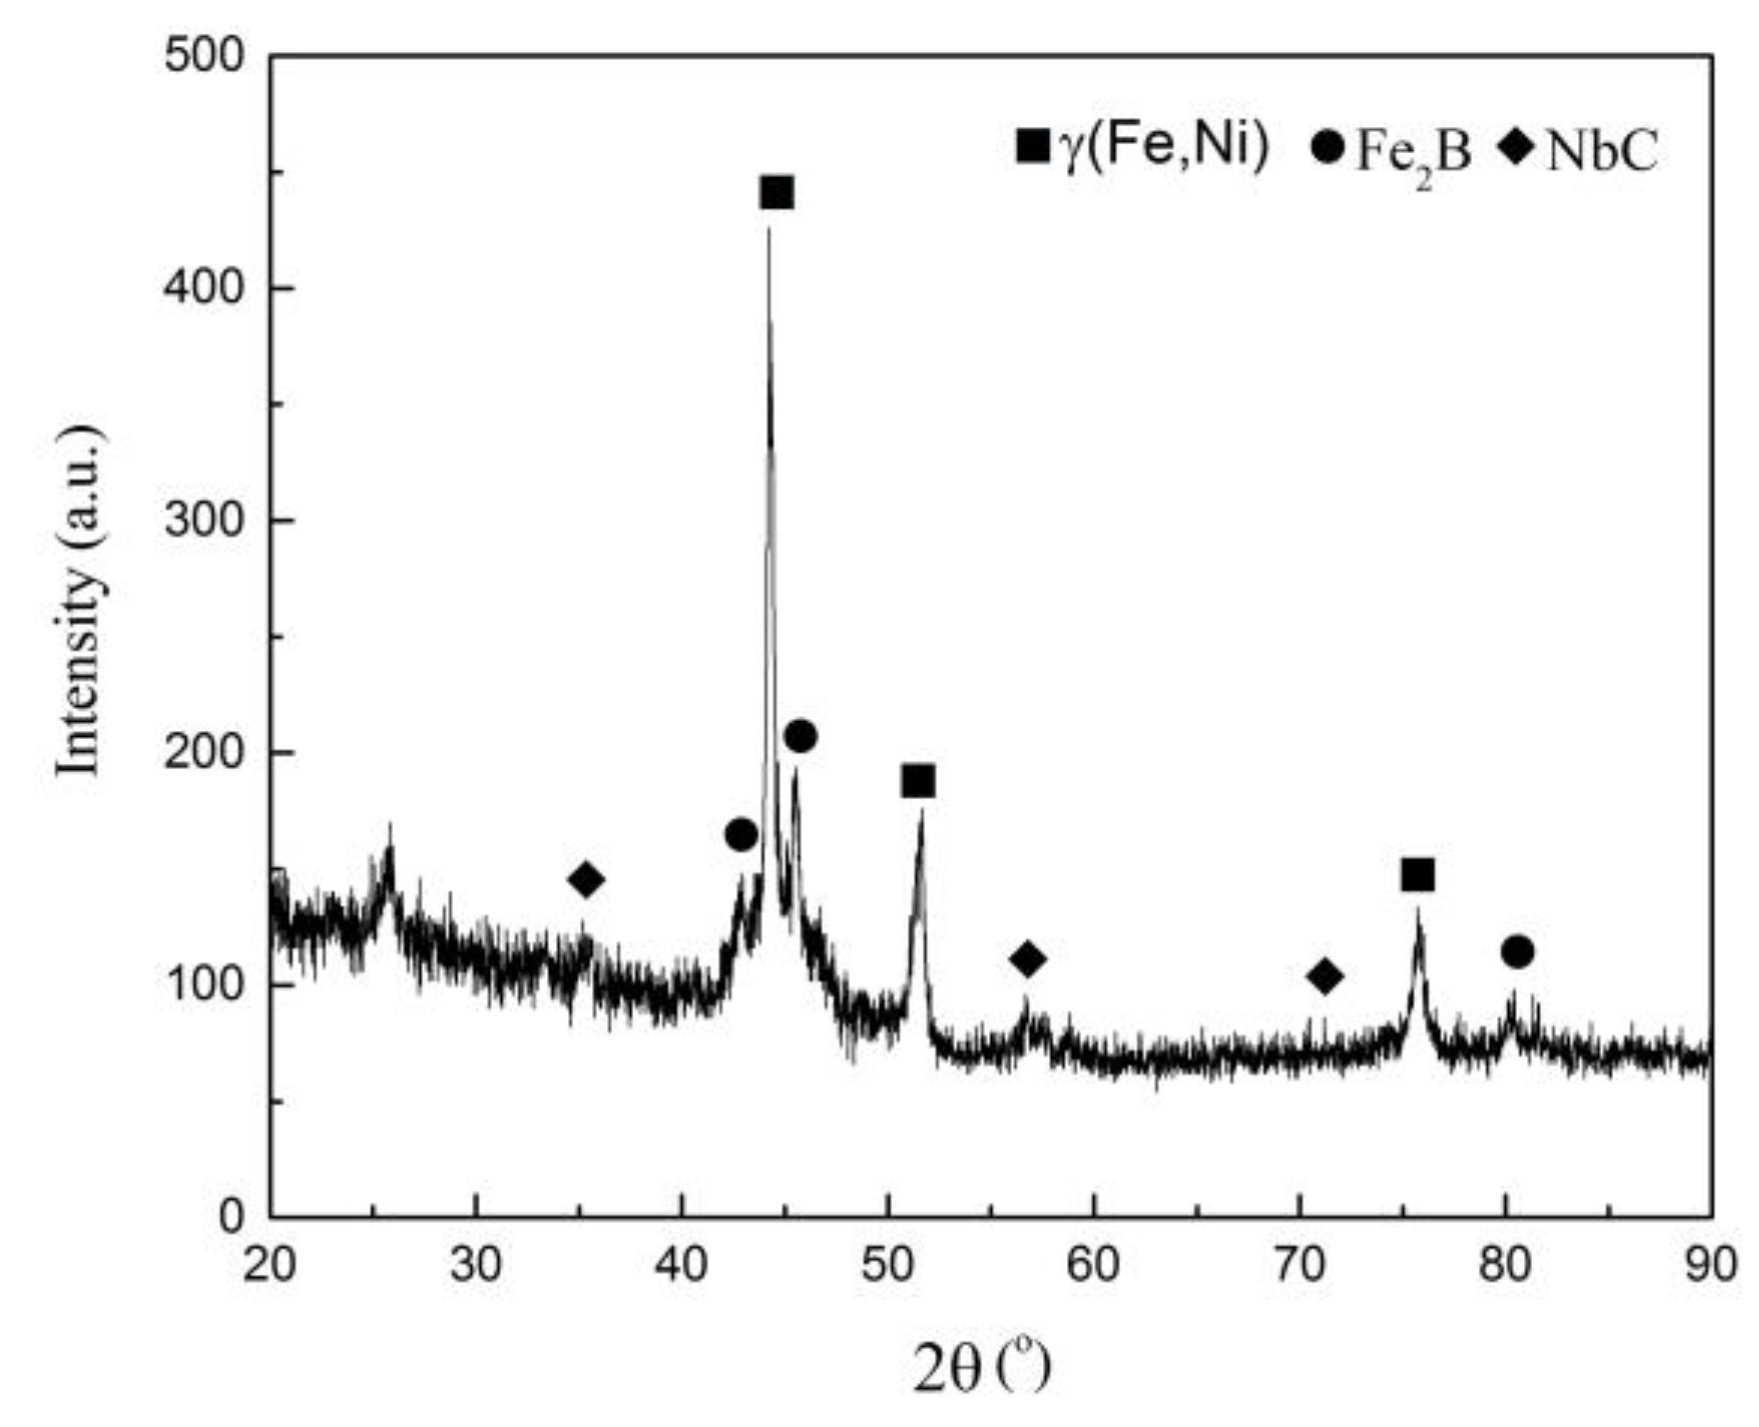
Figure 4 shows the XRD spectrum of the laser cladded coating. An amorphous diffuse peak and few sharp crystal diffraction peaks were produced near the 44° (2θ) angle. The crystal peaks were identified as γ(Fe, Ni), Fe
2B, and NbC phases, respectively, after retrieving the standard PDF card. To calculate the volume fraction from XRD results (
Figure 4), the integrated areas of the amorphous and crystalline peaks were separated while using computer software and the
Vf of amorphous phase was calculated while using the following equation [
16]:
where
Vf is the volume fraction of amorphous phase in the coating formed by laser cladding process.
Aamor and
Acryst are the total integrated area corresponding to crystalline and amorphous phases, respectively [
16]. The results showed that the volume fraction of amorphous phase in the middle of the coating was about 66.9%.
4. Finite Element Simulation
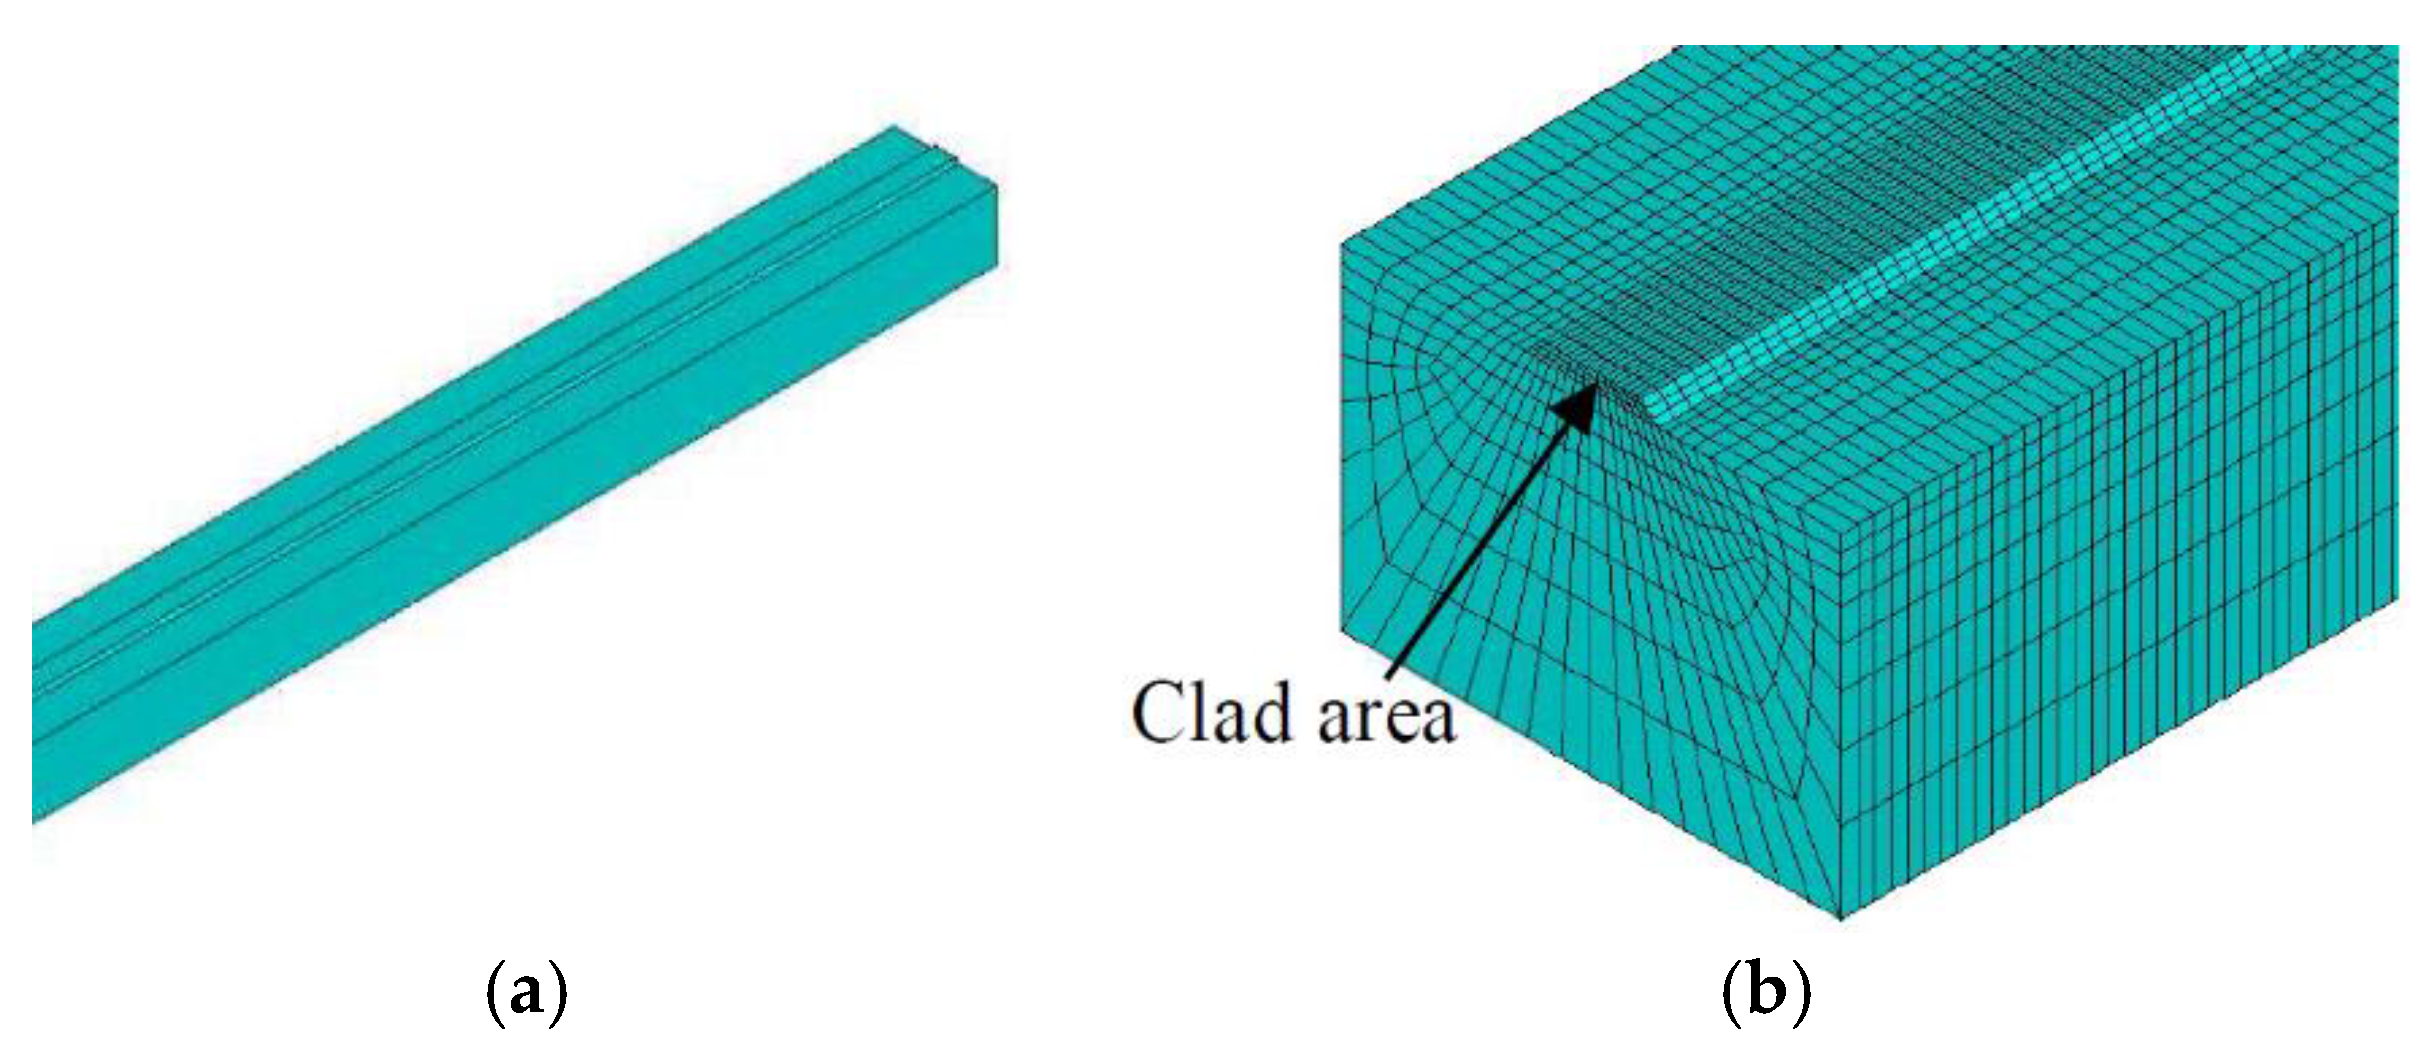
Finite element model of the laser cladded coating was established in the ANSYS software preprocessing module (/PREP7). Because the coating is very thin and the angle between the coating and the coating/substrate interface is very small, it is difficult to mesh and obtain an accurate simulation result. Then, the trapezoidal model was used instead of the original size. Due to the higher temperature and stress gradient in and near the coating, the elements in the model were arranged while using the mapping and non-uniform mesh as shown in
Figure 5. The thermal properties of the substrate and the cladding alloys are obtained from the reference [
10]. The latent heat of fusion 60.73 kJ/kg was used to assume the solid/liquid phase transformation. The mechanical properties used for residual stress simulation are given in
Table 2 and
Table 3. In this paper, the element birth and death method was used to simulate the temperature field.
The governing equation of heat conduction in Cartesian coordinates is given by:
where
x,
y, and
z are Cartesian coordinates,
k is thermal conductivity,
c is specific heat,
Q is surface heat flux,
T is temperature, and
t is time. A surface heat flux (
Q) in Gaussian distribution was applied on the coating, and the distribution of the heat flux is described, as follows:
where η is heat transfer efficiency (η = 0.85),
P is laser power (
P = 3600 W),
R is beam radius (
R = 2.5 mm), and
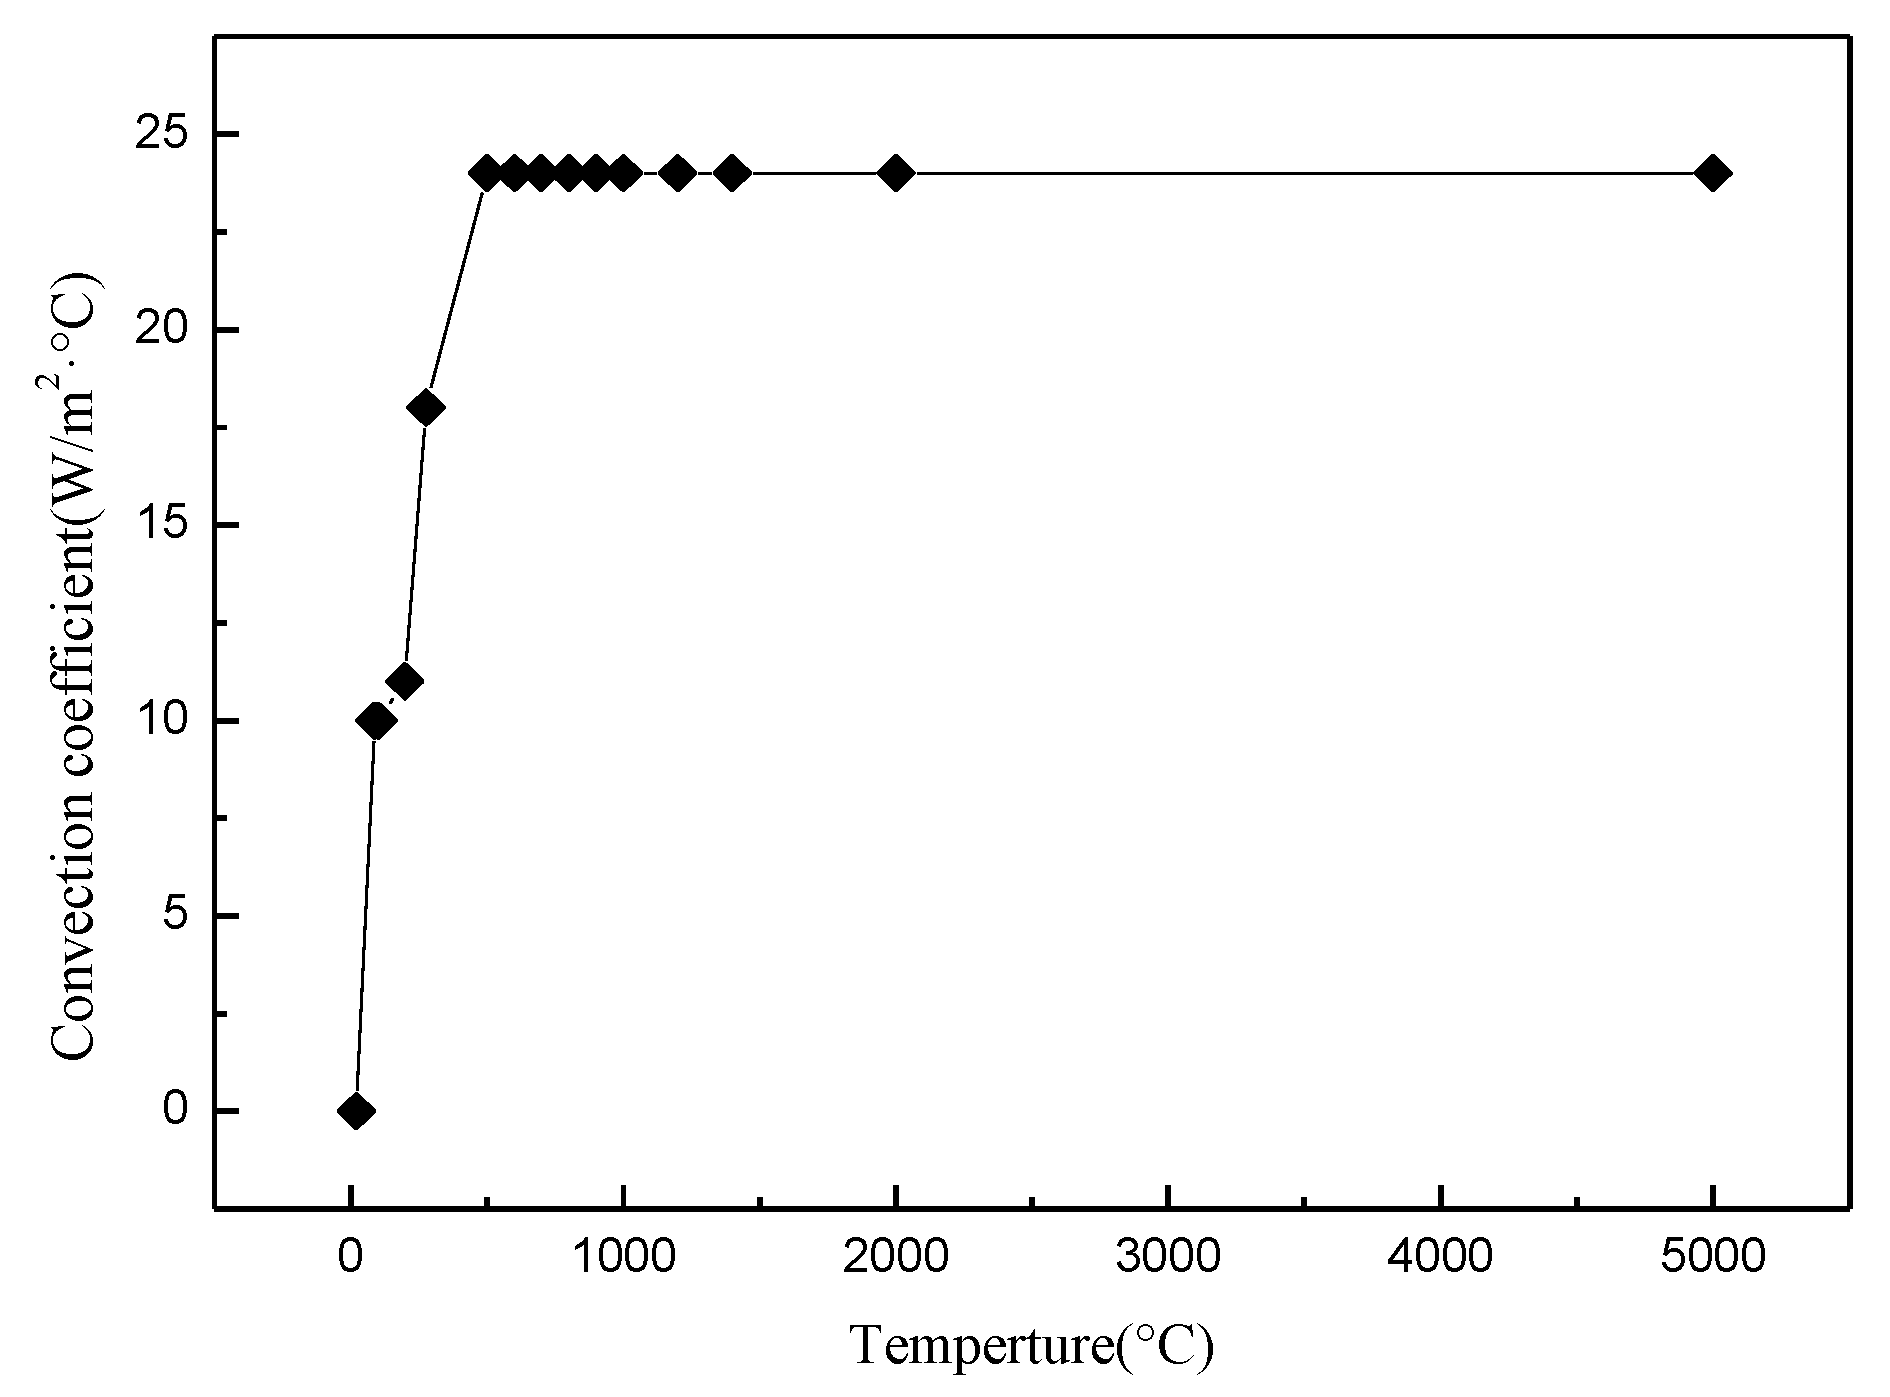
r is the distance from the center of the laser beam. At the boundaries, the heat losses from the plate surfaces to the surroundings took place by means of natural convection and radiation effects. In this study, the radiation effects were ignored and the convection coefficients at different degrees are shown in
Figure 6.
Mechanical (stress) simulation is based on the thermo-elastic–plastic model. The nonlinear analysis of residual stress in the laser cladding process is based on the strains that are generated from expansion and contraction due to the thermal gradient, elastic effects, plastic strains, volumetric changes, and transformation plasticity. The total generated strains can be expressed, as follows:
where
is the elastic strain increment,
is the thermal strain increment,
is the plastic strain increment,
is the phase transformation strain increment, and
is the volumetric strain increment. As for boundary conditions, the substrate was assumed to be stress free at the beginning of the process. To simulate the clamping effect on the substrate, the nodes on the bottom surface of the substrate were constrained to zero vertical displacement.
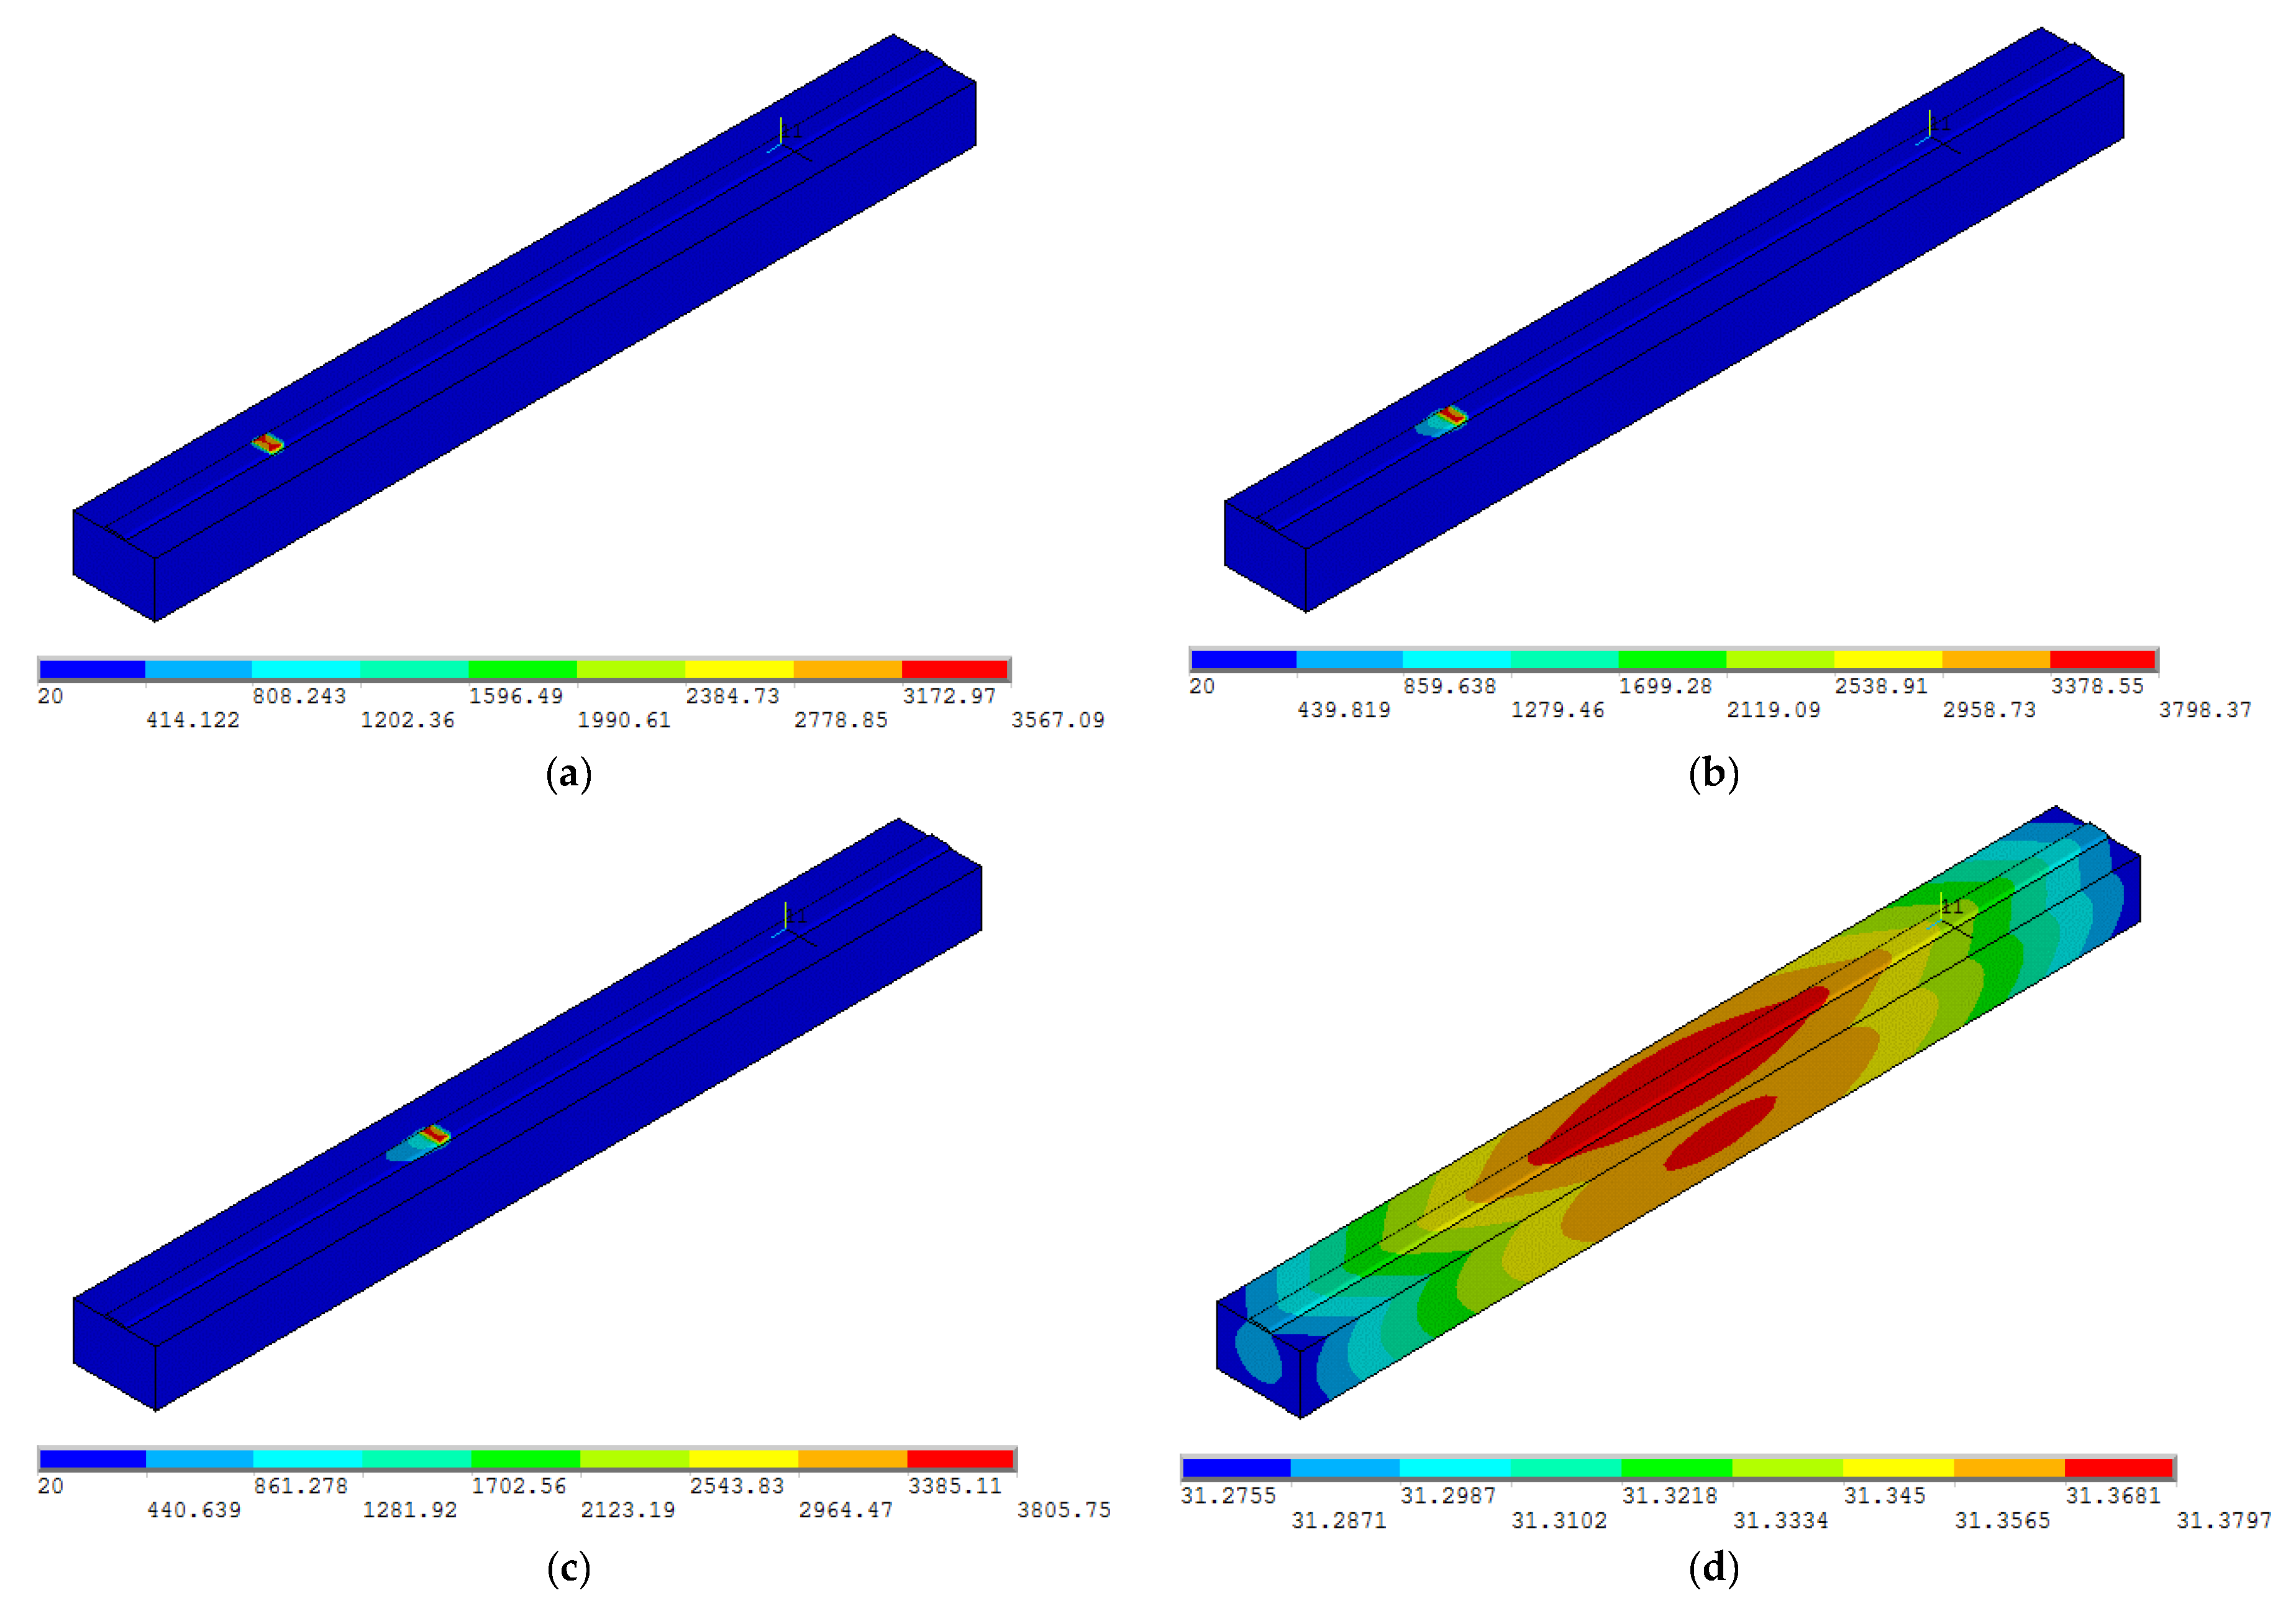
Figure 7 shows the distribution on temperature fields at different time moments. At the beginning (0.125 s), the higher temperature was located under the laser heat source and the peak temperature was about 3567 °C. With continuous movement of the heat source, the tail of the isothermal line was elongated to form an oval shape, and the peak temperature increased. In the initial stage of laser cladding, the peak temperature had a rapid rise period and it then was stabilized quickly. With the loading heat source moving forward, the laser heat input in the cladding process was basically balanced with the convection heat dissipation from the substrate surface and the elongated oval temperature field contour was basically stable. The temperature field in this state was called as quasi-steady-state temperature field. The laser cladding temperature field and the laser heat source moved forward at the same speed.
Figure 7d shows the temperature distribution under 1800 s of atmosphere cooling after laser cladding. The temperature of the substrate in each region was basically the same to about 31 °C, the room temperature.
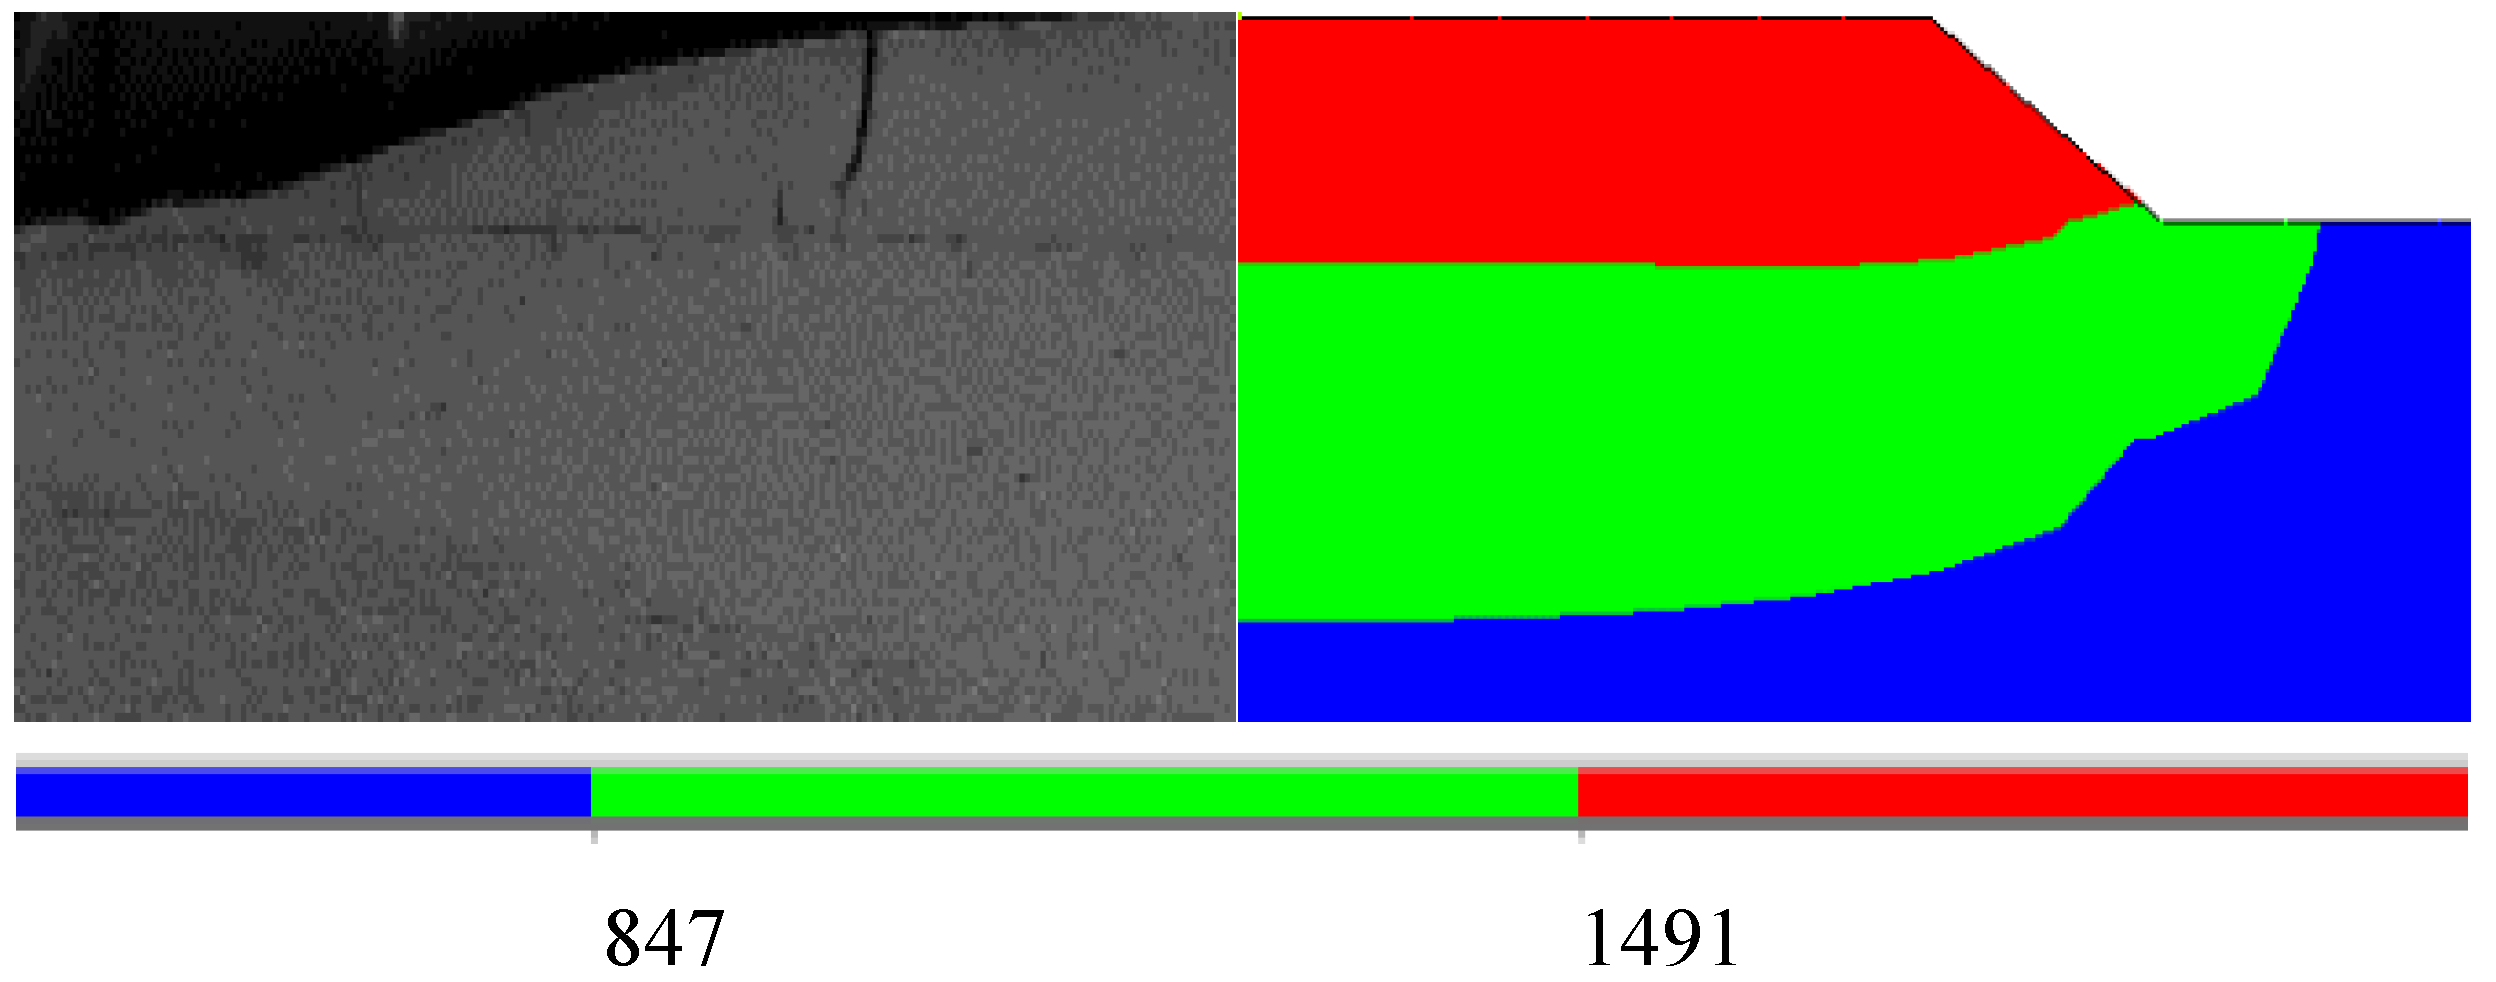
When the laser cladding time was 2 s, the temperature field was in a quasi-steady state. The cross-sectional temperature distribution of the coating perpendicular to the laser scanning direction is shown in
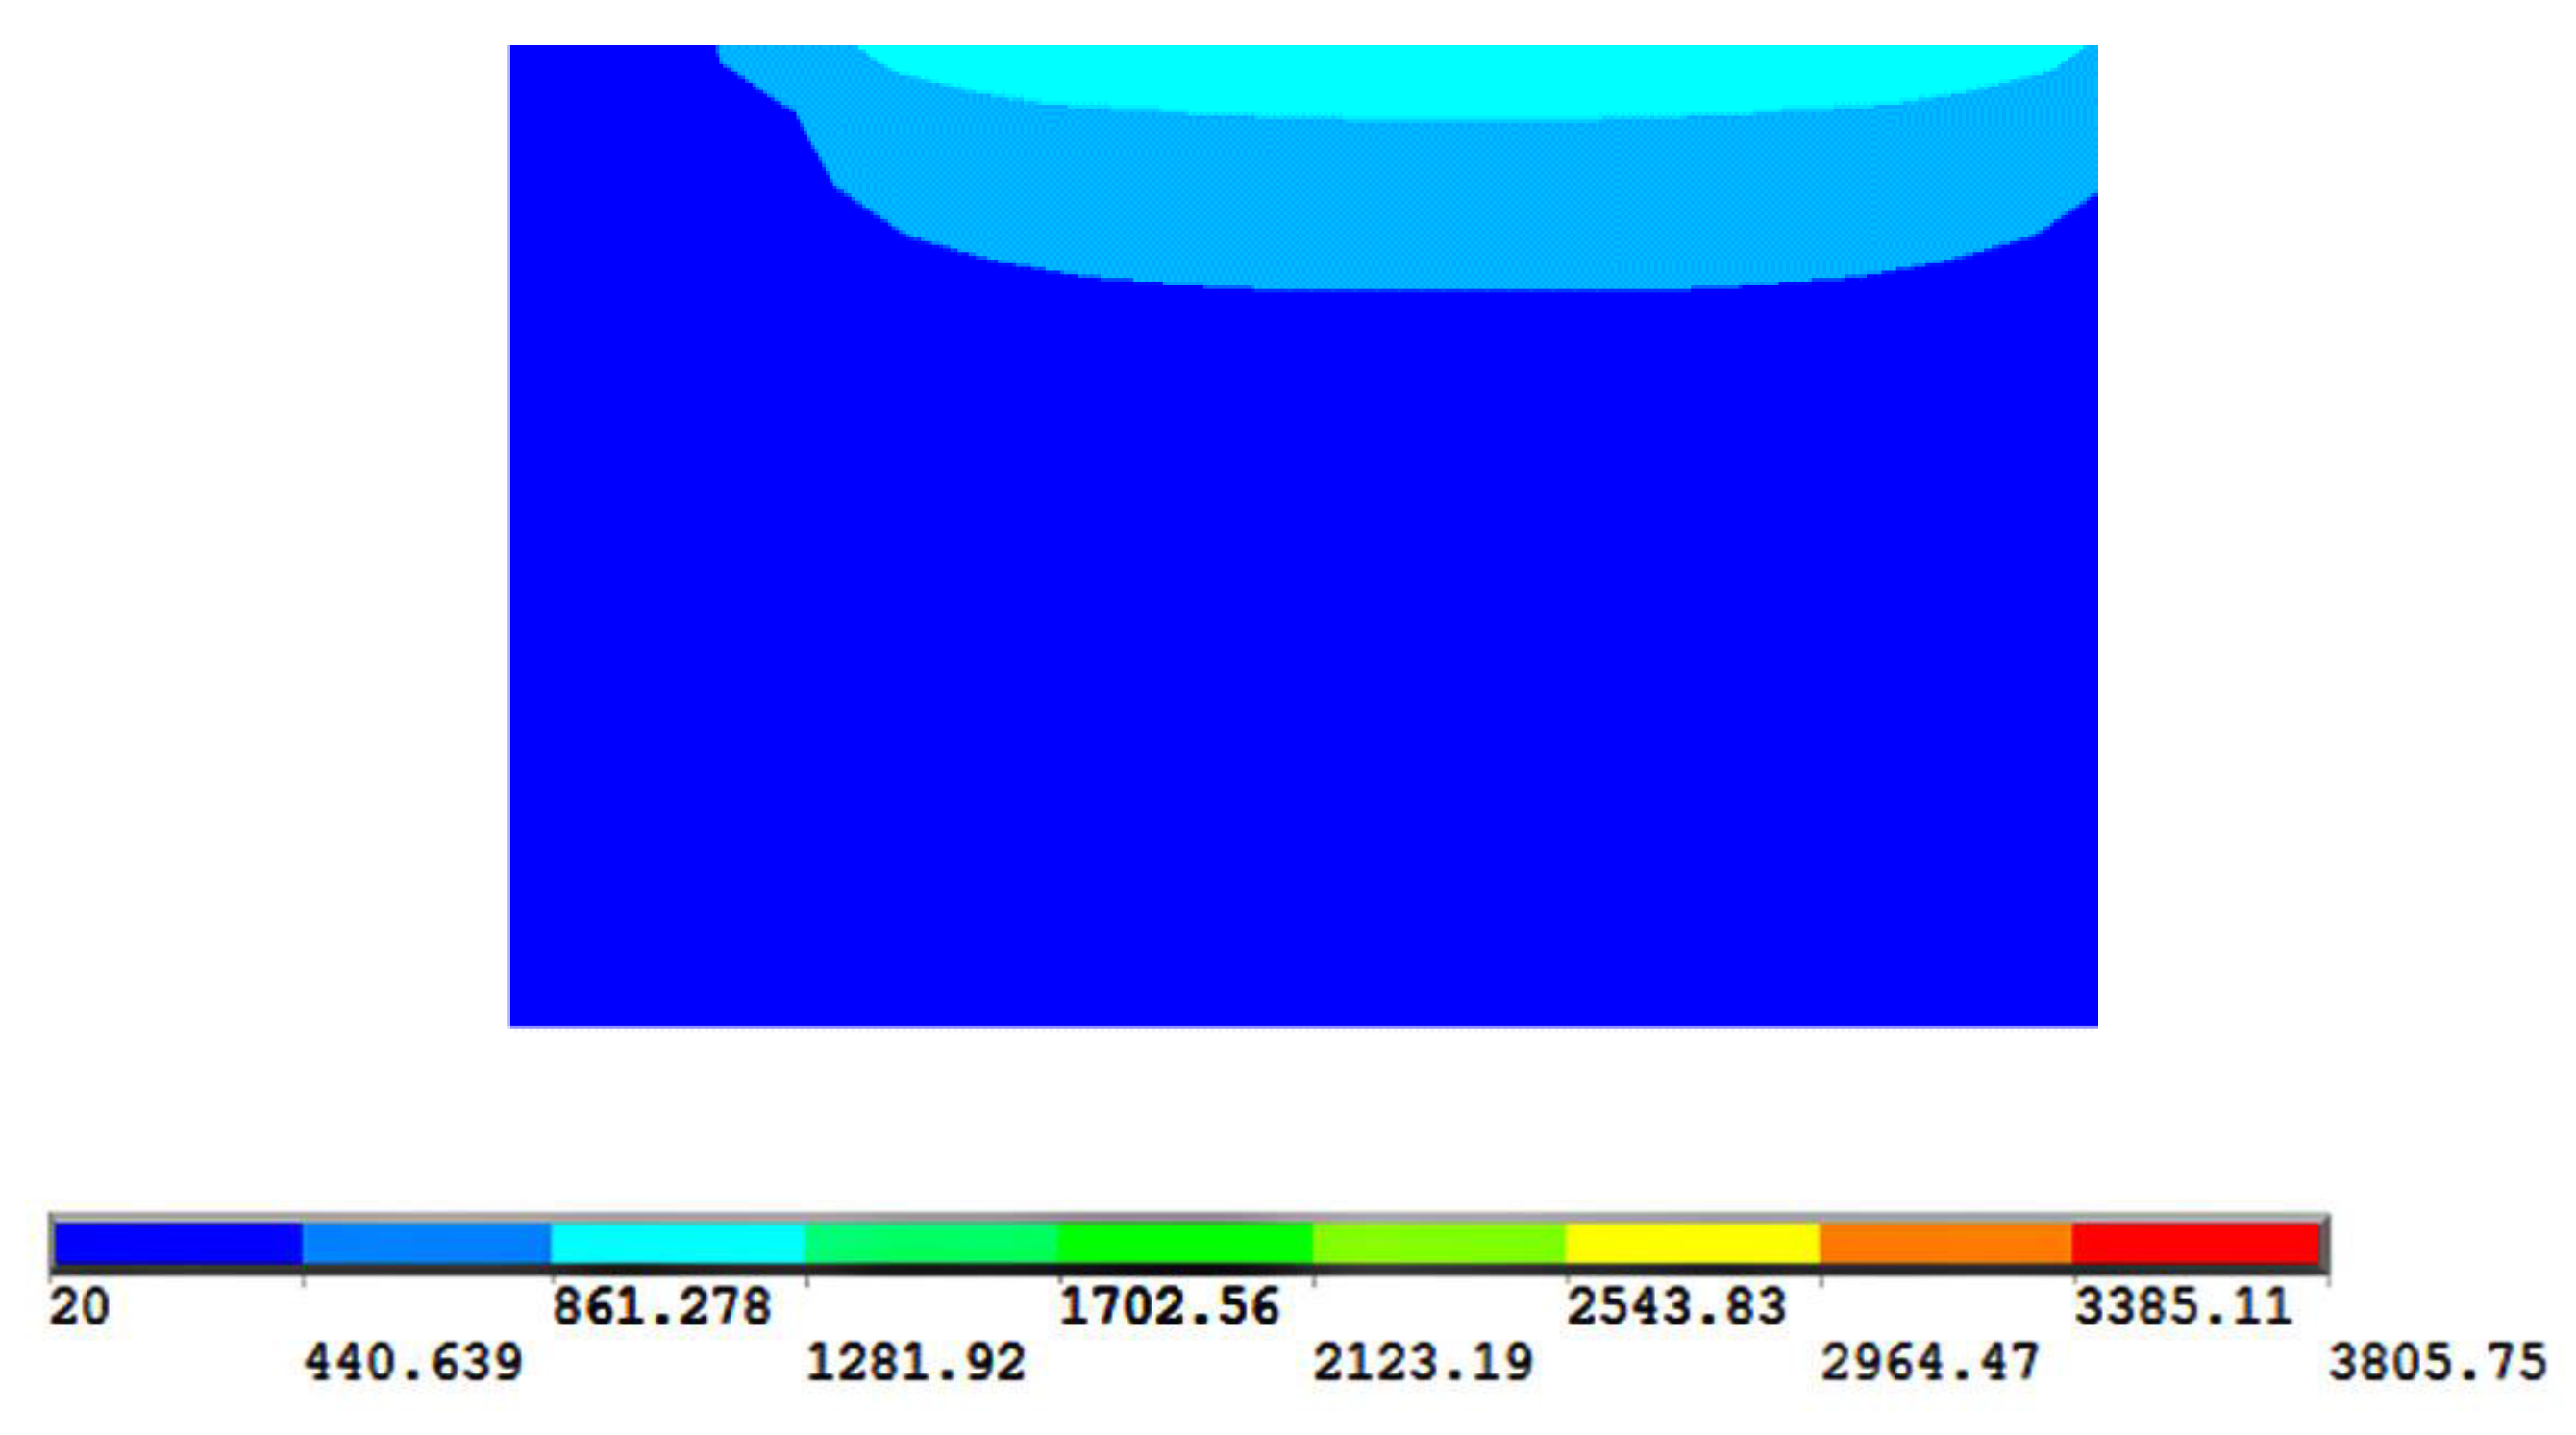
Figure 8. As the heat source firstly acted on the coating surface, the top surface of the coating had the highest temperature. The thermal conductivity of the substrate resulted in the temperature profile to decrease with the coating penetrated into the substrate. As shown in
Figure 9, the region in red color is higher than the melting point of 1491 °C, which indicates that the red color region was melted during the laser cladding process. The comparison between the experimental result and temperature field indicates that the temperature that was predicted by the developed model is in good agreement with the simulated results.
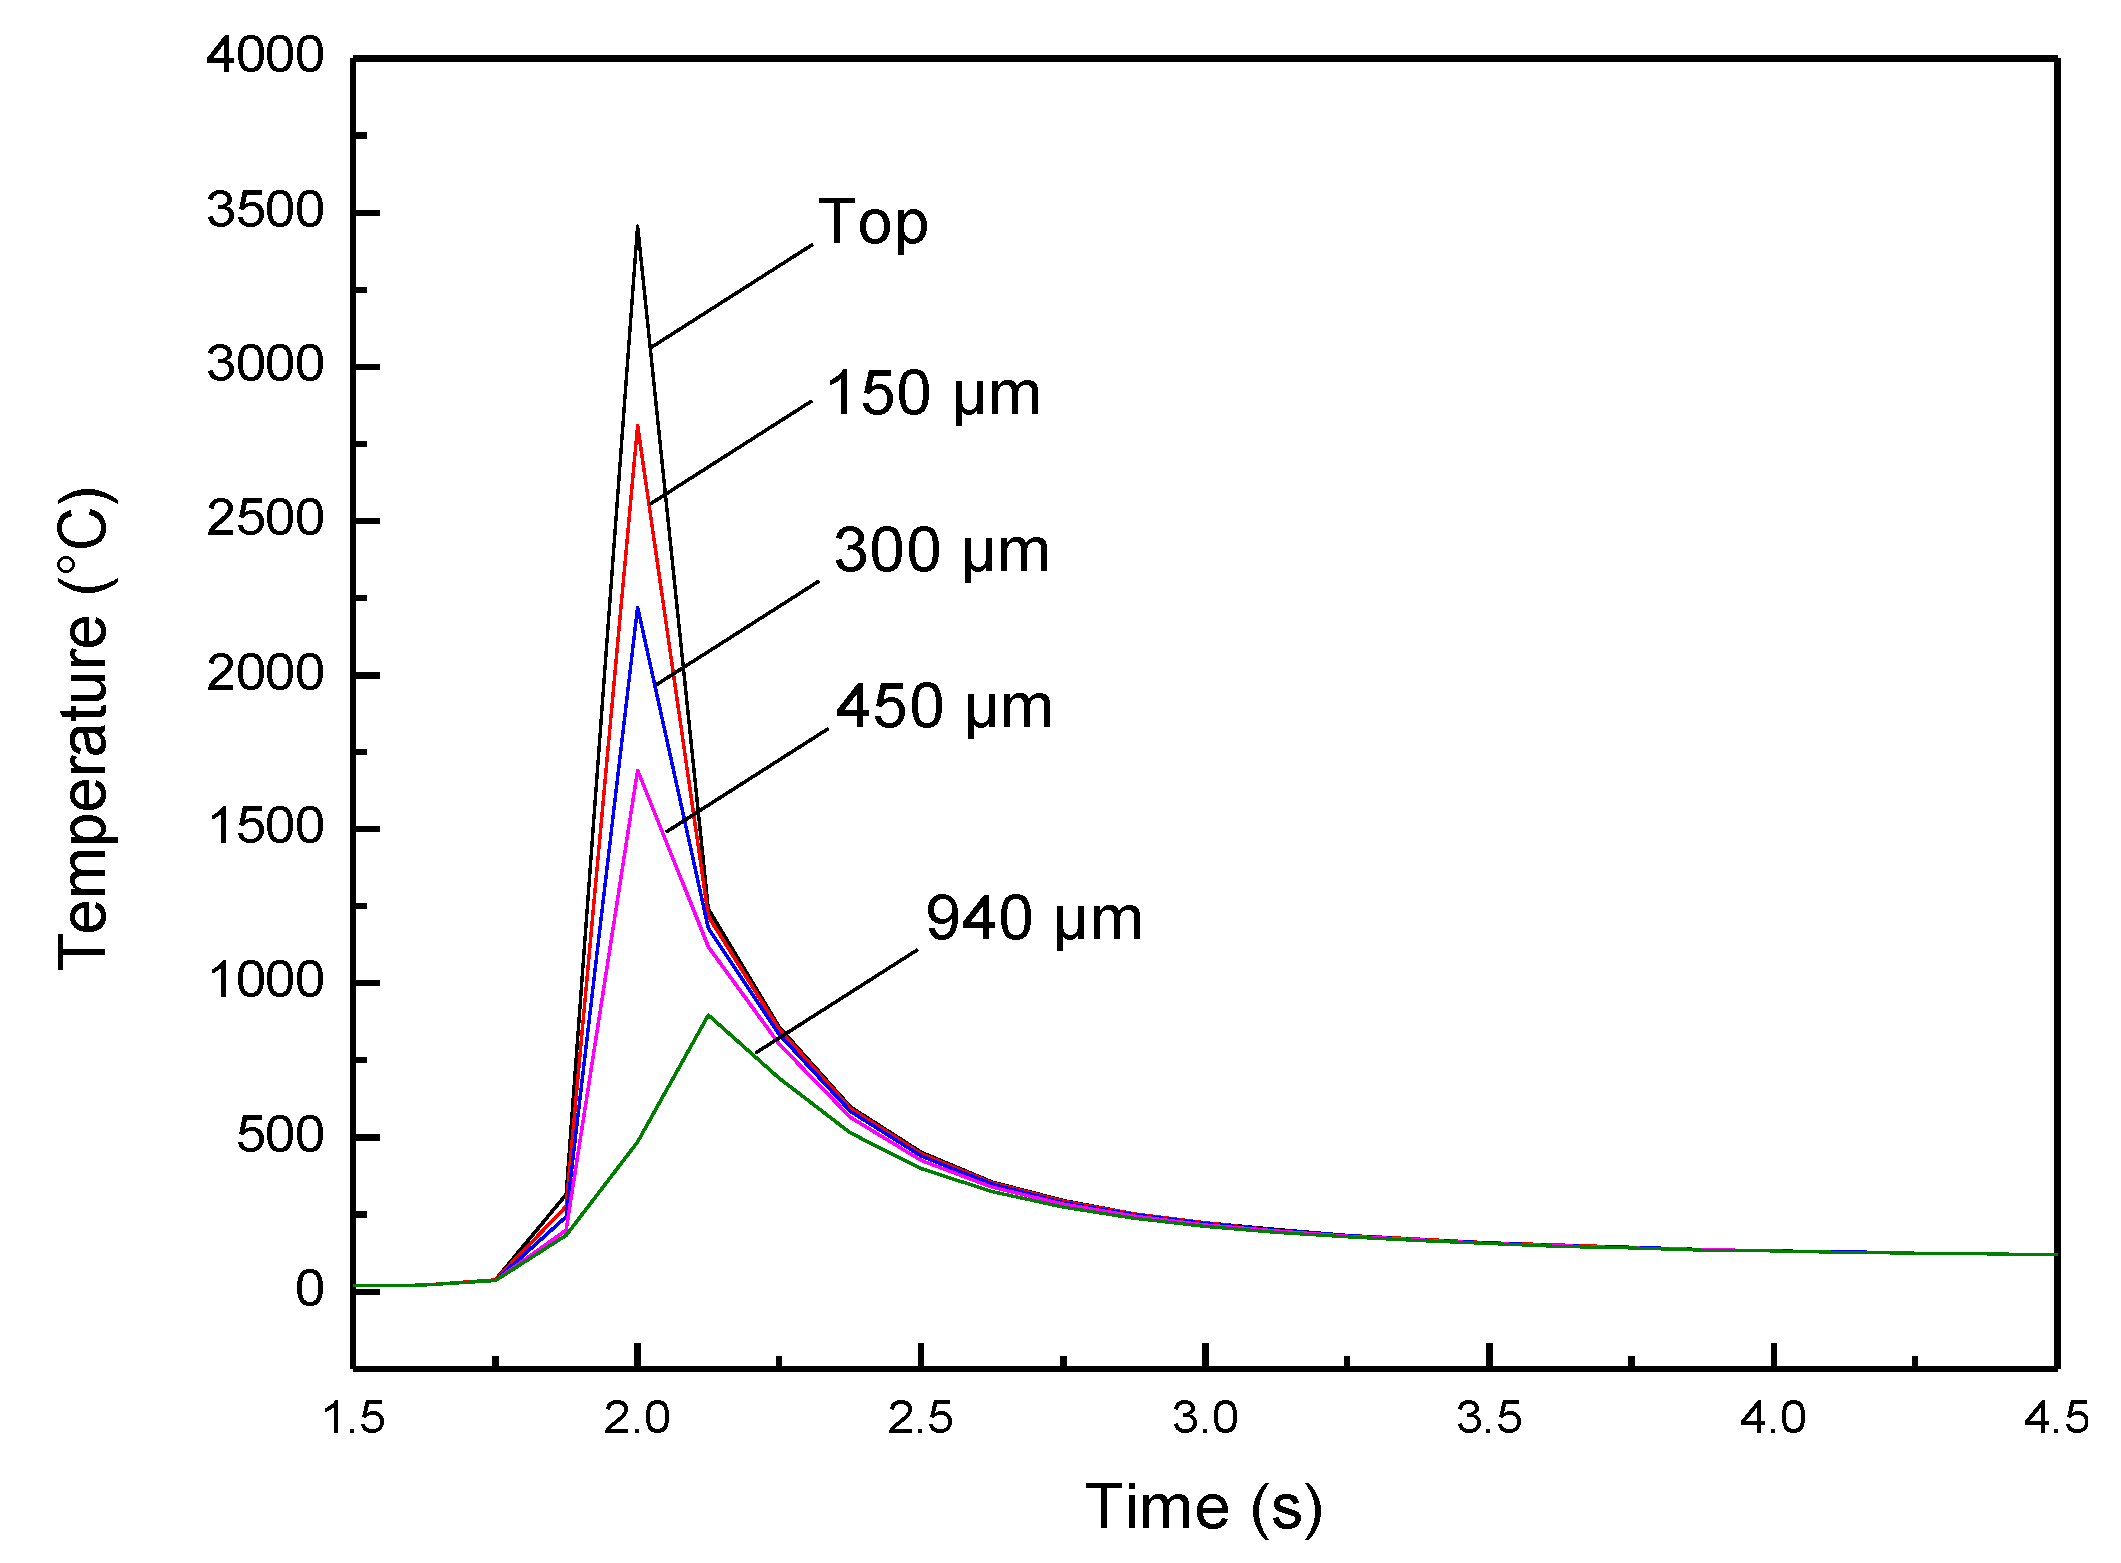
Figure 10 shows the thermal cycling curves of the laser cladded coating at different depths from surface. As the depth from the coating surface increases, the heating rate and the peak temperature decrease. At the top of the coating, the peak temperature is 3455.41 °C. With the increase of the depth from the surface, the peak temperature decreases. As the distance from the coating surface continues to increase, the peak temperature at the depth of 940 μm is only 897.14 °C, which is obviously lower than the melting temperature of the substrate, but higher than the martensitic transformation temperature, where the substrate will not melt. Martensitic transformation is occurred, where it belongs to the heat affected zone.
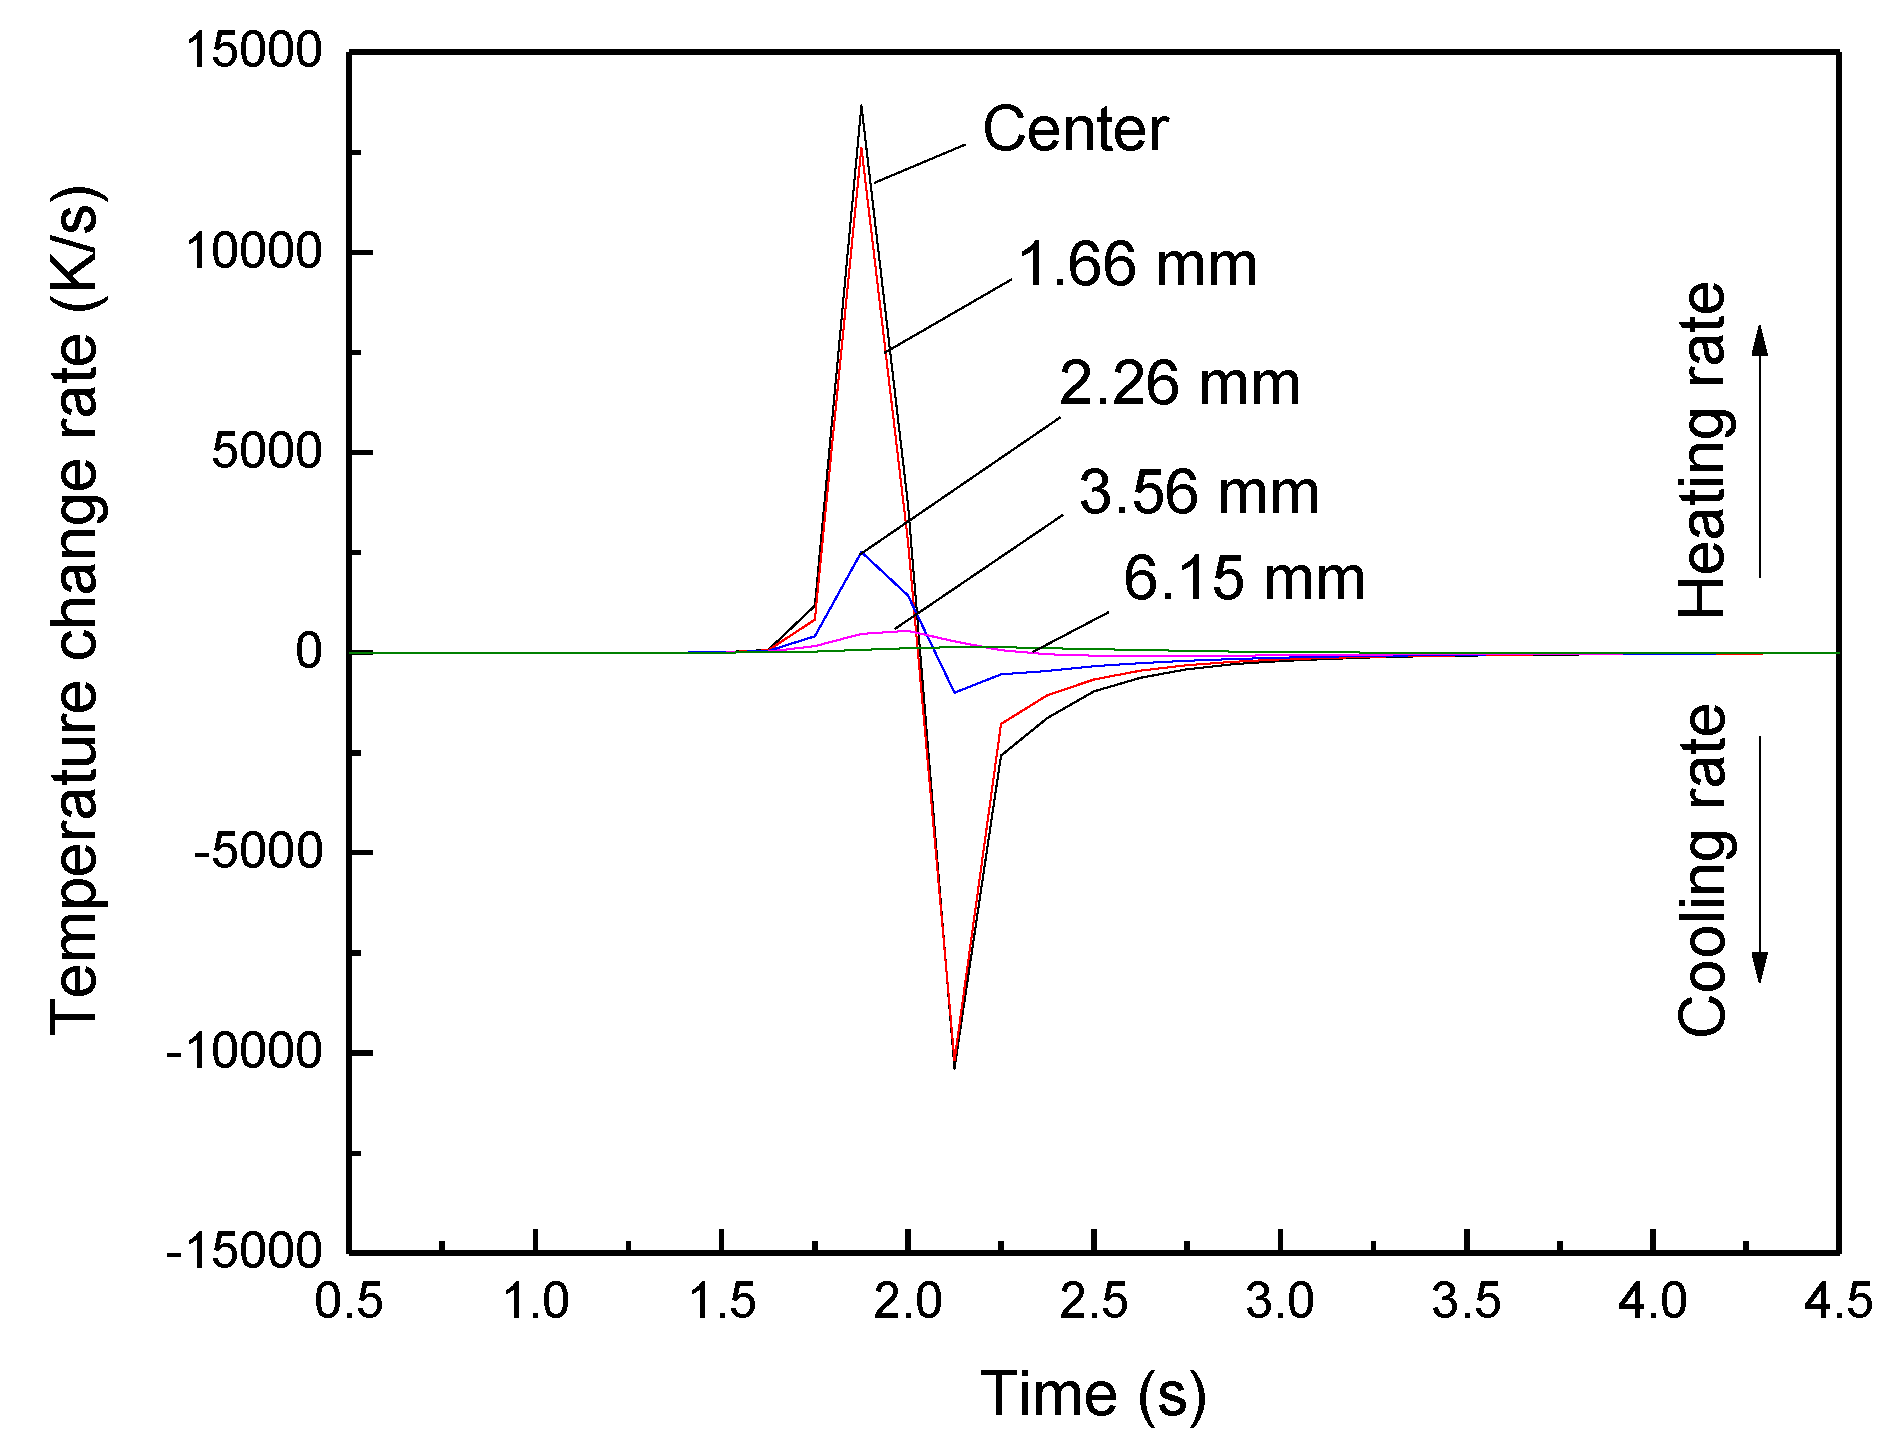
In order to obtain the heating and cooling rate at different depths of the coating, derivation calculus of
Figure 10 was conducted, and the results are shown in
Figure 11. It can be seen that during the laser cladding process, the heating rate was higher than the cooling rate throughout the coating. The heating rate and cooling rate were between 6620.25–13669.2052 K/s and 3547.84–10389.15 K/s, which are much larger than the critical cooling rate (49.3 K/s) for the amorphous formation of this alloy system. In the formation of amorphous coating, the cooling rate is one of the most important factors. The cooling rate at different layer may also change the amorphous forming ability of the laser cladded coating. The results showed that the cooling rate decreased with the increase of the depth. In other words, the cooling rate reduced sequentially from layer I, layer II, to layer III in
Figure 3. In layer II, the alloy composition and cooling rate were both beneficial to the formation of amorphous phase. While, in layer I and layer III, some crystalline phase were formed. This is mainly due to the existence of heterogeneous nucleation in these two layers [
17,
18].
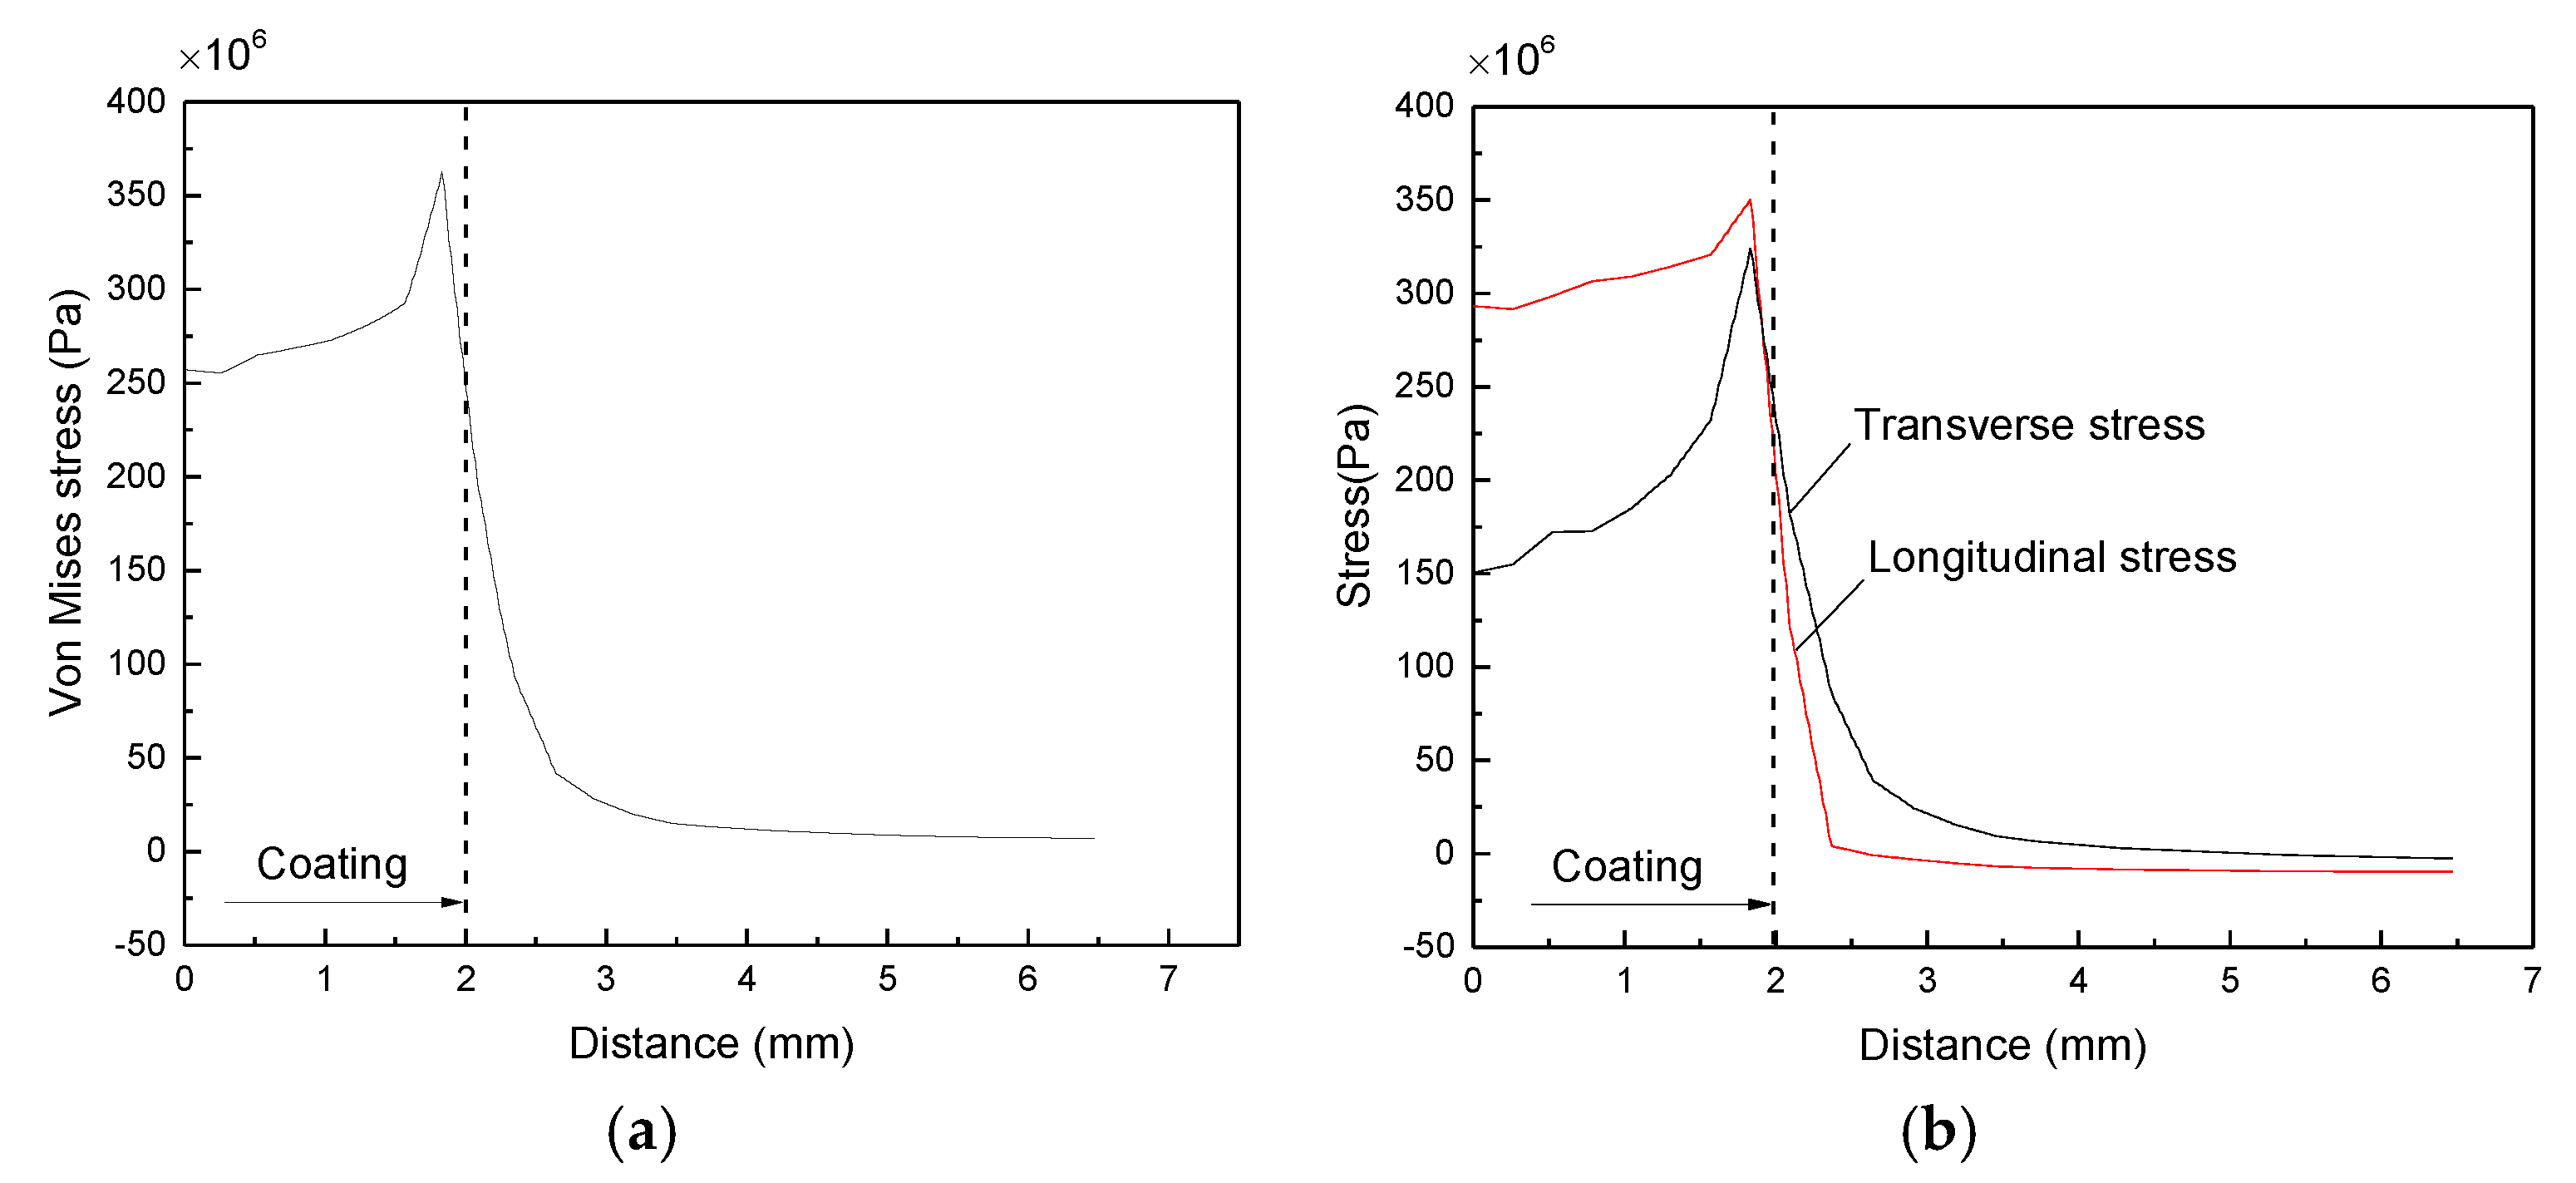
Figure 12 shows the distribution of von Mises, longitudinal stress, and transverse stress along path
Lx. It can be seen that from the middle of the coating to the edge of the substrate, the von Mises of the substrate surface increased firstly and then decreased sharply, as shown in
Figure 11a. The coating was subjected to a maximum von Mises stress of 354 MPa at the coating/substrate interface. The high stress distribution at the clad/substrate interface was likely caused by the sudden change in width across the interface and the big difference in thermal properties of the laser cladded coating and the substrate [
19]. When the distance from the coating was larger than 1 mm, the stress was almost 0. Thus, the stress of the laser cladded coating was mainly concentrated in the coating area. The longitudinal and transverse stress distribution of the coating had the same distribution characteristics as the von Mises, although the longitudinal stress of the coating was greater than the transverse stress. This is mainly due to that the width of the laser cladded coating was only 0.45 mm, and accordingly, the resistance to deformation in the transverse direction was limited. While in the longitudinal direction, the length of the coating increased along with the laser cladding process, and the resistance to deformation was accumulated, which resulted in a higher residual stress in this direction.
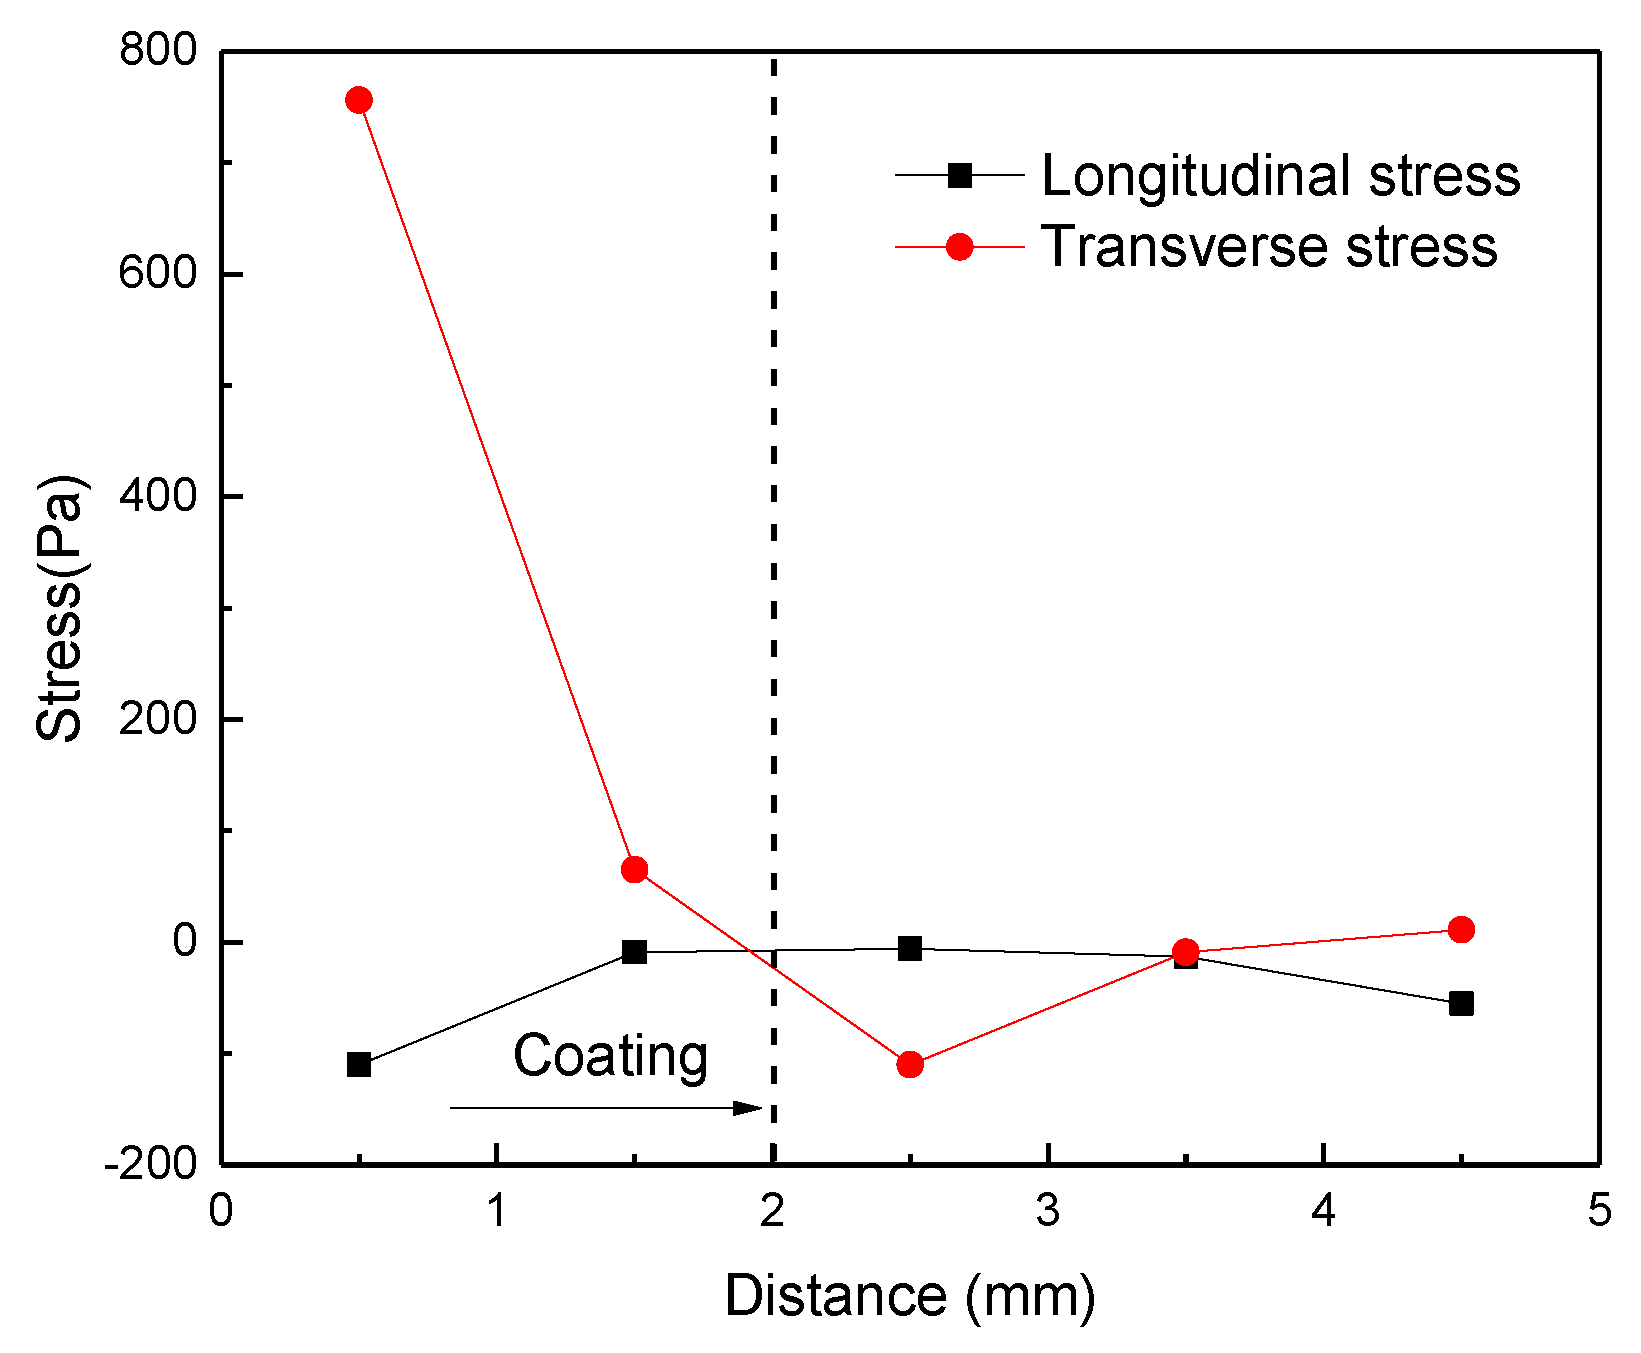
The tested results on longitudinal and transverse residual stress while using the X-ray diffraction method along the path
Lx are shown in
Figure 13. It can be seen that the longitudinal residual stress parallel to the laser scanning direction was almost consistent with the stress in the coating and the substrate, both of which were close to 0 MPa. For the transverse residual stress perpendicular to the laser scanning direction, the coating was subjected to a large tensile stress value of 756 MPa, and then decreased sharply. The compressive residual stress was presented in the substrate, especially in HAZ. The transverse tensile stress of the coating was similar to the numerical simulation results of residual stress. However, the longitudinal tensile stress of the measured coating differed greatly from the numerical simulation results. The reason is that the crack initiation and cracks in the coating were not considered in the numerical simulation. However, in the actual laser cladding process, the cracks were always formed in the coating and the stress may be relaxed. In this study, the width of the laser cladded coating was only 0.45 mm, so the resistance to deformation in the transverse direction was limited. While in the longitudinal direction, the length of the coating increased along with the laser cladding process, the resistance to deformation was accumulated, which led to a higher residual stress in this direction. So the cracks were always formed perpendicular to the laser cladding direction, as seen in
Figure 14. Therefore, the measured stress values were relatively lower. It is easy to obtain a conclusion that the residual tensile stress along the laser scanning direction was relatively larger and there was a maximum at the edge of the coating, which induced the cracks that were formed perpendicular to the laser scanning direction at the edge of the coating.


