1. Introduction
Zirconium diboride is considered as one of the most important materials within the ultra-high temperature ceramic (UHTC) group due to its high melting temperature, low theoretical density, high thermal conductivity, good thermal shock resistance and suitable strength at high temperatures [
1]. But structural applications of the monolithic ZrB
2 at high temperatures are limited due to its inferior oxidation resistance [
2]. Existing literature indicates that reinforcement of ZrB
2 with SiC [
2,
3] or MoSi
2 [
4] or Si
3N
4 [
3,
5] can lead to improvement in its oxidation resistance and mechanical properties [
2,
3,
4,
5]. In general, improvement of oxidation resistance of ZrB
2 by the above reinforcements is due to the formation of borosilicate (B
2O
3-SiO
2) rich scale [
2,
3,
4,
5,
6,
7]. In addition, improvement of oxidation resistance by addition of SiC in ZrB
2 is associated with improvement in strength and fracture toughness of monolithic ZrB
2 [
7]. In an earlier work by the authors, the oxidation behaviors of ZrB
2-20 vol % SiC and HfB
2-20 vol % SiC composites were compared, and the results showed that HfB
2-20 vol % SiC composite possesses superior oxidation resistance compared to that of the ZrB
2-20 vol % SiC composite. Therefore, an attempt has been made to improve the oxidation resistance of ZrB
2-20 vol % SiC composite by addition of Si
3N
4. It has been shown that the addition of 2.5 wt % Si
3N
4 to ZrB
2 significantly aides in its densification [
8]. The combined effect of both SiC and Si
3N
4 as reinforcements on the oxidation behavior of ZrB
2 needs further study. For suitable comparison, it is necessary to use some data from our earlier work [
6]. This report aims to fill this gap by examining the influence of Si
3N
4 addition on the oxidation behavior of ZrB
2-SiC composites.
2. Materials and Methods
The mixing of composites having compositions of ZrB
2-20 vol % SiC (ZS) and ZrB
2-20 vol % SiC-5 vol % Si
3N
4 (ZSS) containing raw materials with >99% purity was carried out in acetone medium using vials and balls made of WC-Co composite in a planetary mono-mill (Fritsch GmbH, Idar-Oberstein, Germany) operated at a speed of 250 rpm for 2 h. After the completion of milling, acetone was drained out, and the blended powders were dried at 350 °C for 2 h in air. The composite powders were next crushed using agate mortar and pestle, and then sintered under a uniaxial pressure of 30 MPa using graphite dies lined with grafoil inside a resistance heating furnace operated at 2000 °C for 30 min in an argon environment, to prepare pellets of 42 mm diameter and 4 mm thickness [
9].
Sample blanks from the sintered composites with a theoretical density of >99% were characterized by standard metallographic examinations, as well as by X-ray diffraction (XRD) analyses. Isothermal oxidation tests were carried out using samples with dimensions of 4 × 4 × 10 mm
3 at 1200 or 1300 °C in a vertical quartz tube furnace for 24 and 100 h in air. The mass of each sample was recorded at intervals of either 1 h (for 24 h tests) or 6 h (for 100 h tests) during isothermal oxidation. In addition, cyclic oxidation studies were carried out on the composites at 1300 °C for a total duration of 24 h in air. The experimental set-up and the method of specimen preparation for isothermal and cyclic oxidation studies have been described in an earlier report [
6].
Microstructures of hot-pressed as well as oxidized samples were examined using a field-emission scanning electron microscope (FESEM) equipped with an energy-dispersive spectroscopy (EDS) facility. The cross-sections of the oxidized samples were hot-mounted using copper-resin powder mixture, and were metallographically polished for microstructural examination using a FESEM and electron-probe microanalyzer (EPMA) equipped with wavelength dispersive spectroscopy (WDS) facility. Ten different locations were selected to estimate the averaged oxide scale thicknesses. The grain size, microcrack density and SiO
2 area fractions were measured using images obtained from FESEM with the help of an image analyzer. The biaxial residual stress components in the selected phases of the oxide scales were measured by XRD analysis using the sin
2 ψ technique [
10,
11,
12]. The peaks of monoclinic ZrO
2 (
111) were considered for this measurement. A rocking technique involving tilting of the sample was employed, and the
d-spacing (
dψ) was measured for different angles (ψ) between the surface normal and the normal to the diffracting (
hkl) plane. The biaxial stress components in a given phase were calculated from the slopes of the best-fit lines for the plot of
dψ against sin
2 ψ.
3. Results and Discussion
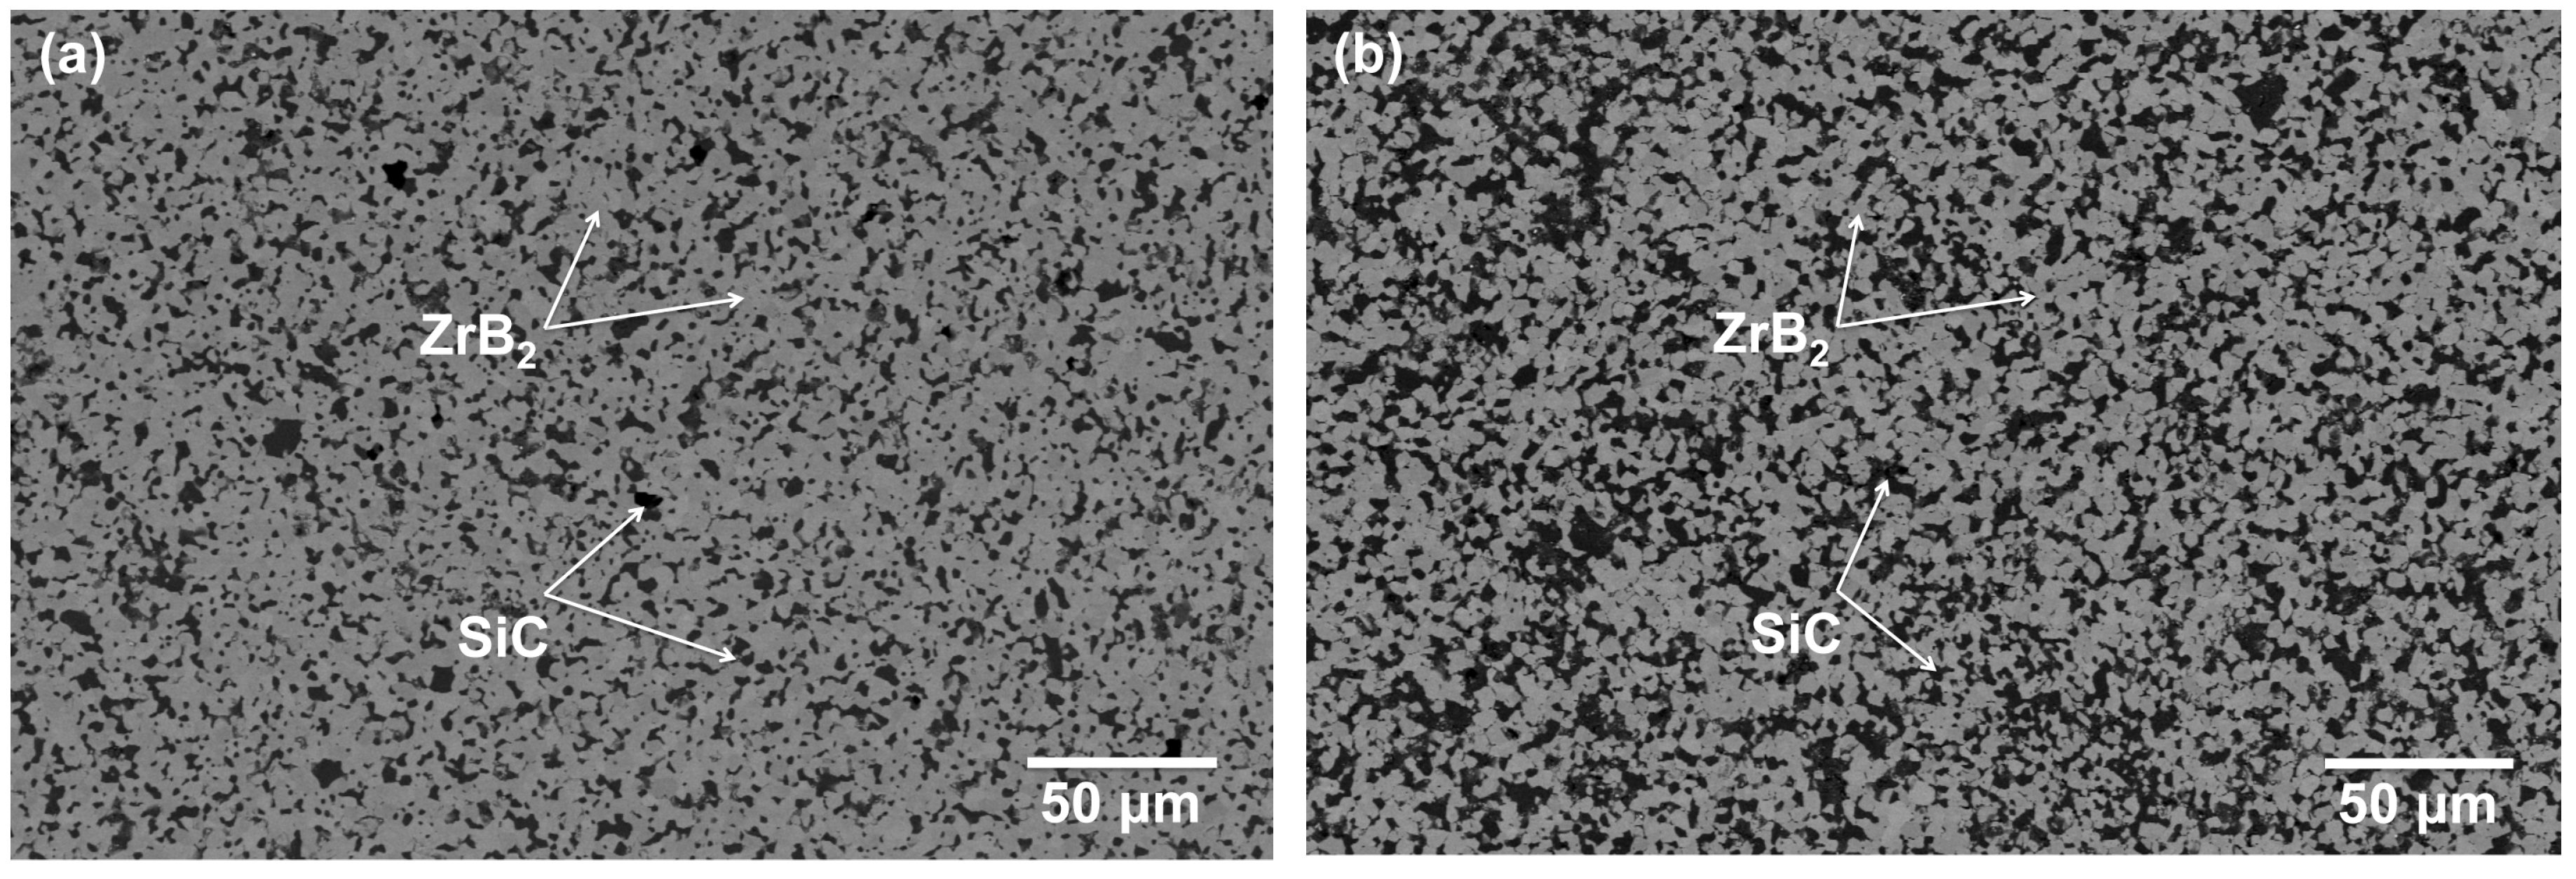
Figure 1a,b show SEM images depicting the typical microstructures of ZS and ZSS composites, which confirm that there is a uniform distribution of reinforcements. The results for mechanical property evaluation as reported in an earlier publication and summarized in
Table 1 have shown that the addition of 5 vol % Si
3N
4 leads to an increase in hardness by 9.3%, flexural strength by 46%, and fracture toughness (obtained by testing of single edge notch-bend tests) by 34.5% [
13]. Moreover, the values of Young’s modulus are found to be reasonably close to those predicted by the rule of mixtures. These observations of improvement in mechanical properties with the addition of Si
3N
4 can be considered a strong source of motivation for further investigation of the response of these materials to isothermal and cyclic oxidation behavior at elevated temperatures. In an earlier study, Monteverde and Bellosi have examined the mechanical properties and oxidation behavior of ZrB
2-SiC composite hot-pressed at 1870 or 1760 °C using 5 or 3.7 vol % Si
3N
4 as sintering aid as well as Al
2O
3 and Y
2O
3 as additives [
14]. The hardness and fracture toughness of the ZSS composites as shown in
Table 2 appear to be greater than those (14.6 Hv and 4.55 MPa√m) reported by Monteverde and Bellosi for two composites with similar compositions by 32.5% and 41.6%, respectively. However, the flexural strength found for the ZSS appears to be lower by 40.3%, which could be attributed to finer matrix grain size of the samples investigated by Monteverde and Bellosi [
14].
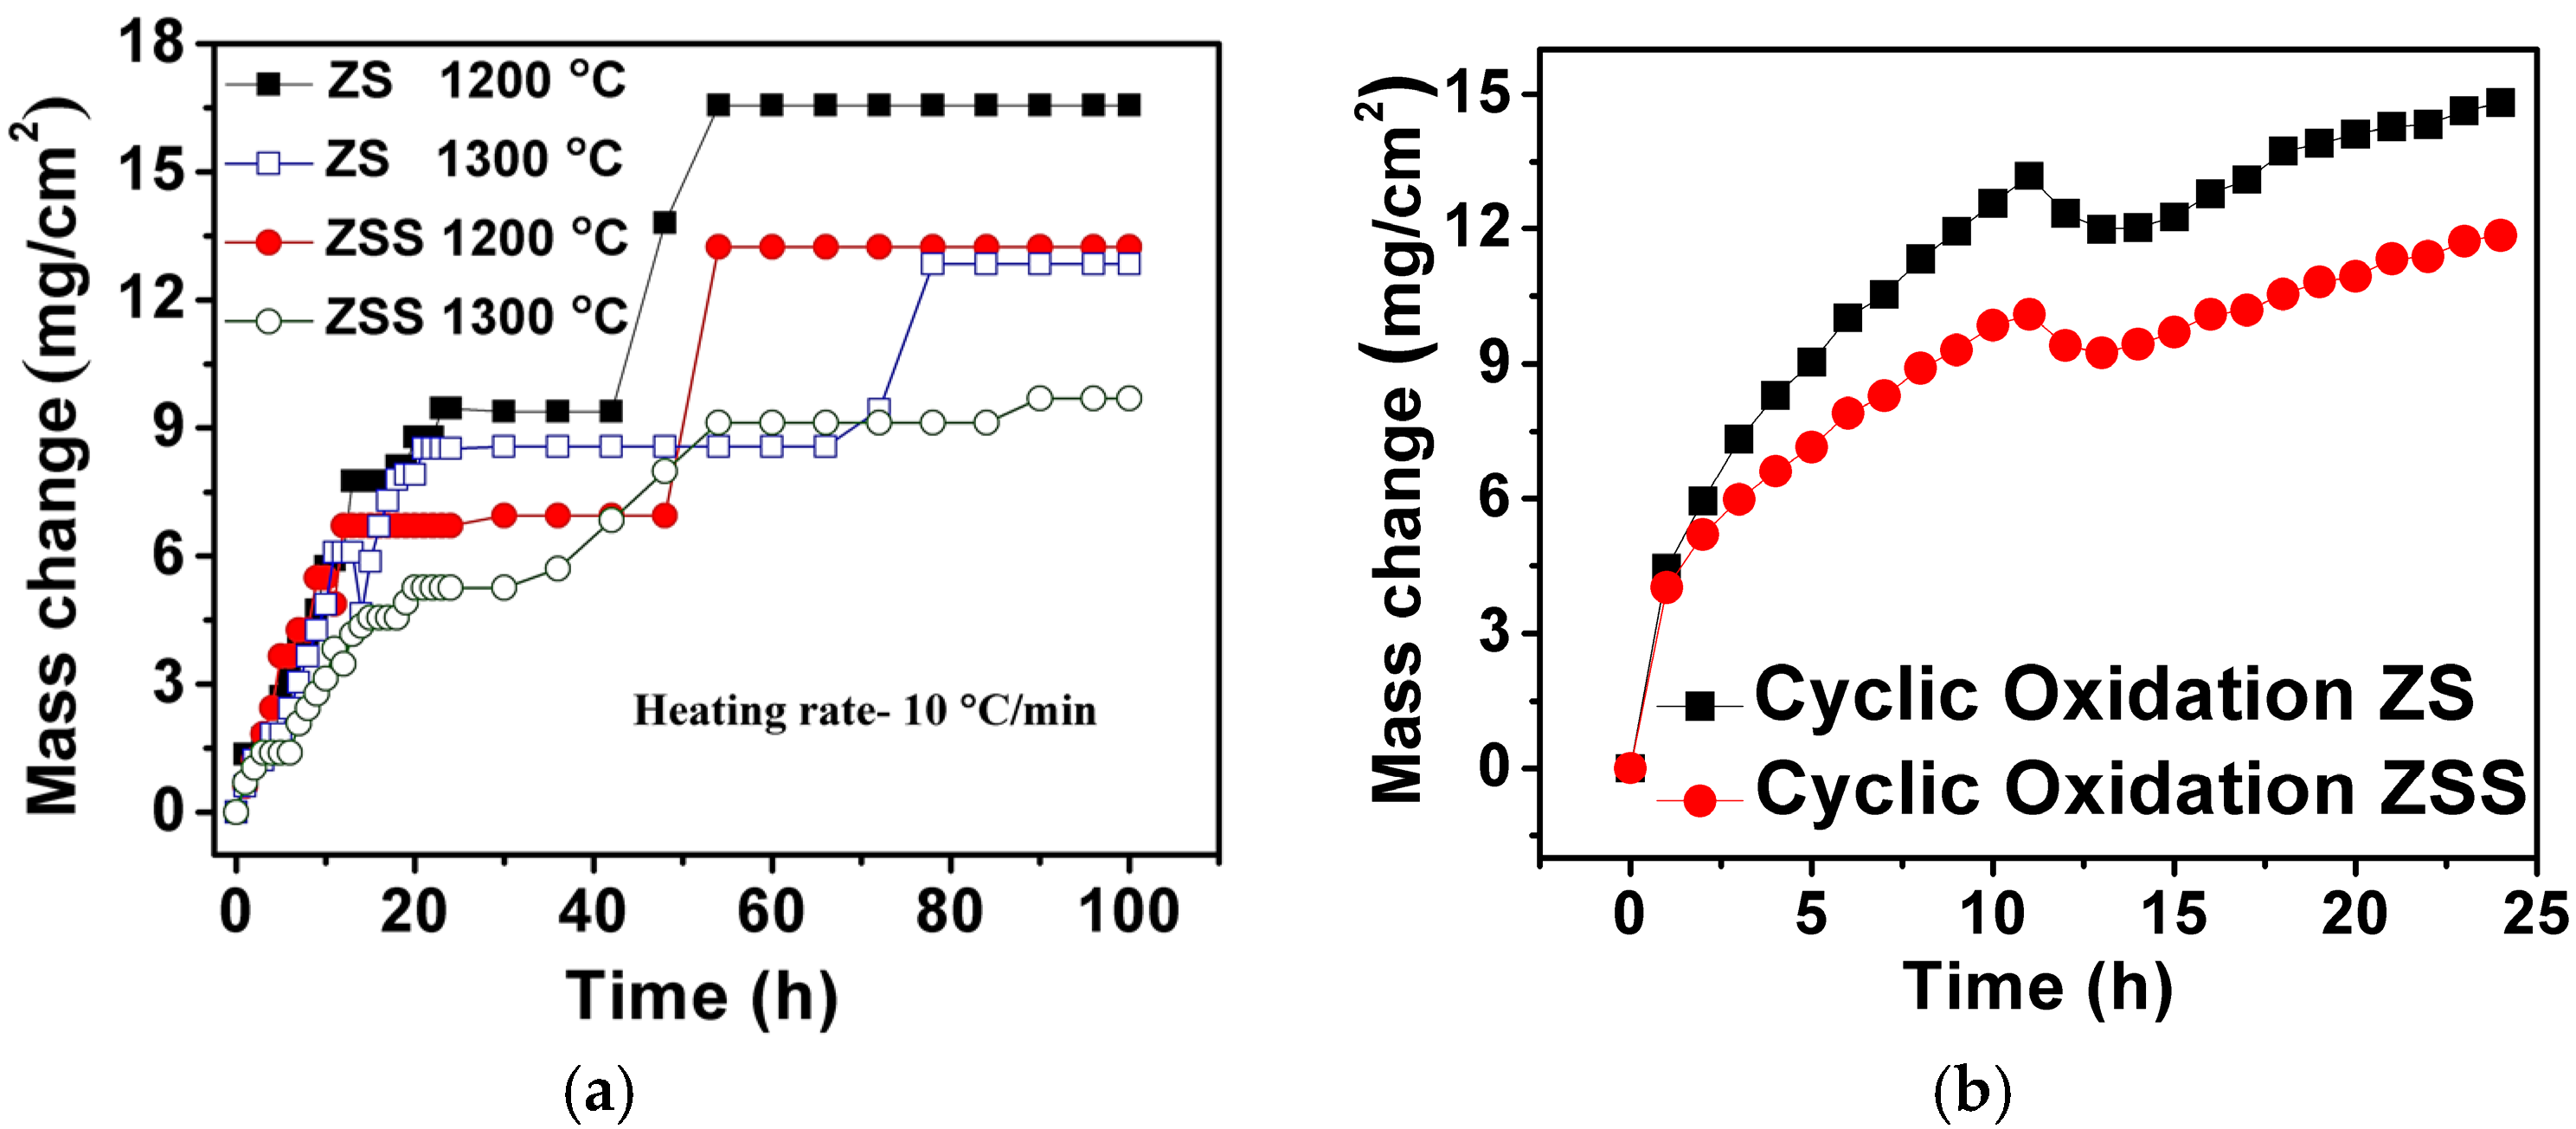
Figure 2a shows the results of isothermal oxidation tests carried out on the investigated ZrB
2-based composites at 1200 and 1300 °C for 100 h. Oxidation rates (variation of mass-gain per unit area with time) of ZS (at 1200 and 1300 °C) and ZSS (at 1200 °C) composites are found to be almost identical during the first 12 h of exposure; whereas the mass-gain of the ZSS at 1300 °C is lower for the same duration. The oxidation rates are found to decrease with time for both composites with occasional gradual or sharp jumps. The gradual rise in mass-gain after a stable regime may be ascribed to the formation of pores or small cracks, allowing the ingress of oxygen towards the oxide-composite interface. However, occasional sharp increases in mass-gain are considered to be due to cracking and spallation of the oxide scale after growth to a limited thickness. The rate of oxidation of the ZSS is found to be lower than that of the ZS composite at both 1200 and 1300 °C. This observation is in excellent agreement with that of Monteverde and Bellosi, who also reported much lower mass-gain in case of the ZrB
2-20 vol % SiC-5 vol % Si
3N
4 composite compared to that of ZrB
2-5 vol % Si
3N
4 composite [
14]. The results of cyclic oxidation tests carried out at 1300 °C for ZS and ZSS composites are also included in
Figure 2b. The cyclic oxidation plots are similar in nature for both the composites, and as expected, the ZSS shows lower mass gain compared to that of the ZS composite. Comparison of the results of cyclic and isothermal oxidation tests indicates that: (i) the mass increases during isothermal oxidation in steps; (ii) mass increases or decreases during cyclic exposures more or less continuously, with no apparent regime of zero mass change unlike that observed in the course of isothermal exposure; and (iii) mass changes due to the cyclic oxidation are higher compared to that observed during the isothermal oxidation for both the composites at a given time interval.
Both ZS and ZSS composites exhibit higher mass gain at 1200 °C than that at 1300 °C. Higher mass gain at 1200 °C is indicative of the fact that the amount of SiO2 in the protective film is insufficient for covering the total surface of the composites quickly, as a result of which further oxidation takes place. The protective film with a higher amount of SiO2 has indeed been found to form at 1300 °C. The improved oxidation resistance of the ZSS compared to that of the ZS is attributed to the former composite’s Si3N4 content, which enhances both the amount and the rate of SiO2 formation along with that of Si2N2O, thereby making the oxide scale more protective. This suggests that the presence of Si3N4 in addition to SiC is beneficial for improving the oxidation resistance of the ZrB2-based composite.
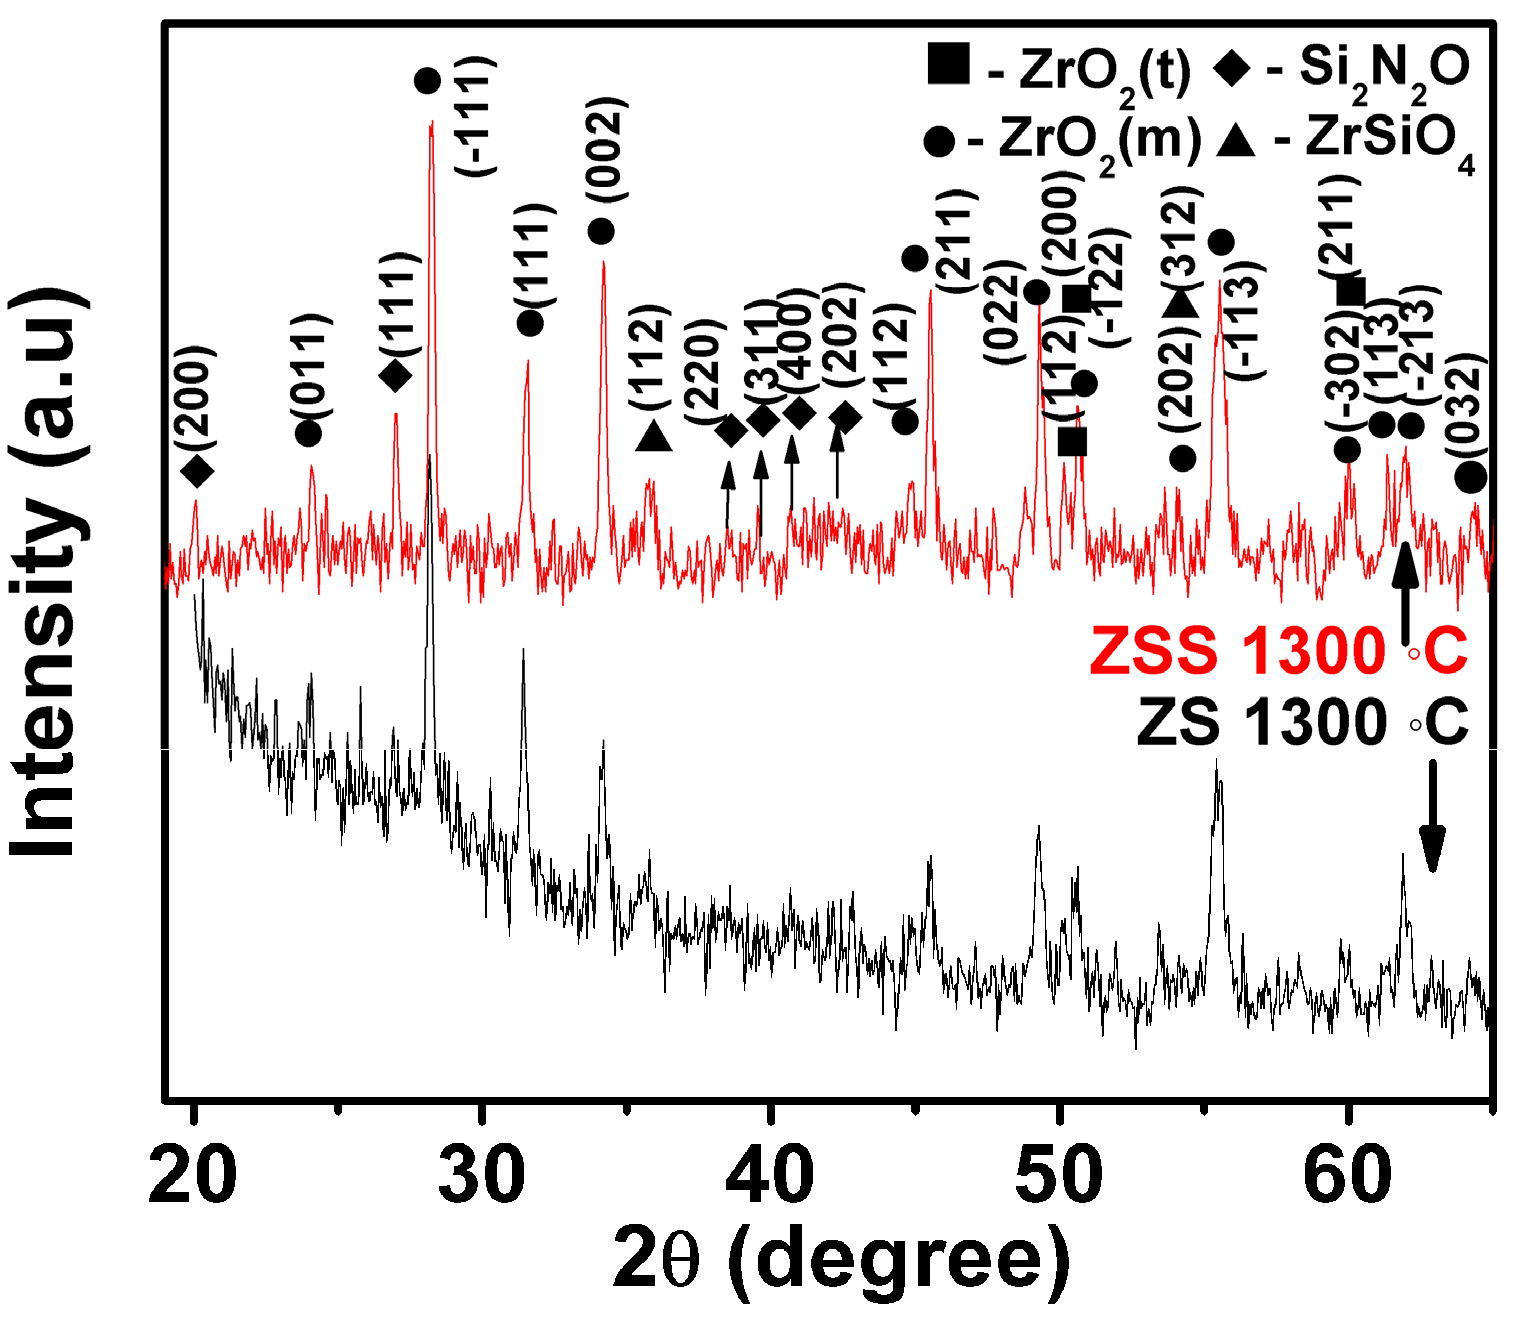
The oxide scale constituents have been examined in order to understand the probable oxidation mechanisms. XRD patterns of the oxide scales formed at 1300 °C for 24 h on the investigated composites are depicted in
Figure 3. The results in this figure indicate that (i) the peaks representing monoclinic and tetragonal ZrO
2 as well as those of ZrSiO
4 are present in all the XRD patterns, while (ii) the peaks of Si
2N
2O are present only in the XRD pattern of the oxide scale formed on the ZSS composite.
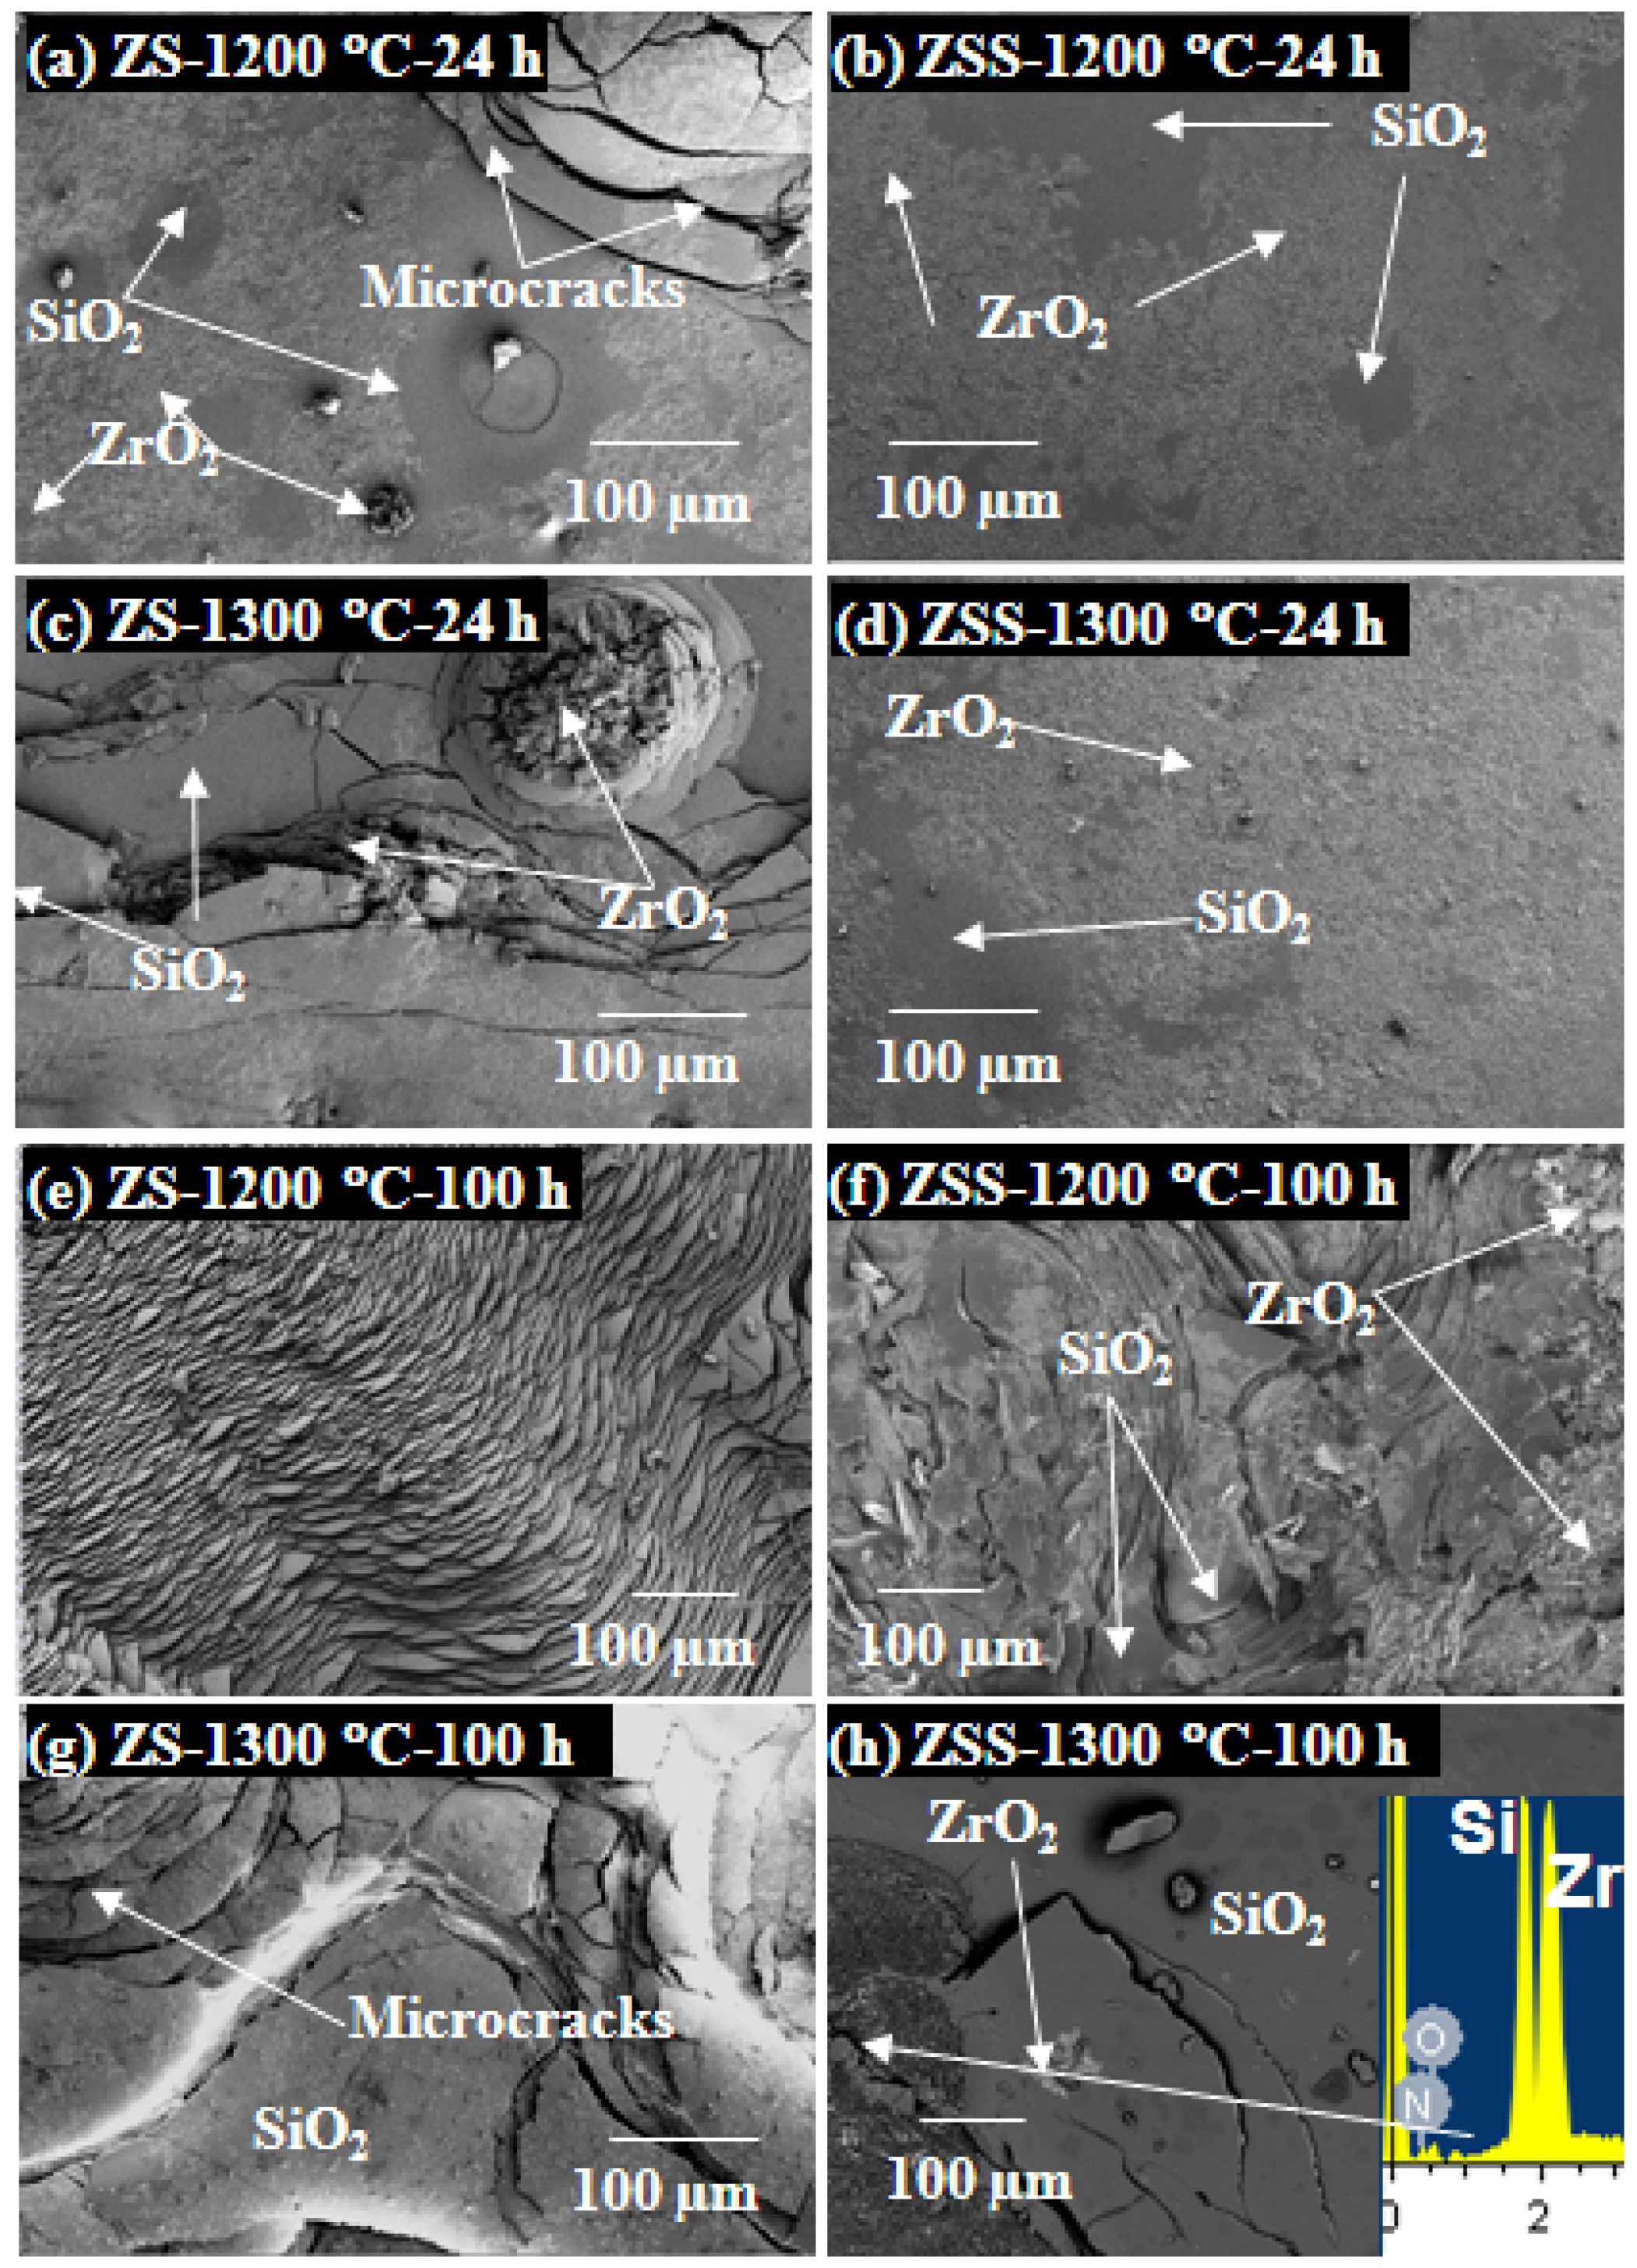
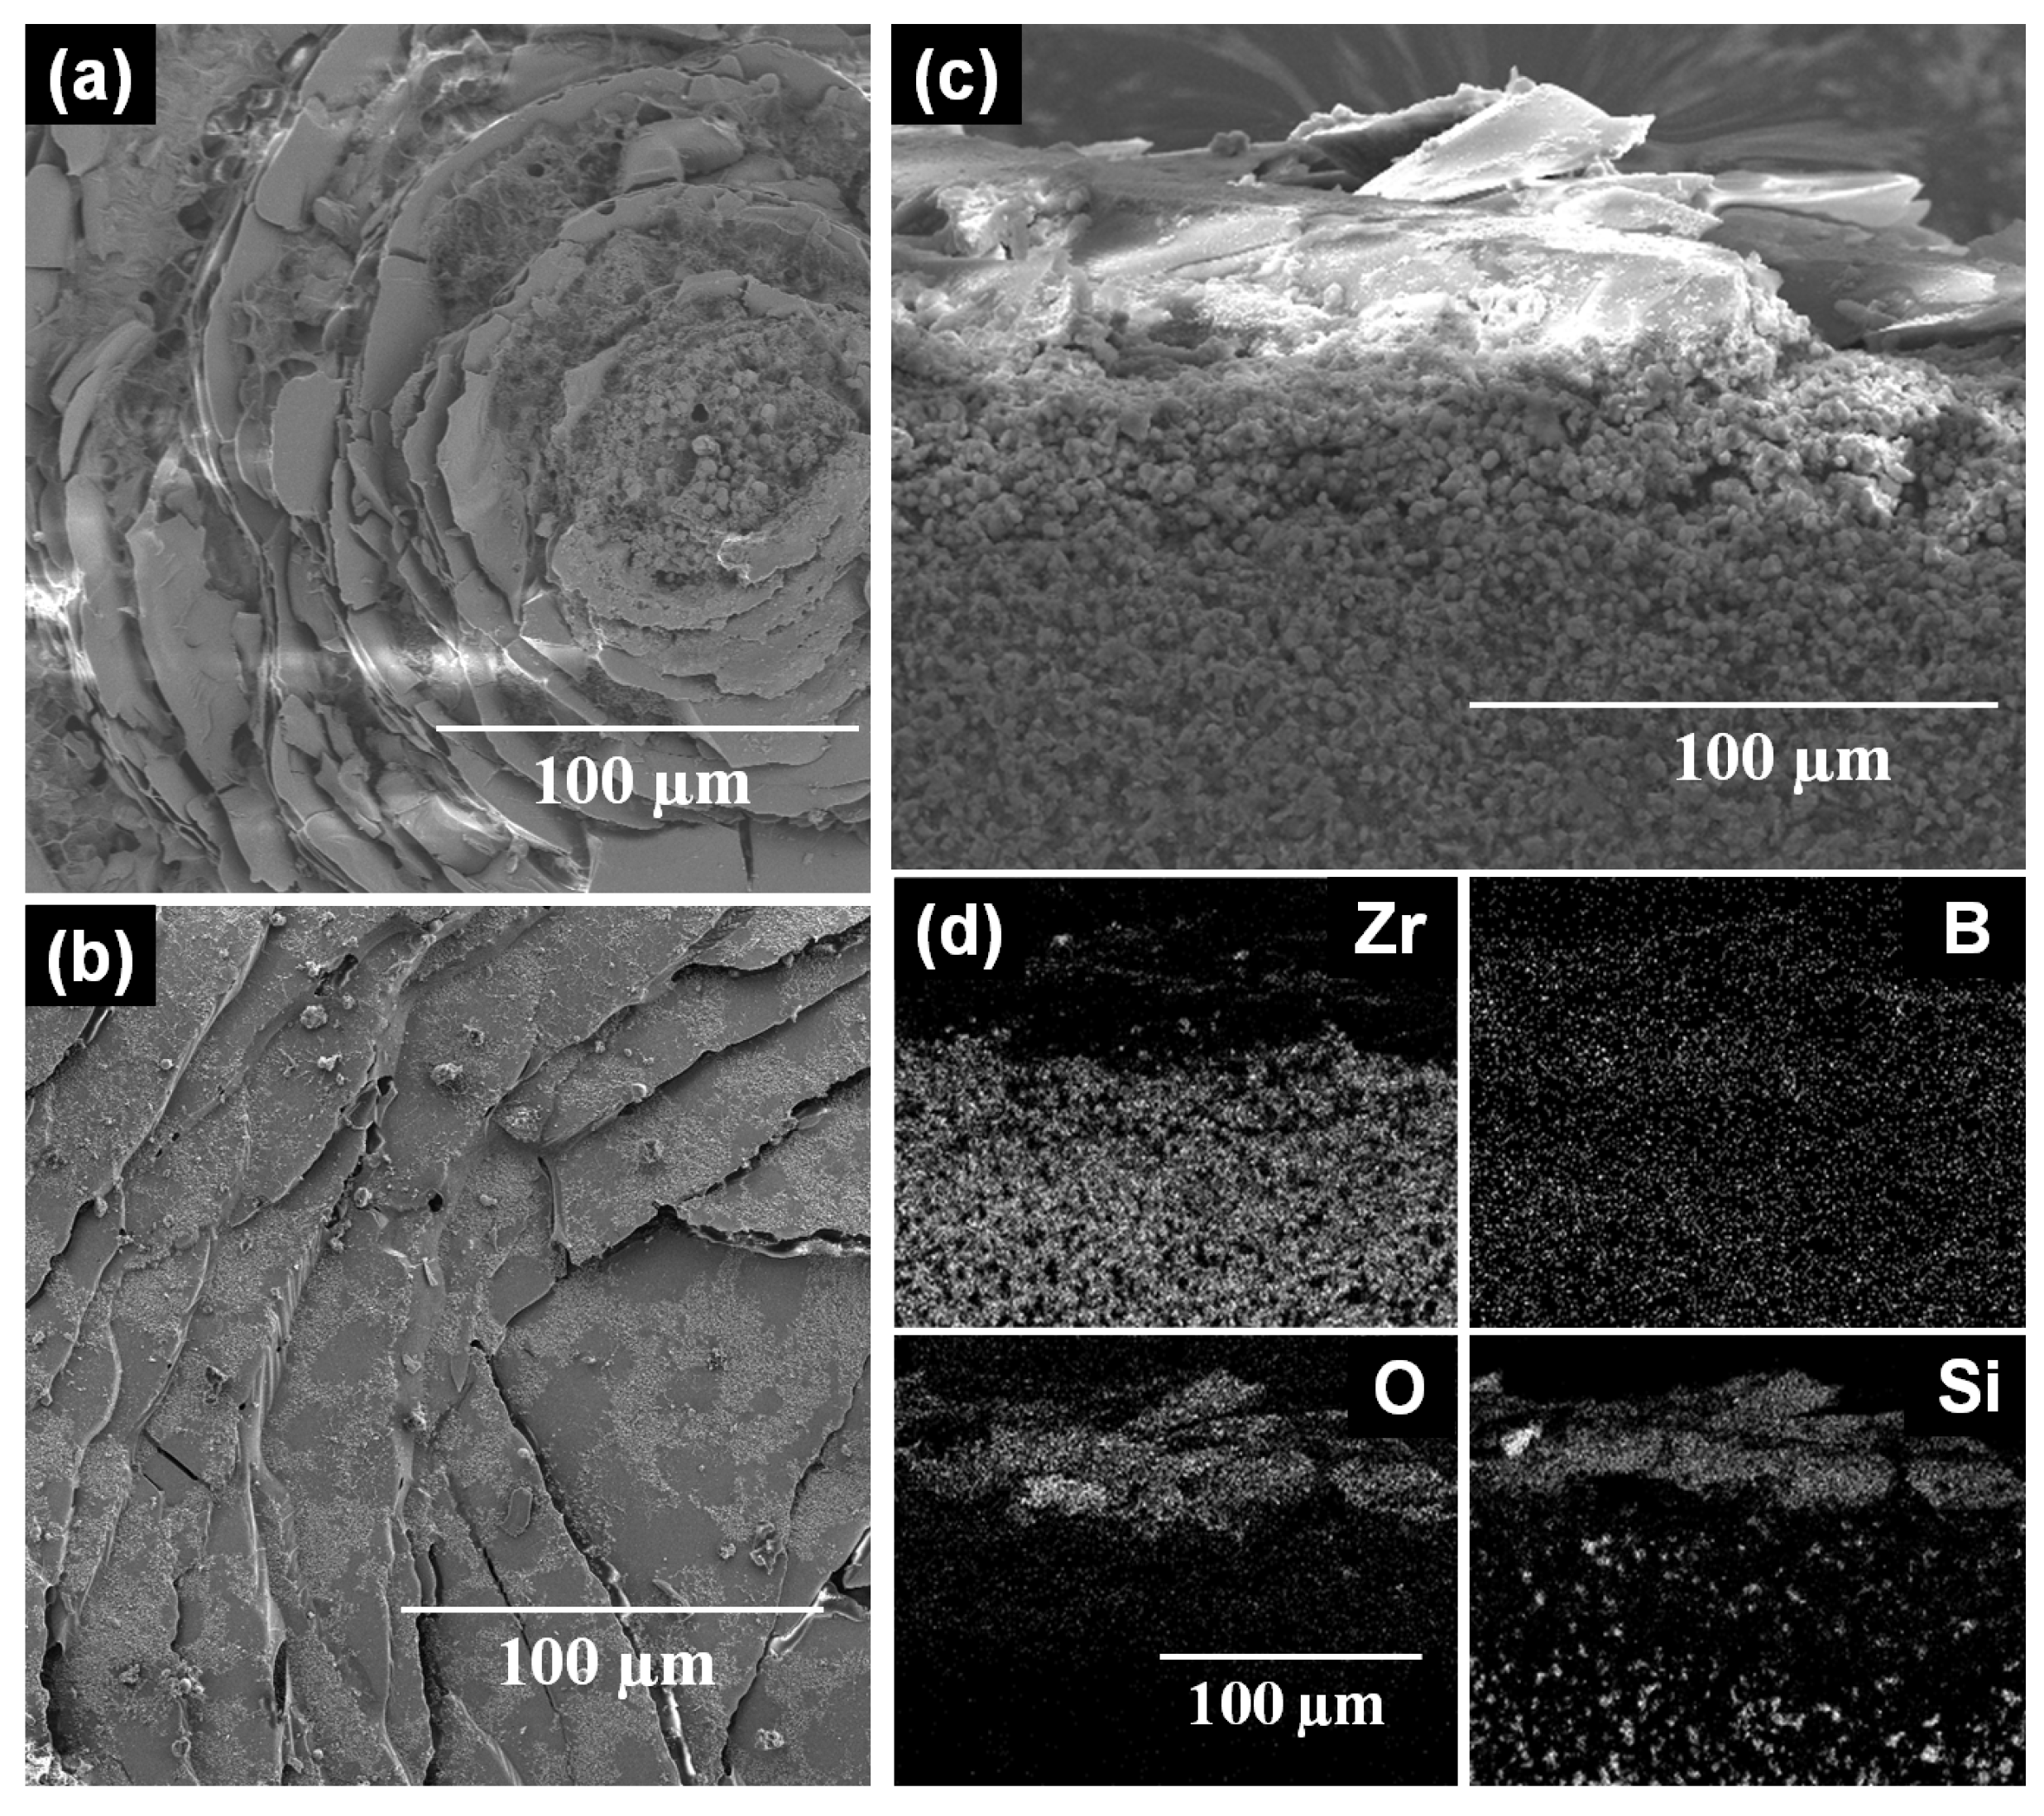
Figure 4 shows typical SEM images depicting the oxide scale surfaces formed on ZS and ZSS composites. These results show that the oxide scale formed on the ZSS has a greater amount of continuity than that formed on the ZS. Microcracks are visible on both these oxide scales and the area-fraction of microcracks is higher on the oxide scale formed on the ZS. Using EDS analysis, the products of oxidation have been found to be a mixture of ZrO
2 and SiO
2; but the absence of SiO
2 peaks in the XRD patterns is attributed to its amorphous character. The presence of Si
2N
2O in oxide scale of ZSS is further confirmed by EDS analysis showing peaks of Si, N and O in the spectrum (
Figure 4h (inset)).
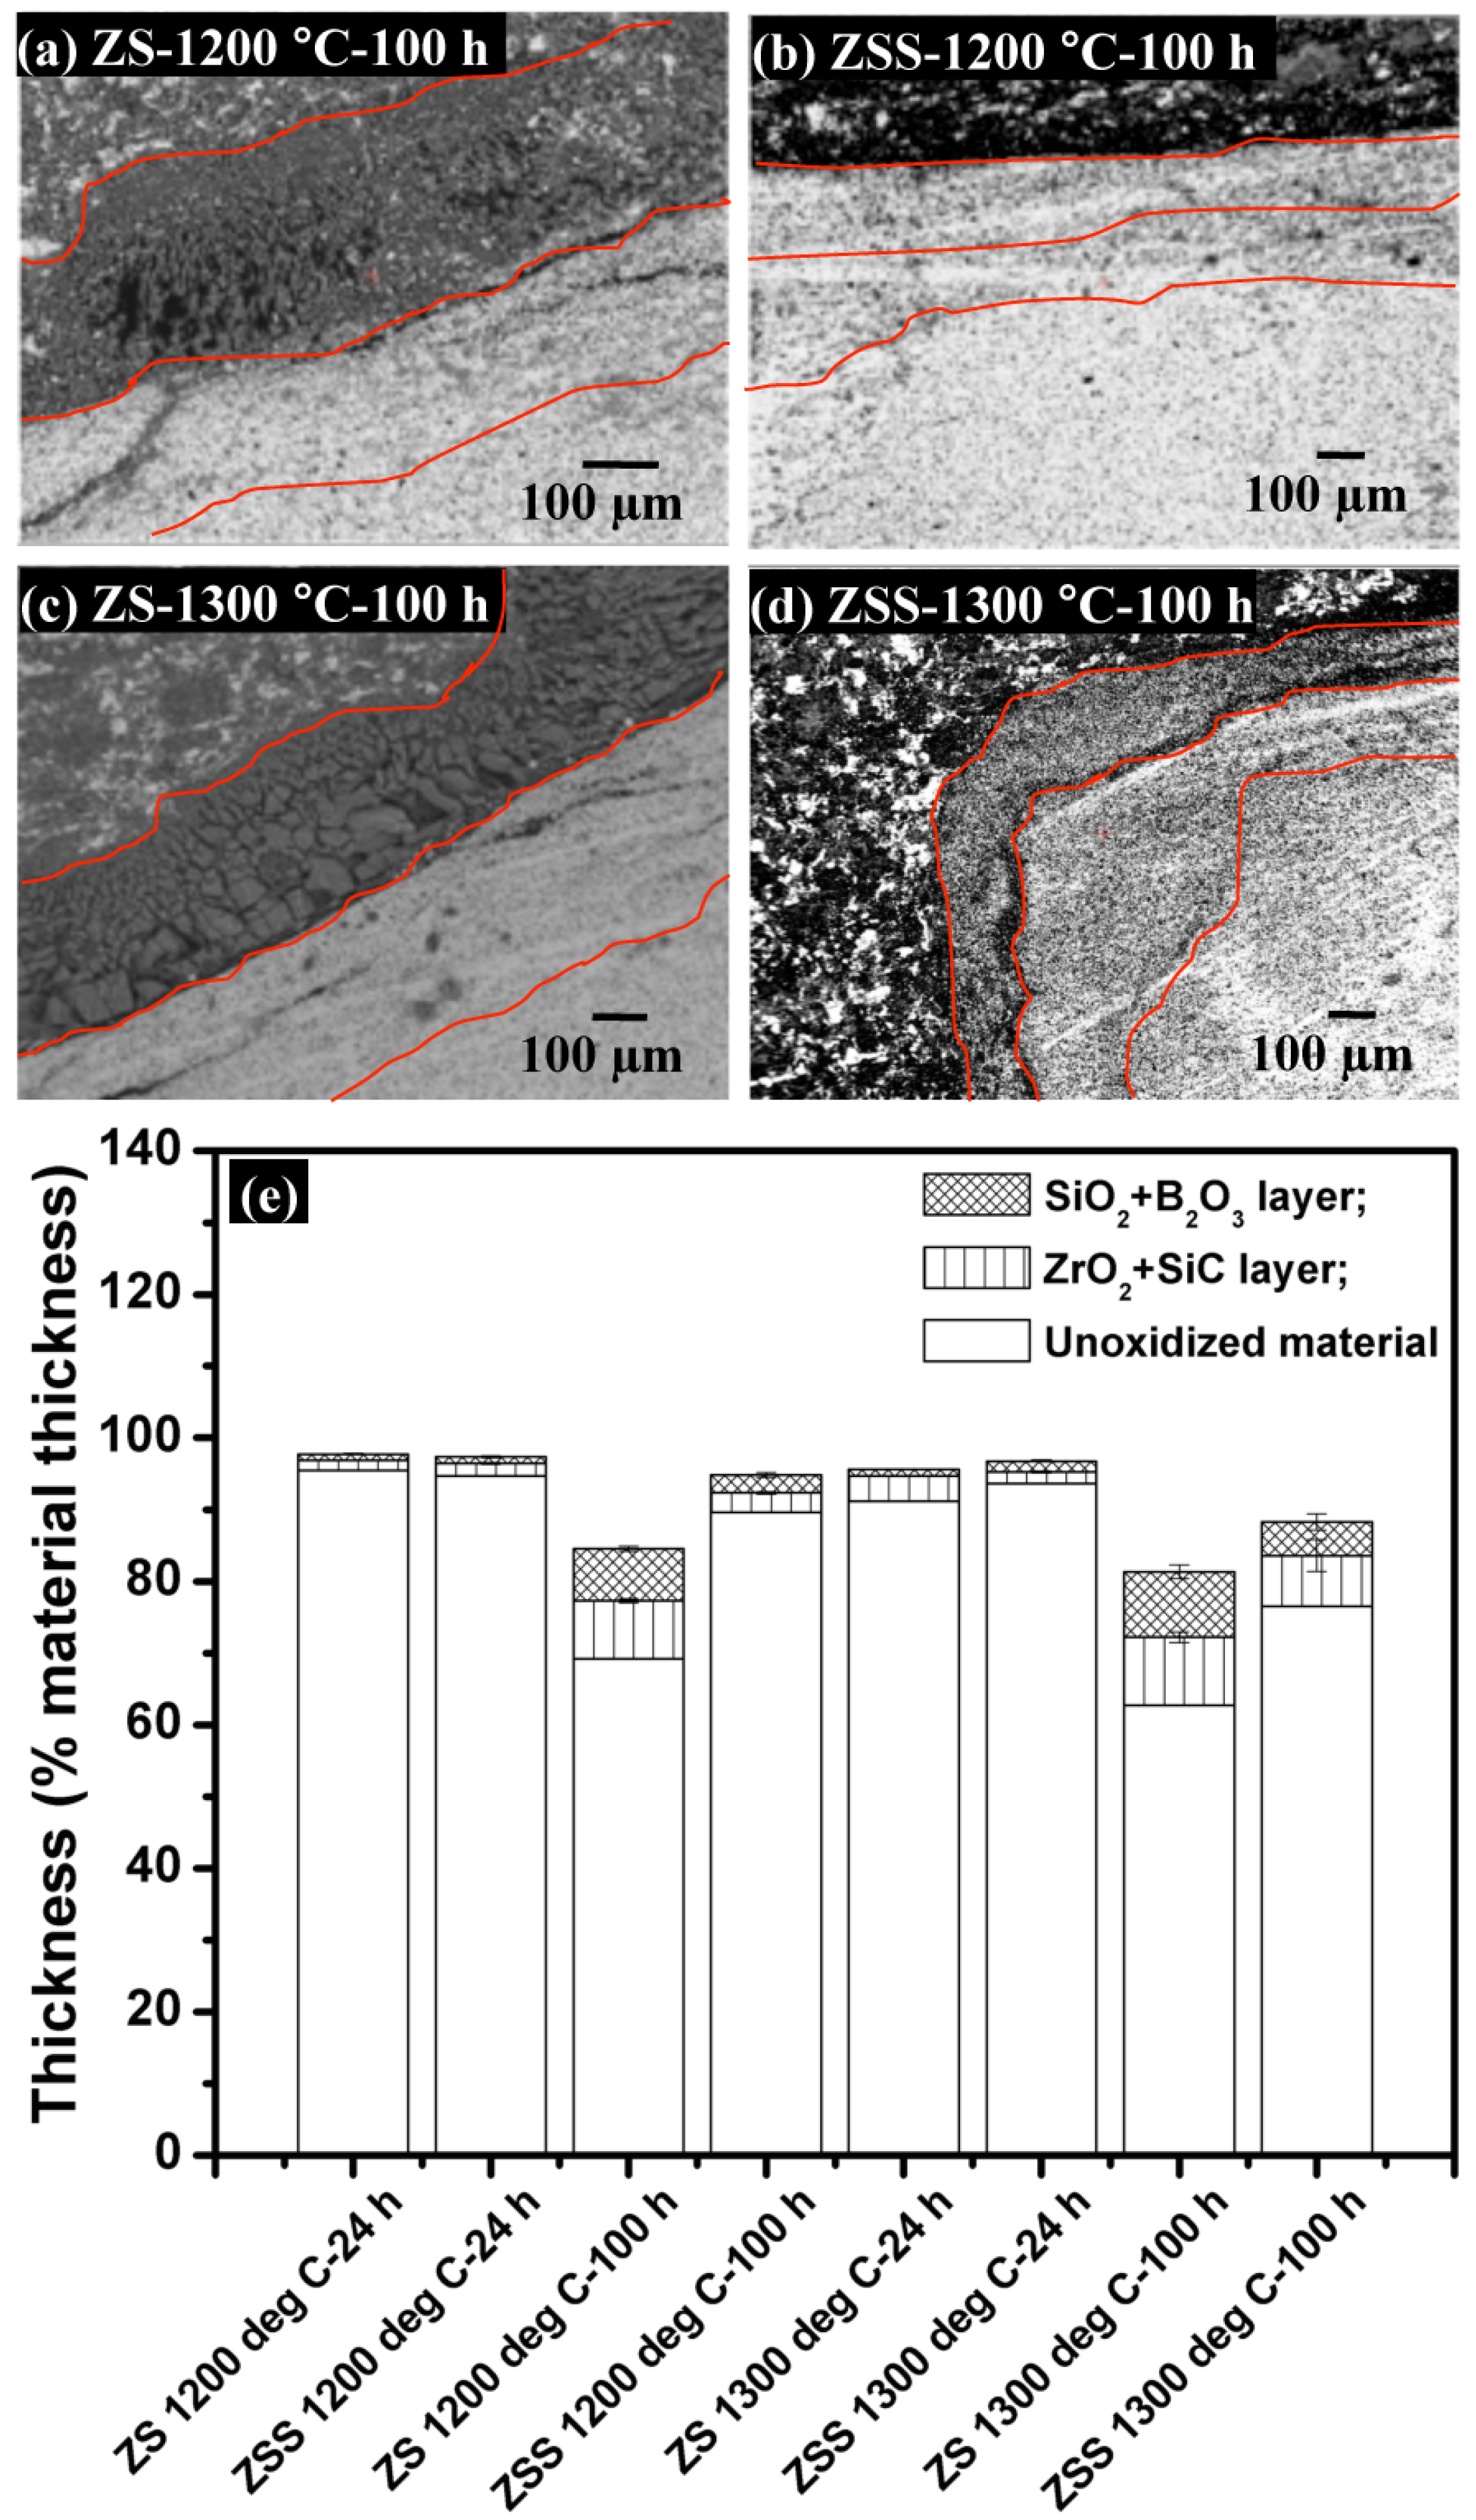
A set of EPMA (BSE) images depicting cross-sections of the oxide scale formed on the ZSS after exposure at 1200 °C for 100 h are shown in
Figure 5. When ZS and ZSS are isothermally held at 1200 and 1300 °C, the oxidation products consist of (i) a layer of SiO
2, followed by (ii) a layer of ZrO
2-SiC. The compositions of these layers have been confirmed by EDS mapping, while the thickness values of the individual layers of the oxide scales formed on ZS and ZSS at 1200 or 1300 °C for 24 or 100 h have been assessed by analyzing different SEM and EPMA images of the cross-sections and the oxide scale thicknesses are shown in
Figure 5e. Comparison of the results in this figure shows that the thickness of the oxide scale formed on the ZSS is much less than that on ZS, and the difference is more significant at 1200 °C than that at 1300 °C.
The main reactions involved during oxidation of ZS and ZSS composites at 1200 and 1300 °C are:
The dominant chemical reactions operative during oxidation of ZS and ZSS between 1200 and 1300 °C are: oxidation of ZrB
2 by reaction (1); oxidation of SiC by reaction (2); and evaporation of B
2O
3 [
3] by reaction (3). Vaporization of B
2O
3 leaves behind porous ZrO
2, which gets subsequently filled by SiO
2, formed by oxidation of SiC. On the other hand, Si
3N
4 preferably first oxidizes according to reaction (4). The ZSS shows lower mass gain compared to other ZrB
2-based composites during oxidation at both 1200 and 1300 °C due to the presence of Si
3N
4. The oxidation of Si
3N
4 results in the formation of duplex oxidation scale consisting of SiO
2 and Si
2N
2O phase. The Si
2N
2O appears to have formed as an intermediate phase between SiO
2 and Si
3N
4 in the range of 1200–1400 °C. It has been shown that Si
2N
2O provides a stronger diffusion barrier for O
2 better compared to SiO
2 [
15]. However, the SiO
2 is more thermodynamically stable than Si
2N
2O at the investigated temperature regimes. The Gibbs free energy of formation Δ
G°f is lower for amorphous SiO
2 (Δ
G°f = −154.6 kJ/mol at 1200 °C) than for Si
2N
2O (
G°f = −127.5 kJ/mol at 1200 °C) [
16].
The beneficial effect of SiC and Si
3N
4 addition towards oxidation resistance of ZS and ZSS at the selected temperature regimes is due to the formation of borosilicate glass layer. A part of B
2O
3 vaporizes while the remaining part reacts with SiO
2 to form the borosilicate glass; the presence of B on the oxidized surface has been confirmed by EPMA analysis. The SiO
2 rich layer however provides an effective barrier to oxygen diffusion and leads to passive oxidation protection at 1200 and 1300 °C [
2,
17]. It is clear that the gain in mass occurs due to the formation of ZrO
2 and SiO
2, while the mass loss can be attributed to the escape of B
2O
3 (g) and CO (g).
Higher degradation of the oxide scales of both ZS and ZSS in cyclic compared to isothermal oxidation tests is evident from the images depicted in
Figure 3 and
Figure 6. This degradation in terms of cracking and spallation can be attributed to (i) the CTE mismatch between the oxide scale constituents and substrate; and (ii) the volume change associated with phase transformation of t-ZrO
2 to m-ZrO
2 in the oxide scale. The CTE values of amorphous SiO
2 (α = 0.5 × 10
−6/°C) and crystalline Si
2N
2O (α = 2.86 × 10
−6/°C) [
18] are considerably lower than that of ZrB
2 (α = 5.9 × 10
−6/°C) or m-ZrO
2 (α = 7 × 10
−6/°C). The residual stress, σ developed by CTE mismatch in a phase after one thermal cycle can be estimated as:
where
E is the Young’s modulus, ν is the Poisson’s ratio, ∆α is the CTE mismatch and ∆
T is the temperature difference. The magnitudes of σ due to the CTE mismatch between the constituent phases, ZrO
2/SiO
2, ZrO
2/Si
2N
2O and ZrO
2/ZrB
2 systems during heating are 1700, 1082 and 287 MPa, respectively. Hence, presence of Si
2N
2O in the oxide scale would reduce its tendency for cracking or spallation. This is considered as the primary reason for lower degradation of ZSS as compared to ZS. The principal residual stresses, σ
1 and σ
3, as well as the maximum shear stress, τ
max [= (σ
1 − σ
2)/2] within m-ZrO
2 phase present in the oxide scales of ZSS are 216, 381 and −82 MPa, respectively. The magnitudes of the experimentally estimated residual stress values are considerably lower compared to calculated values based on CTE mismatch. The stress relief caused by cracking during exposure to multiple thermal cycles appears to be the most acceptable explanation for the differences between calculated (for single cycle) and experimental (multiple cycles) values of residual stress, as shown in
Table 2.


