Article

Ride Quality Due to Road Surface Irregularities: Comparison of Different Methods Applied on a Set of Real Road Profiles

Department of Civil, Constructional and Environmental Engineering, Sapienza University of Rome, Via Eudossiana 18, 00184 Rome, Italy
*
Author to whom correspondence should be addressed.
Coatings 2017, 7(5), 59; https://doi.org/10.3390/coatings7050059
Submission received: 28 February 2017 / Revised: 4 April 2017 / Accepted: 19 April 2017 / Published: 26 April 2017
(This article belongs to the Special Issue Low Environmental Impact Coatings for Road Pavements)

Abstract

:
Road roughness evaluation can be carried out using different approaches. Among these, the assessment of ride quality level perceived by road users is one of the most-used. In this sense, different evaluation methods have been developed in order to link the level of irregularities present on road surface profiles with the induced detrimental effects in terms of discomfort. In particular, relationships between wavelength content of road profiles and consequent level of comfort perceived had been investigated by using, in general, a mean panel ratings approach. In this paper, four ride quality evaluation methods (Ride Number, Michigan Ride Quality Index (RQI), Minnesota Ride Quality Index and frequency-weighted vertical acceleration, awz, according to ISO 2631 were applied to a set of real road profiles. The obtained results were analyzed, investigating a possible relation between the different indices, comparing them also with the most-used road roughness method worldwide: the International Roughness Index (IRI). The analyses carried out in this work have highlighted how the various rating scales may lead to a different ride quality assessment of the same road pavements. Furthermore, comparing the awz with the values obtained for the other three methods, it was found that their rating scales are set for speeds within the range 80–100 km/h. For this reason, it is necessary to identify new thresholds to be applied for lower speeds, as in the case of urban roads. In this sense, the use of the ISO 2631 approach would seem to be a useful tool.

1. Introduction

Road roughness is an important issue for the assessment of road pavement condition [1,2], and an important aspect to be included in any Pavement Management System (PMS) [3,4,5,6]. Road roughness evaluation can be carried out using a number of different approaches. Among these, the most common ones are based on the assessment of detrimental effects induced by irregularities on road surfaces, like the dynamic increment of loads transmitted to pavements [7], road users’ comfort [8] and noise generated due to road traffic [9].
The International Roughness Index (IRI) is the most used method worldwide and it was developed to take into account general effects (both on pavements and users) induced by irregularities of road pavement surface [10]. Some authors, like Kropáč and Múčka [11] and Loizos and Plati [12], have highlighted some limits of the applicability of IRI as a method for the evaluation of road roughness. In particular, in [13], the inability of IRI to describe car body vertical vibration due to the presence of certain wavelengths (i.e., >20 m) of road profile was described. In recent decades, several indices have been developed as alternative methods to consider various effects [14]. Particular attention has been paid to the assessment of the influence of road unevenness on vehicles and passenger vibrations [15,16], and the evaluation of possible correlations between existing roughness indicators and vehicles vibration response [17].
Cantisani and Loprencipe [18] proposed calculating the whole body vibration induced on passengers inside road vehicles, by means of the process described in the ISO 2631 standard [19], to assess ride quality. In this way, it would be possible to reflect the comfort perceived by road users. Many authors have analyzed existing relations between IRI and vertical accelerations measured on driver and/or passenger seats, considering different types of vehicles and different velocities [17,20,21,22]. Most of these studies found a linear regression with R2 values within the range from 0.76 to 0.99. Other indicators, like the Ride Number (RN) and the Michigan and Minnesota Ride Quality Index (RQI), have been developed through Mean Panel Rating (MPR) tests, in order to take into account road customers’ opinions.
In the literature, to the best of our knowledge, no relationships or comparisons between the latter indices are present. In some studies, on the other hand, it is possible to find some relationships between each of the aforementioned ride quality indices and IRI. In particular, Sayers and Karamihas [2] found a relationship between IRI and Profile Index (PI), which is a parameter at the base of RN calculations, having an R2 value of 0.82. In this case, the IRI range considered was from 0.5 to 7 m/km. A similar range was also considered in [23] where, in addition to the comparison between IRI and PI (R2 variable 0.96–0.98), a direct relationship between IRI and RN (R2 = 0.98) was provided, although related to a narrower range of IRI values (from 0.5 to 1.6 m/km).
In [24], relationships between Michigan RQI (RQIMich) and IRI for different types of pavement (i.e., flexible, rigid, composite) are depicted, although corresponding equations and R2 values are not reported (but the result seems to be good). The calculation of the Minnesota RQI (RQIMn) is instead, as will be described in the following section, based on IRI values.
In this paper, a comparison of the RN, RQIMich and RQIMn was carried out, applying them to a set of 3905 samples of real road (asphalt pavement) profiles, having section lengths equal to 100 m. These indices were selected because they are based on MPR and the corresponding threshold values currently adopted in certain countries are available in literature. The final purpose is to compare the different ride quality thresholds defined for each method, also evaluating the existence of possible correlations between them. Furthermore, the capability of the ISO 2631 [19] approach as a road unevenness indicator was investigated, comparing the results with those obtained using the consolidated methods (RN, RQIMich and RQIMn). Finally, all the aforementioned approaches were compared with IRI, which is the most-used road roughness evaluation method worldwide, as stated in [25], where IRI specifications around the world are reported. In this way, this work intends to highlight the need of standardizing mean panel tests, adopting also homogeneous speed-related threshold values to be used for ride quality evaluation.

2. Ride Quality Evaluation Methods

Most of the ride quality indices taken into account in the present work are based on MPR. Each of them was developed by in-situ experiments, where different samples of drivers and road pavement sections were considered. The calculation of the above-mentioned indices for the road profile samples analyzed in the present work was performed as described in the following sections.

2.1. Ride Number (RN)—ASTM E 1489

The Ride Number (RN) is a mathematical processing of longitudinal profiles that allows the estimation of the subjective ride quality perceived by road users. The calculation is performed by means of the following Equations (1) and (2), reported in the ASTM E1489 standard [26] and developed by Karamihas and Sayers [27]:
R N = 5 × e 160 × ( P I )
where
P I = P I L 2 + P I R 2 2
where PIL and PIR are the Profile Indices of the left and right wheel paths. They are the computed Root Mean Square (RMS) of the filtered slopes of the measured elevation profiles of the both wheel paths. The range of RN values is from 0 to 5.0, where an RN of 5.0 is considered to be a road inducing a perfect ride quality. With some exceptions, the wavelengths’ range of interest for RN is similar to that of IRI, as reported in [2]. In particular, RN presents a higher sensitivity to low wavelengths than IRI, which has a greater sensitivity to wavelengths of 16 m or longer than RN.

2.2. Michigan Ride Quality Index (RQIMich)

RQIMich is a roughness evaluation method developed by the Michigan Department of State Highways (Lansing, MI, USA) in order to predict users’ opinions from road profiles [28]. The calculation is based on a research study where users’ opinions were linked to wavelength content of the profile elevation Power Spectral Density (PSD) functions. In particular, three significant wavebands were identified: 0.61–1.52 m for the short waveband; 1.52–7.62 m for the medium waveband; and from 7.62 to 15.24 m for the long waveband. The variance in each waveband is calculated using a filter process. Finally, the Michigan RQI is calculated using the following Equation (3):
R Q I Mich = 3.077 × ln ( V A R 1 × 10 8 ) + 6.154 × ln ( V A R 2 × 10 8 ) + 9.231 × ln ( V A R 3 × 10 8 ) 141.85
where VAR1, VAR2 and VAR3 are, respectively, the variances of the profile in the long, medium and short wavebands. As reported by Lee et al. [24], an RQIMich value between 0 and 30 indicates excellent ride quality, a value from 31 to 54 it indicates good ride quality, while values from 55 to 70 indicate fair ride quality. Pavements having RQIMich values greater than 70 are considered to have poor ride quality.

2.3. Minnesota Ride Quality Index (RQIMn)

RQIMn is a roughness evaluation method developed by the Minnesota Department of Transportation (Mn/DOT, St. Paul, MN, USA) in order to take into account customer’s opinion; correlating it with IRI values calculated for over 120 test sections as reported in the document “2015—Pavement Condition Annual Report” compiled by Mn/DOT [29]. As already stated, IRI is the roughness evaluation method that is most used worldwide, and the algorithm used for its calculation was developed by Sayers [30] and reported in ASTM E1926 [31]. Two different correlation equations were found, Equation (4) for bituminous pavements and Equation (5) for concrete pavements as specified in the document “An Overview of Mn/DOT’s Pavement Condition Rating Procedures and Indices” [32]:
R Q I Mn , flexible = 5.697 ( 2.104 ) × I R I
R Q I Mn , rigid = 6.634 ( 2.813 ) × I R I
where IRI value is in (m/km). Considering the kind of road pavements analyzed in this work, only Equation (4), related to bituminous pavements, was taken into account. As for RN, the scaling rate range of RQIMn varies from 0 to 5.0, with the different ride quality categories specified in Table 1.

2.4. Whole-body Vibration (awz)—ISO 2631

An additional method that can be used for the evaluation of road customers’ comfort is the process provided by ISO 2631 for comfort assessment in public transport. This method is based on the measurement of vertical acceleration inside road vehicles, which are used to determine RMS accelerations through the evaluation of PSD with regard to all 23 one-third-octave bands that represent the frequency range of interest for human response to vibrations (0.5–80 Hz) described in the ISO 2631 [19]. Once the RMS accelerations are known, it is possible to calculate the vertical weighted RMS acceleration (awz) using the following Equation (6):
a wz = i = 1 23 ( W k , i × a iz R M S ) 2
where Wk,i are the frequency weightings in one-third-octave bands for seated positions, provided by the standard; and aiz is the vertical RMS acceleration for the i-th one-third-octave band. Then, the calculated values can be compared with the threshold values proposed by ISO 2631 for public transport (Table 2), in order to identify the comfort level perceived by users in all roads sections.
The current standard does not contain clearly-defined vibration exposure limits between adjacent comfort levels, because many factors (e.g., user age, acoustic noise, temperature, etc.) combine to determine the degree to which discomfort will possibly be noted or tolerated. For this reason, the ISO standard provides several comfort levels introducing an overlapping zone between two adjacent levels. To determine the frequency-weighted vertical acceleration on users due to road roughness, several simulations were performed using the 8 degree of freedom (d.o.f.) full-car model developed by Cantisani and Loprencipe [18] and calibrated in order to represent the behavior of a common passenger car. In particular, a speed range from 30 to 130 km/h was considered in order to evaluate correlation trends between the awz and the other three aforementioned methods (RN, RQIMich and RQIMn) as a function of the traveling velocity.

3. Data Set of Road Profiles and Performed Comparative Analyses

3.1. Data Set of Road Profiles

A set of about 200 km of real road profiles, belonging to the Italian road network, was sampled with a spatial increment of 2.5 cm. For each lane, two paths (right and left) at the main rutting alignments were measured using a high-speed laser/inertial profilometer. Each profile path was divided into profile sections of 100 m, which is the most common length reference for road roughness evaluation (with regards to IRI) used in several countries, as reported by Múčka [25]. Thus, 1987 sections were taken into account. In order to characterize and classify the profile sample available, a preliminary analysis based on the ISO 8608 standard [33] was carried out. In particular, to classify road surface profiles according to the aforementioned standard, the PSD of elevations was calculated using Fast Fourier Transform (FFT) and the Hanning window. Then, the smoothing and fitting processes described in Loprencipe and Zoccali [34] were performed. As reported in Table 3, the real road profiles considered in this study belong only to the following classes: A (very good), B (good), C (average) and D (poor); with a significant predominance of the second one (class B profiles).

3.2. Comparative Analyses and Thresholds Adopted

The comparison of the different approaches previously described, involved both the search for possible correlations between these indices and by evaluating their ability to assess each single profile in the same way. For this reason, a study about possible ride quality evaluation agreements provided by RN, RQIMich and RQIMn methods was also carried out. To perform this kind of analysis, it was decided to consider, for each index, four ride quality levels as defined in Table 4; comparing, then, the assessment provided by the various comfort indices for each available profile data.
The adopted thresholds described in Table 4 had already been reported in some documents for RQIMich limit values [24], RQIMn [31] and awz [18]. In contrast, for RN the division of the rating scale reported in [26] was performed in order to be consistent with the four ride quality levels considered.
The resulting percentage of agreement (PoA) between the two different methods was then calculated according to Equation (7):
P o A IJ = N IJ , verygood + N IJ , good + N IJ , mediocre + N IJ , poor N tot × 100
where NIJ,verygood, NIJ,good, NIJ,mediocre, and NIJ,poor are the number of profiles evaluated as providing, respectively, a very good, good, mediocre and poor ride quality level by both ride quality evaluation methods I and J (IJ). Ntot is the total number of examined road profile samples.
It is useful to remember that the ride quality level thresholds for RN, RQIMich and RQIMn are not speed-related. Although the limits provided by the ISO 2631 are the same, the awz value strongly depends, by means of the mechanical model used, on the velocity considered for its calculation.
In order to provide a more detailed analysis of the examined ride quality assessment approaches, these indices were also compared to IRI, which is the world’s most popular road roughness evaluation method.

3.3. International Roughness Index (IRI) Thresholds

The IRI was elaborated from a World Bank study in the 1980s [30]. It is based on a mathematical model called quarter-car and was developed in order to assess not only the ride quality on road pavements, but also other detrimental effects, such as dynamic load increment (on both vehicle and pavement) due the presence of irregularities on road surfaces. The calculation is performed using a model that calculates the simulated suspension motion on a profile and divides the sum by the distance traveled according to the Equation (8):
I R I = 1 l 0 l / v | z ˙ s z ˙ u | d t
where l is the length of the profile in km, v is the simulated speed equal to 80 km/h, z ˙ s is the time derivative of vertical displacement of the sprung mass in m, and z ˙ u is the time derivative of vertical displacement of the unsprung mass in m. The final value is expressed in slope units (e.g., m/km or mm/m). In the present work, the algorithm proposed by the ASTM E1926 standard [31] for IRI calculation was used.
As reported in [25], there is a high heterogeneity of IRI thresholds adopted around the world. In fact, IRI limit values mainly depends from several aspects: road surface type (i.e., asphalt or cement concrete pavements), road functional category, average annual daily traffic (AADT), legal speed limit and segment length considered for IRI calculation. In addition, they change depending on whether we talk about new, reconstructed or in-service roads. As already stated, the most common segment length indicated in non-US countries is equal to 100 m [25].
Between the different parameters affecting IRI specifications, surely the most important is the maximum traveling velocity allowed on the road, whose roughness level is meant to be assessed. For this reason, some authors [18,35] have proposed speed-related IRI thresholds to be used for the evaluation of ride quality. In particular, Yu et al. [35] defined five ride quality levels providing for each of them the corresponding limit values based on the jolt and jerk experienced by the raters within a speed range from 10 km/h to 120 km/h. They analyzed 102 longitudinal profiles with a length of 150 m collected in the Strategic Highway Research Program (SHRP) Long-Term Pavement Performance (LTPP). In Table 5, the suggested thresholds found in correspondence of some velocities are shown.
Cantisani and Loprencipe [18] examined 124 LTPP profiles of 320 m, defining four ride quality levels and calculating the corresponding thresholds from the relation found between IRI and the vertical frequency-weighted acceleration (awz) at several speeds (from 30 to 90 km/h), by means of the 8 d.o.f. full-car model previously described in Section 2.4. As can be seen by comparing the IRI thresholds suggested in [18] (reported in Table 6) with the ones in Table 5, a generally good agreement between the two aforementioned studies can be found.
The importance of considering appropriate speed-related IRI thresholds is also underlined by Múčka in [25], where a suggested relation for IRI threshold values as function of velocity limit is reported. In particular, Múčka did not suggest any specific IRI limit values, but he provided Equation (9) to be adopted:
I R I ( v 2 ) = ( v 1 v 2 ) 0.5 × I R I ( v 1 )
which is based on the assumption that the same level of vibration response can be achieved for two different speeds v1 and v2. Adopting the aforementioned equation would mean that the condition of the same quarter-car suspension relative velocity response for the two different speeds (v1 and v2) is met.

4. Results and Discussion

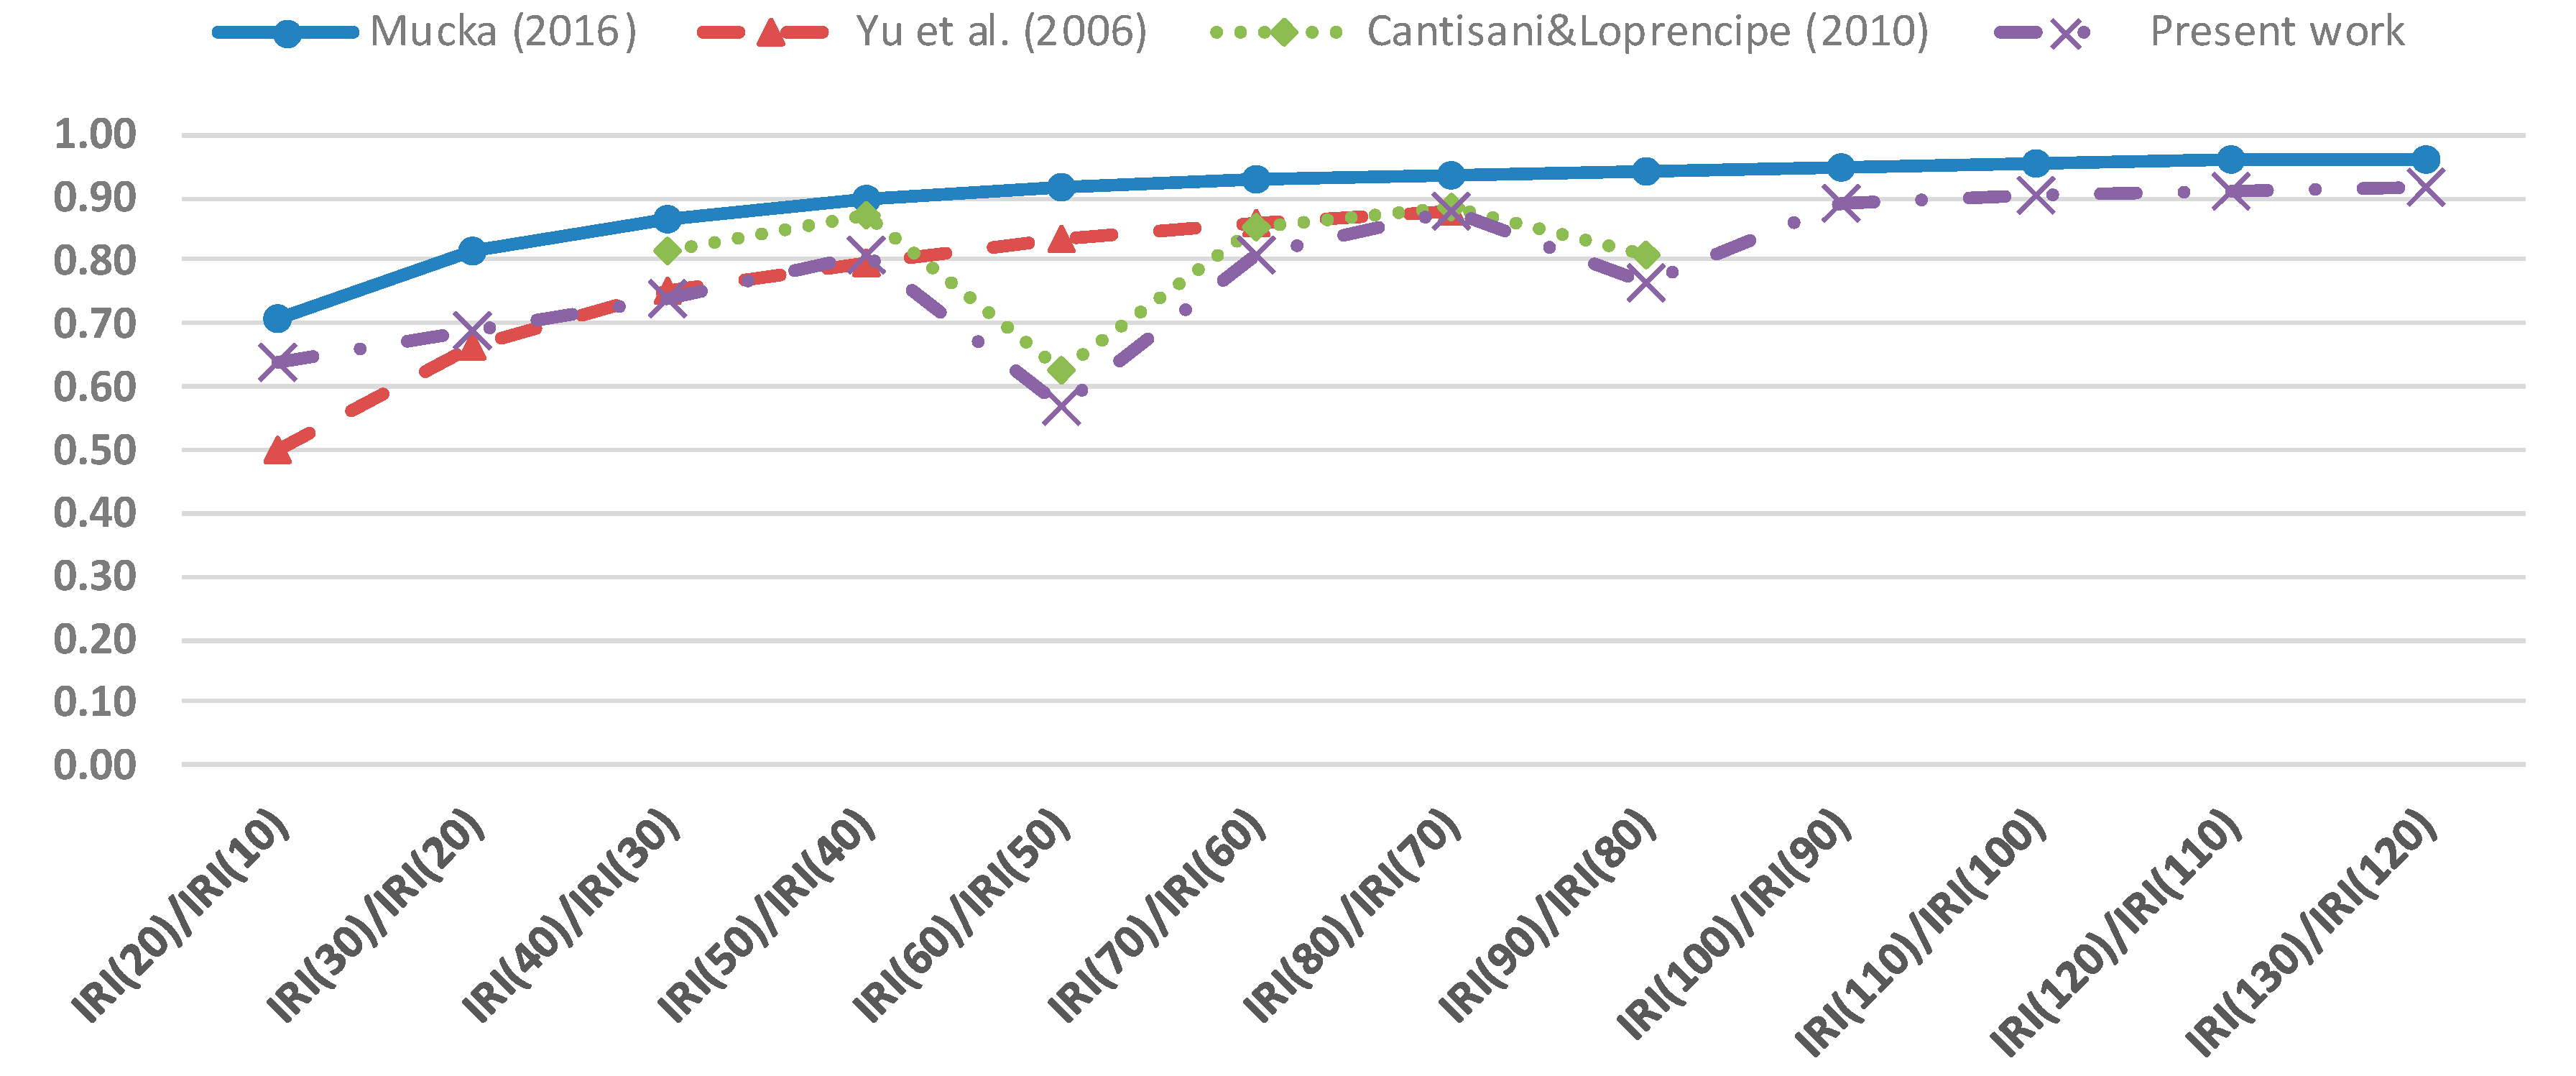
A preliminary study concerning the analysis of the IRI relation reported in Equation (9), which was introduced by Múčka [25], talking about international IRI specifications for new/reconstructed roads. Specifically, it was decided to compare the ratio between IRI thresholds at two adjacent velocities (e.g., IRI(30)/IRI(20) or IRI(80)/IRI(70)), calculated using Equation (9), and obtained by employing both the threshold values suggested by Yu et al. [35] and those suggested by Cantisani and Loprencipe [18] with regard to very good ride quality level. It can be supposed, in fact, that this ride quality level characterizes new or reconstructed roads. The results of the above-mentioned comparison are then depicted in Figure 1, where the results obtained by applying the procedure described by Cantisani and Loprencipe [18] to the real profile samples considered in the present work and taking into account a segment length of 100 m are also reported.
As can be seen, similar trends are found for all of the examined studies and, in particular, values very close to the ones presented in [18] are found in the present work, where the same simulation model but different road profile samples were used. Furthermore, some anomalies in both of the latter approaches’ trends can be noted to correspondend to the IRI thresholds ratio between speeds of 60 and 50 km/h, and between 90 and 80 km/h. This unexpected behavior was probably due to the mechanical parameters considered in the simulation model at these speeds (i.e., the mechanical properties were defined as a function of the traveling velocity).
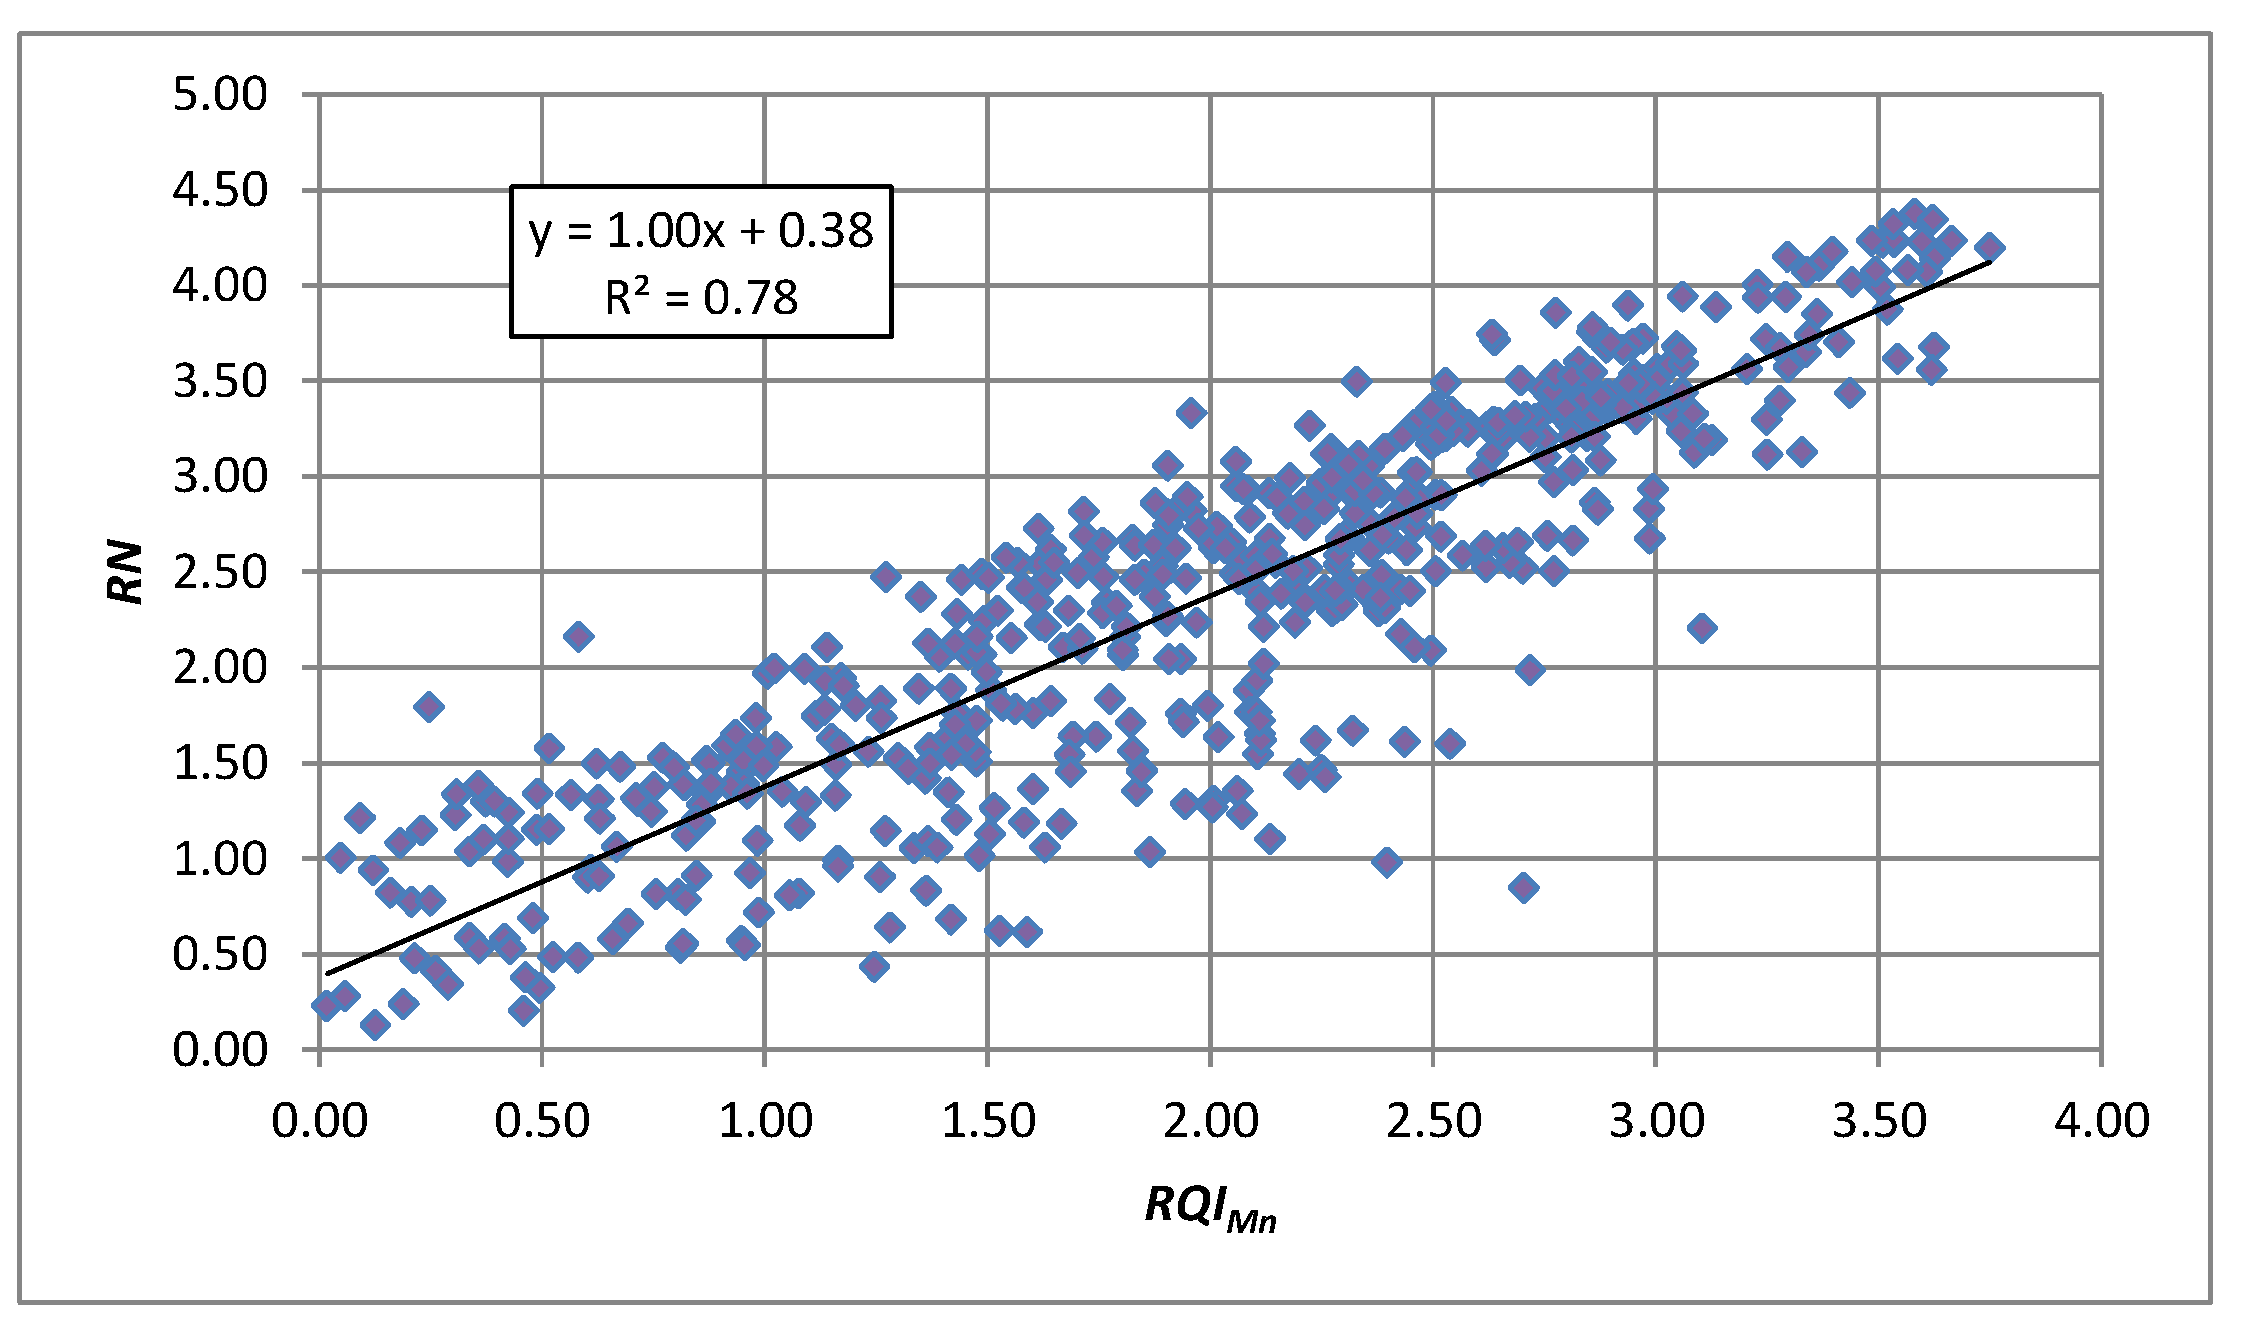
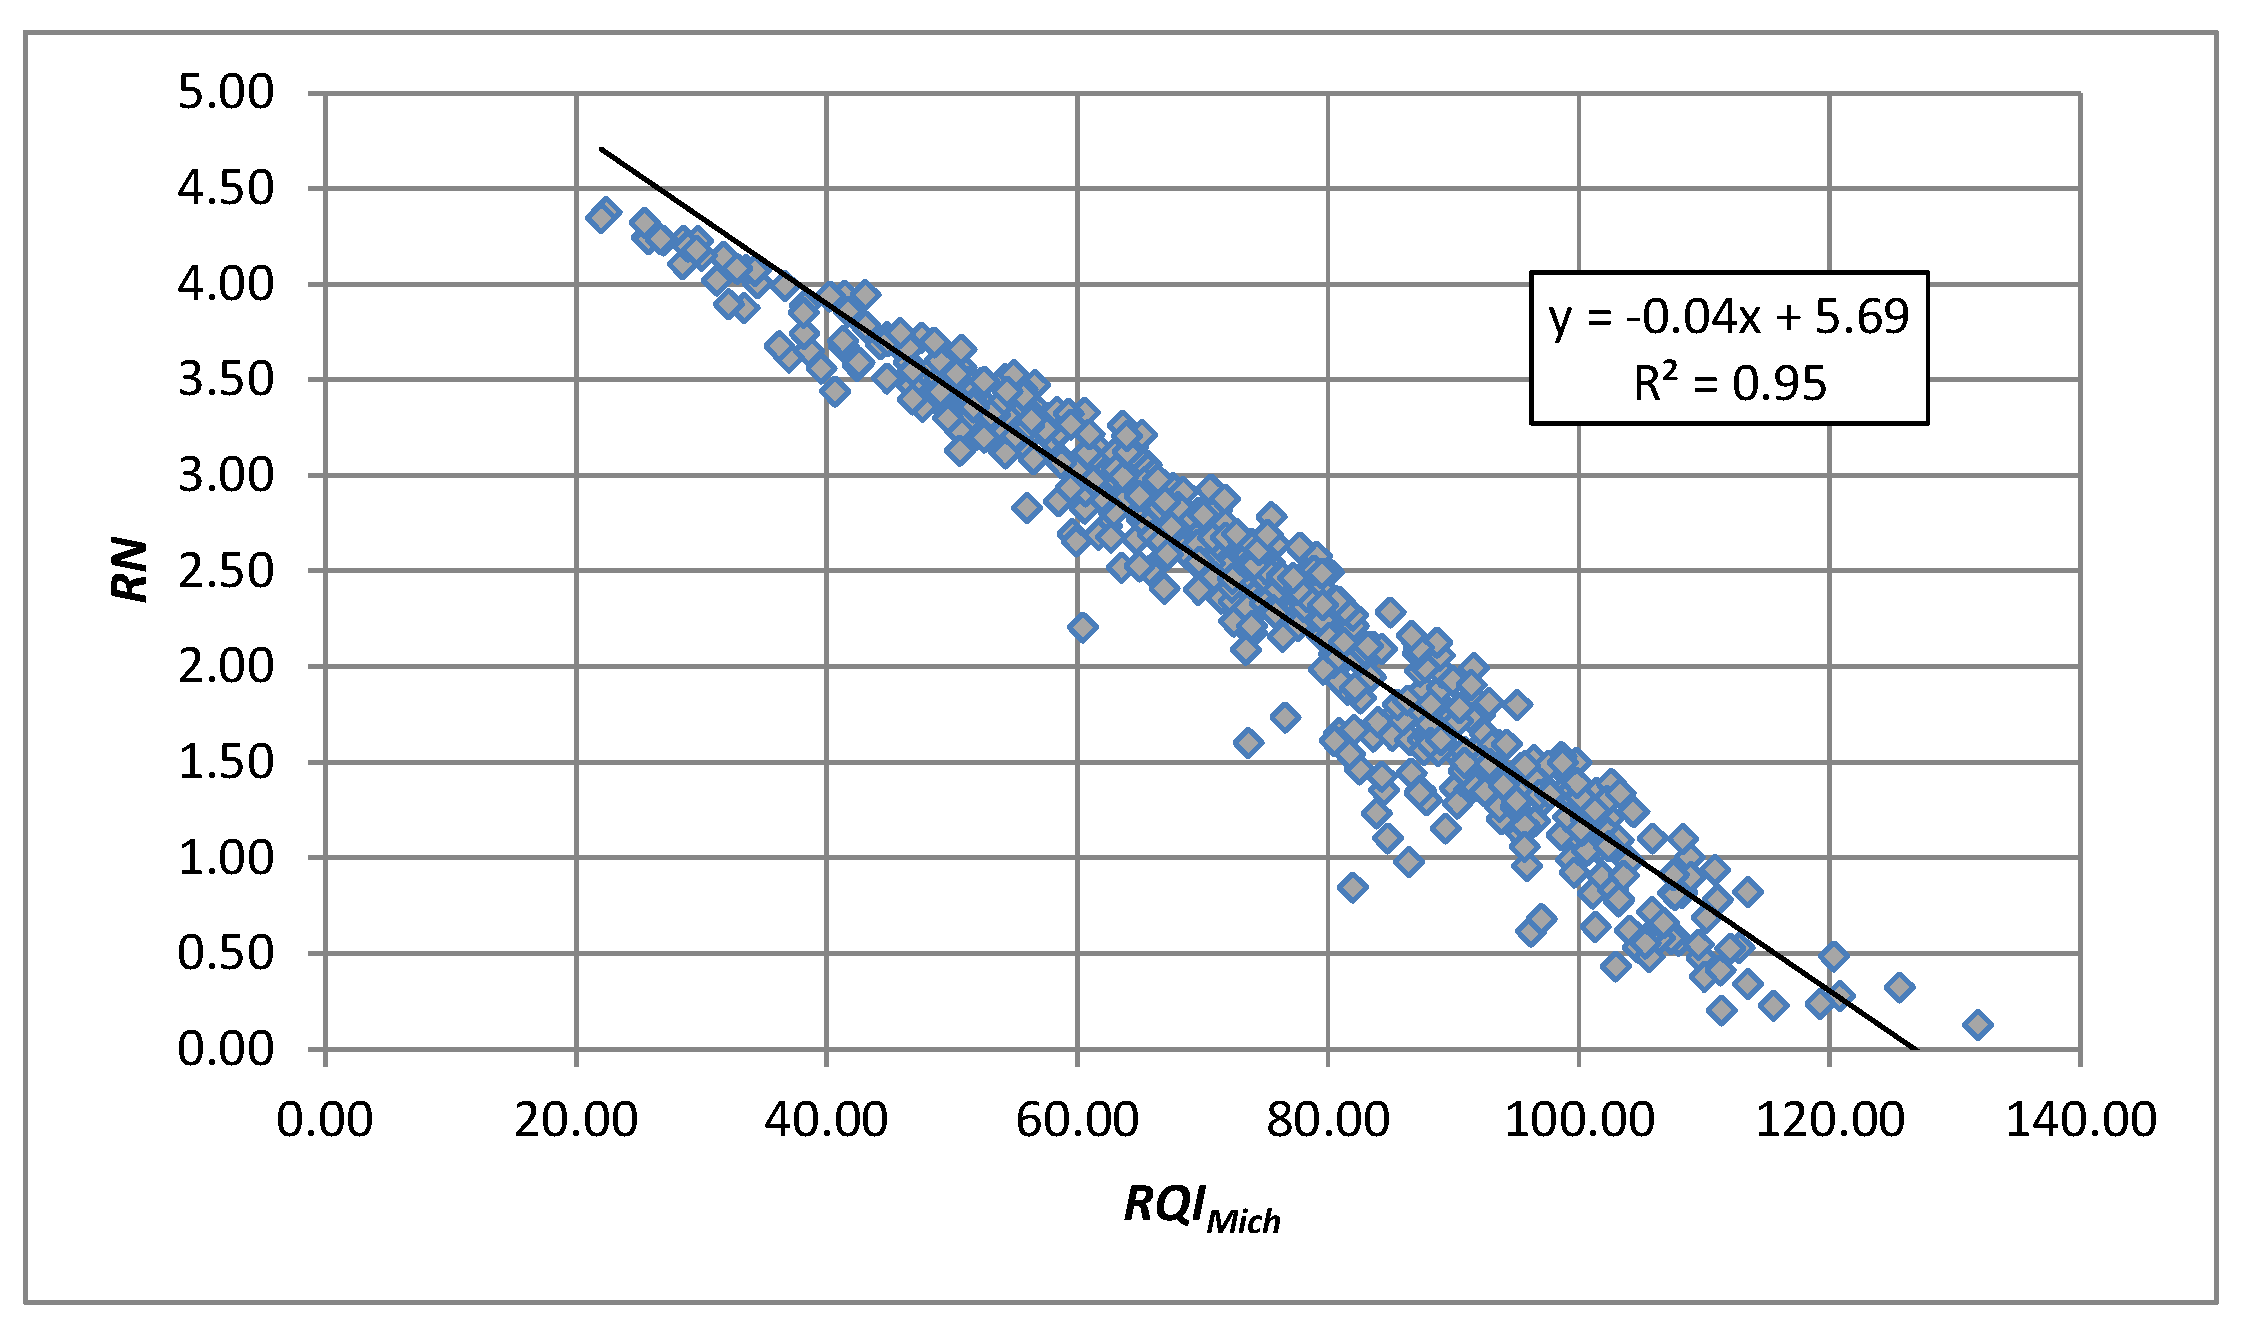
Before proceeding with the analysis of the awz values at different speeds, a comparison between the results obtained for the other three users’ comfort evaluation methods was performed. Because no indications were found about section length to be used for their calculation, it was decided to consider the same length of 100 m as commonly adopted for IRI calculation. In this way, all the wavelengths’ contents of interest for the various examined ride quality methods are taken into account. In particular, pretty good correlations between them were found, as can be seen in Figure 2, Figure 3 and Figure 4 where R2 values within 0.78–0.95 are shown. The highest R2 value (0.95) was obtained for RQIMich-RN regression equation (Figure 2).
Although quite good correlations were found between these indices, each index presents a specific scale rating based on the performed panel rating tests, for which a standardization does not exist.
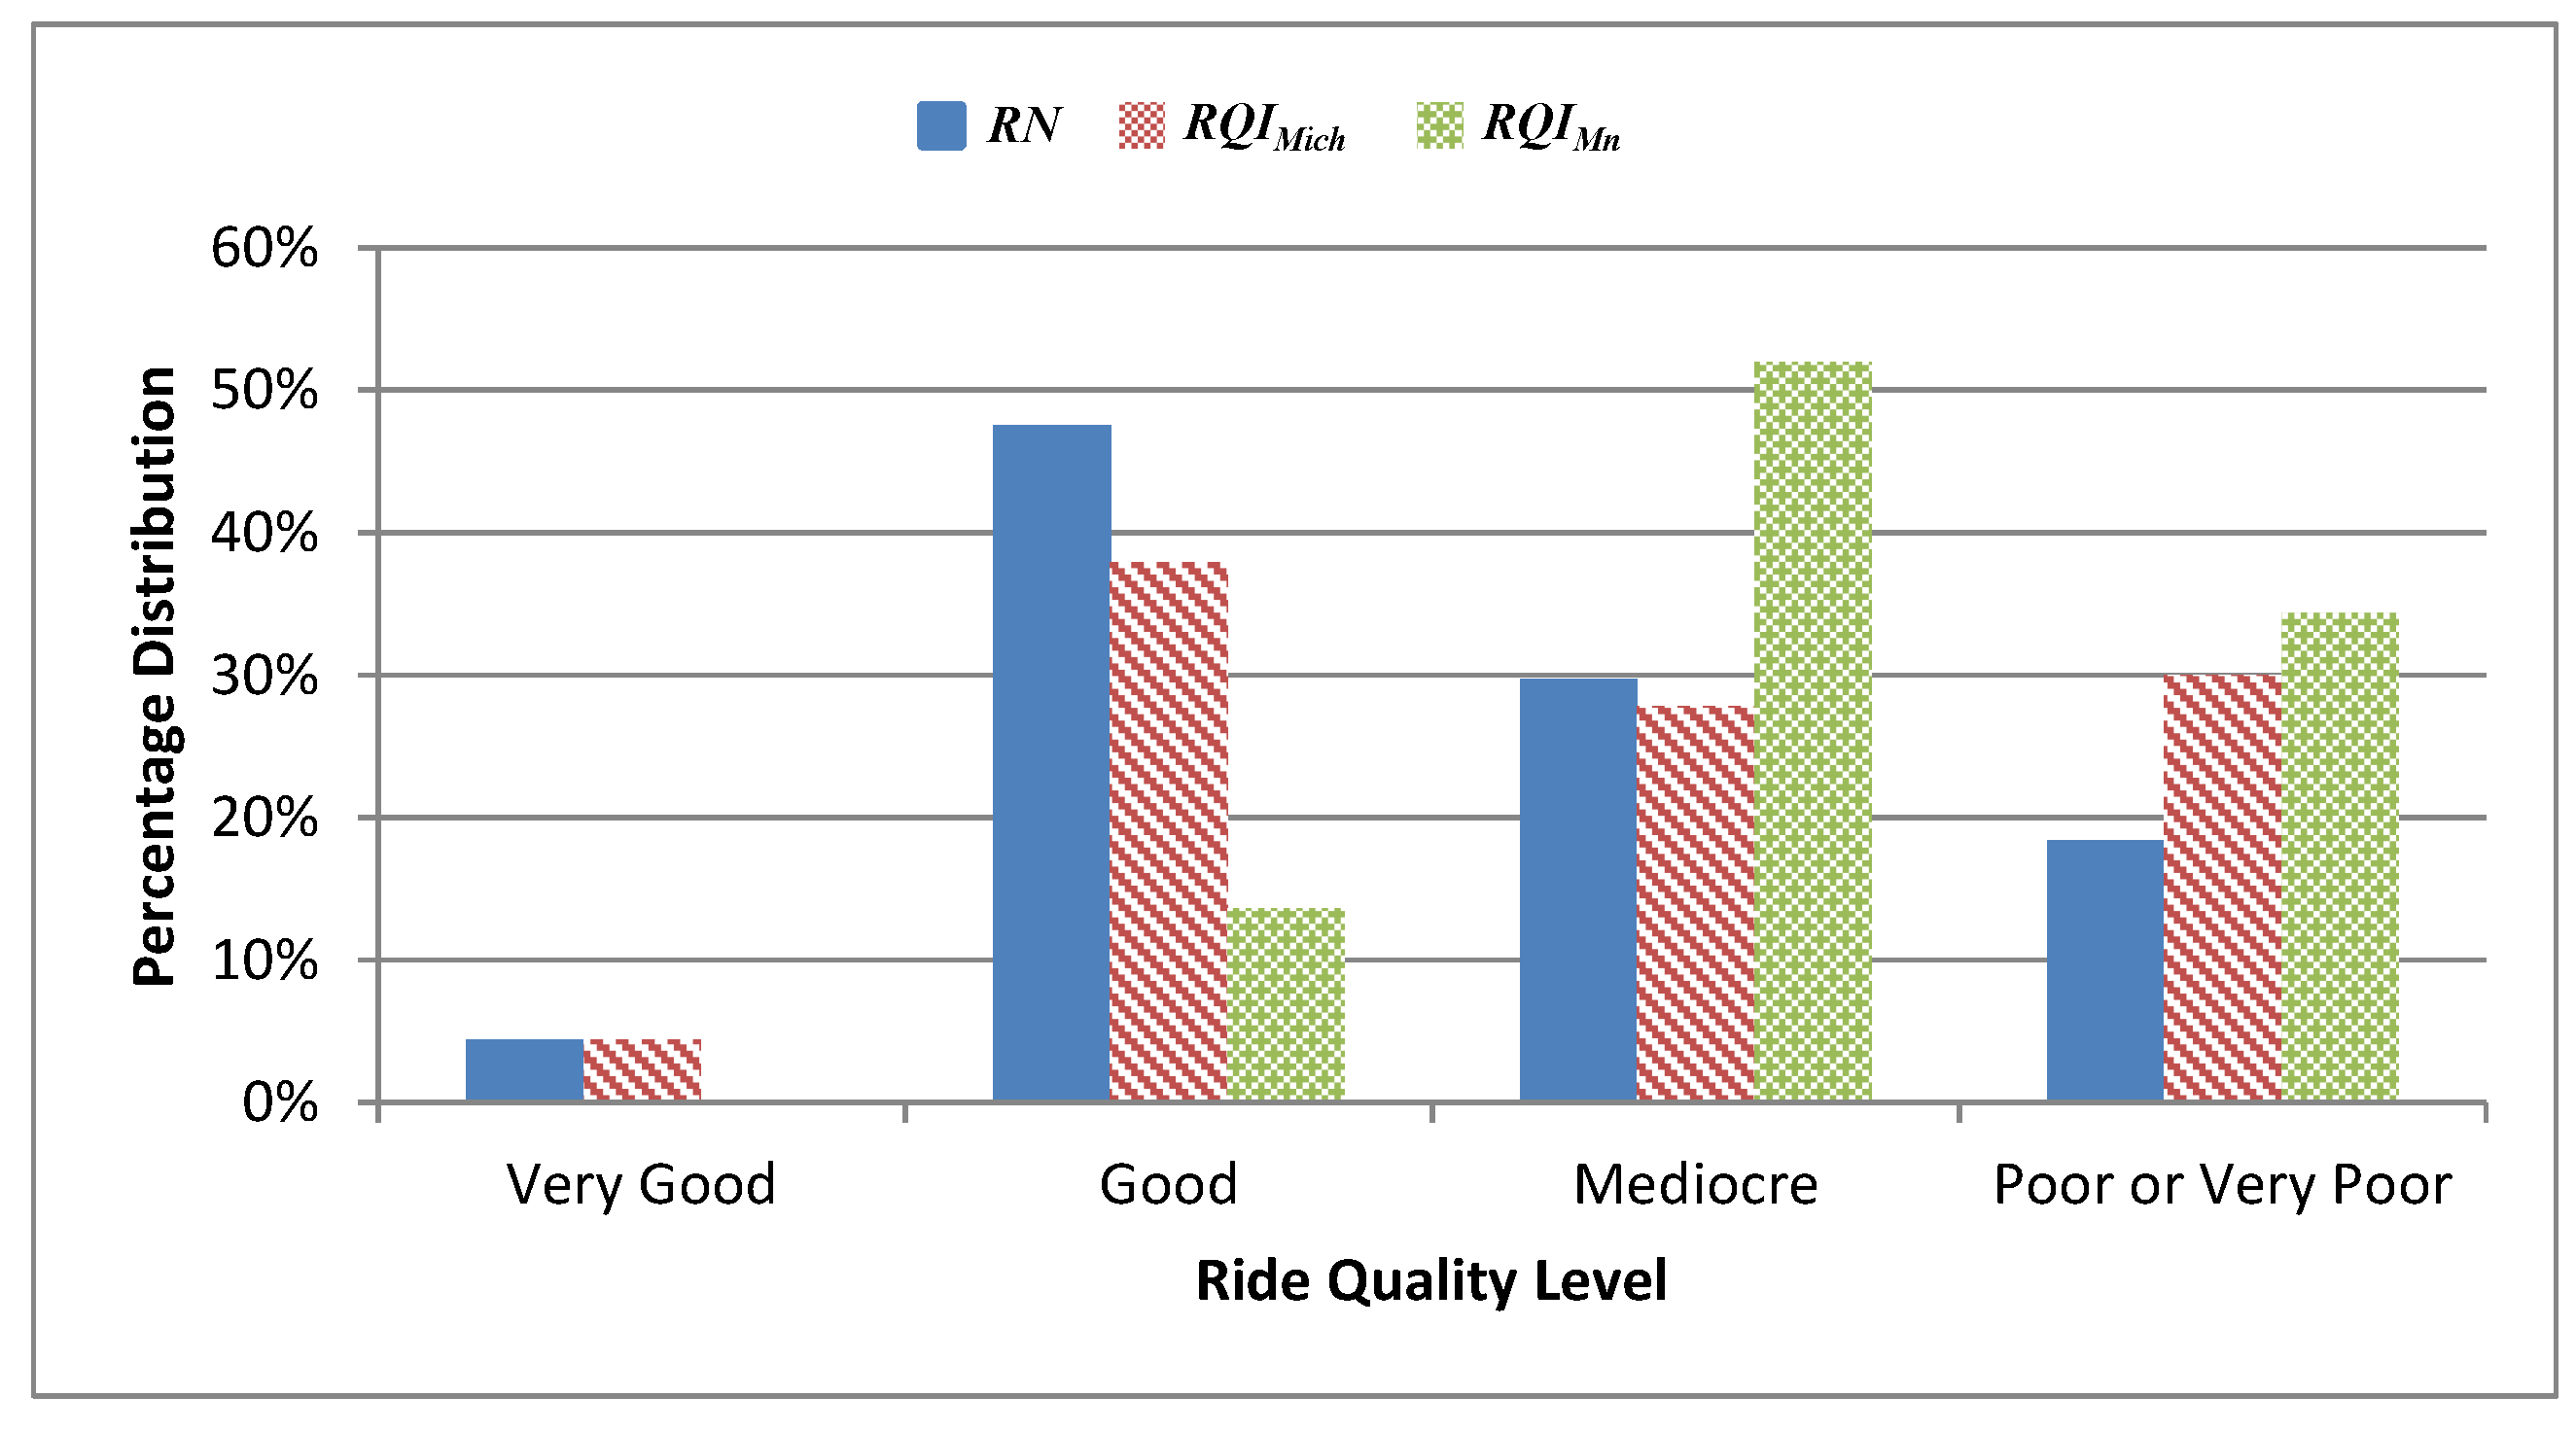
In fact, different distributions of the real profile samples among the four ride quality levels were obtained, based on the method that was being considered, as can be seen in Figure 5. Thus, the choice of road ride quality evaluation method meaningfully influences the maintenance actions planning.
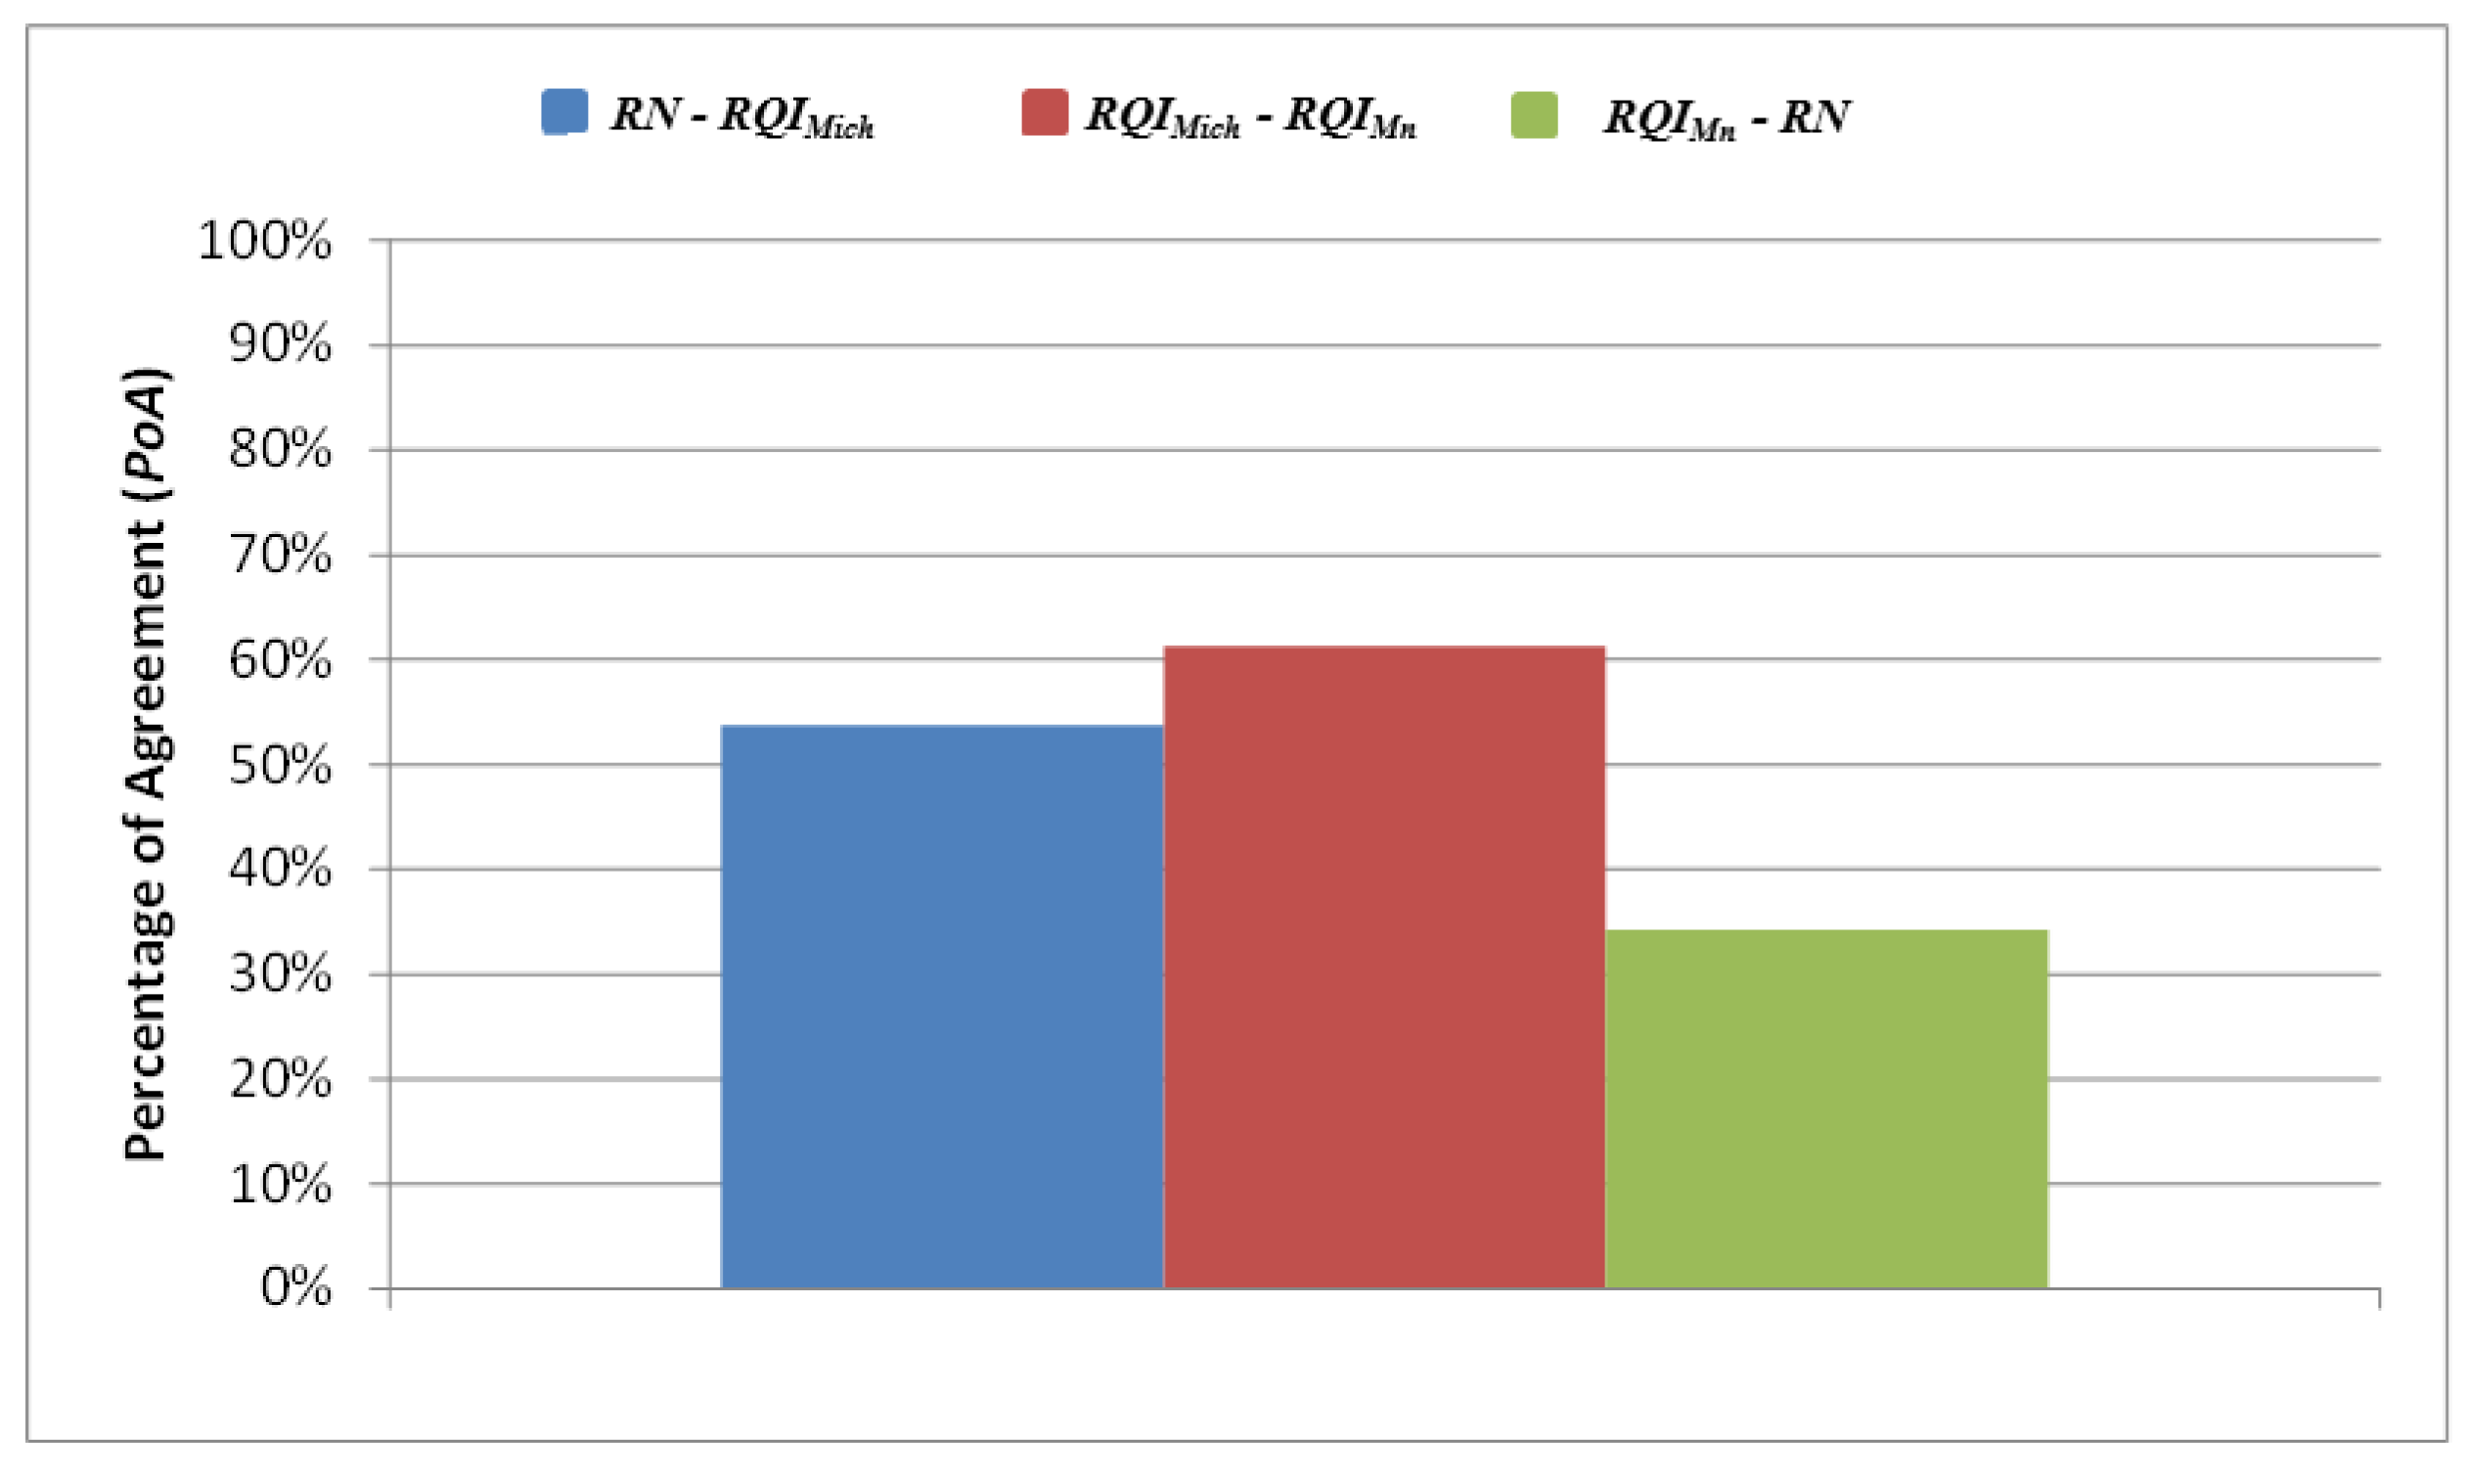
Counting the amount of profiles evaluated in the same way by the different indicators, a percentage of agreement (PoA, calculated according to Equation (7) for each pair of indices) greater than 60% was obtained just for RQIMich and RQIMn comparison (see Figure 6). The worst agreement, instead, was found between RN and RQIMn. This result could be expected by looking at Figure 3. In fact, both these indices have the same rating scale (from 0 to 5.0) and ride quality categories (see Table 4), but the linear regression equation found presents an intercept value equal to 0.38; which means that a switch between the rating scales of the two methods exists. In particular, the RQIMn provides a more severe evaluation of road profiles, as highlighted by the results shown in Figure 5.
As already stated in Section 2.4, the results obtained for RN, RQIMich and RQIMn were also compared with the vertical frequency-weighted acceleration awz calculated at several speeds (from 30 to 130 km/h). By analogy with the study of profile evaluation percentage agreement (PoA), calculated according to Equation (7), reported above, the same analysis was also carried out for the awz method, using the thresholds shown in Table 4, defined as the middle point of the overlapping zone provided by ISO 2631 for two adjacent comfort levels.
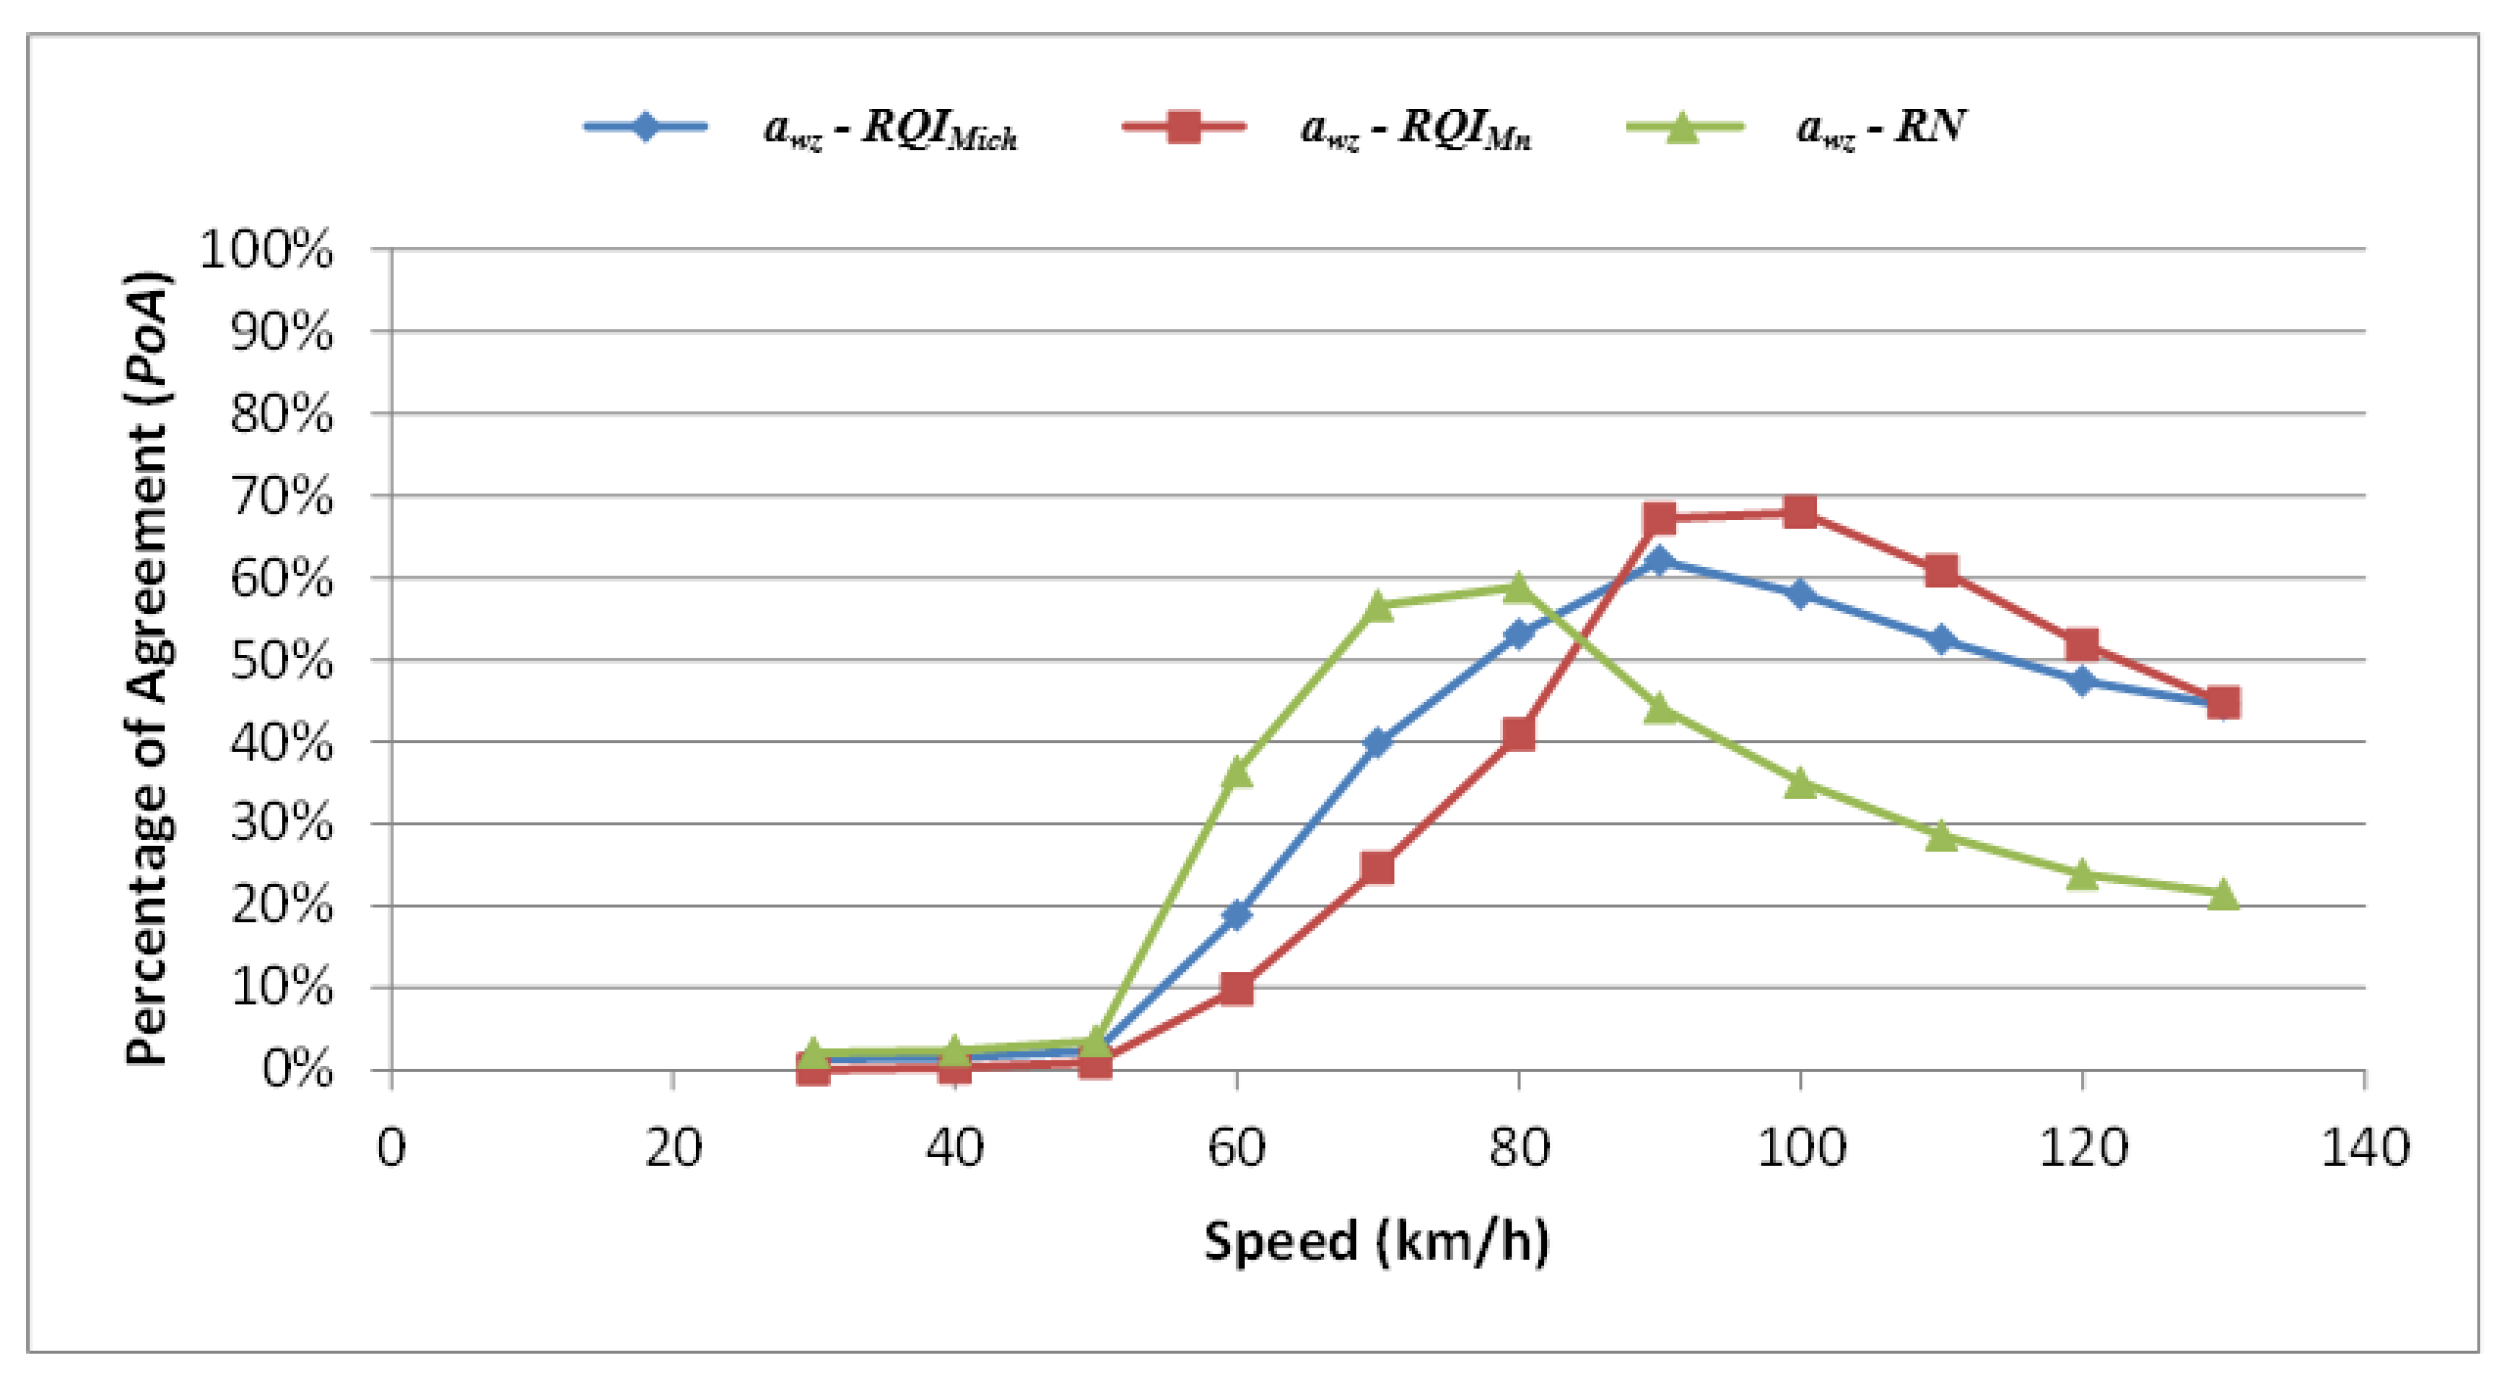
As can be seen in Figure 7, varying the traveling speed of the simulation vehicle, significant changes in the percentage agreement were found for all three methods with regards to awz index values.
The highest values of the percentage agreement between awz and each of the other three ride quality evaluation methods were found to be within the range 55%–70%. Although these results are not too high, due to the fact that the panel rating tests have been performed using different vehicles, general considerations can be deduced. The best percentage agreement for the three ride quality evaluation methods, in fact, was found to correspond to different velocities. In particular, for RN it was found for a vehicle traveling at 80 km/h, while for RQIMich at 90 km/h. For RQIMn, the greatest percentage was found for simulation speeds equal to 100 km/h. These results could be an explanation of the different correlations found between the three indices (RN, RQIMn and RQIMich), which were in all cases lower than 65%. In fact, the ride quality thresholds of the aforementioned methods seem to be calibrated for different speeds of reference. A confirmation of the goodness of the results obtained can be found in the algorithm for the calculation of the RN, where a parameter similar to the velocity used in IRI calculation is set at 80 km/h, which is the value of the speed found for the maximum percentage agreement.
Looking at Figure 7, it can be noted that none of the three consolidated indices (RN, RQIMich and RQIMn) seem to be adequate for evaluating users’ comfort on urban roads or, in general, on roads having maximum legal speed limits lower than 50 km/h.
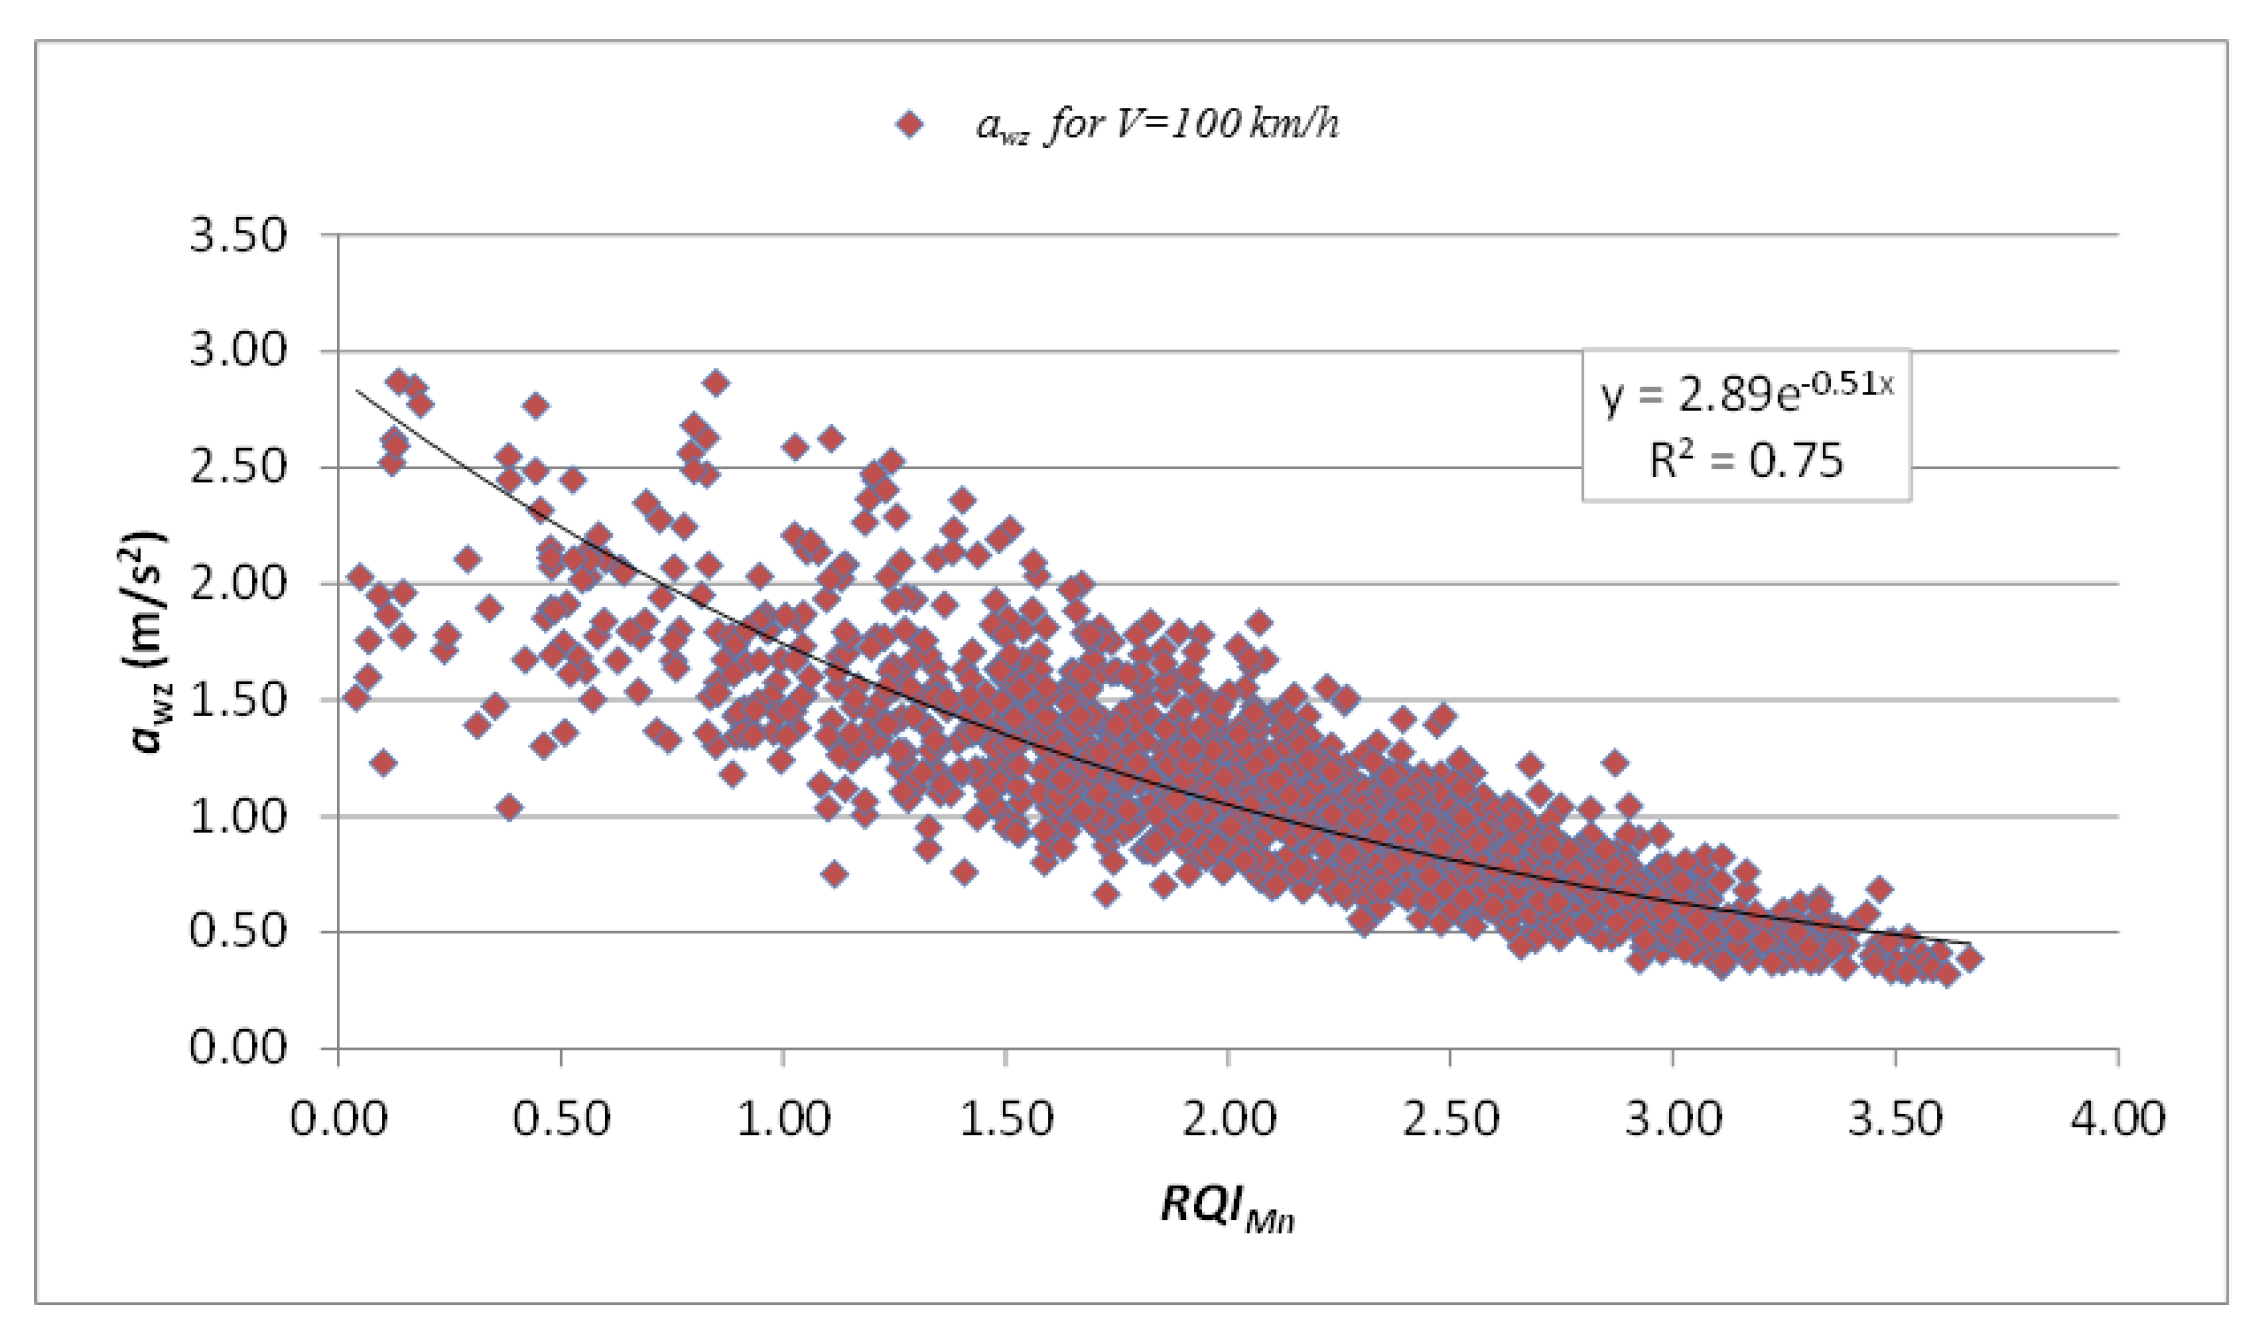
In addition to the profile evaluation agreement study, the correlations between the three consolidated ride quality evaluation methods and awz were investigated. The R2 values found in correspondence of the speeds at which the highest profile assessment agreements varies from 0.66 (RN-awz) to 0.75 (RQIMn-awz); as can be noted in Figure 8, Figure 9 and Figure 10.
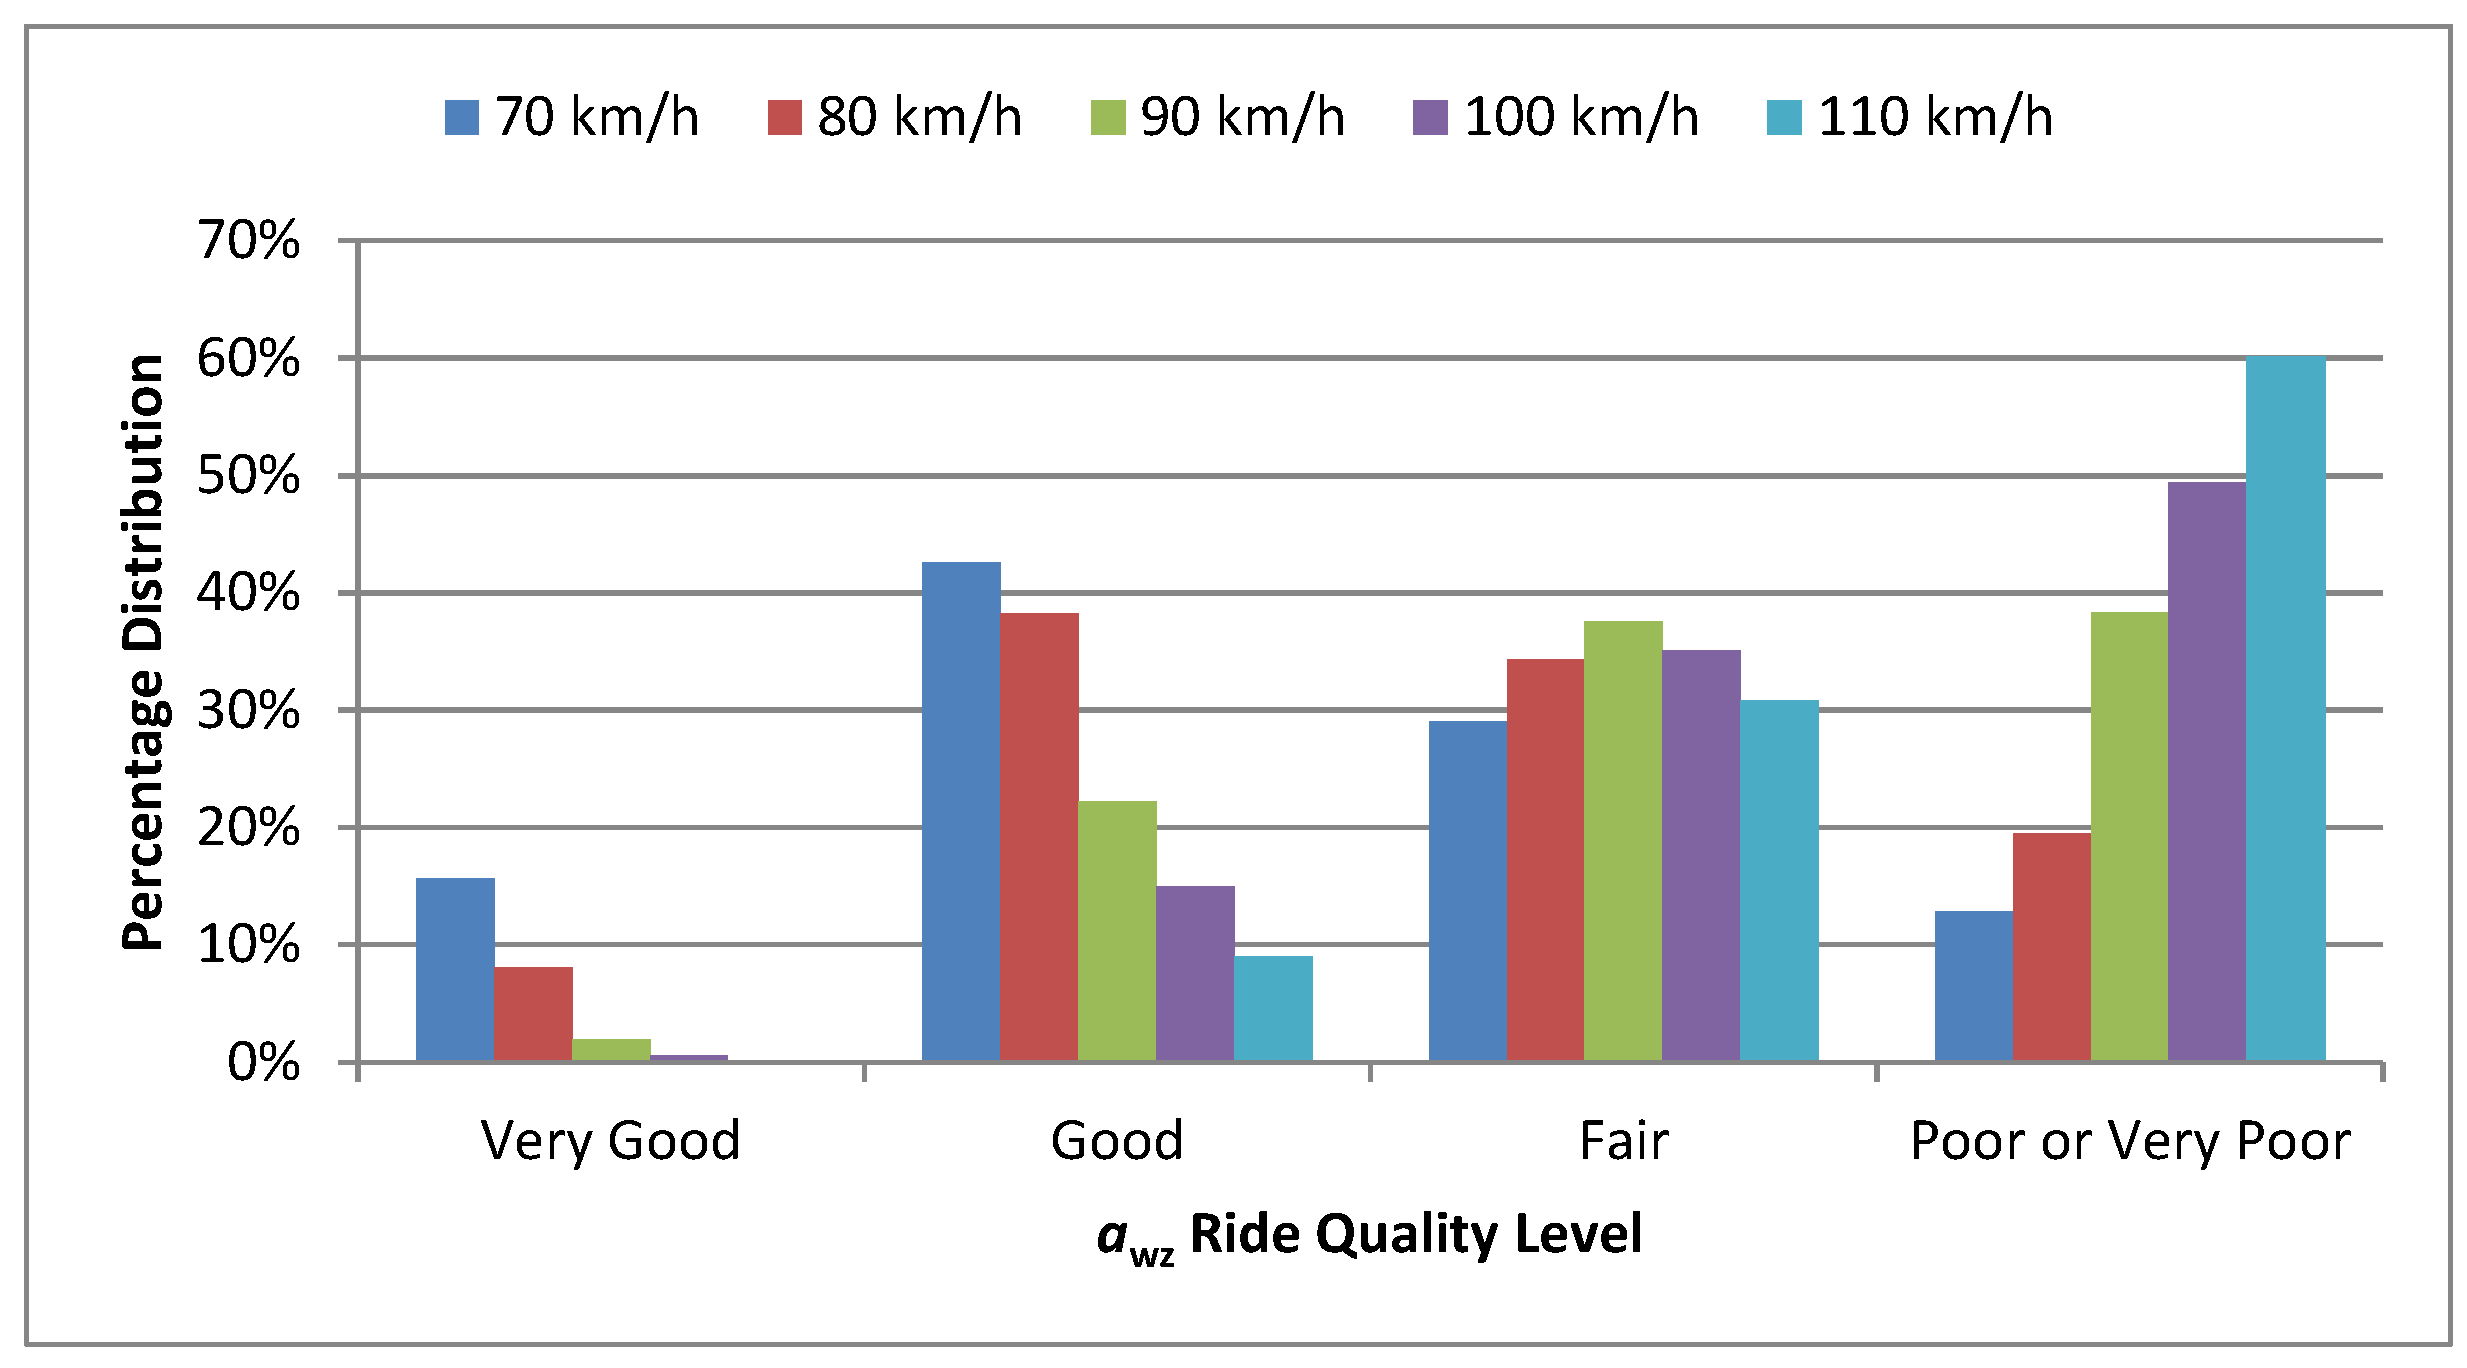
Unlike for the other methods, the use of the awz allows the taking into account of the different users’ perceptions of road conditions based on the traveling speed, as can be noted in Figure 11, where the distribution among the four ride quality levels of the real profiles set is reported for different velocities. To simplify the vision of the plot, not the whole range of speed considered (30–130 km/h), but just speeds within the range from 70 up to 110 km/h are represented. As can be seen, significant variation in ride quality judgement is obtained.
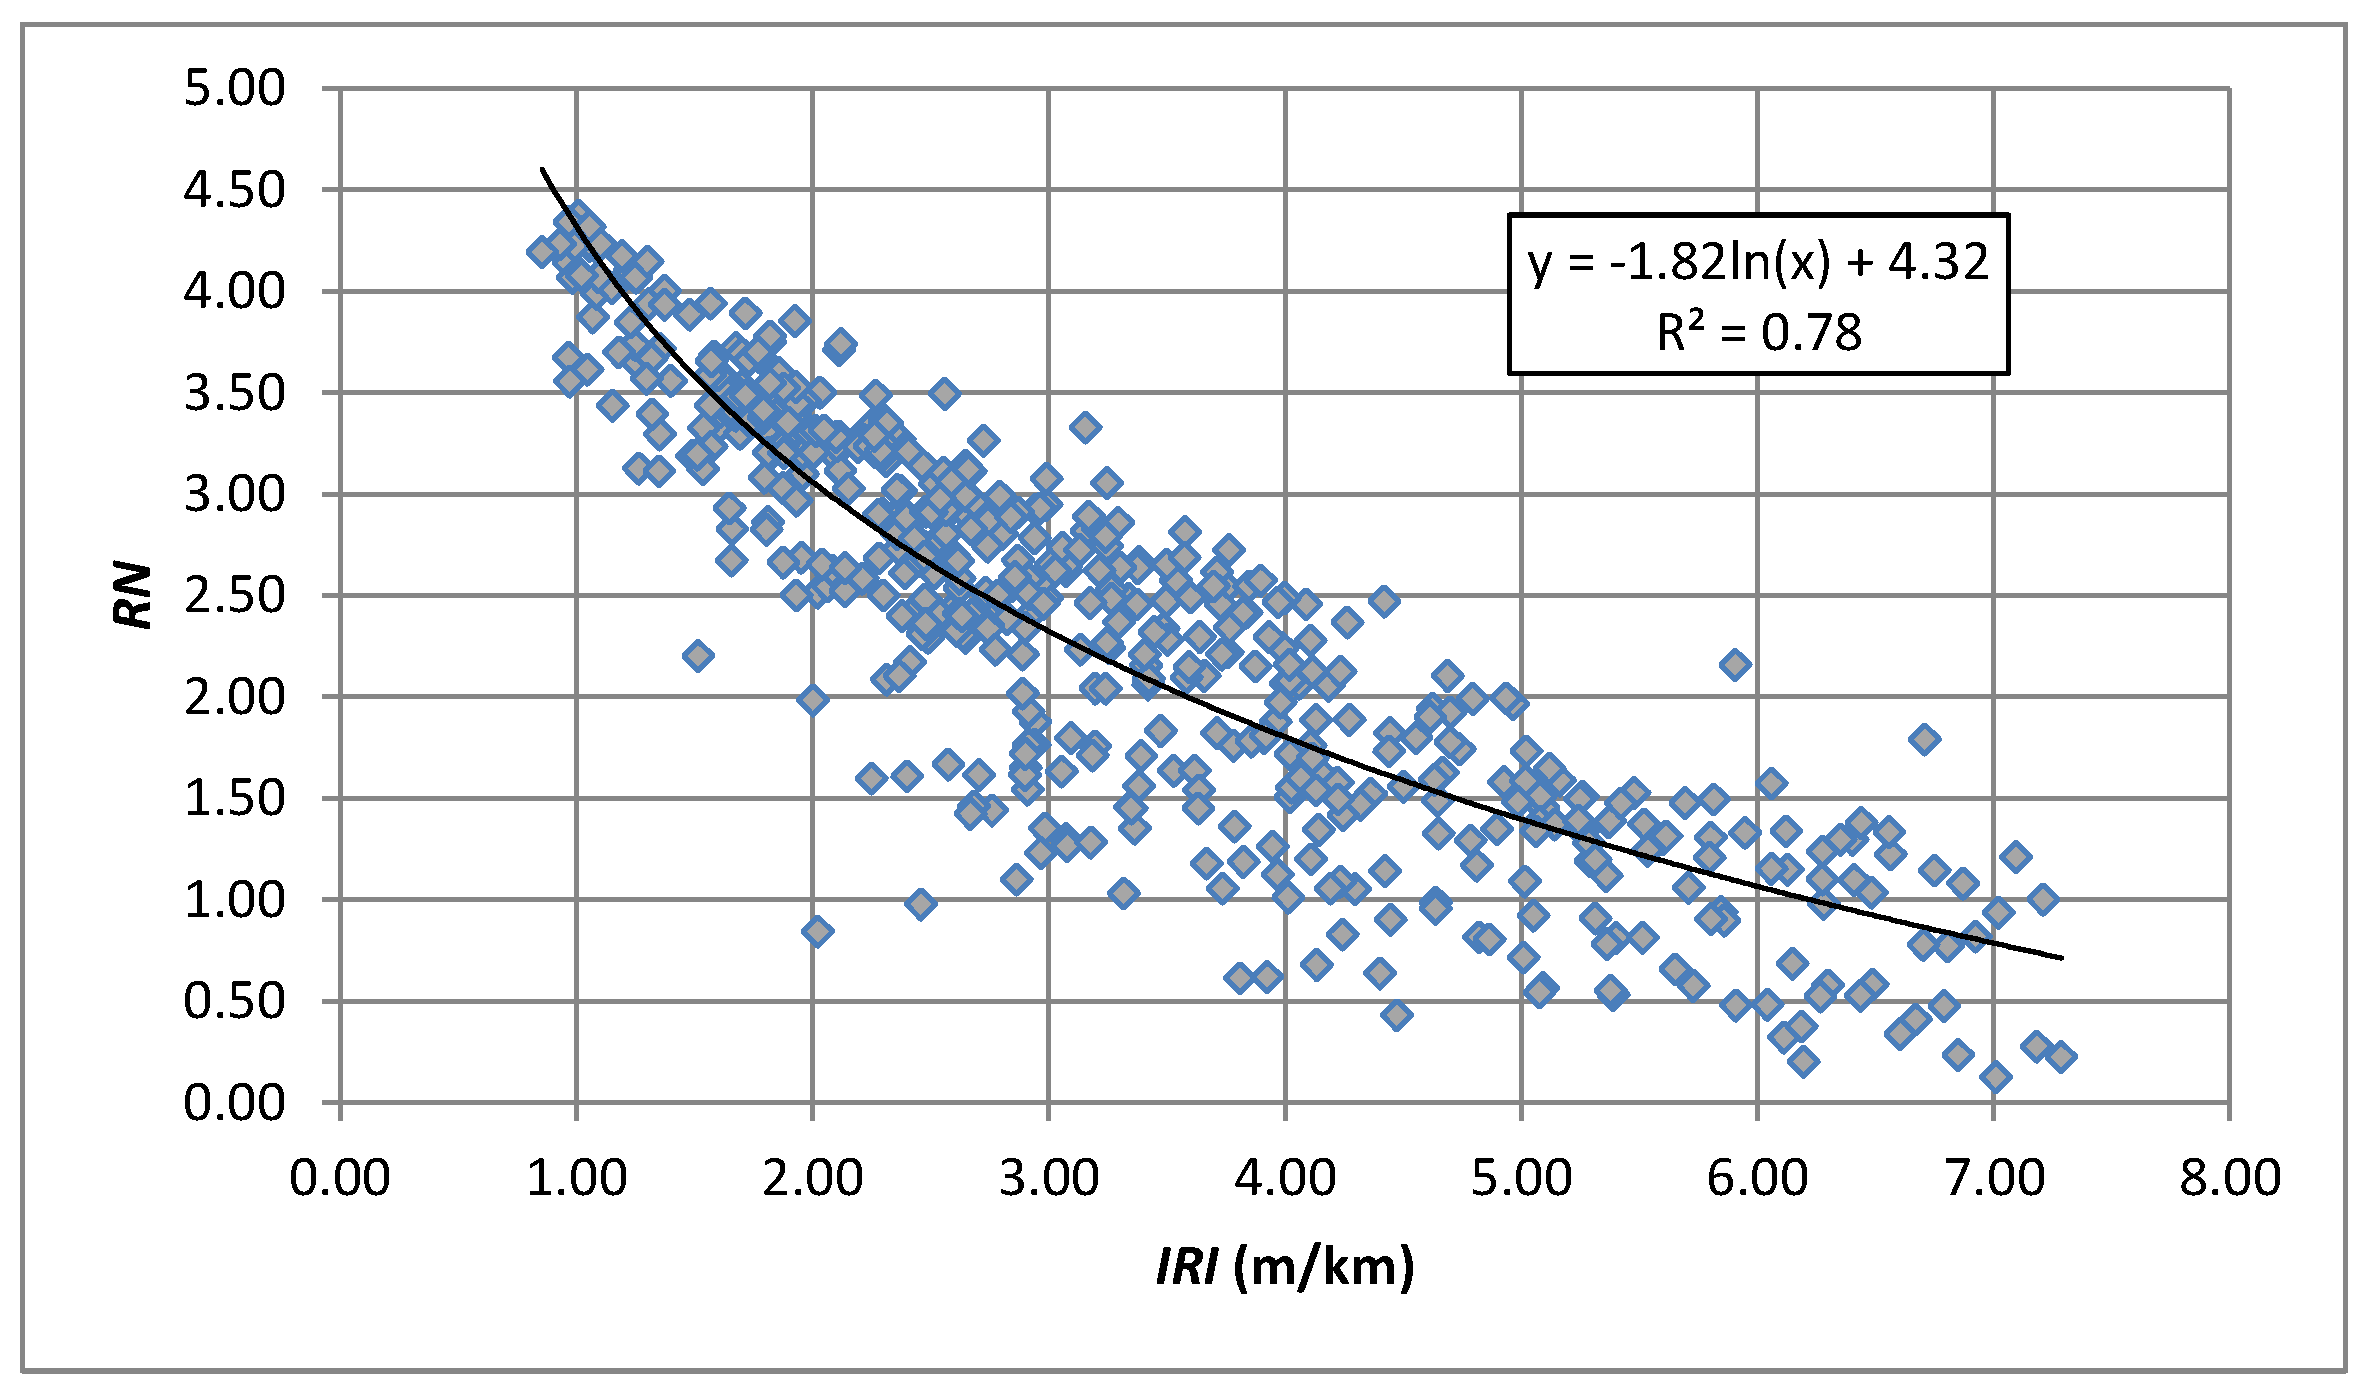
Evaluating the correlation between the various ride quality methods considered in this paper with IRI, R2 values of 0.78 and 0.85 were found respectively, for RN (Figure 12) and RQIMich (Figure 13).
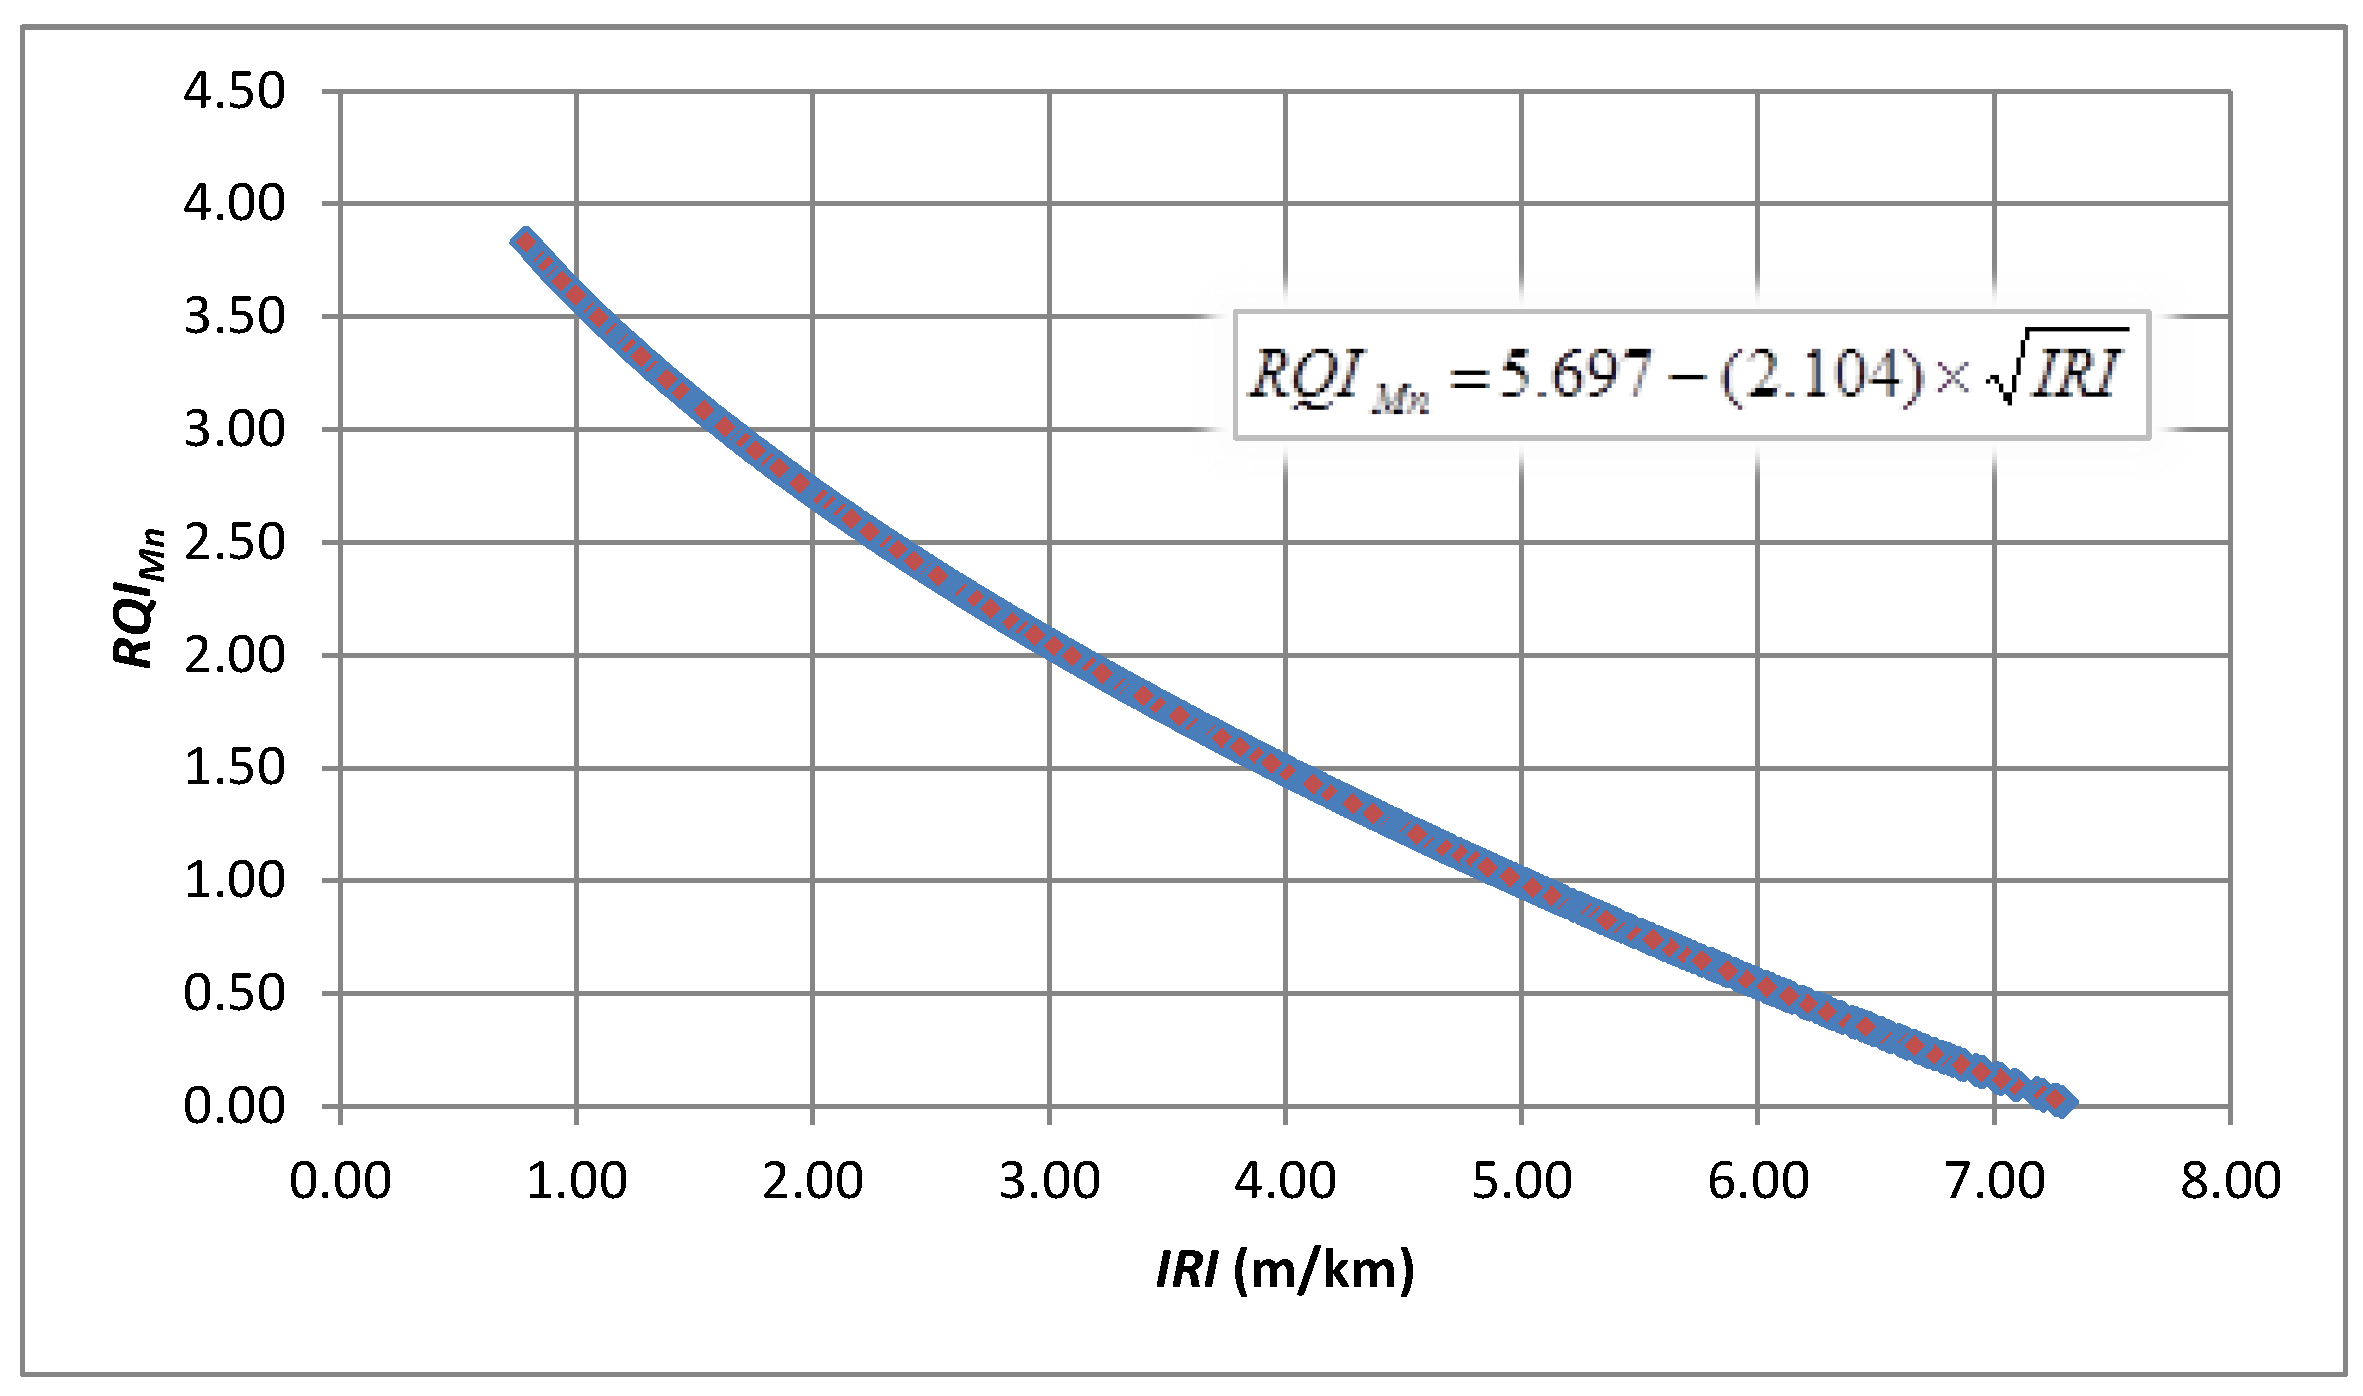
Obviously, a perfect correlation (R2 = 1) was found between RQIMn and IRI (Figure 14), since the calculation of the first one is based on IRI values using Equation (4) previously described.
Starting from the regression equation found for each ride quality evaluation index and the thresholds reported in Table 4 for the different ride quality levels (very good, good, mediocre and poor), it is possible to determine the corresponding IRI limit values. The results are then reported in Table 7.
As can be seen, looking at the thresholds related to the very good ride quality level the RQIMn was confirmed to be the more conservative approach, while the RN represents a less conservative approach. Although there is not perfect matching between the IRI thresholds calculated from each method and the limit values suggested by Yu et al. [35] and/or Cantisani and Loprencipe [18] corresponding to all ride quality levels, it is nevertheless possible to note that all aforementioned ride quality evaluation methods were mainly developed to be used on roads characterized by speed limits within the range from 80 to 120 km/h.
Considering, then, the IRI specifications suggested by the two aforementioned studies, already reported in Table 5 and Table 6, the percentage agreement in the evaluation of the examined real profile samples between IRI and awz approaches at various speeds was evaluated. As can be seen in Figure 15, in this case for all the considered velocities percentages greater than 50% were always found.
These results highlight the chance of using the awz approach for road ride quality evaluation for a wide range of traveling speeds as an alternative method to IRI, mainly for velocities lower than 50 km/h, where the percentage agreement is greater than 80%. Of course, the proposed approach will need calibration and validation phases in order to be correctly used; in fact, the awz is strongly affected by the type of vehicle considered for the measurement.
In addition, Kirbaş and Karaşahin [36] found a good correlation between awz and Pavement Condition Index (PCI). Therefore, using the awz approach at a preliminary step in order to locate priorities along road networks seems to be possible, although some distresses (e.g., crack distress) do not meaningfully affect this index. Once critical sections have been located, it would be then possible to plan adequate inspections and surveys in order to understand the causes of the distresses, and then select the most appropriate maintenance actions.
All of the analyses related to the IRI method have also underlined the need to homogenize its threshold values by defining appropriate speed-related limits to be adopted by road agencies.
5. Conclusions

In this paper, the analysis of a set of real road profiles was carried out according to different ride quality evaluation methods, comparing then the assessment provided by each of them.
In particular, the agreement in the assessment of road profiles and their correlation was investigated. The main results can be summarized as follows:
  • Although pretty good correlations (R2 = 0.78–0.95) exist between the three consolidated ride quality evaluation methods (RN, RQIMich and RQIMn) taken into account in the present work, the assessment of the same examined road profile can significantly differ according to the approach used. In this sense, the need to standardize MPR in order to obtain homogeneity in ride quality evaluation is clear.
  • The RQIMn was found to be the most conservative indicator; in fact, its scale rating seems to be calibrated for a speed greater than 80 km/h (around 100 km/h), as shown by the results obtained using a simulation model representative of the behavior of a typical passenger car. Similar results were found evaluating the relations and correlations between RN, RQIMich and RQIMn with IRI (R2 respectively equal to 0.78, 0.85 and 1). Using the regression equations found IRI thresholds corresponding to each ride quality index limit values were calculated. This analysis confirmed that the RQIMn is the most conservative approach among the three ride quality assessment methods. It is also important to highlight that the RQIMn calculation is based on IRI values, which is the most-used road roughness index worldwide.
  • None of the consolidated methods (RN, RQIMich and RQIMn) present thresholds appropriate for use on urban roads that have legal speed limits lower than 50 km/h. By contrast, some IRI specifications intended for use on urban roads have been adopted in some countries and more specific speed-related threshold values have been suggested in literature. Although much attention is paid to this aspect of the use of IRI for road roughness evaluation, there is still the need to homogenize the criteria and the values to be adopted for the various road categories.
Considering the last point, the use of the awz method seems to be a promising and valid alternative for the evaluation of ride quality, with particular attention to urban road networks, where the use of the common profilometers (both contact and no-contact types) presents some application limits. Furthermore, it is a speed-related approach, which means that road sections having different legal speed limits can be properly assessed. However, deeper studies on the influence of different types of road vehicle and of irregularities at different velocities should be carried out, together with panel rating tests, in order to define appropriate awz thresholds to be used for ride quality evaluation.

Author Contributions

Giuseppe Loprencipe and Pablo Zoccali carried out the data and results analyses of the work. Pablo Zoccali wrote the manuscript and was in charge of the overall outline and editing of the manuscript. He was involved in the revision and completion of the work. Giuseppe Loprencipe contributed to the outline as well as to the revision, completion, and editing of the manuscript.

Conflicts of Interest

The authors declare no conflict of interest.

Abbreviations

The following abbreviations are used in this manuscript:
awzFrequency-weighted vertical acceleration
IRIInternational Roughness Index
LTPPLong-Term Pavement Performance
MPRMean Panel Rating
PCIPavement Condition Index
PIProfile Index
PoAPercentage of Agreement
PMSPavement Management System
PSDPower Spectral Density
RMSRoot Mean Square
RNRide Number
RQIRide Quality Index
RQIMichMichigan Ride Quality Index
RQIMnMinnesota Ride Quality Index
SHRPStrategic Highway Research Program

References

  1. Loprencipe, G.; Cantisani, G.; di Mascio, P. Global assessment method of road distresses. In Life-Cycle of Structural Systems: Design, Assessment, Maintenance and Management—Proceedings of the 4th International Symposium on Life-Cycle Civil. Engineering, Proceedings of the International Association For Life-cycle Civil Engineering 2014, Tokyo, Japan, 16 November 2014; CRC Press/Balkema: Leiden, The Netherlands, 2015; Available online: https://www.crcpress.com/Life-Cycle-of-Structural-Systems-Design-Assessment-Maintenance-and-Management/Furuta-Frangopol-Akiyama/p/book/9781138001206 (accessed on 28 February 2017).
  2. Sayers, M.W.; Karamihas, S.M. The Little Book of Profiling; The Regent of the University of Michigan: Ann Arbor, MI, USA, 1998; Volume 2. [Google Scholar]
  3. Bonin, G.; Folino, N.; Loprencipe, G.; Oliverio, R.C.; Polizzotti, S.; Teltayev, B. Development of a Road Asset Management System in Kazakhstan. In Proceedings of the TIS 2017 International Congress on Transport—Infrastructure and Systems, Rome, Italy, 10–12 April 2017; Available online: https://www.crcpress.com/Transport-Infrastructure-and-Systems-Proceedings-of-the-AIIT-International/DellAcqua-Wegman/p/book/9781138030091 (accessed on 28 February 2017).
  4. Han, D.; Kobayashi, K. Criteria for the development and improvement of PMS models. KSCE J. Civ. Eng. 2013, 17, 1302–1316. [Google Scholar] [CrossRef]
  5. Shahin, M.Y. Pavement Management for Airports, Roads, and Parking Lots, 2nd ed.; Springer: New York, NY, USA, 2005. [Google Scholar]
  6. Loprencipe, G.; Pantuso, A.; di Mascio, P. Sustainable Pavement Management System in Urban Areas Considering the Vehicle Operating Costs. Sustainability 2017, 9, 453. [Google Scholar] [CrossRef]
  7. Chatti, K.; Lee, D. Development of new profile-based truck dynamic load index. Transp. Res. Rec. J. Transp. Res. Board 2002, 1806, 149–159. [Google Scholar] [CrossRef]
  8. Ahlin, K.; Granlund, J.; Lundström, R. Whole-Body Vibration When Riding on Rough Roads—A shocking Study. Swed. Natl. Road Adm. 2000, 31, 81. [Google Scholar]
  9. Cantisani, G.; Fascinelli, G.; Loprencipe, G. Urban road noise: The contribution of pavement discontinuities. In ICSDEC 2012: Developing the Frontier of Sustainable Design, Engineering, and Construction, Proceedings of the International Conference on Sustainable Design, Engineering, and Construction 2012, Fort Worth, TX, USA, 7–9 November 2012; Elsevier: Amsterdam, The Netherlands, 2012. [Google Scholar] [CrossRef]
  10. Gillespie, T.D. Everything You Always Wanted to Know about the IRI, but Were Afraid to Ask. Proceedings of Road Profile Users Group Meeting, Lincoln, NE, USA, 22–24 September 1992. [Google Scholar]
  11. Kropáč, O.; Múčka, P. Be careful when using the International Roughness Index as an indicator of road unevenness. J. Sound Vib. 2005, 287, 989–1003. [Google Scholar] [CrossRef]
  12. Loizos, A.; Plati, C. An alternative approach to pavement roughness evaluation. Int. J. Pavement Eng. 2008, 9, 69–78. [Google Scholar] [CrossRef]
  13. Múčka, P.; Granlund, J. Is the road quality still better? J. Transp. Eng. 2012, 138, 1520–1529. [Google Scholar] [CrossRef]
  14. Múčka, P. Current approaches to quantify the longitudinal road roughness. Int. J. Pavement Eng. 2016, 17, 659–679. [Google Scholar] [CrossRef]
  15. Kropáč, O.; Múčka, P. Effects of longitudinal road waviness on vehicle vibration response. Veh. Syst. Dyn. 2009, 47, 135–153. [Google Scholar] [CrossRef]
  16. Ahlin, K.; Granlund, N.O.J. Relating Road Roughness and Vehicle Speeds to Human Whole Body Vibration and Exposure Limits. Int. J. Pavement Eng. 2002, 3, 207–216. [Google Scholar] [CrossRef]
  17. Múčka, P. Correlation among road unevenness indicators and vehicle vibration response. Int. J. Pavement Eng. 2013, 139, 771–786. [Google Scholar] [CrossRef]
  18. Cantisani, G.; Loprencipe, G. Road roughness and whole body vibration: Evaluation tools and comfort limits. J. Transp. Eng. 2010, 136, 818–826. [Google Scholar] [CrossRef]
  19. ISO 2631-1:1997—Mechanical Vibration and Shock—Evaluation of Human Exposure to Whole-Body Vibration—Part 1: General Requirements; ISO: Geneve, Switzerland, 1997; Multiple, Distributed through American National Standards Institute (ANSI).
  20. Fichera, G.; Scionti, M.; Garescì, F. Experimental correlation between the road roughness and the comfort perceived in bus cabins. SAE Tech. Pap. 2007, 1, 0352. [Google Scholar] [CrossRef]
  21. Wang, S.; Zhang, J.; Yang, Z. Experiment on Asphalt Pavement Roughness Evaluation Based on Passengers’ Physiological and Psychological Reaction. In ICCTP 2010: Integrated Transportation Systems: Green, Intelligent, Reliable, Proceedings of the 10th International Conference of Chinese Transportation Professionals, Beijing, China, 4–8 August 2010; Wei, H., Wang, Y., Rong, J., Weng, J. Eds.; American Society of Civil Engineers: Reston, VA, USA, 2010; pp. 3852–3863. [Google Scholar]
  22. Zhang, J.; Du, Y.; Su, R. Investigating the relationship between pavement roughness and heart rate variability by road driving test. In Proceedings of the 3rd International Conference on Road Safety and Simulation, Washington, DC, USA, 14–16 September 2011. [Google Scholar]
  23. Titi, H.H.; Rasoulian, M. Evaluation of Smoothness of Louisiana Pavements Based on International Roughness Index and Ride Number. Jordan J. Civ. Eng. 2008, 2, 238–249. [Google Scholar]
  24. Lee, D.; Chatti, K.; Baladi, G. Use of Distress and Ride Quality Data to Determine Roughness Thresholds for Smoothing Pavements as a Preventive Maintenance Action. Transp. Res. Rec. J. Transp. Res. Board 2002, 1816, 43–55. [Google Scholar] [CrossRef]
  25. Múčka, P. International Roughness Index specifications around the world. Road Mat. Pavement Des. 2017, 18, 929–965. [Google Scholar] [CrossRef]
  26. American Society of Testing and Materials. Standard Practice for Computing Ride Number of Roads from Longitudinal Profile Measurements Made by an Inertial Profile Measuring Device; ASTM E1489-98 International: West Conshohocken, PA, USA, 2013. [Google Scholar]
  27. Karamihas, S.M.; Sayers, M.W. Interpretation of Road Roughness Profile Data; FHWA/RD-96/101; Federal Highway Administration: McLean, VA, USA, 1996. [Google Scholar]
  28. Karamihas, S.M. Critical Profiler Accuracy Requirements; UMTRI 2005-24; University of Michigan: Ann Arbor, MI, USA, 2005. [Google Scholar]
  29. 2015 Pavement Condition Annual Report. Minnesota Department of Transportation. Available online: http://www.dot.state.mn.us/materials/pvmtmgmtdocs/AnnualReport_2015.pdf (accessed on 28 February 2017).
  30. Sayers, M.W. On the calculation of international roughness index from longitudinal road profile. Transp. Res. Rec. 1995, 1501, 1–12. [Google Scholar]
  31. American Society of Testing and Materials. Standard Practice for Computing International Roughness Index of Roads from Longitudinal Profile Measurements; ASTM E1926:08 International: West Conshohocken, PA, USA, 2015. [Google Scholar]
  32. Janisch, D. An Overview of Mn/DOT’s Pavement Condition Rating Procedures and Indices. Available online: http://www.dot.state.mn.us/materials/pvmtmgmtdocs/Rating_Overview_State.pdf (accessed on 28 February 2017).
  33. ISO 8608:1995—Mechanical Vibration—Road Surface Profiles—Reporting of Measured Data; ISO: Geneve, Switzerland, 1995; Multiple, Distributed through American National Standards Institute (ANSI).
  34. Loprencipe, G.; Zoccali, P. Use of generated artificial road profiles in road roughness evaluation. J. Mod. Transp. 2017, 25, 23–34. [Google Scholar] [CrossRef]
  35. Yu, J.; Chou, E.; Yau, J.T. Development of speed-related ride quality thresholds using international roughness index. Transp. Res. Rec. J. Transp. Res. Board. 2006, 1, 47–53. [Google Scholar] [CrossRef]
  36. Kirbaş, U.; Karaşahin, M. Investigation of ride comfort limits on urban asphalt concrete pavements. Int. J. Pavement Eng. 2016, 1–7. [Google Scholar] [CrossRef]
Figure 1. Ratio between IRI thresholds at different speeds provided by various studies.
Coatings 07 00059 g001
Figure 2. Correlation between RQIMich and RN.
Coatings 07 00059 g002
Figure 3. Correlation between RQIMn and RN.
Coatings 07 00059 g003
Figure 4. Correlation between RQIMich and RQIMn.
Coatings 07 00059 g004
Figure 5. Ride Quality Level Percentage Distribution for the real profiles samples.
Coatings 07 00059 g005
Figure 6. Percentage of agreement (PoA) between the three ride comfort evaluation methods.
Coatings 07 00059 g006
Figure 7. Percentage of agreement (PoA) between RN, RQIMich and RQIMn with ISO 2631 awz.
Coatings 07 00059 g007
Figure 8. Correlation between RQIMich and awz at 90 km/h.
Coatings 07 00059 g008
Figure 9. Correlation between RQIMn and awz at 100 km/h.
Coatings 07 00059 g009
Figure 10. Correlation between RN and awz at 80 km/h.
Coatings 07 00059 g010
Figure 11. Ride quality level percentage distribution for the real profile samples calculating the awz at different speeds.
Coatings 07 00059 g011
Figure 12. Correlation between RN and IRI.
Coatings 07 00059 g012
Figure 13. Correlation between RQIMich and IRI.
Coatings 07 00059 g013
Figure 14. Correlation between RQIMn and IRI.
Coatings 07 00059 g014
Figure 15. Percentage agreement between IRI thresholds suggested by Yu et al. [35] and Cantisani and Loprencipe [18] with ISO 2631 awz.
Coatings 07 00059 g015
Table 1. Minnesota RQI categories and ranges.
Numerical RatingVerbal Rating
4.1–5.0Very Good
3.1–4.0Good
2.1–3.0Fair
1.1–2.0Poor
0.0–1.0Very Poor
Table 2. Comfort levels related to awz threshold values as proposed by ISO 2631 for public transport.
awz Values (m/s2)Comfort Level
<0.315Not uncomfortable
0.315–0.63Little uncomfortable
0.5–1Fairly uncomfortable
0.8–1.6Uncomfortable
1.25–2.5Very uncomfortable
>2.5Extremely uncomfortable
Table 3. Percentage of real profiles belonging to a specific ISO 8608 class.
Class A (Very Good) (%)Class B (Good) (%)Class C (Average) (%)Class D (Poor) (%)
18.157.922.61.4
Table 4. Ride quality thresholds considered for evaluation agreement analysis.
Ride Quality LevelRNRQIMichRQIMnawz (m/s2)
Very Good4.1–5.00–304.1–5.0<0.315
Good/Fair3.1–4.031–543.1–4.00.315–0.565
Mediocre2.1–3.055–702.1–3.00.565–0.9
Poor and Very Poor0.0–2.0>700.0–2.0>0.9
Table 5. IRI thresholds at different speeds suggested by Yu et al. [35].
Ride Quality LevelIRI Thresholds at Different Speeds (m/km)
20 km/h40 km/h60 km/h80 km/h100 km/h120 km/h
Very Good<5.72<2.86<1.90<1.43<1.14<0.95
Good5.72–8.992.86–4.491.90–2.991.43–2.241.14–1.790.95–1.49
Fair9.00–11.394.50–5.693.00–3.792.25–2.841.80–2.271.50–1.89
Mediocre11.40–16.165.70–8.083.80–5.402.85–4.052.28–3.241.90–2.70
Poor>16.16>8.08>5.40>4.05>3.24>2.70
Table 6. IRI thresholds at different speeds suggested by Cantisani and Loprencipe [18].
Ride Quality LevelIRI Thresholds at Different Speeds (m/km)
30 km/h40 km/h50 km/h60 km/h70 km/h80 km/h90 km/h
Very Good<4.17<3.41<2.98<1.87<1.60<1.42<1.15
Good/Fair4.17–8.343.41–6.832.98–5.951.87–3.731.60–3.201.42–2.841.15–2.31
Mediocre8.34–11.926.83–9.755.95–8.513.73–5.333.20–4.582.84–4.062.31–3.30
Poor>11.92>9.75>8.51>5.33>4.58>4.06>3.30
Table 7. IRI thresholds based on the different ride quality indices limit values in (m/km).
Ride Quality LevelIRI (RN)IRI (RQIMich)IRI (RQIMn)
Very Good<1.13<1.10<0.58
Good/Fair1.13–1.951.10–1.970.58–1.92
Mediocre1.95–3.391.97–2.901.92–2.92
Poor and Very Poor>3.39>2.90>2.92