1. Introduction
Layered cement composites, recently an issue attracting numerous researchers [
1,
2,
3,
4], usually consist of an overlay placed on an existing concrete substrate. It is always necessary to ensure an appropriate bond between the overlay and existing concrete substrate. The measure of this bond is the value of the pull-off adhesion (
fb), obtained using the pull-off method [
5]. This method is time consuming due to the delay time of the curing of the resin used for bonding the steel disc. Moreover, results can be influenced by variation on the rupture surface, the orientation and position of the aggregate onto the disc, the disc material, diameter, and thickness, the backpressure system, and also the speed of load application [
6,
7,
8]. The tested surface in each of the measuring places is damaged and the efficiency of this method depends on the number of measuring places. The damage has to be repaired after the test. When considering the above, it is advisable to use non-destructive testing (NDT) methods for the purpose of the assessment of the interlayer bond. It has been verified in practice that the impact-echo (I-E) and impulse response (IR) methods may be used individually to make a successful zero-one assessment [
9,
10]. However, it is not possible to individually use the above-mentioned NDT methods to make a full, reliable assessment of the value of
fb [
11,
12,
13]. In such a case it is helpful to use artificial neural networks (ANNs) which, in recent years, are increasingly used in civil engineering [
14,
15,
16,
17,
18,
19,
20,
21,
22,
23].
A new method of identifying
fb by means of the ANN method has recently been proposed [
24,
25,
26,
27,
28,
29]. The database for this identification was created using 3D morphological parameters, which were evaluated on the existing concrete substrate surface using 3D LASER scanning, and also acoustic parameters obtained with the use of the IR and I-E methods on the surface of the overlay. Various methods have been used, such as radial basis functions (RBF) [
24], multi-layer perceptron (MLP) [
25,
26,
27], and principal component analysis (PCA), in combination with self-organizing feature maps (SOFM) [
28].
It is evident that there is no possibility in existing layered cement composites of obtaining 3D morphological parameters of the existing concrete substrate surface. Consequently, it is not possible to adopt the previously-developed method to identify the value of
fb in existing cement composites. Thus, the attempt presented in [
29] proved that it is possible to identify the value of
fb between the overlay and existing concrete substrate in existing cement composites on the basis of the acoustic parameters obtained on the overlay surface using the ANN, IR, and I-E methods. The multi-layer perceptron ANN with the gradient descent (MLP-GS) learning algorithm has been found to be useful for this purpose. However, values of determination coefficient
R2 greater than 0.77 were not satisfied. Simple back-propagation (BP) has also been used for optimizing the ANN, which is plagued with inconsistent and unpredictable performances, a slow learning rate, and becoming trapped in local minima [
30,
31]. Thus, in some applications it is necessary to improve the performance of the ANN with the use of optimization algorithms. The imperialist competitive algorithms (ICA), the genetic algorithm (GA), or particle swarm optimization (PSO) have recently been used for this purpose [
32].
The recently developed ICA is a randomized population method inspired by the human political-social evolution [
33,
34,
35,
36,
37]. It belongs to the metaheuristic group of methods that are expected to become more popular in various engineering applications [
38,
39,
40,
41,
42,
43,
44]. In the ICA, a number of colonial countries, along with their colonies, try to find a general optimal point in solving the optimization problem. Different methods are then introduced to solve the optimization problems [
45,
46]. It is worth noting that there have recently been a few attempts to apply the ICA for engineering problems [
47,
48,
49], e.g., the prediction of soil compaction [
50], oil flow rate [
51], optimum cost [
52] or corrosion current density [
53].
With consideration of the above, the article presents the hybrid metaheuristic-neural assessment of the value of the fb in existing cement composites using the ICA. This method is based solely on the use of ANNs and two NDT methods: I-E and IR. In this research, the ANN was used for prediction and the ICA was used to improve the performance of the ANN. The role of the ICA was to optimize the weights of the ANN. The combined ICA-ANN model has been compared to the GA and PSO in order to evaluate its accuracy.
2. Experimental Setup
As mentioned previously in [
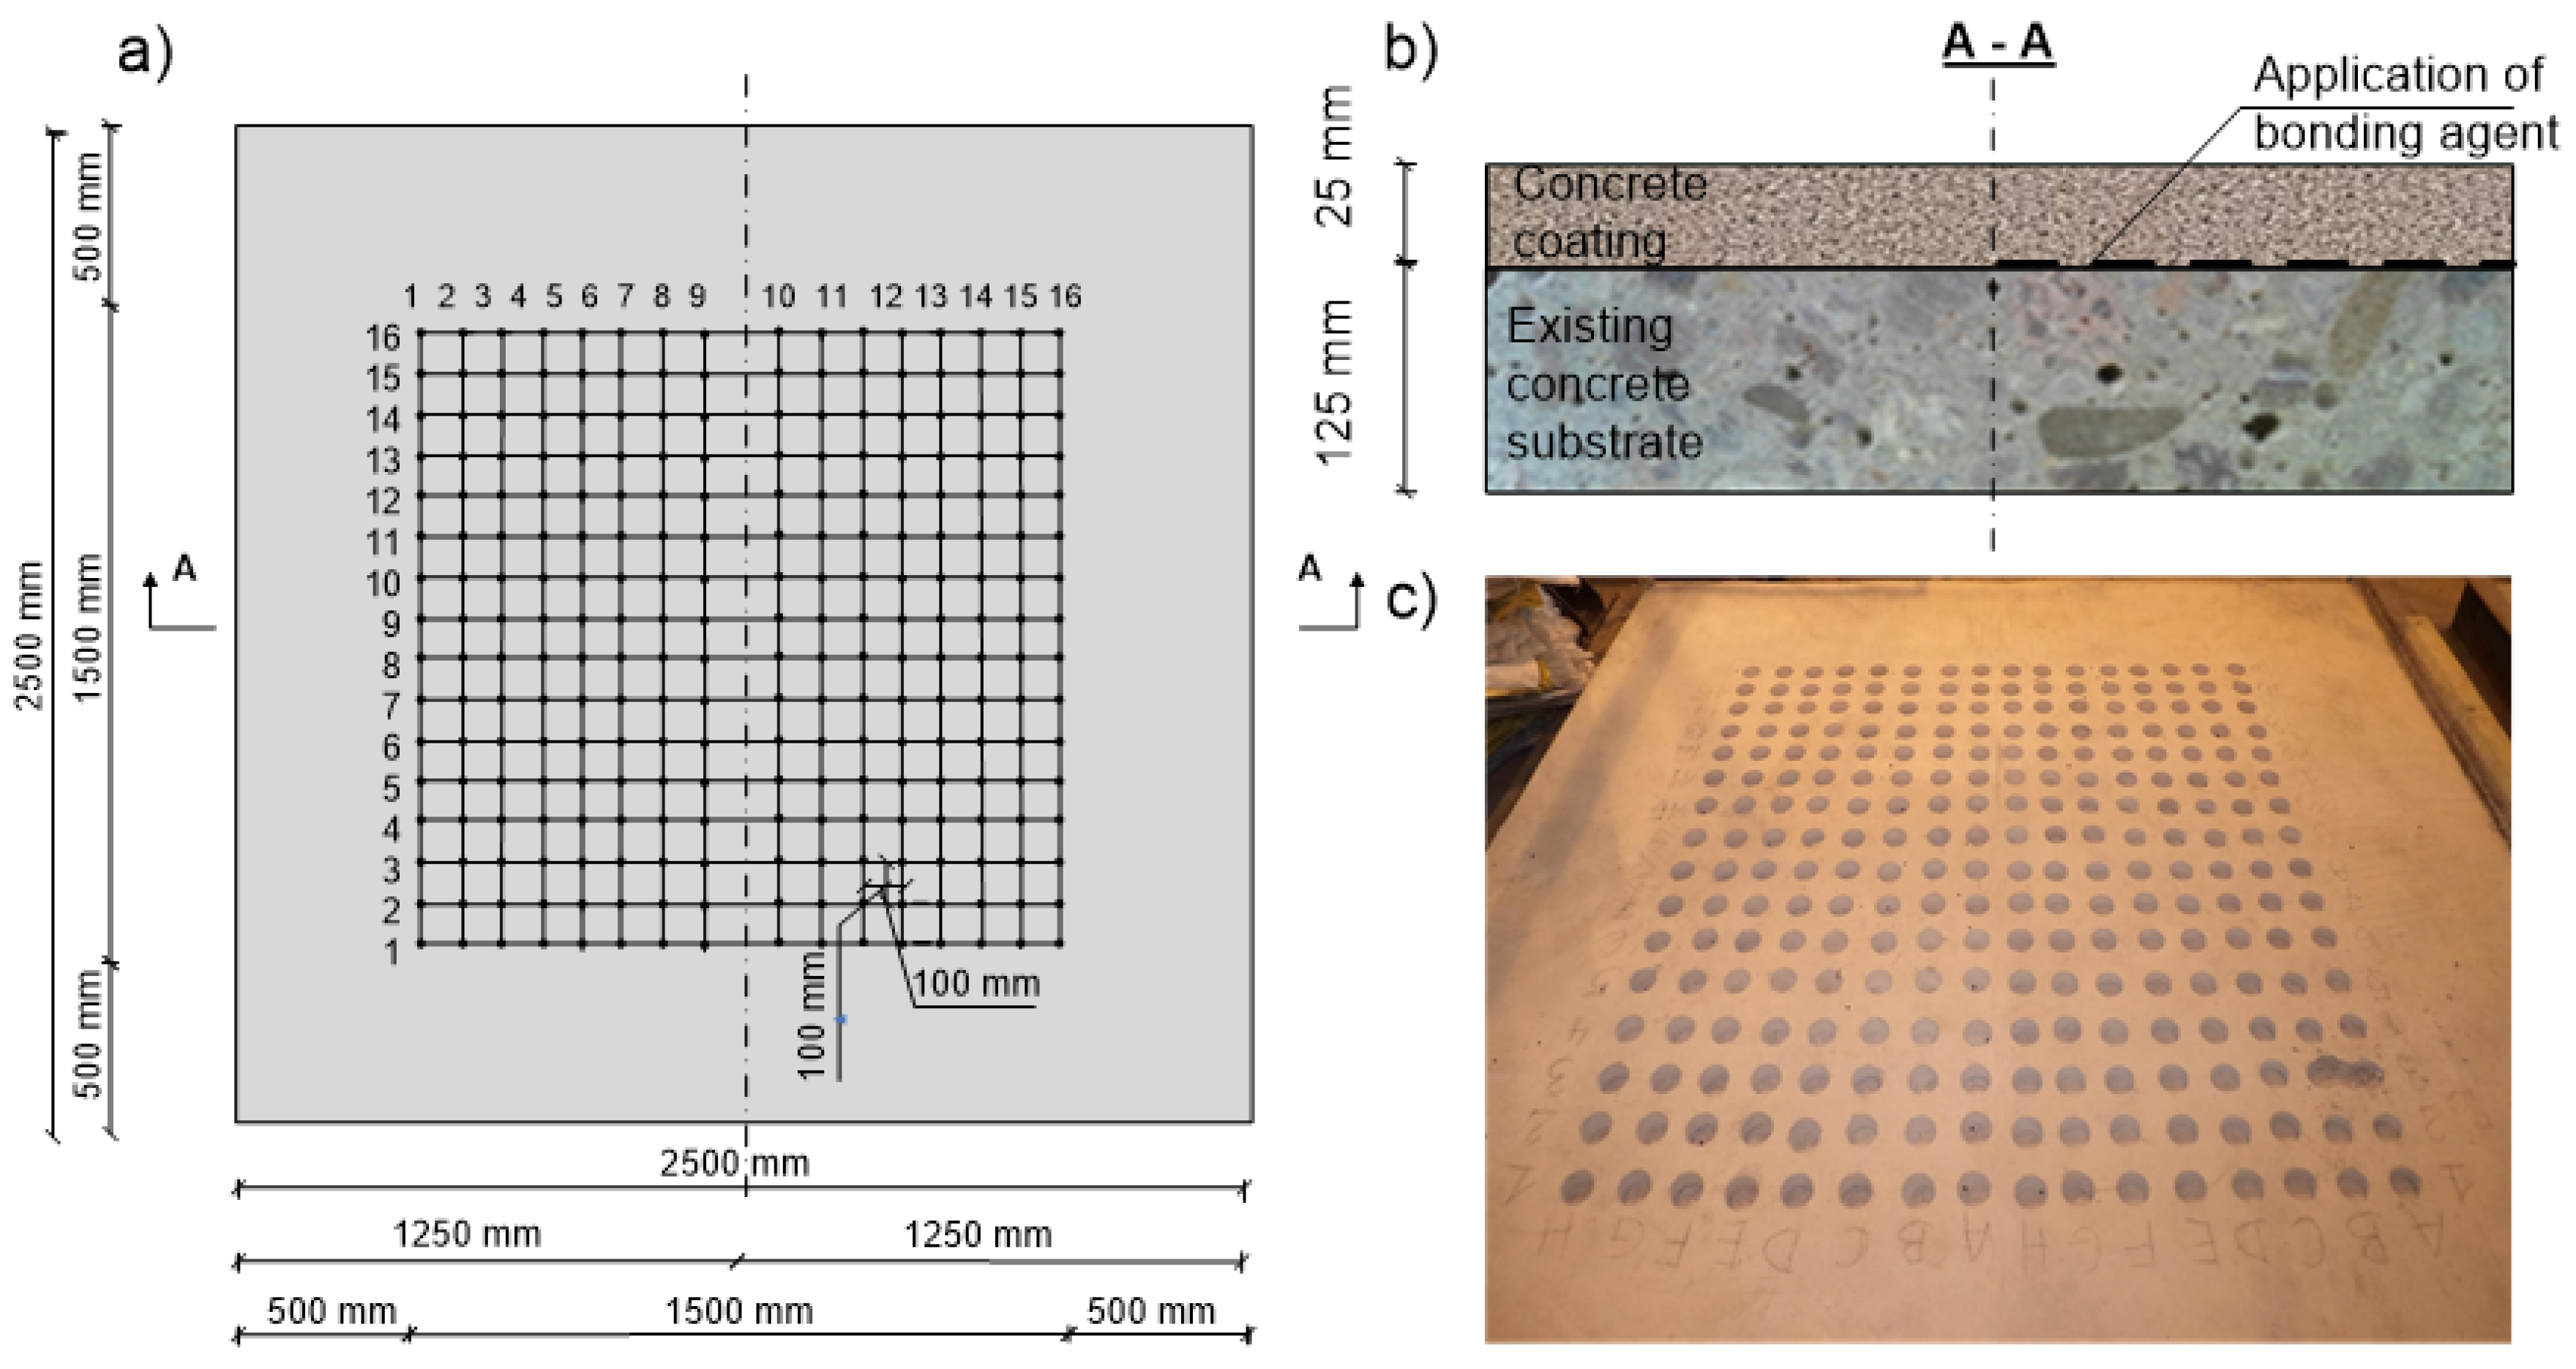
29], the NDT tests were carried out on a surface of a two-layer cement composite with dimensions of 2500 × 2500 mm
2 and with a constant thickness of the overlay equal to 25 mm (
Figure 1a,b). The overlay was made of C20/25 class cement mortar with the maximum quartz aggregate grain size equal to 2 mm. The overlay was laid on the existing substrate with a constant thickness of 125 mm made of C30/37 class concrete. In this concrete, the maximum broken basalt aggregate grain size was equal to 8 mm. The surface of the existing concrete substrate was sandblasted. In order to achieve a wider range of adhesion between the overlay and the substrate, half of the surface of the substrate was covered with a bonding agent in the form of concentrate to be diluted with water.
Table 1 shows the weight composition of the mixes that were used to make the substrate and the overlay.
The grid of the testing areas was applied on the surface of the overlay 500 mm from its edge (
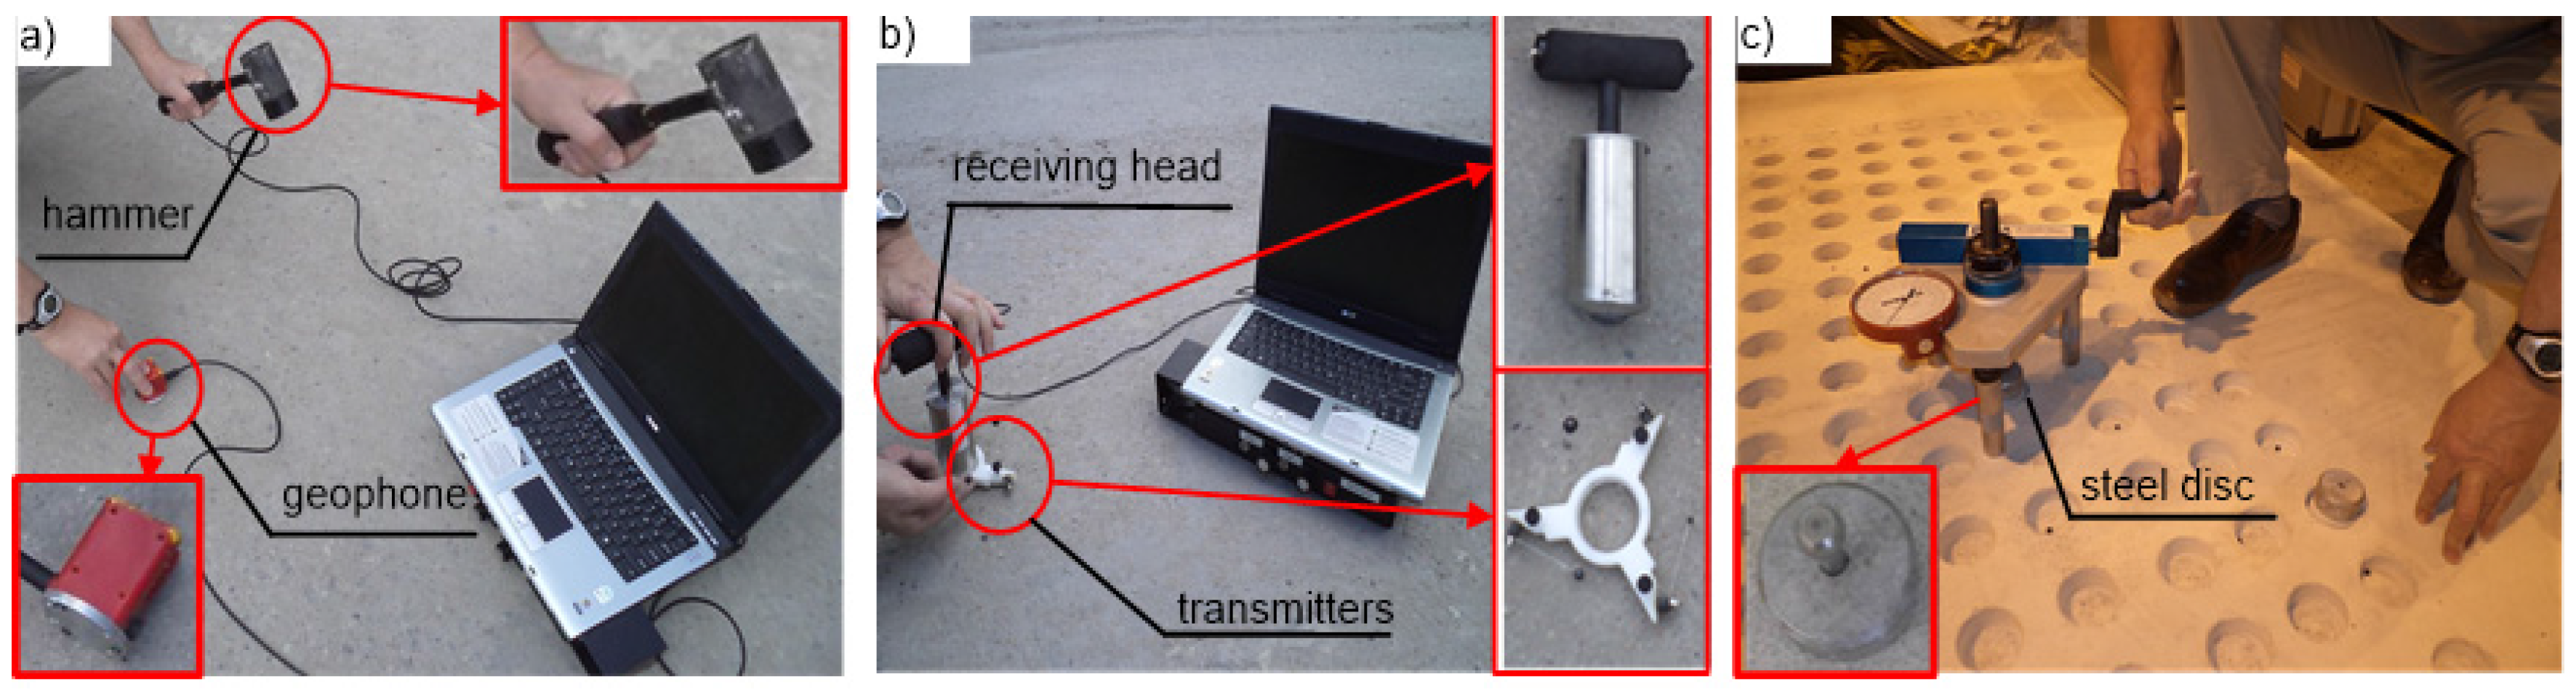
Figure 1a) and the number of testing areas was equal to 256. 90 days after laying the overlay, tests using two acoustic NDT methods were carried out on its surface in 256 designated testing areas (
Figure 2a,b).
The values of the following parameters were determined in all these areas using the IR method: average mobility (
Nav), dynamic stiffness (
Kd), mobility slope (
Mp/
N), and void index (
v) according to [
54,
55,
56]. The value of the frequency of the sound wave reflection from the bottom of a sample (
fT), obtained using the I-E method, was also measured according to [
57,
58,
59].
After finishing the tests using acoustic NDT methods, tests using the pull-off method were conducted in the same testing areas in order to obtain the real values of the
fb (
Figure 2c). The
fb values were then used as patterns for learning and testing the ANN. The data used for development of the models was obtained from past experiments [
29]. In this article, the output value of the pull-off adhesion predicted by the ANN is denoted as
fc,b. Exemplary data is presented in
Table 2.
3. Results of Training and Testing
After applying the Chauvenet criterion of the elimination of questionable results and reducing the database to 239 sets of results, the resulting variables were randomly divided into ANN learning, testing, and experimental verification data. Once the data was normalized, out of 239 such sets of results, 70% of the samples (167 patterns) were randomly used for training and 15% of the selected samples (36 patterns) were randomly used to test the ANN. The rest of the samples were randomly used for validation (36 patterns). In order to include all the parameters in a numerical range and make the data dimensionless, the contributing input and output parameters should be normalized prior to the training phase according to Equation (1):
where
xN is the normalized input and output data,
x is the input data, Min
X is the minimum of all data, and Max
X is the maximum of all data. Therefore, all of the normalized data is placed in the numerical distance of [−1,+1]. The hidden layer node numbers were determined according to [
60] by using Equation (2):
where
NH is the maximum number of neurons in the hidden layers and
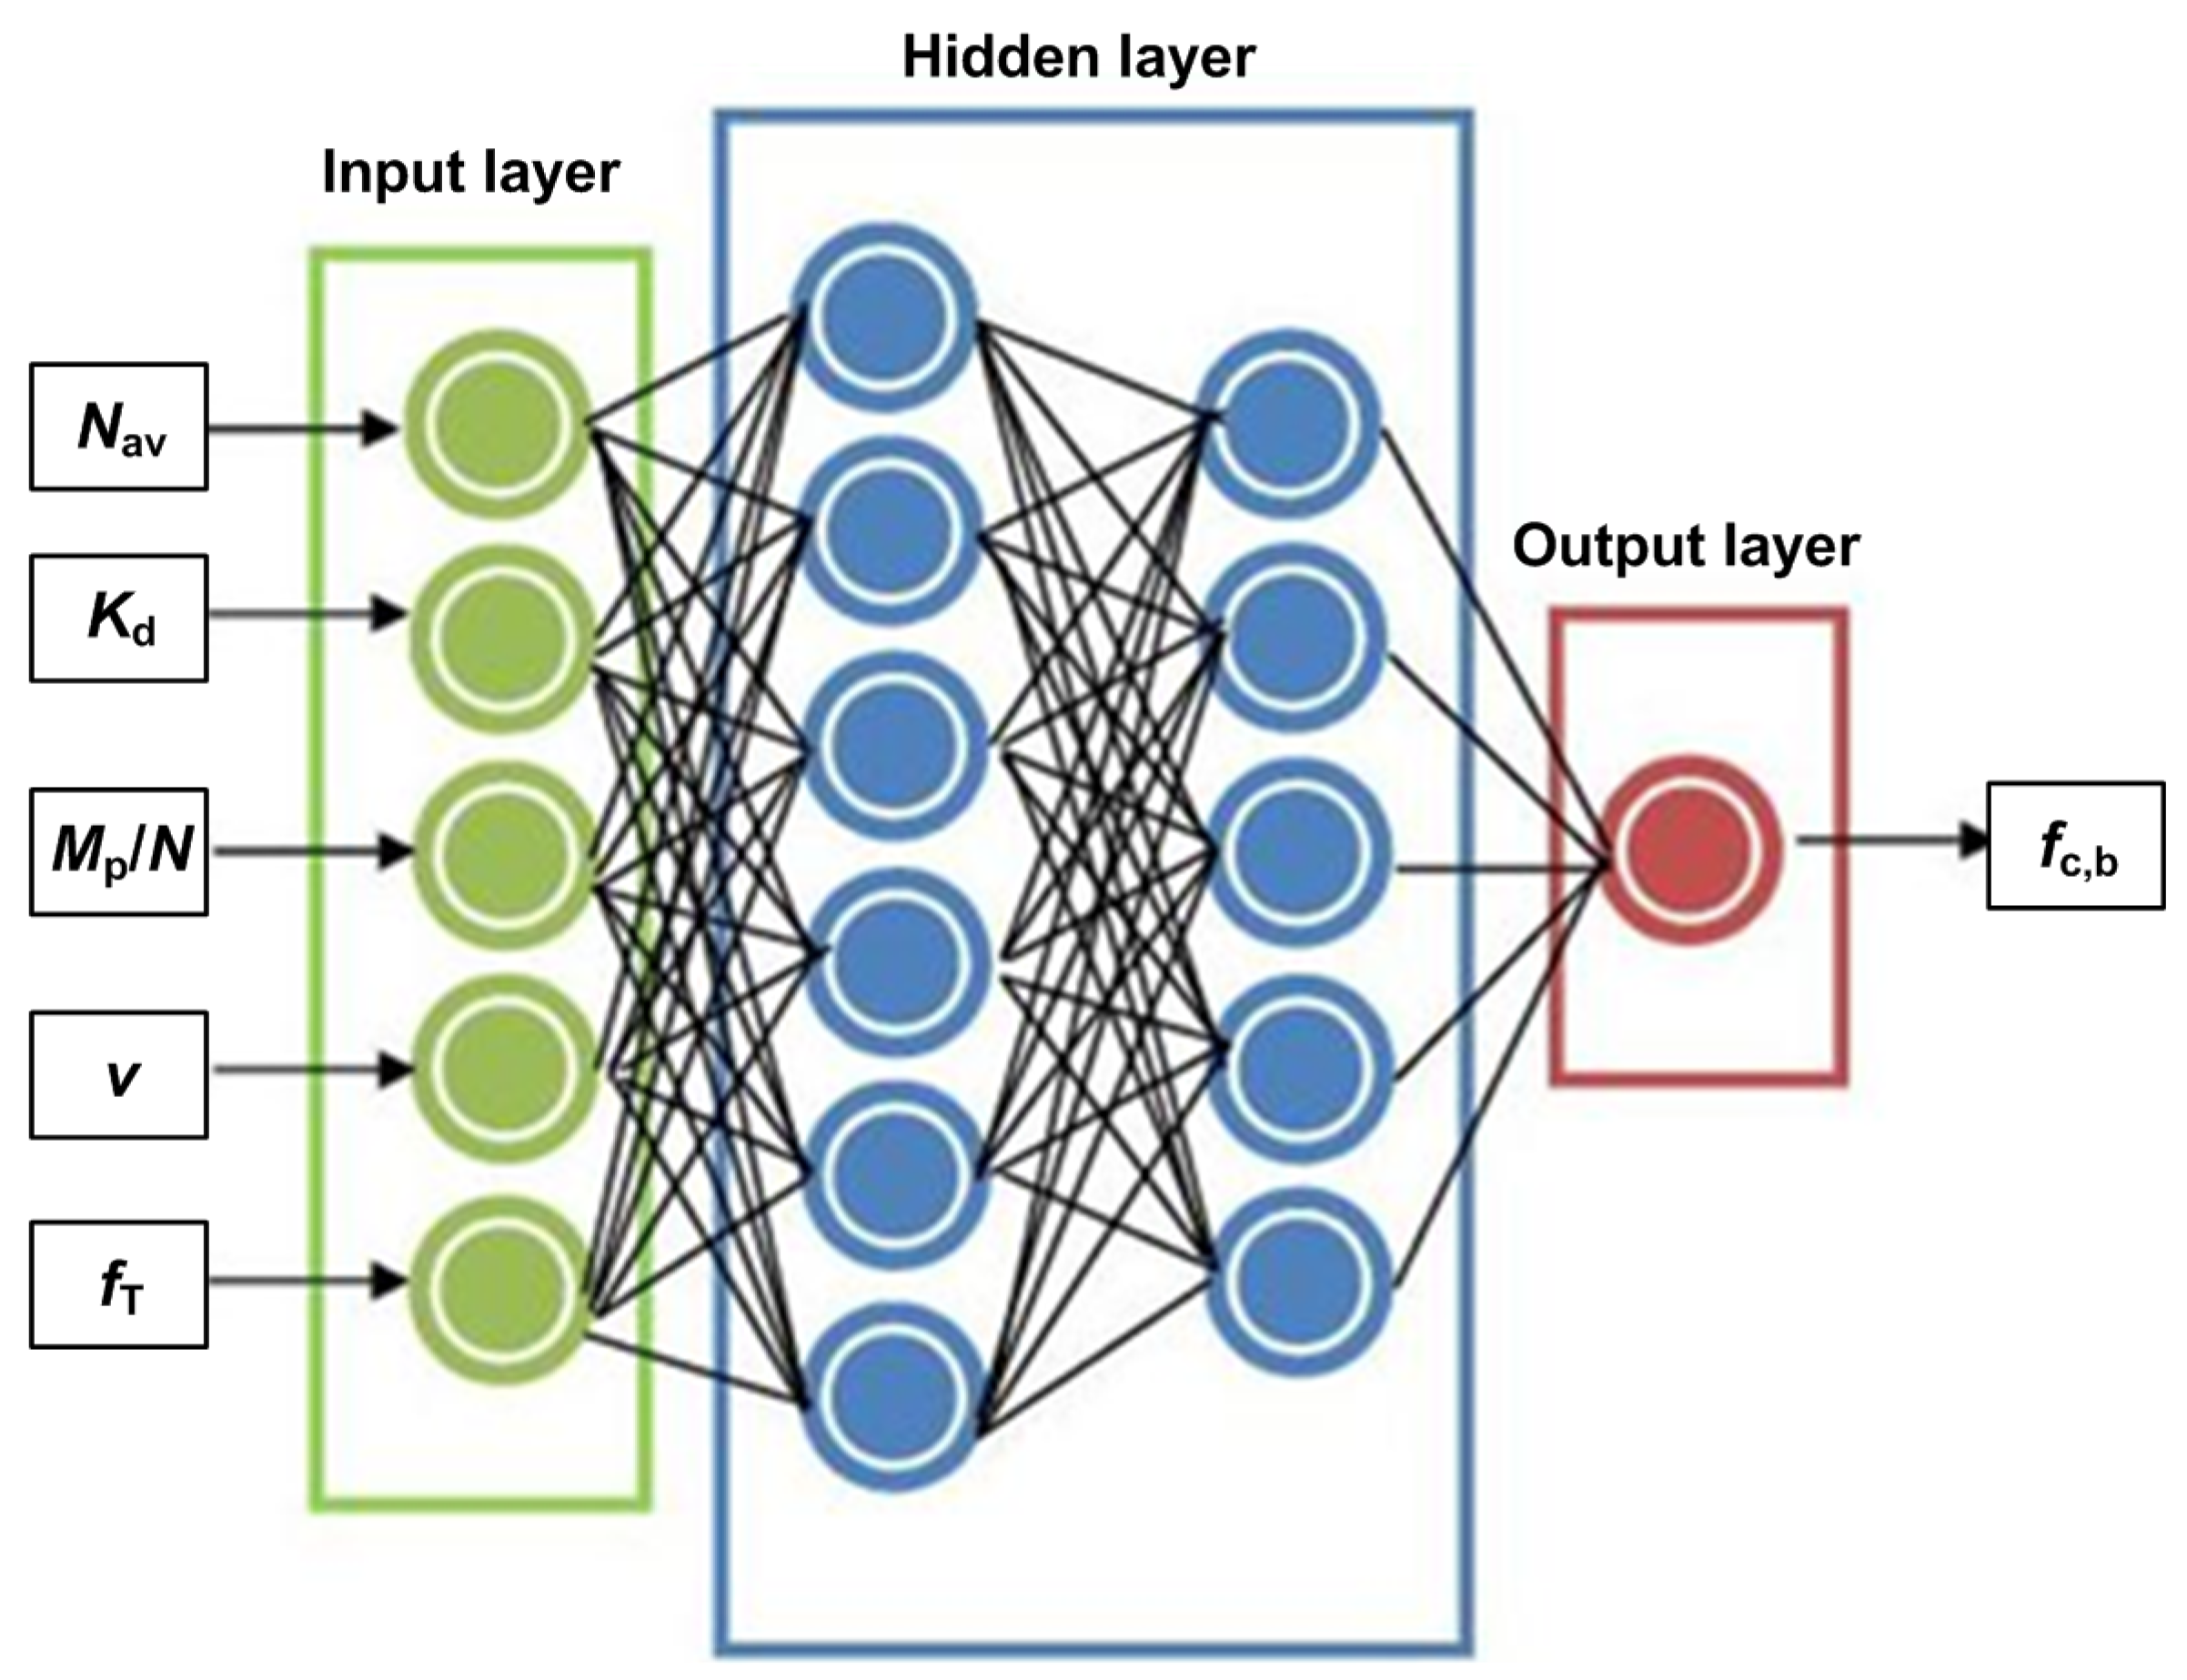
NI is the number of inputs. Considering that the number of effective inputs obtained is 5, the maximum number of nodes in the hidden layer is equal to 11.
The ICA is used to determine the optimized weight of each of the ANN models. The structure of the ICA-ANN used in the analysis is presented in
Figure 3.
Table 3 indicates the optimized structure of each model along with features of the ICA. Furthermore,
Table 4 indicates the analytical results of training and testing each of the models with optimal structure, which is provided in Table 3. Five statistical parameters of mean error (
ME), mean absolute error (
MAE), mean squared error (
MSE), root mean squared error (
RMSE), and mean squared reduced error (
MSRE) are presented in
Table 5. The performance measurements from all models have been collected and averaged. Due to the randomness of weights and data sampling, each experiment is simulated ten times in order to obtain more reliable results. To determine the performance of the models and to decide on the best model, the MSE test and MSE training criteria obtained from the models are compared with each other and shown in
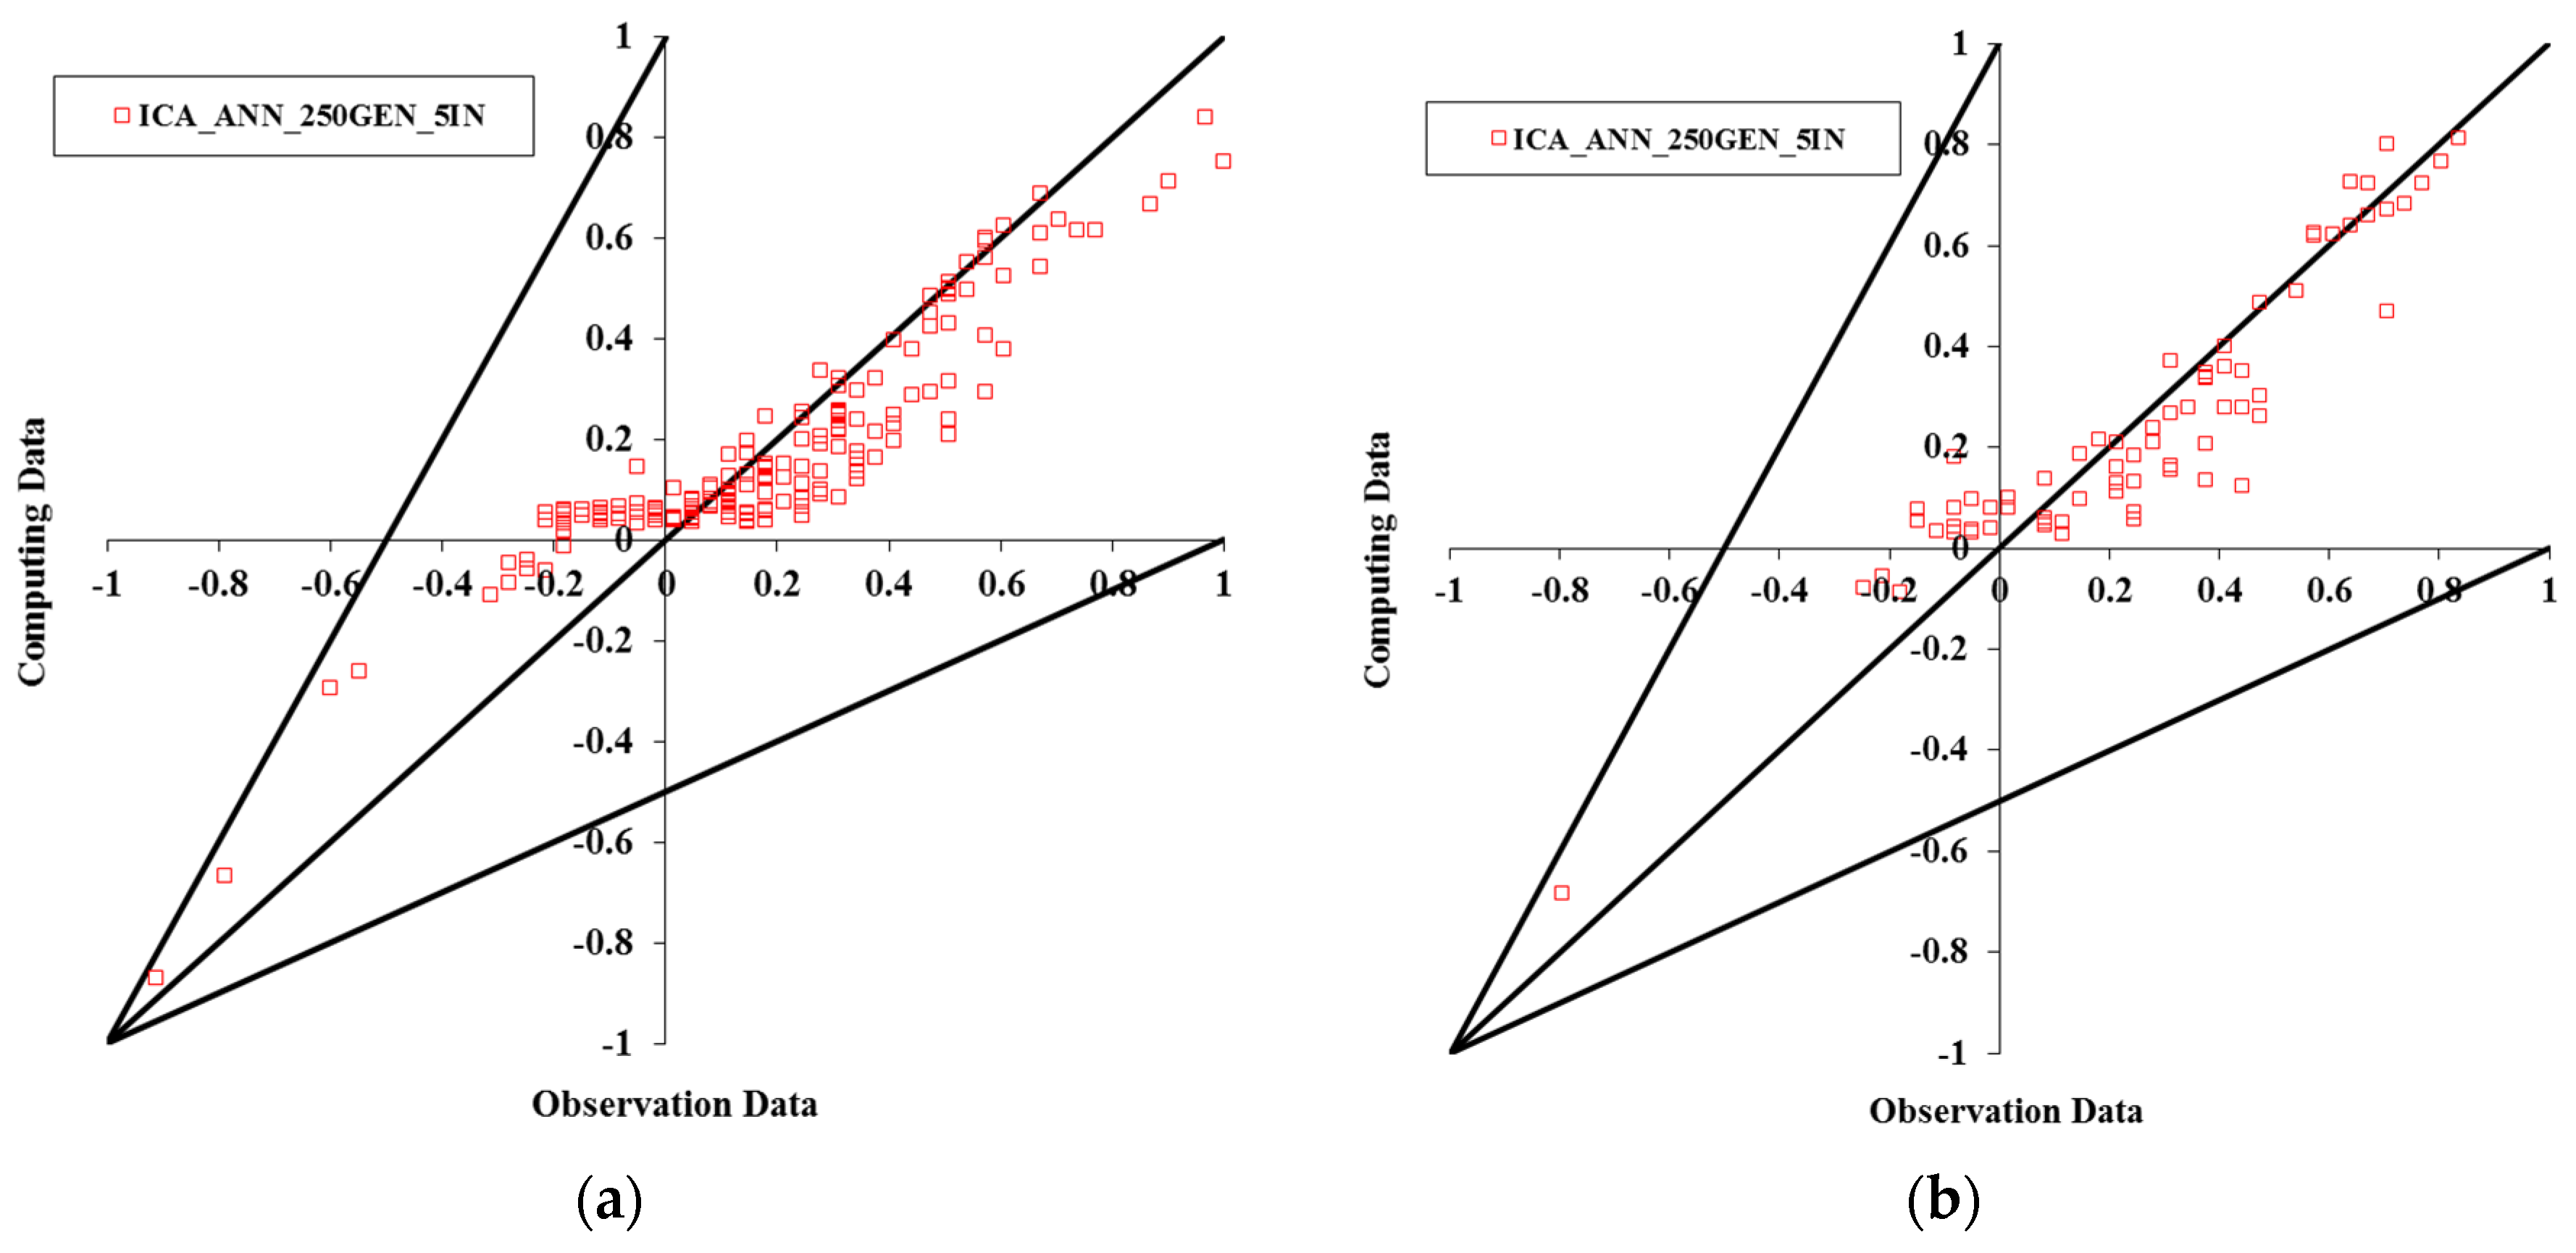
Table 3. According to the indicated results, the 250GEN_5IN model, the weight of which has been optimized by the ICA, has been optimized by 500 countries, 50 empires, and 250 repetitions, and has the best results among the models of its kind.
As indicated in
Table 3 and
Table 4, in model 5 the values of the determination coefficient
R2 for the parameter of
fb at the training and testing stages are equal, respectively, to 0.844 and 0.858. The slope of the straight line for this parameter equals 0.679 and 0.802, which represents the accuracy of the model and less modeling error. According to [
61], in this model the nonlinear tan-sigmoid function (TANSIG), which shows the minimal error, was considered as the transfer function:
According to
Table 5, the coefficients of
ME,
MAE,
MSE,
RMSE, and
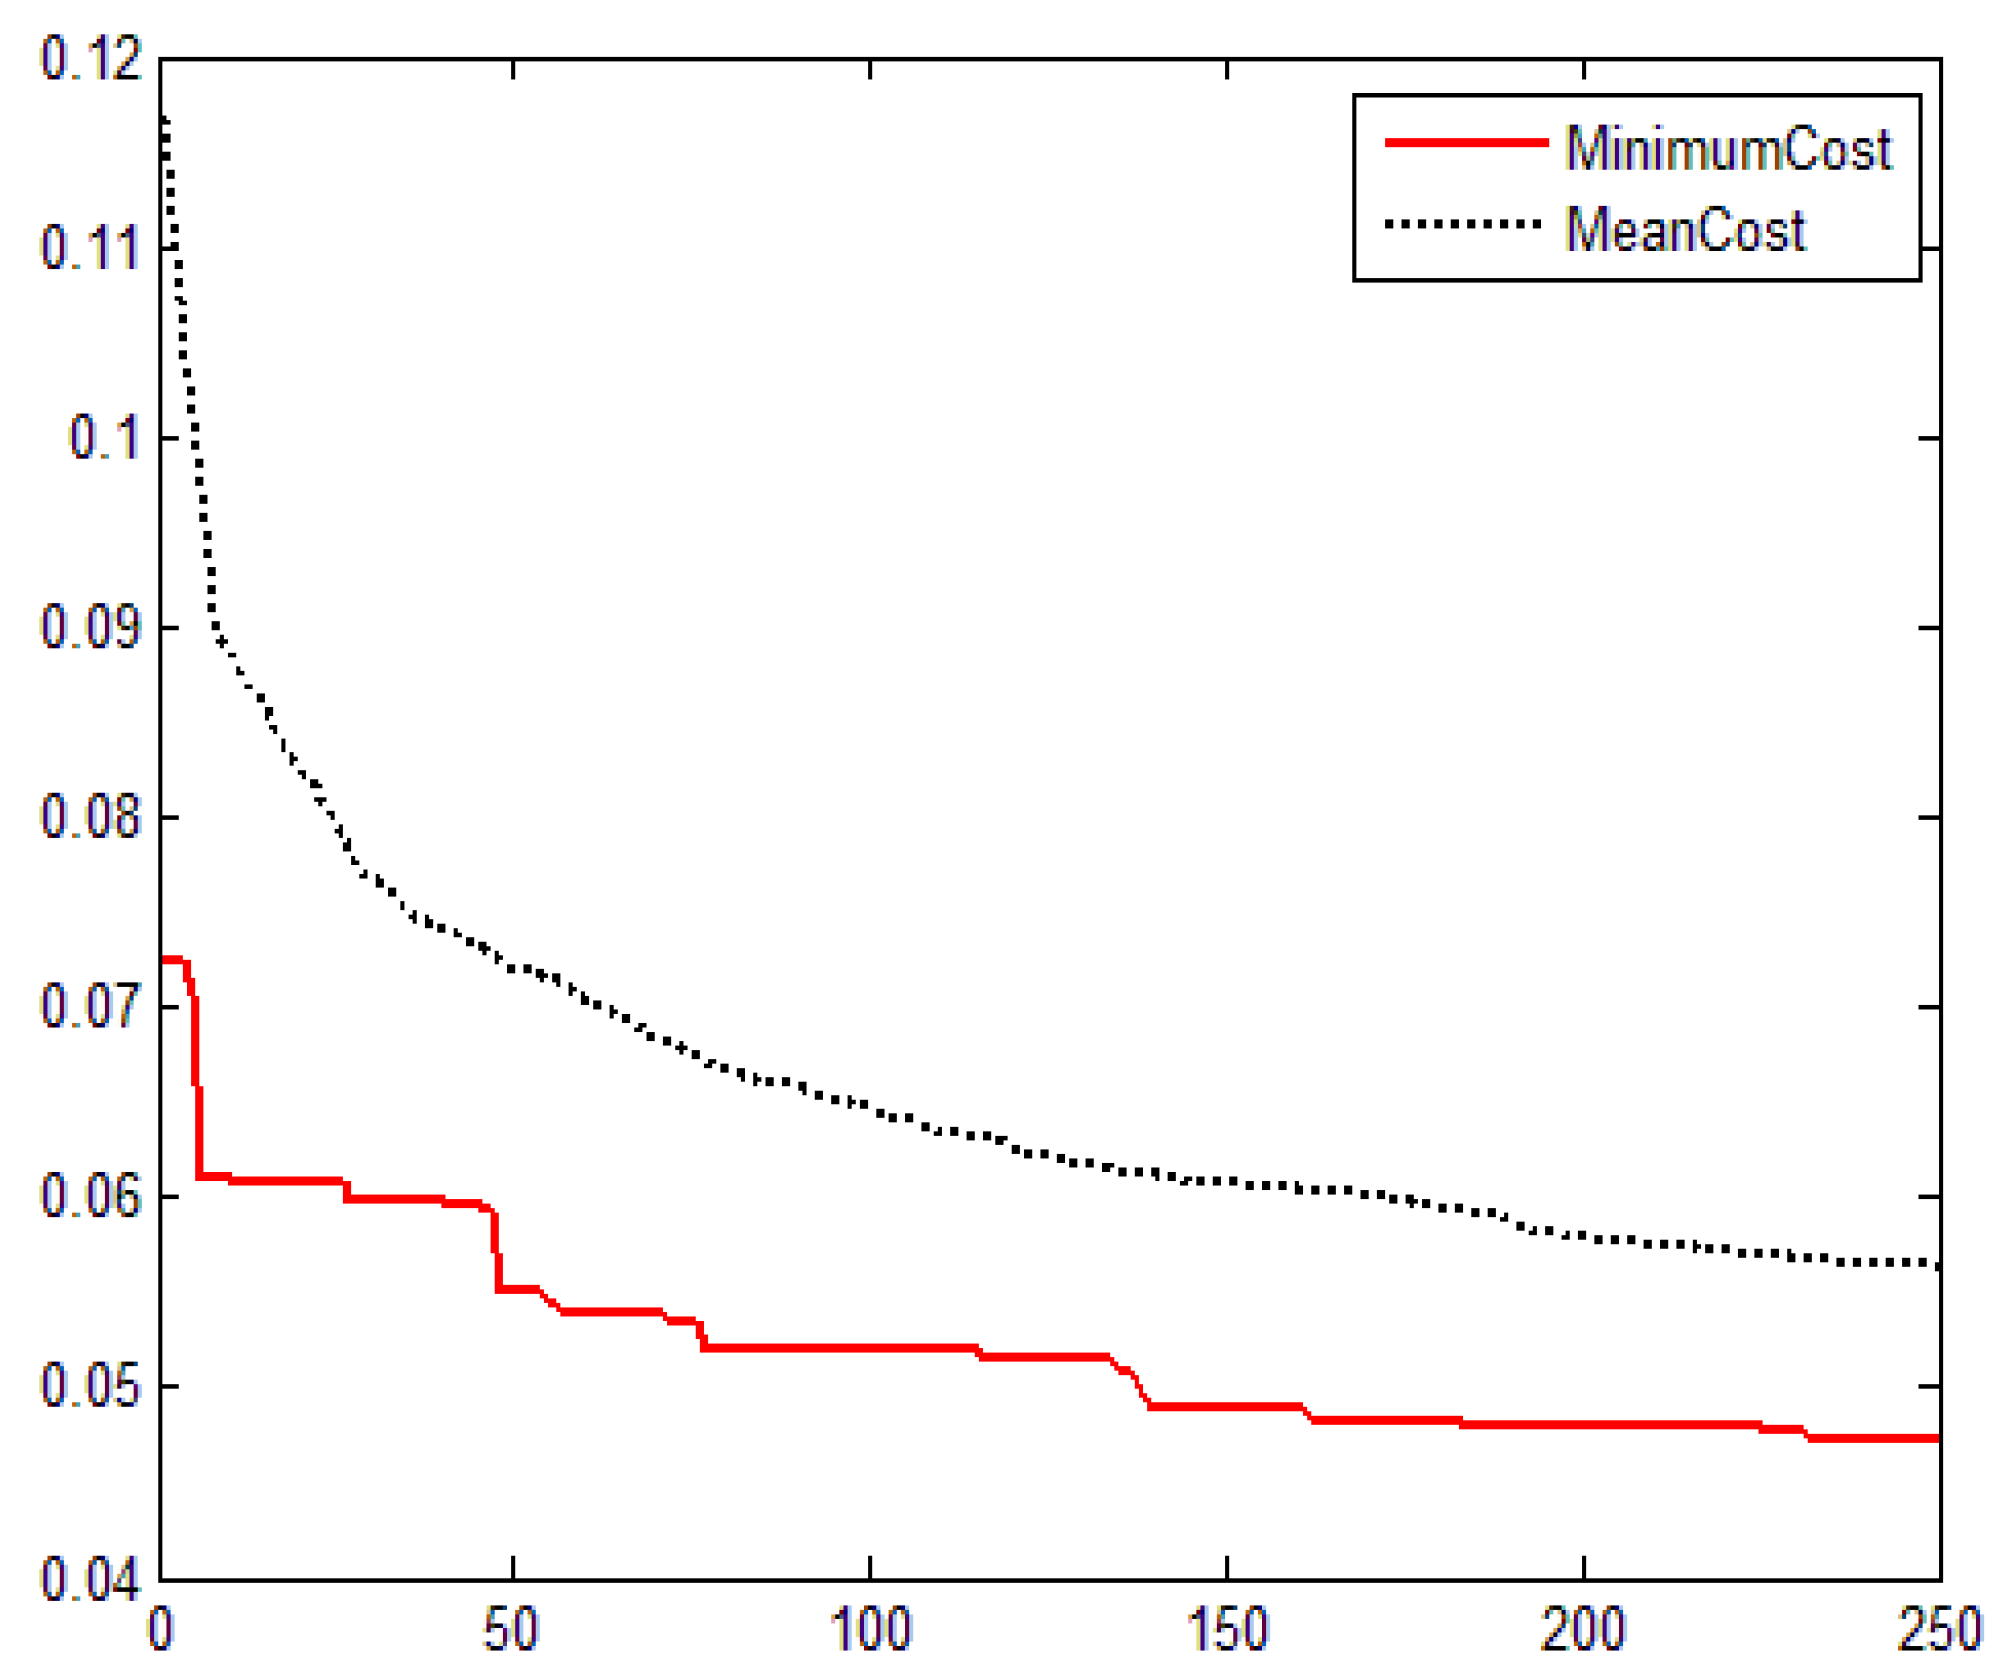
MSRE in two training and testing stages for the ANN model with a 1-5-6-5 structure, and also the properties of 500 countries, 50 empires, and 250 repetitions, are less than for all of the other models. This represents lower errors of this ANN in comparison to other models. Therefore, the ICA-ANN model with the title of 250GEN_5IN is more accurate than other models of its kind. The result of comparing the selected 250GEN_5IN ICA-ANN model with the observation data is presented in
Figure 4. The minimum cost and the mean cost diagrams are shown in
Figure 5.
4. Comparison with the Genetic Algorithm (GA) and Particle Swarm Optimization (PSO)
In order to evaluate the accuracy of the ICA-ANN model, which has been optimized by the ICA, it was compared with both the GA and PSO, the features of which are provided in
Table 6. The ICA-ANN model with a 1-5-6-5 structure and the TANSIG stimulation function were used. According to a study conducted on three algorithms for training data and testing,
R2 coefficients and the slope of the straight line are presented in
Table 7.
Figure 5 shows graph cost for 250 iterations in the 250GEN_5IN model.
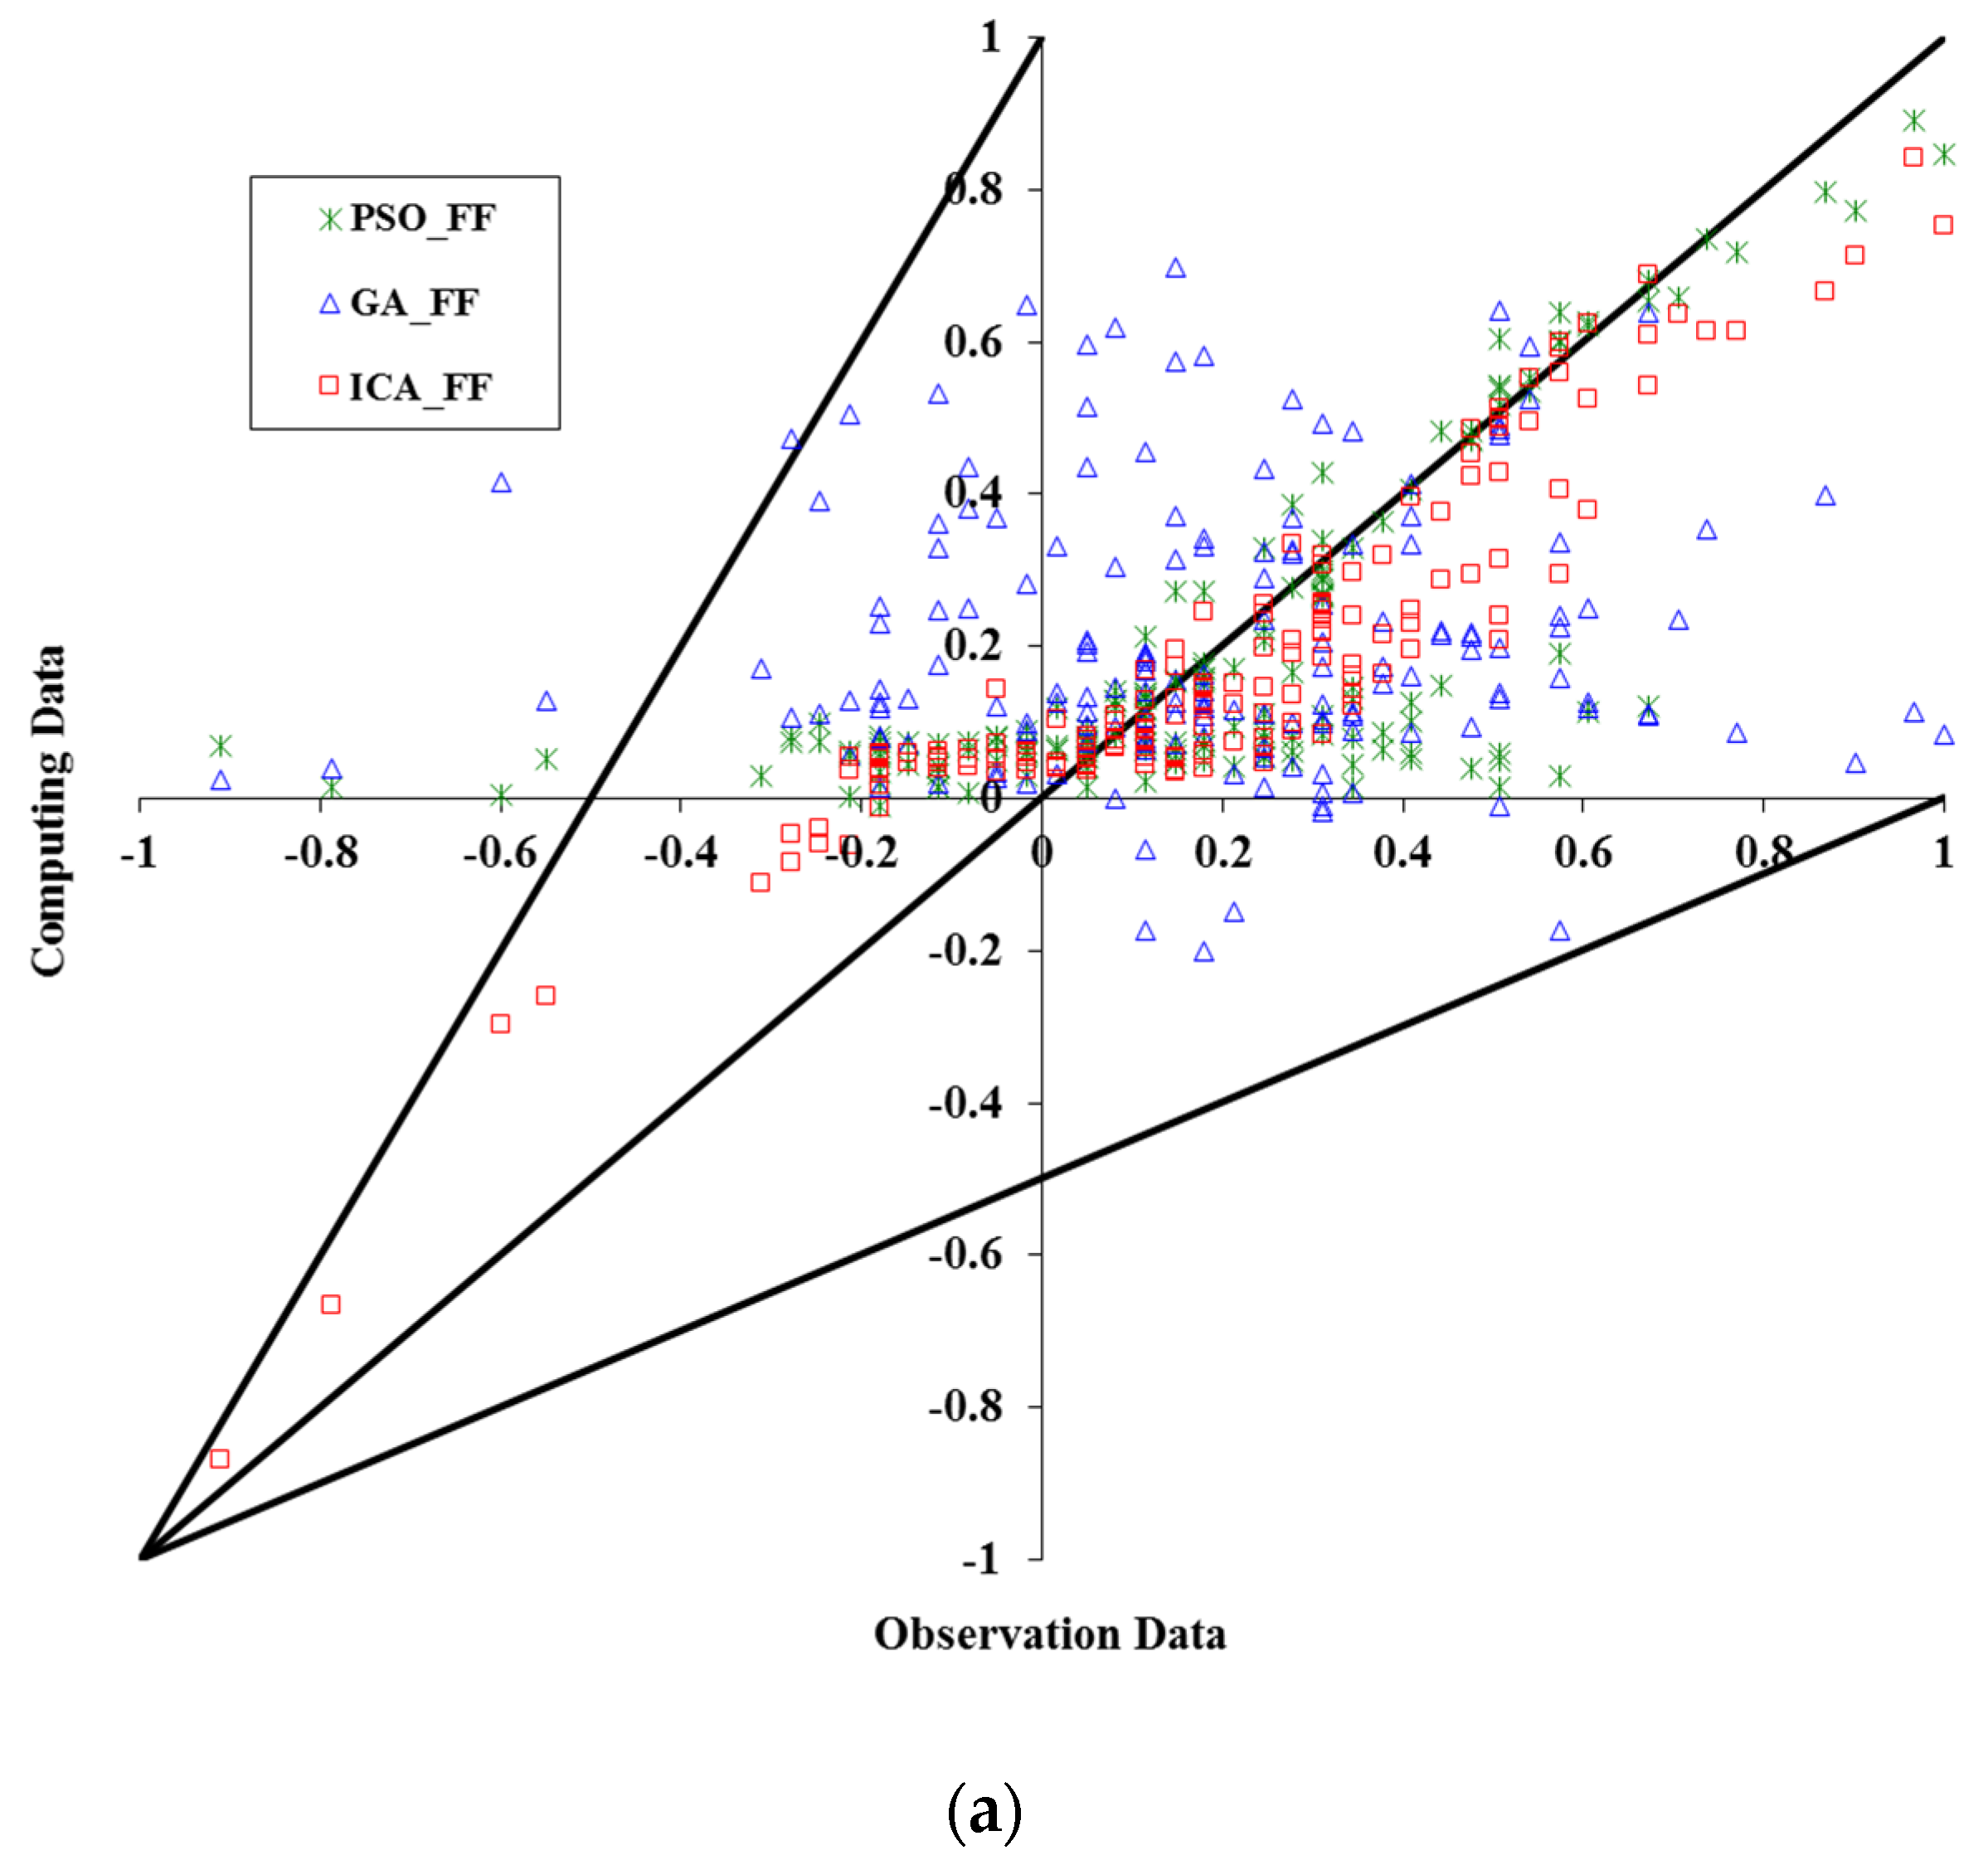
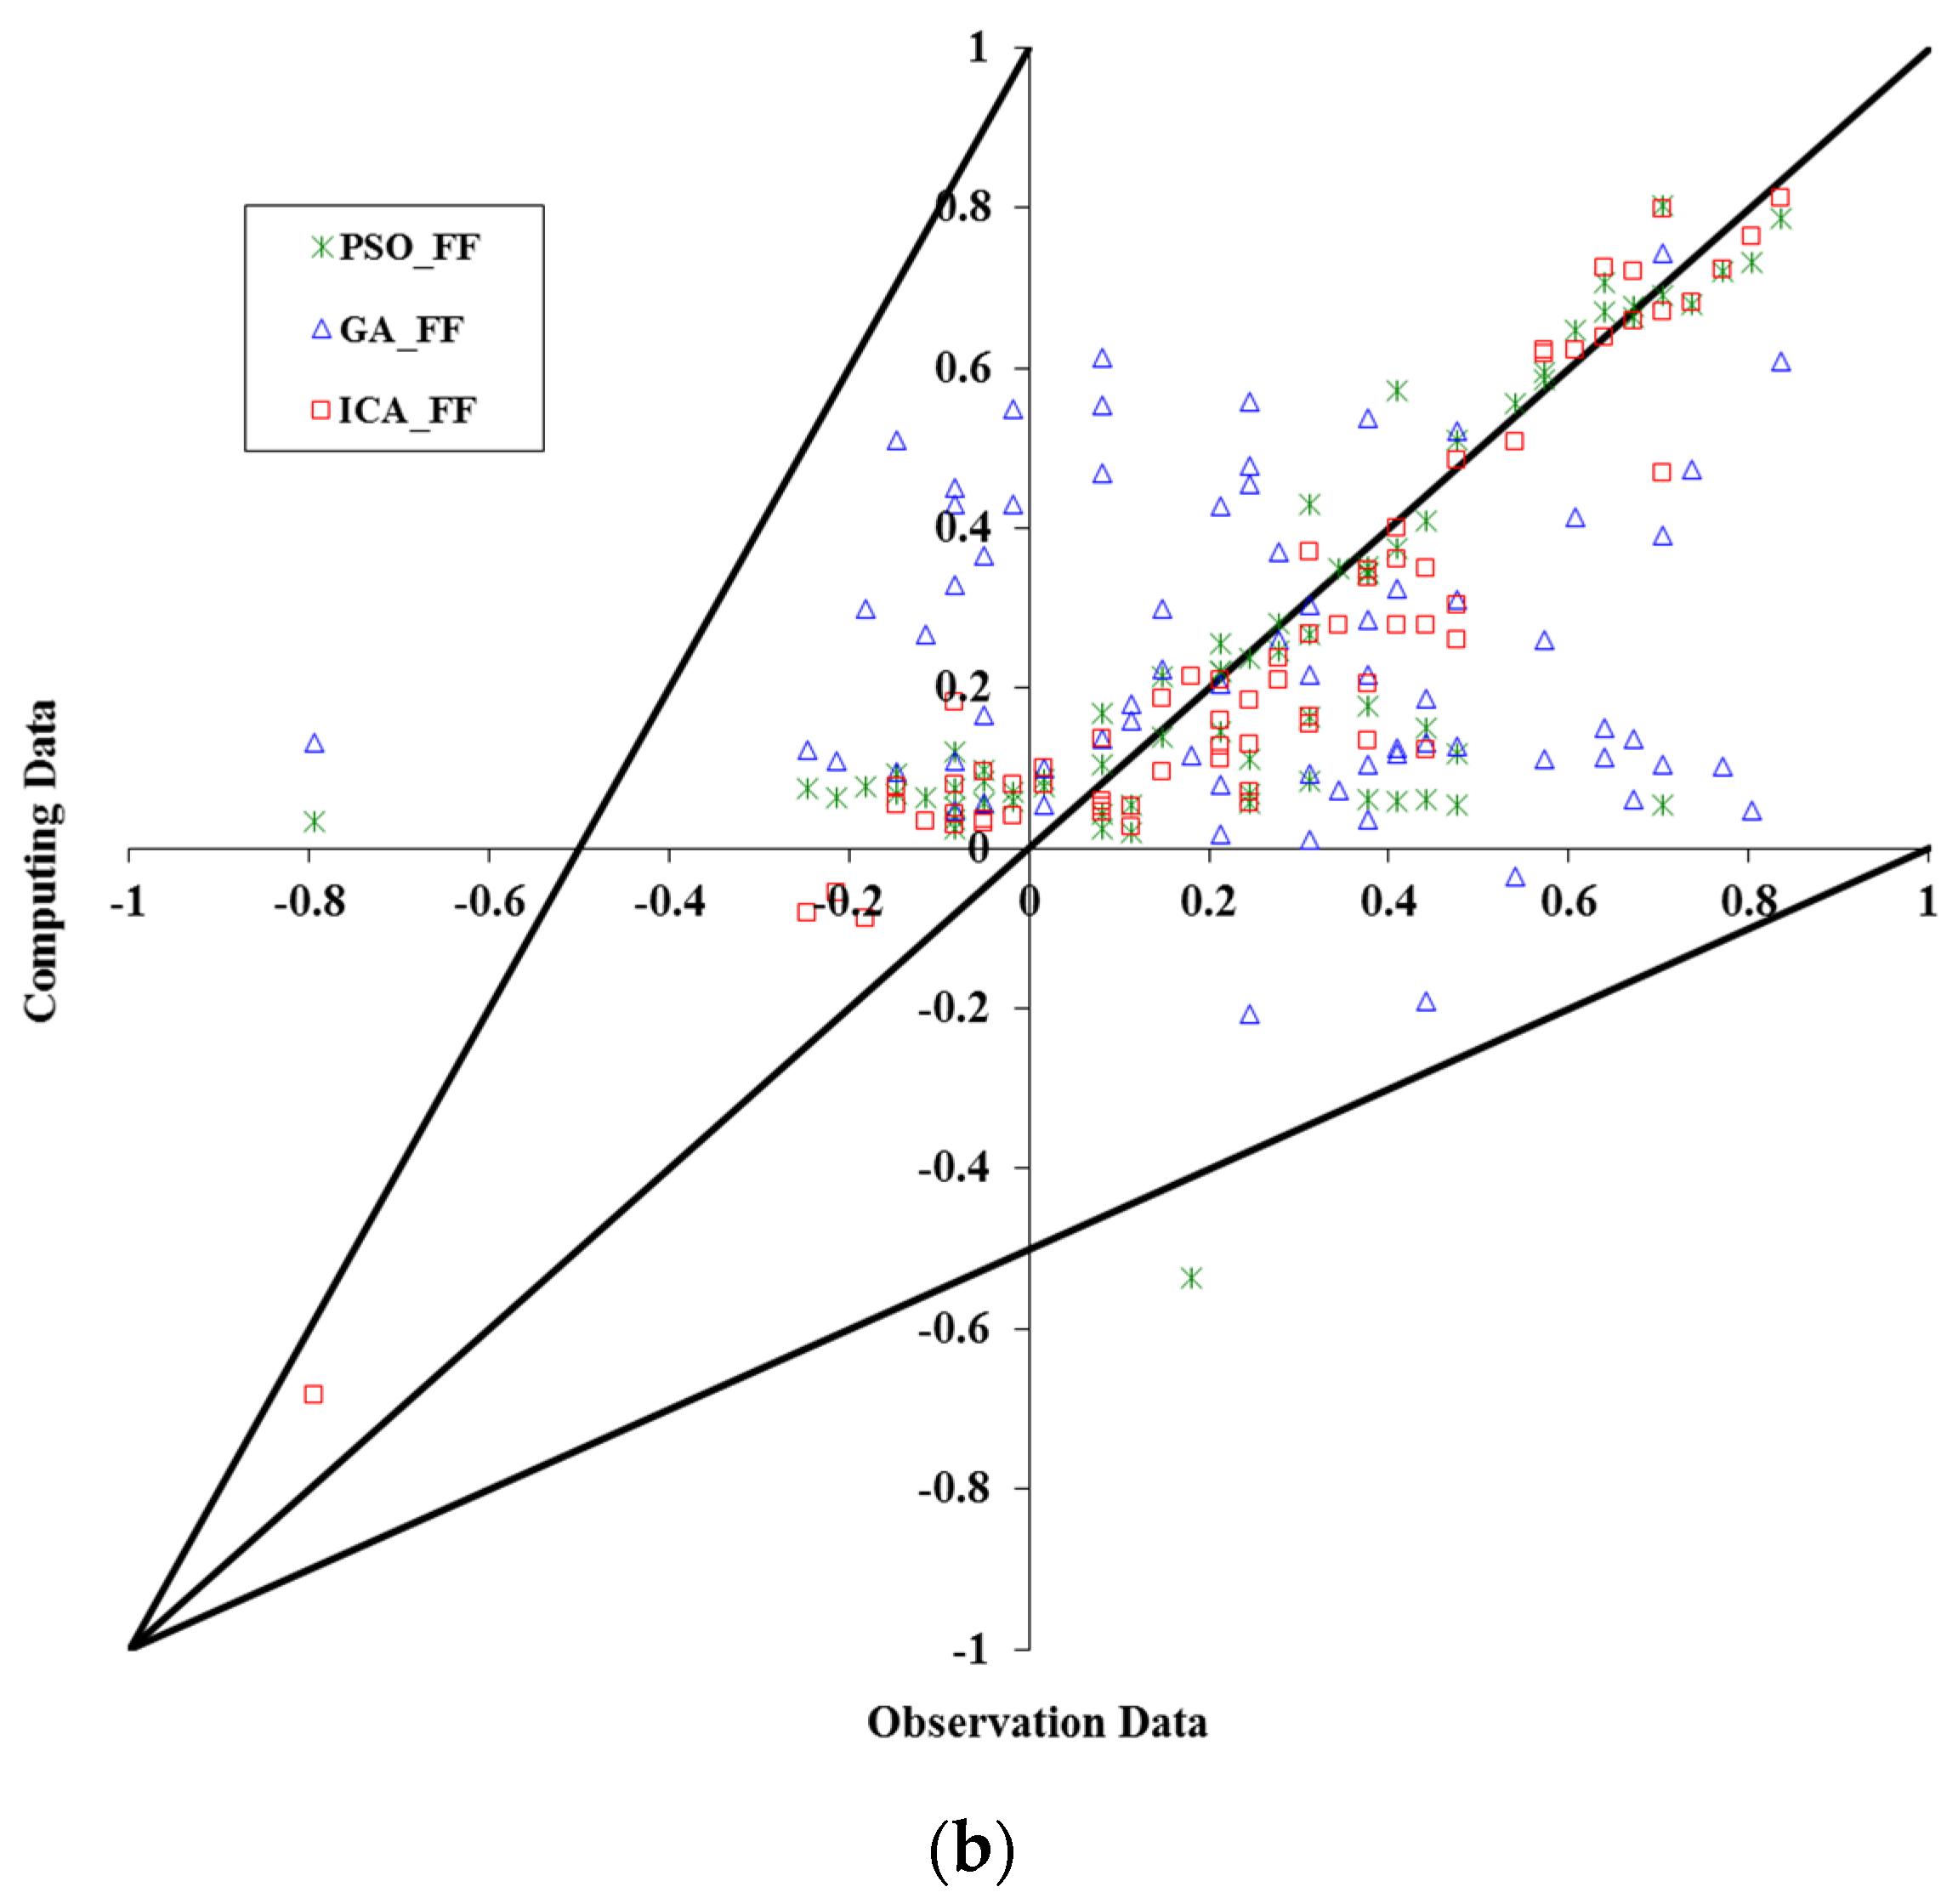
Figure 6 shows the comparison of the
fb values for the computational and observational data using the three algorithms in the training stage. According to the equations of lines fitted to the computational and observational values in each model, and also the coefficient of determination that corresponds to them (
Table 7), it can be seen that the ANN optimized by the ICA determines the amount of
fb more accurately than the GA and PSO algorithms. Moreover, the determination of
fb using the three models shown in
Figure 6 indicates that the ANN optimized by the ICA has higher accuracy and flexibility.
5. Results of Validation of the Proposed ICA-ANN Model
In order to conduct the validation of the ICA-ANN model, a set of 36 results was randomly selected. These results were not previously used to train and test the ICA-ANN. As a result, the taught ICA-ANN model generated the value of the pull-off adhesion for each of these areas.
Table 8 presents a comparative summary of the values of
fb and
fc,b, defined, respectively, using the pull-off method and ICA-ANN.
The results of validation presented in
Table 8 indicate the correct identification of validation data. It is evidenced by the obtained low mean value of the absolute error amounting to 0.05 MPa and the satisfactory mean value of the relative error |
RE| amounting to 4.89%. Interestingly, the values of
fc,b identified by the ICA-ANN are equal to 1.11 MPa and are, on average, the same as the
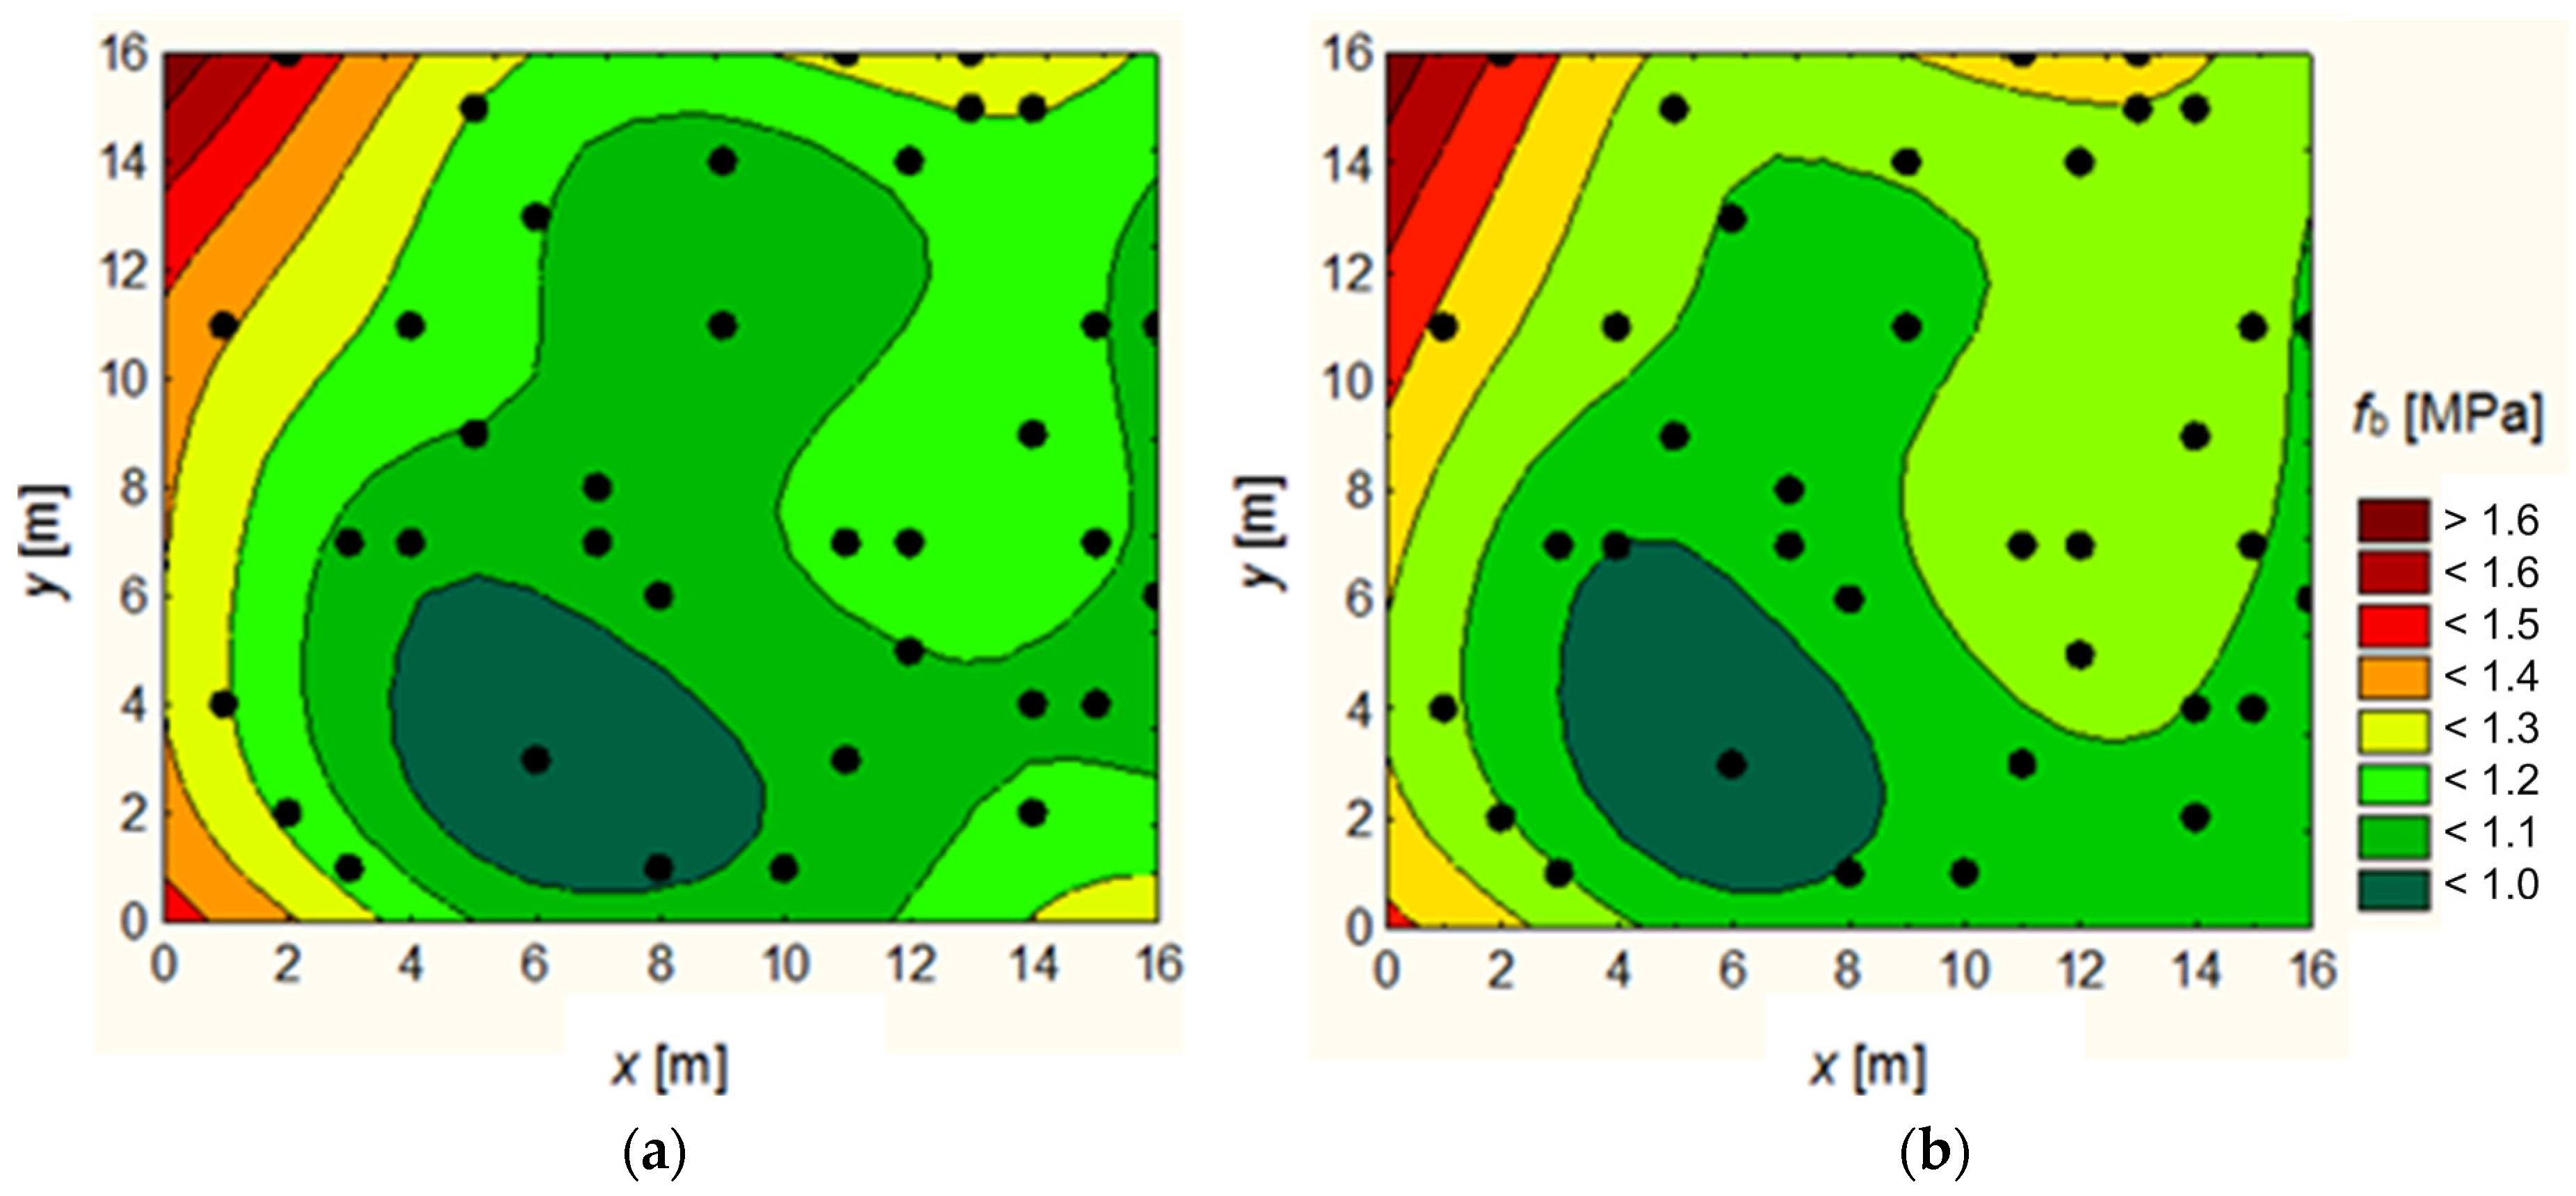
fb obtained experimentally using the pull-off method. The results of the validation were used to plot the adhesion maps shown in
Figure 7 (results in the other points on the tested surface were obtained by means of linear interpolation). This figure illustrates two adhesion maps. The first one was obtained on the basis of experimental tests conducted using the pull-off method (
Figure 7a). The second one was identified by the ICA-ANN.
6. Conclusions
The results of the proposed hybrid method indicate that the metaheuristic ICA is successful in optimizing the ANN. The prediction model requires knowledge of a total of five parameters: Kd, Nav, Mp/N, and v, obtained using the IR method, and also parameter fT, which was obtained using the I-E method. ANN with a 1-5-6-5 structure with the nonlinear tan-sigmoid transfer function and the properties related to the ICA with 500 countries and 50 primary empires and 250 repetitions has a higher ability and accuracy in determining the value of the fb.
In the best ANN model, optimized by the ICA for determining the value of the
fb, the determination coefficient
R2 at the stages of training and testing is 0.844 and 0.858, respectively. The results indicated that the ICA-ANN model outperforms the other methods, such as the GA and PSO. The
R2 values are also higher than those obtained previously by the simple MLP-ANN [
29]. The obtained values of
R2 can be considered as satisfactory, taking into account the fact that it is not necessary to use the 3D roughness parameters of an existing concrete substrate surface.
Various functional issues solved by this algorithm also indicate that the proposed optimization strategy can successfully help to solve practical problems. The pull-off adhesion of the cement mortar in the existing concrete substrate in real cement composites can be obtained with the use of the proposed method. However, this method is applicable when the thicknesses of the layers of the cement mortar and substrate, and also the composition of the cement mortar and existing concrete substrate in the particular cement composite, are similar to the ones that were used to create the database in this article. Otherwise, it is necessary to create a new database for cement composites that are tested in practice.


