Article

Thermal Protection of Carbon Fiber-Reinforced Composites by Ceramic Particles

by
Baljinder Kandola
1,*,
Forkan Sarker
1,2,
Piyanuch Luangtriratana
1,3 and
Peter Myler
1
1
Institute for Materials Research and Innovation, University of Bolton, Deane Road, Bolton BL3 5AB, UK
2
Department of Textile Engineering, Dhaka University of Engineering and Technology, Gaxipur-1700, Bangladesh
3
SCG Chemicals Co., Ltd, ASTEC 3 Building, 271 Sukhumvit Rd., Muang District, Rayong Province 21150, Thailand
*
Author to whom correspondence should be addressed.
Coatings 2016, 6(2), 22; https://doi.org/10.3390/coatings6020022
Submission received: 7 April 2016 / Revised: 9 May 2016 / Accepted: 20 May 2016 / Published: 1 June 2016

Abstract

:
The thermal barrier efficiency of two types of ceramic particle, glass flakes and aluminum titanate, dispersed on the surface of carbon-fiber epoxy composites, has been evaluated using a cone calorimeter at 35 and 50 kW/m2, in addition to temperature gradients through the samples’ thicknesses, measured by inserting thermocouples on the exposed and back surfaces during the cone tests. Two techniques of dispersing ceramic particles on the surface have been employed, one where particles were dispersed on semi-cured laminate and the other where their dispersion in a phenolic resin was applied on the laminate surface, using the same method as used previously for glass fiber composites. The morphology and durability of the coatings to water absorption, peeling, impact and flexural tension were also studied and compared with those previously reported for glass-fiber epoxy composites. With both methods, uniform coatings could be achieved, which were durable to peeling or water absorption with a minimal adverse effect on the mechanical properties of composites. While all these properties were comparable to those previously observed for glass fiber composites, the ceramic particles have seen to be more effective on this less flammable, carbon fiber composite substrate.

Graphical Abstract

1. Introduction

The drive to reduce weight and hence fuel consumption has promoted the use of fiber-reinforced composites in the transport industry. Modern aircraft such as the Boeing 787 and Airbus 350 are increasingly using composites as primary structural components. However, when polymeric structures replace metallics, their thermal stability becomes an important issue. On exposure to heat, the resin part of the composite softens before degrading and then undergoes combustion, often accompanied by delamination, which affects the structural integrity of the composite structure. The thermal and fire performances of fiber-reinforced composites depend upon the resin and fiber type, their mass/volume fraction composition and fiber configuration [1,2]. When exposed to high heat fluxes, the heat transfer and the resulting temperature rise through the thicknesses of samples depend on the density, thermal conductivity, and specific heat capacity values of both the resin and fiber components, as well as the kinetics of their decomposition [3,4,5], although the latter is applicable to resins only in the case of these composites. The thermal and mechanical performance of most thermosetting resins is dictated by their functionality. Low-functional resin systems such as bi-functional diglycidyl ether of bisphenol A (DGEBA) exhibit a moderately cross-linked structural network leading to moderate glass transition temperatures. On the other hand, high-functional resin systems such as tri-functional triglycidyl p-aminophenol (TGAP) and tetra-functional tetraglycidyl diamino diphenylmethane (TGDDM), which are more thermally stable due to the high degree of cross-linking, have high glass transition temperatures [6] and are less flammable than those with lower functionality.
Recently, we have shown that ceramic particles, when deposited on the surfaces of glass-fiber reinforced (GRE) composites, act as thermal insulators [7,8]. If an appropriate resin binder is used and the particles completely cover the surface, i.e., no resin on the surface is left unexposed; the flammability of the samples could be reduced. In cone calorimetric tests at 35 and 50 kW/m2, the heat fluxes in the absence of an external ignition source, the time-to-ignition (TTI) and the time-to-peat heat release rate (TPHRR) were significantly increased while peat heat release rate (PHRR) was reduced. However, if the particles do not completely cover the surface and even if a thick coating is applied, in presence of ignition source, the resin ignites easily and the thermal barrier effect of the ceramic particles becomes negligible [7,8]. A number of ceramic particles were initially used and, from these the two with the best performance have been selected here to be tested on carbon-reinforced epoxy composites. The carbon fiber composites were prepared from prepregs and had lower resin contents than the previously studied glass fiber composites [7,8], prepared using the hand lay-up technique. In this work we have used a novel method of dispersing ceramic particles, while the resin was semi-cured, the vacuum bag was opened up and the resin dispersed and then vacuum bagged again for full curing. The point of semi-curing was important, being cured enough not to flow, but remaining a little bit wet. Another set of samples with coating in a phenolic binder was applied on the surface of the laminates and some extra particles were dispersed on the wet coating, similar to that previously done for glass fiber composites. The flammability and thermal barrier properties are evaluated here in the presence of an ignition source, which is more stringent than the previously [8] employed method without ignition for glass fiber-epoxy composites prepared by the hand lay-up process. The purpose of this study is to understand whether the effect of these particles is specific or independent of the substrate.

2. Materials and Methods

2.1. Materials

2.1.1. Carbon Fiber-Reinforced (CRE) Composite

UMECO MTM45-1/CF0525-36%RW prepregs (Umeco Structural Materials Ltd., Derby, UK), where the resin is high performance toughened epoxy resin, the fiber is carbon in plain-weave ((0/90)s) fabric form, the area density is 193 g/m2, the resin content is 36 wt % and the fiber volume fraction is 54.3%.

2.1.2. Ceramic Micro-Particles for Surface Coatings

Glass flake (Flek): Flekashield (NGF Europe, St Helens, UK), platelets of E-glass of ~5 µm thickness and 10–4000 µm width.
Aluminium titanate (Re): Recoxit (Ohcera. Co., Ltd., Osaka, Japan), a ceramic powder composed of aluminium titanate (Al2TiO5).

2.1.3. Binder

Phenolic resin: DUREZ 33156 (Sumitomo Bakelite Europe, Genk, Belgium), a modified liquid phenolic resin containing phenol (polymer with formaldehyde) (58–78 wt %), ethanol (20–29 wt %) and water (3 wt %).

2.2. Sample Preparation

2.2.1. Carbon Fiber-Reinforced Epoxy (CRE) Composite Laminate

The control sample was prepared by stacking 14 layers of (0/90)s prepregs, vacuum bagging the assembly and curing at 80 °C for 1 h and then increased to 130 °C for 2 h, and finally post-curing at 180 °C for 1 h, keeping the ramp rate at 3 °C/min. These conditions were established based on the manufacturer’s instructions as well as checked from the differential scanning calorimetric (DSC) curve, obtained from testing the sample (~10 mg) in a Q2000 DSC at a heating rate of 5 °C/min over the temperature range of 30–250 °C. The curing exotherm starts at 120 °C and, after a peak at 135 °C, terminates at ~210 °C (see Figure 1). The cured laminates of 2.93 ± 0.05 mm thicknesses had a resin content of 36 wt %, and a fiber volume fraction of 54.3%. To coat the composite with ceramic particles, two approaches were undertaken.

2.2.2. Ceramic Coatings on CRE Composites Using a Phenolic Resin Binder

Ceramic particle coatings were prepared by dispersing the ceramic powders in a phenolic resin binder using appropriate proportions, 20 wt % Flekashield/80 wt % phenolic resin and 70 wt % Recoxit/30 wt % phenolic resin. These ceramic/resin ratios were established from the previous study [8] for each particle type based upon the maximum amount of particle component that can be added into the phenolic binder without adversely affecting the processability of the coating. Ethanol was used (10 wt % w.r.t. mixture of ceramic particles and phenolic resin) in order to reduce the viscosity. The suspension was stirred with a mechanical stirrer for 15 min. A K-bar coater (200 µm spirally wound bar, R.K Print-Coat Instruments Ltd., Royston, UK was used to apply the coating formulation on the CRE composite laminates (size 75 mm × 75 mm). While the resin in the coating was still uncured, dry ceramic particles were deposited on the surface by sieving using either a 50 mesh (300 µm) or a 100 mesh (150 µm), depending on the size of each ceramic particle to achieve 300–420 µm-thick coatings. The coated laminates were cured at room temperature for 12 h and then post-cured at 80 °C for 24 h. These samples are identified in this manuscript as CRE-P/CpS (P = phenolic, Cp = ceramic particle: Flek (Flekashield) or Re = (Recoxit) and S = sieved).

2.2.3. Ceramic Coatings on Semi-Cured CRE Composites

In this technique, the objective was to partially cure the laminate; when the resin is at the stage that it will not flow upon further heating, but still wet enough to act as a binder for the ceramic particles, the particles were deposited on the surface, re-vacuum bagged and then the curing is completed. This would eliminate the use of extra resin to act as a binder for the coating and the coating would become part of the structure. The challenge, however, was to establish the right condition for the semi-curing of the laminate. The curing behavior of this resin with the DSC was studied in detail. As shown in Figure 1, the onset of the exothermic peak (inflection point) is 120 °C, therefore, it is possible to semi-cure the laminate below this temperature. Semi-curing was tried using different conditions by ramping from room temperature to the required temperature and holding at that temperature for the required time. The optimum condition obtained was as follows: semi-curing at 80 °C for 1.5 h; opening the vacuum bag and sieving the ceramic particles on the surface using either a 50 mesh (300 µm) for glass flakes and a 100 mesh (150 µm) for Recoxit particles; vacuum bagging again, and; then curing at 130 °C for 2 h followed by post curing at 180 °C for 1 h. These samples are identified in this manuscript as CRE-Semi/Cp.

2.3. Physical and Morphological Characterization of Coatings

All samples were weighed before and after coating application, and the wt % ceramic deposited on the surface was calculated as discussed elsewhere [7,8]. The thicknesses of coatings were obtained from the difference of thicknesses of coated and uncoated samples, measured using a 0–25 mm digital Vernier calipers. The morphologies of coatings were studied using digital images and scanning electron microscopy (SEM, Hitachi Technologies Model 3400, Accurion GmbH, Göttingen, Germany) with accelerating voltage capacity 1–30 kV and magnification ranges between 10× to 300,000× at 30 kV, providing resolution down to 10 µm.

2.4. Flammability and Thermal Barrier Study

The flammability of CRE composite laminates with/without surface coatings was evaluated in a cone calorimeter (Fire Testing technology, East Grinstead, UK). Three 75 mm square specimens of each sample were tested by exposing them to 35 and 50 kW/m2 heat fluxes in the horizontal mode with a spark ignition. In order to study the thermal barrier properties and thermal resistance of each type of ceramic coating, three K-type thermocouples were placed, one on top of the surface coating and two on the reverse side of samples. The thermocouples recorded temperature as a function of time for the duration of exposure to various heat fluxes.

2.5. Durability of Coatings

To evaluate the effect of water on coatings, the coated samples were studied by the water-soak test, according to the BS EN ISO 2812-2:2007 standard [9]. The four edges of GRE composite (35 mm × 35 mm specimen) with and without surface coatings were sealed by applying epoxy resin before testing. After this, the samples were fully immersed in 100 mL of deionized-water at RT and removed after 24 h. Finally, the samples were dried at RT for 24 h and then at 100 °C for 2 h.
A tape pull test was performed to evaluate the adhesion between a coating and the laminates, similar to the ones specified in BS EN ISO 2409:2007 [10] and ASTM D3359 [11], which are often used to examine the adhesion of films or sheets to an adhesive [12]. A piece of Sellotape® (25 mm × 50 mm size) was applied on the surface of the coated laminate (75 mm × 75 mm size) and smoothed with fingers to ensure good contact. Holding the sample with one hand, the tape was then peeled back to 180° angle in one smooth movement with the other hand. The test was repeated at three different locations on the same sample for each coated sample.

2.6. Mechanical Testing

In order to study fracture of the coating after applied impact loading, the coated samples were tested with a Instron-Dynatup 9250 HV drop weight impact with a 16 mm diameter hemispherical tup. The steel impactor had a mass of 4.62 kg and dropped from a height of 110 mm to produce an impact velocity of 1.46 m/s and 5 J of impact energy loading. The low (5 J) impact energy chosen, as opposed to the 9–18 J usually used for 3 mm-thick quasi-isotropic carbon fiber-reinforced composites, was to assess the damage to the coating without causing damage to the substrate. During the test, the high-speed data acquisition system has the capability of storing the entire impact event and hence measured acceleration/ deceleration as a function of time. From this raw data, using numerical integration, the load-time, load-deflection, and energy-time curves were produced. The digital images of the samples after the impact tests were studied to investigate the damage to the coatings. Two replicate specimens of each sample were tested, and then the impact modulus (Ei) of each sample was calculated using Equation (1).
E i = 3 D 2 4 π h 3 ( K )
where: D = diameter of hole of the sample holder; h = thickness; K = initial stiffness determined from the load vs. deflection curve.
A three-point bending test was carried out to determine the flexural modulus of the composites with/without surface coatings at room temperature using a Universal Instron 3369 machine. A specimen size of 125 mm × 13 mm was used for this test. The thickness varied depending on the type of coating. The tests on all samples were performed in a displacement-controlled mode with a 100 N load cell applied at 1 mm/min until the flexural deflection reaches 2 mm. The length span between the supports was 100 mm, and the load was applied at the midpoint of the coating surface of the specimen. This test condition (load strain) was such that the composites could fully recover their original flexural properties. To confirm that the test specimens completely recovered, three loading-unloading cycles were performed on each specimen. During the test, the high-speed data acquisition system stored the entire flexural bending event and then produces load vs. displacement curves. The flexural modulus (Ef) of the samples was calculated based upon the engineers’ bending theory [13], as presented in Equation (2).
E f = L 3 4 b h 3 ( K )
where: L = the test span; h = thickness; b = width; K = initial stiffness determined from the load vs. displacement curve.
The effect of radiant heat on the flexural properties of CRE composites specimens was investigated by exposing the coated surface of the composite laminate specimens (125 mm × 13 mm) to 35 kW/m2 in a cone calorimeter for 120 and 240 s. Two replicate specimens of each sample were tested. The selected radiant heat flux and times were to ensure that the sample would not ignite. After the heat exposure, the samples were cooled down to room temperature, and then the flexural test was performed in the three-point bending mode with conditions similar to that used for non-heat-damaged samples. The flexural load was applied on the heat-damaged surface so that the damaged surface would bear the compressive strain. The flexural modulus after heat exposure was calculated using the original thickness of the sample, since it was difficult to measure the coherent thickness after heat exposure. However, in the damaged samples there was a minimal change in the thickness after heat exposure. The observed flexural moduli were then compared to the values measured prior to heat exposure.

3. Results and Discussion

3.1. Surface Characterisation

The thicknesses and mass of the coatings, measured using digital calipers and mass balance, respectively, are given in Table 1. Since each laminate was individually coated, there was a variation in thickness and the ceramic particle deposition (wt %) of each coating on each composite sample. As can be seen from results in Table 1, when ceramic particles are applied as a surface coating on the laminate (as a finished product), the % deposition was lower than that when applied on semi-cured laminates. In semi-cured samples more particles can be absorbed by the semi-cured resin, whereas when used as a surface coating only a limited amount can be applied as a thin coating on the surface; the resin binder in the coating also only aids a limited amount of extra particles on the coated surface that have been applied via dispersing using a sieve. In both cases, however, there was a limit as to the amount of ceramic particles that could be deposited on the surface. The thickness of the coating containing Flekashield was higher in semi-cured product, whereas the thickness of Recoxit containing coatings is less affected by the method of preparation, which could be due to the small particle size (4 μm) of the latter. The thicknesses of the surface coatings, however, are similar (within the experimental error range) to those for glass composites as reported previously [8].
Digital photographs and SEM images of the coated samples (Figure 2) also indicate that with both methods, coatings are uniform and fully cover the surfaces of the laminates. The morphology of the surface-coated surfaces are different from the semi-cured samples. While in the former a coating layer can be clearly seen in the digital images, in the semi-cured samples, particles are embedded in the resin and are an integral part of the structure. The large-sized (300–400 µm) platelets of Flekashield can be clearly seen in SEMs of higher magnification, whereas Recoxit particles, being small (4 µm), have smooth surfaces. The morphologies of coated surfaces (CRE-P/Flek-S and CRE-P/ReS) are very similar to those observed previously for glass composites [8].

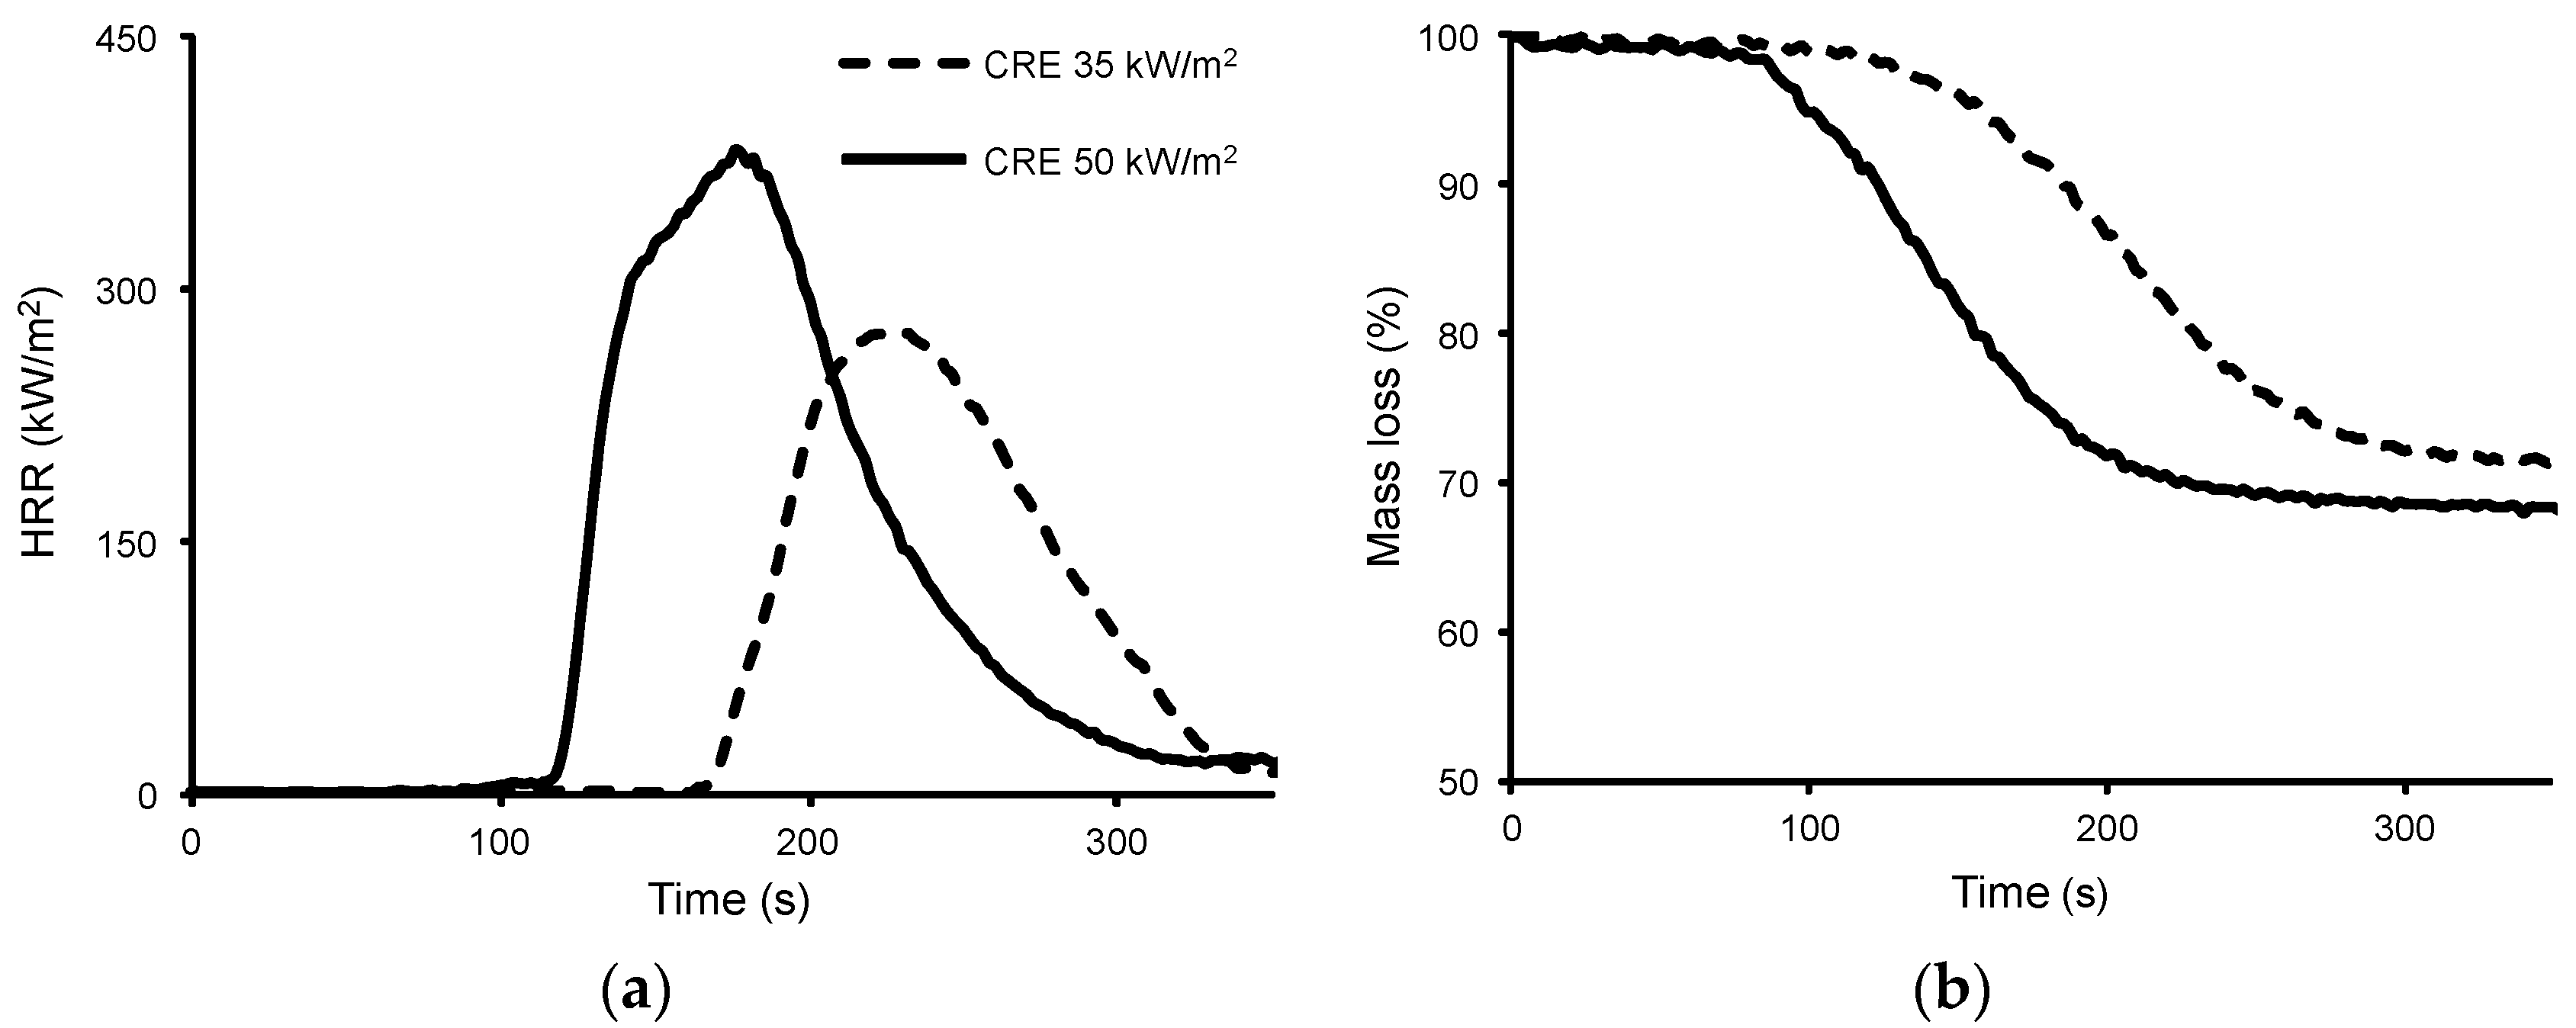
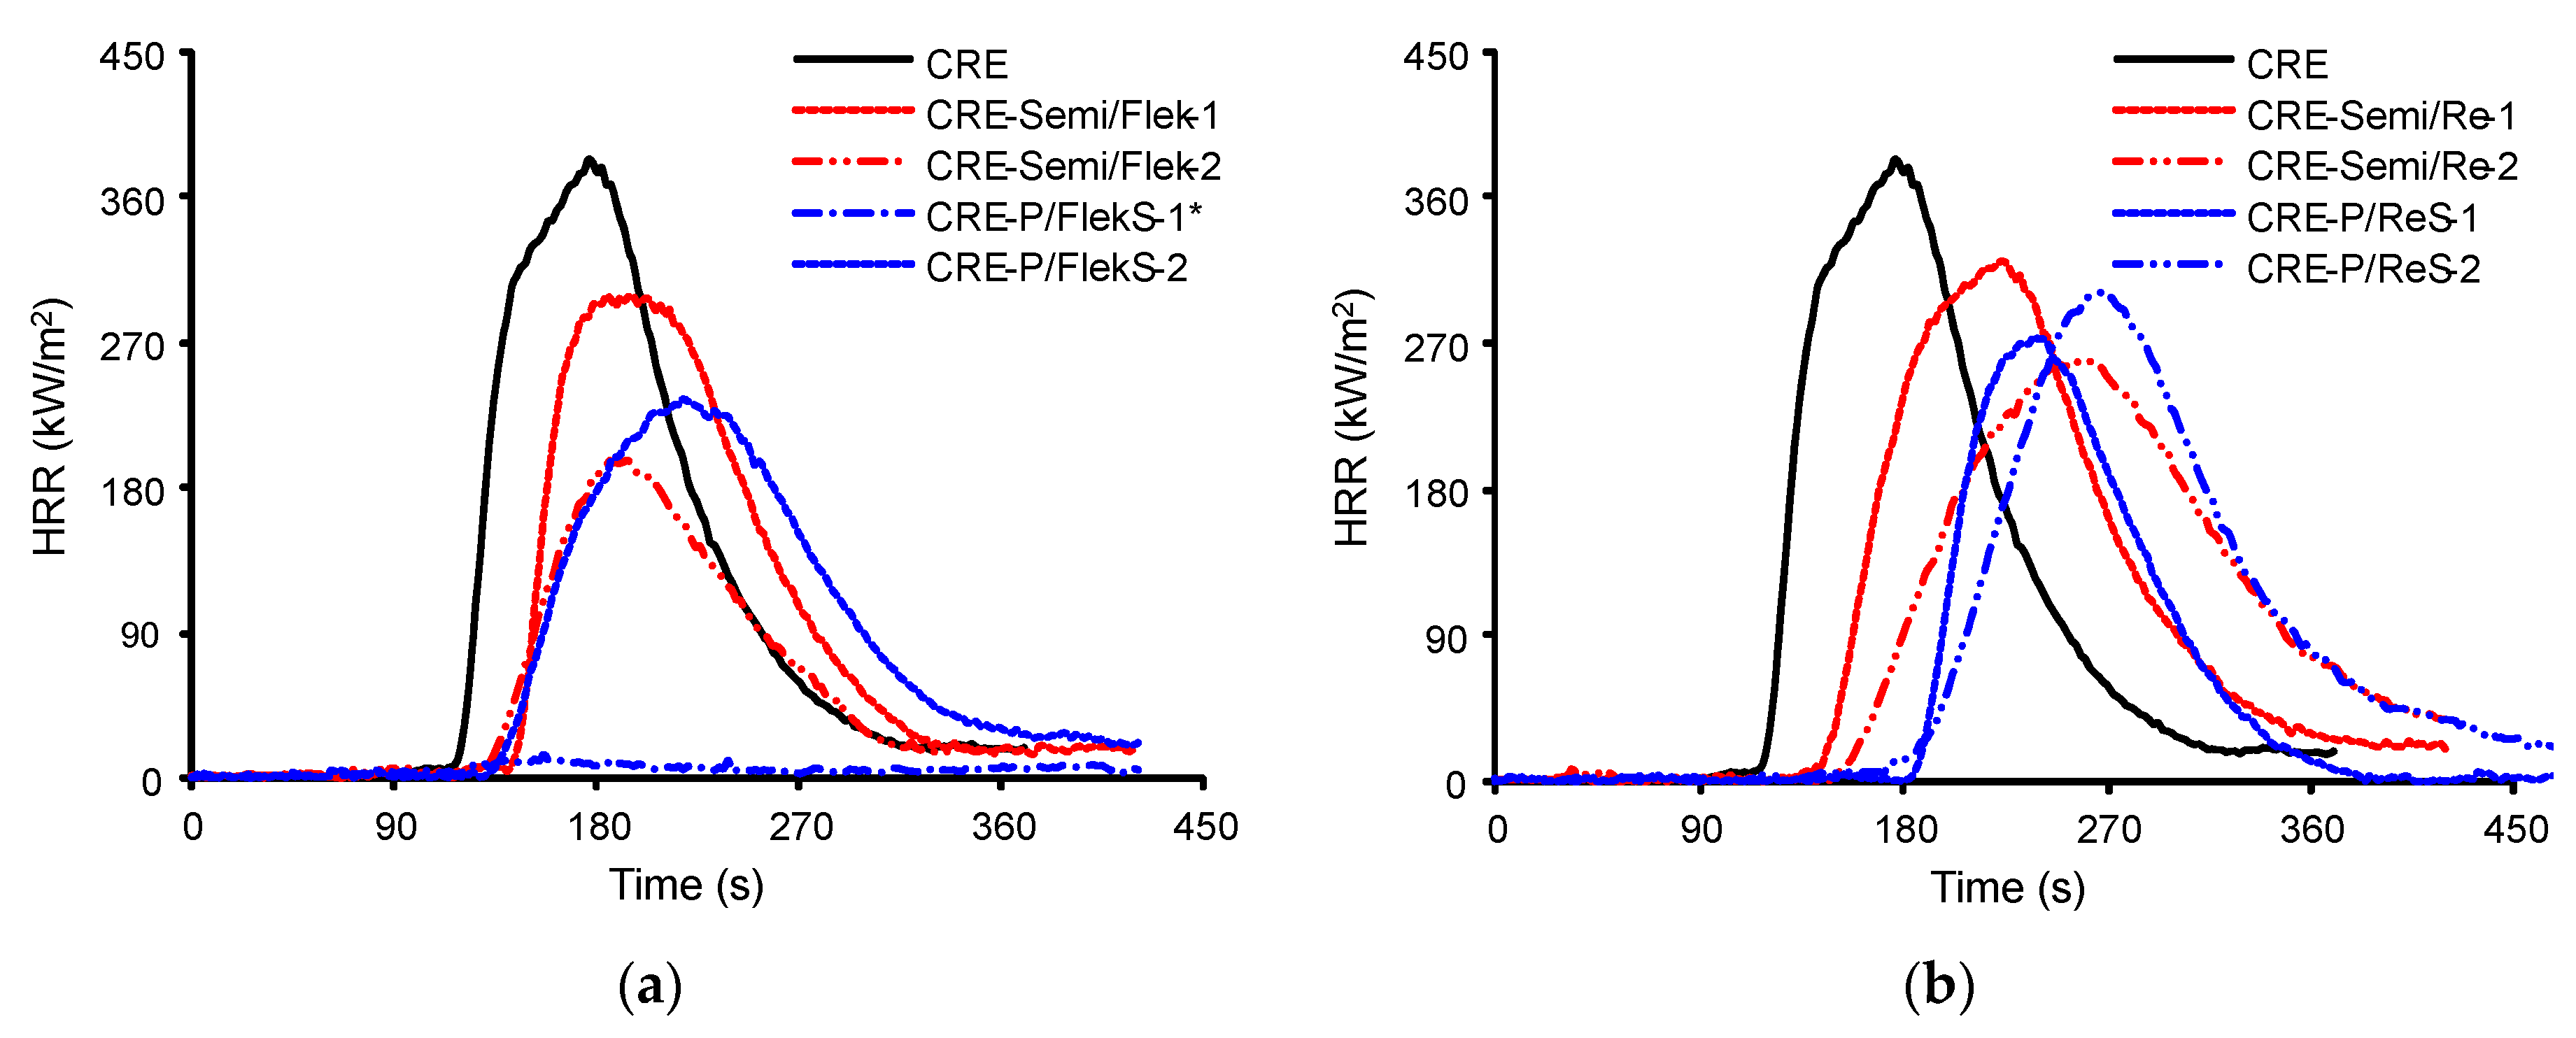
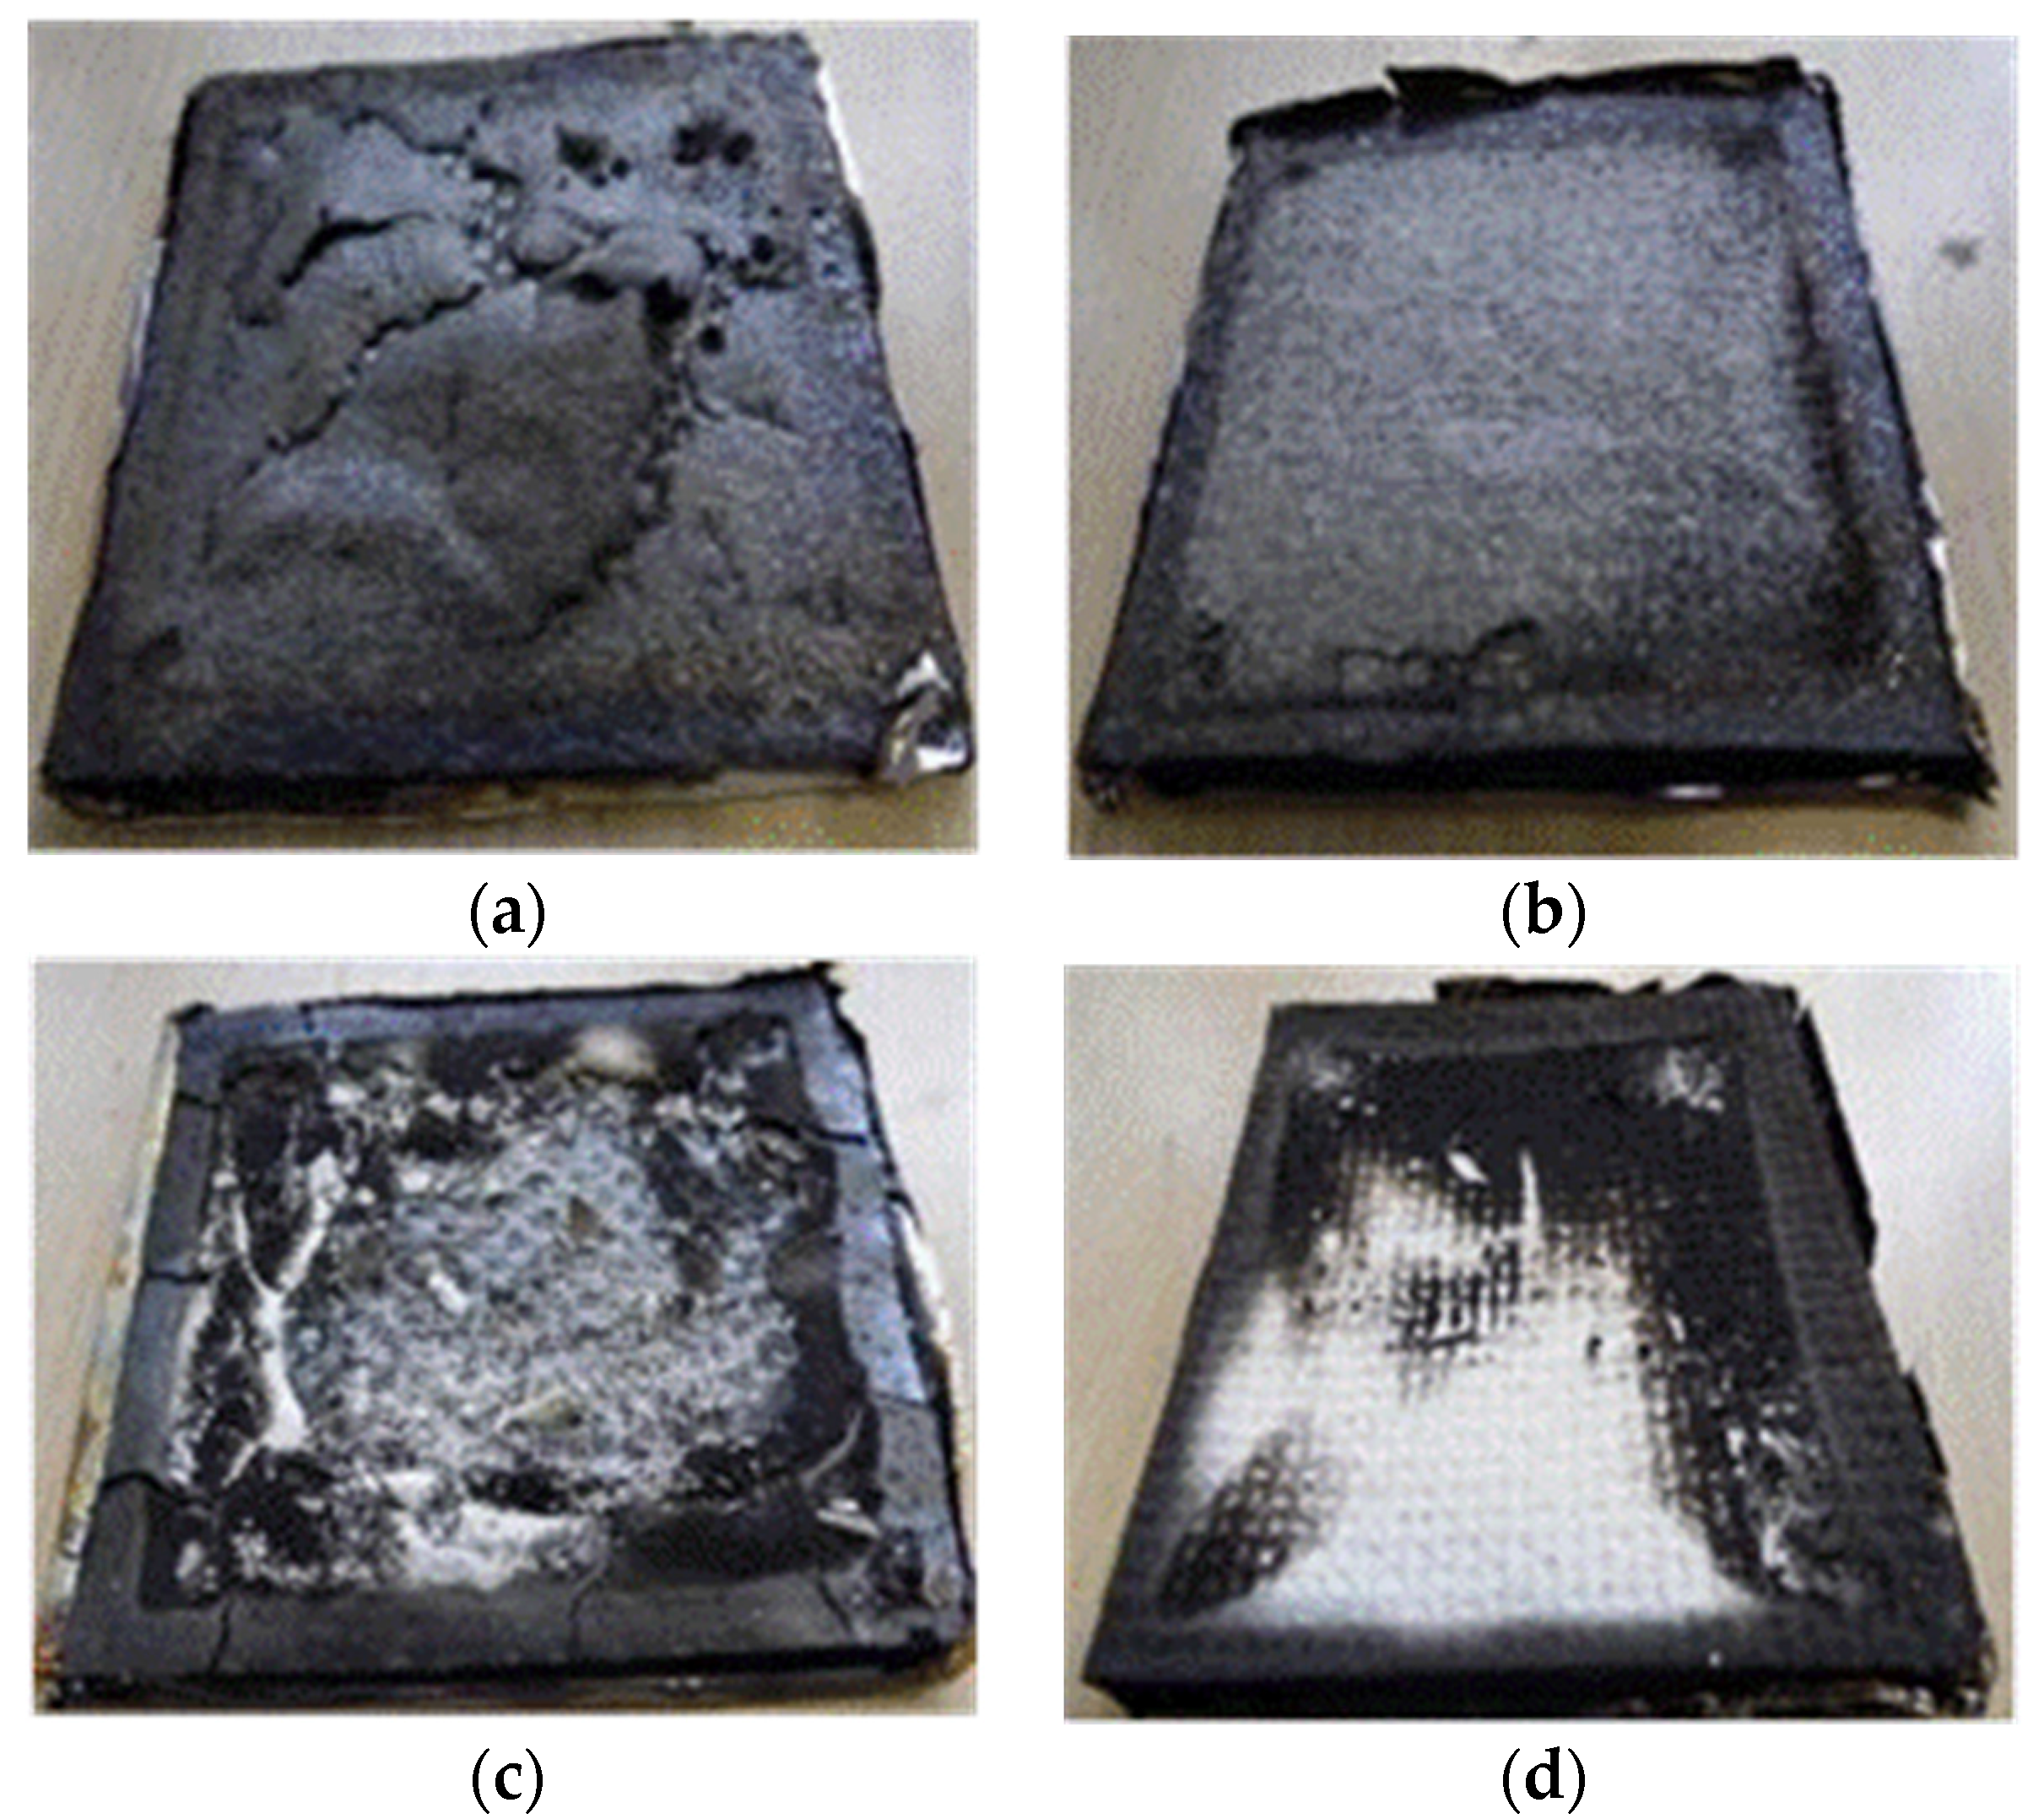
3.2. Flammability and Thermal Barrier Study

The flammability results of the control CRE sample evaluated by cone calorimetry at 35 and 50 kW/m2 heat fluxes are given in Table 2, the important parameters relevant to evaluating the thermal barrier efficiency of surface coatings providing passive fire protection being time-to-ignition (TTI), peak heat release rate (PHRR), time-to-PHRR (TPHRR) and total heat release (THR) values [7,14]. The heat release rate (HRR) versus time curves, from which these parameters are obtained, are shown in Figure 3 and Figure 4. The control sample ignited at both heat fluxes, as expected. The TTI in CRE is reduced from 173 s at 35 kW/m2 to 106 s at 50 kW/m2. Once ignited, the HRR starts increasing, reaching a peak value and then starts decreasing before reaching the minimum, representing the end of burning process. With the increase in heat flux, the PHRR value increased from 302 kW/m2 at 35 kW/m2 to 358 kW/m2 at 50 kW/m2, while TPHRR decreased from 218 to 174 s and THR increased from 32.1 to 36.3 MJ/m2. The rationale for this behavior is related to the fact that the net heat flux on the exposed laminate surface considerably increases with the increasing incident heat flux. This leads to an accelerated increase in surface temperature, thereby considerably increasing the rate of resin decomposition. Thus, the critical volatile mass flux is achieved earlier, thereby providing ideal thermodynamic conditions that can sustain ignition [7,14]. This behavior is also observed from mass loss results in Figure 3b, where the mass loss occurs at an earlier time and at an enhanced rate.
The burning intensity of GRE composite laminates reported previously in reference [8], prepared using the hand lay-up process (with resin content 50 wt %) ,was much higher than the CREs, igniting much earlier (104 and 48s at 35 and 50 kW/m2, respectively) even in the absence of the spark ignition, having much higher PHRR (526 and 691 kW/m2 at 35 and 50 kW/m2, respectively), but comparable THR (36.8 and 38.4 MJ/m2 at 35 and 50 kW/m2, respectively), and slight differences in THR that are due to different resin contents. The higher flammability of the GREs is due to several reasons, these being: fabrication was done using the hand lay-up process, leading to a greater resin content, the use of a bifunctional epoxy resin, fewer glass fiber layers (8) compared to the 14 carbon fabric layers in the latter and the different area densities of the fabrics.
The cone results for ceramic particles coated laminates are given in Table 2, and HRR versus time curves at 50 kW/m2 are shown in Figure 4. Since the small specimens (75 mm × 75 mm) were individually surface-coated, there are slight variations in the thicknesses of coatings (±20–45µm) as well as their uniformity, hence the variation in the cone results. The results of replicate specimens are given to demonstrate this effect. The samples with ceramic particles deposited during the semi-curing stage were also of small sizes (75 mm × 75 mm), but four specimens from each of the 150 mm × 150 mm laminates were obtained, hence the variation in coating thickness in those samples are less (±14 µm).
The effect of Flekashield on CRE composites is quite obvious. When the surface coating is on the surface of the laminate in sample CRE-P/FlekS, one out of three samples did not ignite at 35 kW/m2, showing no PHRR and THR. For the two samples which ignited, the TTI was not affected, the PHRR was decreased and TPFRR increased, but the THR increased. This behavior is usually observed from surface coatings providing passive fire protection, i.e., they show their thermal barrier efficiency by the decrease in PHRR and increase in TPFRR, whereas the burn time, THR and smoke production are increased due to slow and prolonged burning [7,8,14]. If a coating, however, acts as a flame retardant system, the cone results should increase in TTI (preferably no ignition) and see a reduction in PHRR, THR, mass loss rate and smoke production. Similar behavior at 35 kW/m2 was also shown at 50 kW/m2 heat flux (Figure 4).
When Flekashield is used in semi-curing stage (sample CRE-Semi/Flek), the TTI is increased from 173 s in the control to 269 s in the two specimens (55% increase) at 35 kW/m2. PHRR is decreased from 302 to 230 kW/m2 (~24% w.r.t. control), TPHRR is increased from 218 to 355 s (63% increase), however, the THR also decreases from 32.1 to 17.4 MJ/m2 (46% decrease). The effect is similar at 50 kW/m2 heat flux. The better thermal barrier performance of CRE-Semi/Flek than CRE-P/FlekS can be explained due to a higher concentration of Fleaeshield in the former (12.9 wt %) than the latter (1.7 wt %); see Table 1. However, even in such a low concentration of Flekashield, in CRE-P/FlekS one specimen did not ignite, which is due to the fact that the Flekashield particles completely cover the surface. In CRE-Semi/Flek, while the particles are deposited when it is nearly cured, some particles may have penetrated the resin, hence the resin could be on the surface and thus, ignite.
Samples containing Recoxit also showed very good behavior. At 35 kW/m2, the heat flux for CRE-PReS, one specimen did not ignite and in other two TTI increased to 250 s. However, for the sample which ignited, there was not much effect on PHRR, but the TPHRR increased. At 50 kW/m2, the effect was more pronounced, i.e., TTI and TPHRR increased while PHRR and THR decreased. In the case of CRE-Semi/Re, all specimens ignited, but the TTI was increased to 262s, PHRR decreased to 289 kW/m2, TPHRR increased to 306 s and THR decreased to 29.9 MJ/m2. The improved thermal barrier efficiency of the coating in this sample compared to that in the CRE-PReS sample is due to a higher concentration of Recoxit particles in the former (see Table 1).
The mass loss curves during the cone experiment at 35 and 50 kW/m2 also showed the thermal barrier effect of all the ceramic particle coatings. As clearly seen in Figure 5, at 50 kW/m2, all ceramic-coated samples significantly retarded the mass loss rate when compared to the control sample. The difference between surface-coated and semi-cured samples, and those between Flekashield and Recoxit particles, was dependent upon the quantity of particles on the surface. The trends observed are similar to those observed for other parameters discussed above.
On comparing Flekashield and Recoxit, Flekashield is more effective as a thermal barrier, even at low concentrations. This can be explained by the fact that at higher temperature (>350 °C), the glass frits melt on the surface, forming a thick, glassy coating [8,15], which acts as an effective physical and thermal barrier. The layer on the surface remaining after the test can be clearly seen in Figure 6a. The charred layer is thicker and fragmented in CRE-P/FlekS because all the particles embedded in phenolic resin layer were on the surface, the char is due to the phenolic resin. In the case of CRE-Semi/Flek, the melted glass layer on the surface can be clearly seen. Similar behavior is observed in the samples containing Recoxit where the surface-coated sample has some charring (mainly due to phenolic resin) and particles, whereas in CRE-Semi/Re ceramic particles on the surface are present, but the concentration is much less than that in CRE-Semi/Flek.
The effect of these ceramic particles as surface coatings on CRE and glass composites (GRE) cannot be directly compared because, in the case of the CRE samples spark ignition was used, whereas previously reported GRE samples were tested in the absence of a spark ignition. However, the fact that CRE-P/FlekS and CRE-P/ReS results are comparable and, in some cases better, than respective GRE samples, indicates the improved effectiveness of the particles on CRE composites, the mass of ceramic particles on both types (CRE-P/Flek or Re and GRE-P/Flek or Re) being similar considering the experimental error (Table 1 and [8]). Out of the two specimens of CRE-P/FlekS, one did not ignite at 50 kW/m2, and the other one which ignited had 34% and 15% reduction in PHRR and THR, respectively, w.r.t control CRE compared to GRE-P/FlekS, which had an 11%–22% reduction in PHRR and a 2%–21% increase in THR. CRE-P/ReS had 91 s increase in TTI, a 20% reduction in PHRR and a 14% reduction in THR w.r.t CRE compared to a 19–57 s increase in TTI, a 14%–18% decrease in PHRR and a 21%–28.6% increase in THR in GRE sample. These results show that at lower heat fluxes (≤35 kW/m2), the effect of ceramic particles is similar providing they cover the surface of the substrate completely; however, at higher heat fluxes they are more effective on less flammable substrates.

3.3. Thermal Barrier Properties

As seen from the above study, for any surface coating to act as an effective barrier, it should prevent or delay heat transfer through the underlying laminate. Hence, the temperature profiles of the surface (TS) and the reverse side (TR) of the laminate using thermocouples during cone experiments at 35 kW/m2 heat flux were recorded. The time taken for the insulated/reverse surface of the exposed CRE laminates to reach the glass transition temperature of a typical epoxy resin (180 °C), the onset of decomposition temperature (250 °C), and the temperature around which maximum degradation occurs are given in Table 3. It should be noted that these are the approximate temperatures for a range of different epoxy types and not necessarily for the resin used in this case. As can be seen from the Table 3 that the time to reach these temperatures is greatly increased in Flekashield samples and in both cases (Flekashield and Recoxit samples), surface-coated samples are better that semi-cured ones. The results for surface-coated samples with Recoxit are comparable with GRE samples reported previously [8].

3.4. Durability of Coatings

The effect of water on the durability of these ceramic coatings was studied by a water soak test and the results are reported in Table 4 in terms of the weight change after the test. The results show that after the water-soak test for 24 h and drying the samples at room temperature for 24 h, all the coated samples had minimal weight loss, (~0.02%–0.11%). Subsequently, after drying in an oven at 100 °C, only a very small further weight loss was observed. There was little difference between the surface-coated and semi-cured samples, and they are comparable to those for respective GRE composites [8].
The adhesion between the CRE surface and each coating was observed by the tape pull test, and the results of the weight loss percentage and the coating peeled percentage after the tape pull test for all the coated samples are reported in Table 4. There is minimal weight loss after the tape pull test. As observed from the results, there is slightly more peeling in the surface-coated samples than for the semi-cured, the effect, however, is small. This shows that with both methods very durable coatings could be obtained.

3.5. Effect of the Coatings on the Mechanical Properties of the Composites

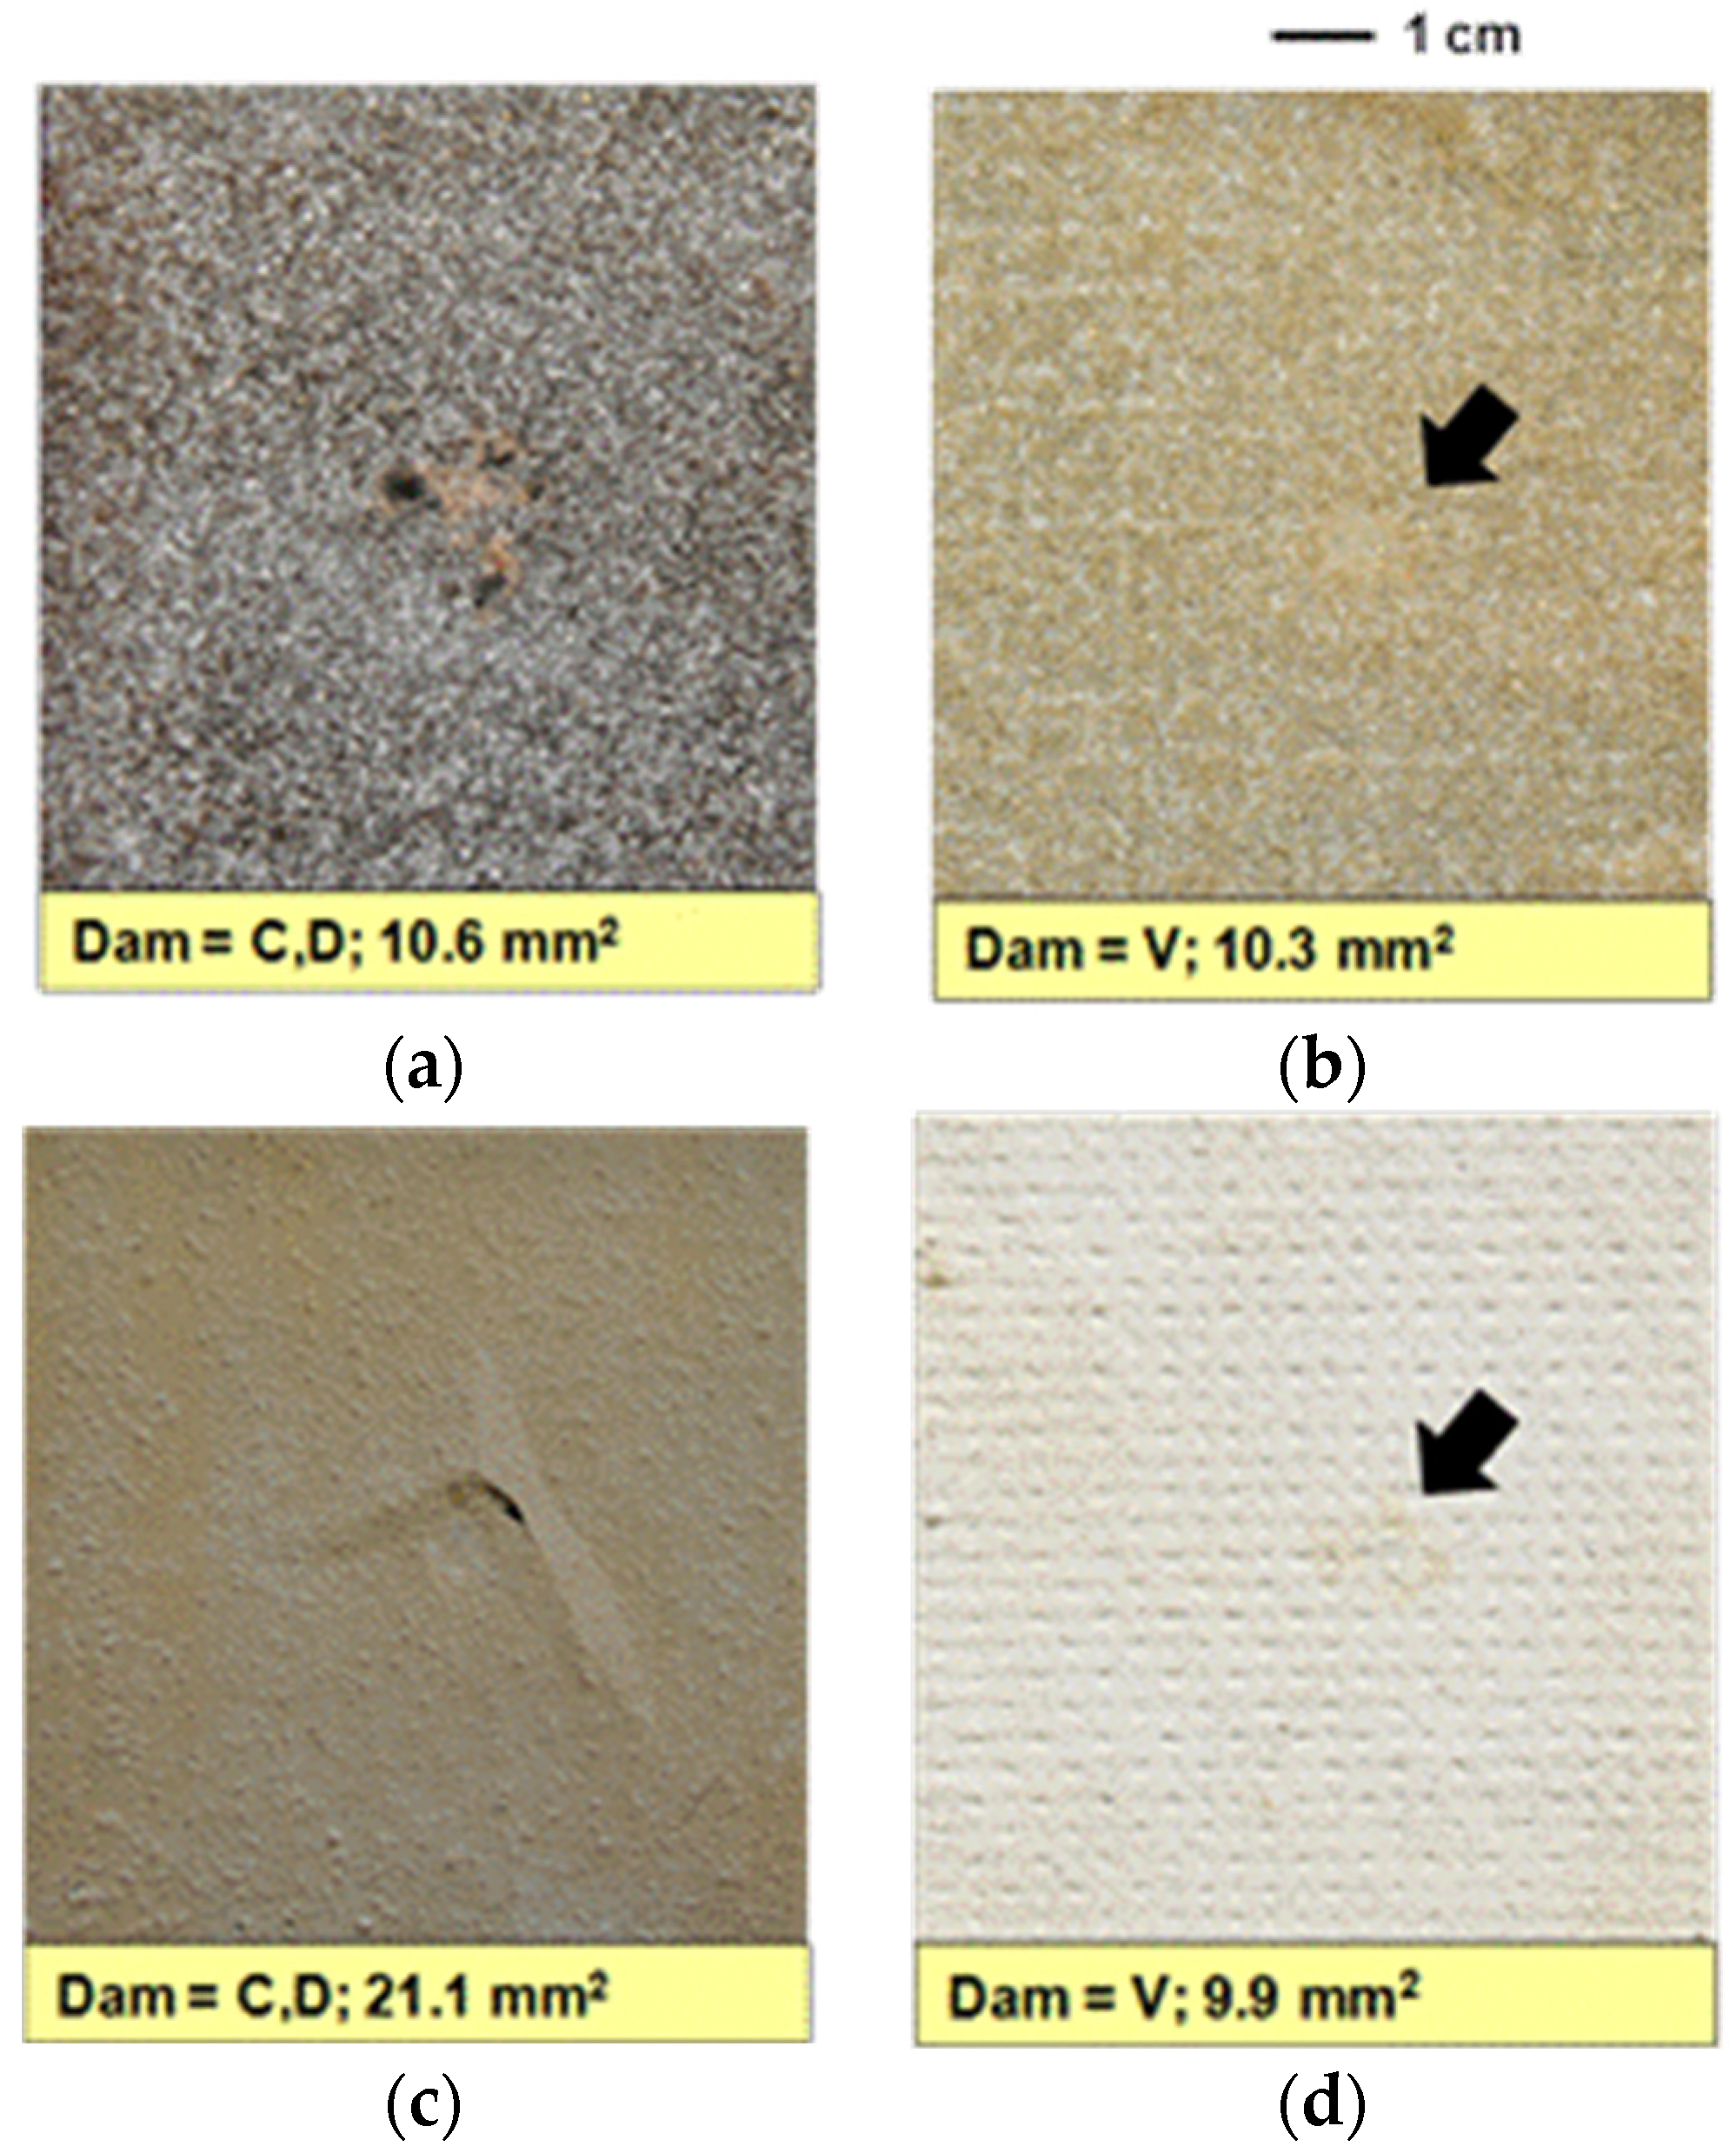
3.5.1. Impact Properties

The effect of the impact due to the concentrated load that can influence the morphology of the surface coatings was studied by a 5 J energy impact test. The morphologies of the post-impact samples were examined using a digital camera with the aim of establishing the fractures of the coatings, such as the cracking and debonding of the coatings due to the indentation stress from the impact event. The area damaged by the drop test was analyzed using Image J analysis image software. The images and results are presented in Figure 7. The results show that with 5 J impact energy impact there is no damage observed in semi-cured samples, whereas for surface-coated samples, the coating cracked/debonded. This behavior is very similar to that observed previously for GRE composites [8]. All CRE samples were cut through the damaged areas to evaluate any internal damage by examining their cross sections using an optical microscope. No internal damage was observed in any of the samples including the control, CRE.
During the impact test, load–deflection curves were also obtained, and from the initial part of the test the effective impact modulus (Ei) of each sample was calculated and results are presented in Table 5. As can be seen from results, surface coatings (samples CRE-P/FlekS and CRE-P/ReS) demonstrated a slightly reduced modulus, the effect, though, is very small. However, when the coatings are prepared during the semi-curing stage, there is a further slight decrease. This could be due to the fact that the particle content and voidage are higher in the latter.

3.5.2. Flexural Properties

The flexural moduli of all samples were calculated from the gradients of the load-deflection curves up to a maximum strain of 0.2% and are presented in Table 5. The effect of ceramic particles on the flexural modulus is minimal and within the experimental error range.
The effect of radiant heat on the mechanical properties of the composites was investigated by exposing samples to a cone heater (cone calorimeter) at 35 kW/m2 for 120 and 240 s, and then measuring the residual flexural modulus of the samples by the three-point bending tests. The flexural load was applied on the heat-damaged surface so that the damaged surface would bear the compressive strain. While calculating the residual flexural modulus, the original thickness of the sample was used. There was no significant difference between the thickness after heat exposure and that obtained at room temperature (prior to heat exposure). The post-heat flexural moduli of all CRE samples are given in Table 5. The results show that control sample loses flexural performance after exposure to heat, retaining only 68% after 120 s and 19% after 240 s. All coated samples could retain >78% after 120 s. At 240 s, surface coated samples retained only 16%–22%, whereas semi-cured resins could maintain more than 36% modulus.

4. Conclusions

This work has shown that Flekashield and Recoxit samples work effectively as thermal barriers on carbon fiber composites as was previously demonstrated for glass fiber composites. The carbon fiber based composites were manufactured from prepreg sheets. Two methods of application for depositing ceramic particles were employed, one where ceramic particles were dispersed on semi-cured laminate and the other where their dispersion was in a phenolic resin that was applied on the laminate surface. With both methods, uniform coatings could be achieved, which were durable to water, peeling and also to low energy impact. The effect of coatings on mechanical properties of the laminate was minimal, which is important for their potential use in commercial applications. While all coatings could reduce PHRR, increase TPHRR and delay the rise in temperature at the back surface of the sample of the laminate at 180 °C (glass transition temperature of a typical epoxy) and 250 °C (onset of decomposition temperature of a typical epoxy) when exposed to 35 and 50kW/m2 in a cone calorimeter, the best performance was shown by coatings containing Flekashield.
The effect of the substrate was also studied by comparing with previously reported results for glass fiber composites. At lower heat fluxes (≤35 kW/m2), the thermal ceramic particles act more efficiently and the effect of substrate is minimal as long as the ceramic particles cover the surface of the substrate completely. However, at higher heat fluxes, they are more effective on the less flammable carbon fiber composite substrate.

Acknowledgments

One of the authors, Forkan Sarker is thankful to the United Nations Industrial Development Organisation (UNIDO), Bangladesh for funding his MSc programme at University of Bolton.

Author Contributions

Baljinder Kandola conceived and designed the research project, helped interpreting the results and wrote the paper; Forkan Sarker prepared the samples, conducted and analysed the flammability and some mechanical tests; Piyanuch Luangtriratana helped in experimental work and conducted impact tests; Peter Myler helped in analysing and interpreting all the mechanical test results.

Conflicts of Interest

The authors declare no conflict of interest.

References

  1. Kandola, B.K.; Kandare, E. Composites having improved fire resistance. In Advances in Fire Retardant Materials; Horrocks, A.R., Price, D., Eds.; Woodhead Publishers: Cambridge, UK, 2008; pp. 398–442. [Google Scholar]
  2. Kandola, B.K.; Horrocks, A.R. Composites. In Fire Retardant Materials; Horrocks, A.R., Price, D., Eds.; Woodhead Publishing Ltd.: Cambridge, UK, 2001; pp. 182–203. [Google Scholar]
  3. Henderson, J.B.; Wiebelt, J.A.; Tant, M.R. A model for thermal response of polymer composite materials with experimental verifications. J. Compos. Mater. 1965, 19, 579–595. [Google Scholar] [CrossRef]
  4. Mouritz, A.P.; Feih, S.; Kandare, E.; Mathys, Z.; Gibson, A.G.; Des Jardin, P.; Case, S.W.; Lattimer, B.Y. Review of fire structural modelling of polymer composites. Compos. Part A Appl. Sci. Manuf. 2009, 40, 1800–1814. [Google Scholar] [CrossRef]
  5. Kandare, E.; Kandola, B.K.; McCarthy, E.D.; Myler, P.; Edwards, G.; Jifeng, Y.; Wang, Y.C. Thermo-mechanical responses of fibre-reinforced epoxy composites exposed to high temperature. Part II: Modelling mechanical property degradation. J. Compos. Mater. 2010, 45, 1511–1521. [Google Scholar] [CrossRef]
  6. Katsoulis, C.; Kandare, E.; Kandola, B.K. The effect of nanoparticles on structural morphology, thermal and flammability properties of two epoxy resins with different functionalities. Polym. Degrdn. Stab. 2011, 96, 529–540. [Google Scholar] [CrossRef]
  7. Kandola, B.K.; Luangtriratana, P. Evaluation of thermal barrier effect of ceramic microparticulate surface coatings on glass fibre-reinforced epoxy composites. Compos. Part B Eng. 2014, 66, 381–387. [Google Scholar] [CrossRef]
  8. Luangtriratana, P.; Kandola, B.K.; Myler, P. Ceramic particulate thermal barrier surface coatings for glass fibre-reinforced epoxy composites. Mater. Des. 2015, 68, 232–244. [Google Scholar] [CrossRef]
  9. BS EN ISO 2812-2 Paints and Varnishes: Determination of Resistance to Liquids: Water Immersion Method; British Standards Institute: London, UK, 2007.
  10. BS EN ISO 2409 Paints and Varnishes-Cross Cut Test; British Standards Institute: London, UK, 2007.
  11. ASTM D3359-08 Standard Test Methods for Measuring Adhesion by Tape Test; American Society for Testing and Materials: West Conshohocken, PA, USA, 2008.
  12. Zhang, Y.; Hazelton, D.W.; Knoll, A.R.; Duval, J.M.; Brownsey, P.; Repnoy, S.; Soloveichik, S.; Sundaram, A.; McClure, R.B.; Majkic, G.; et al. Adhesion strength study of IBAD–MOCVD-based 2G HTS wire using a peel test. Phys. C Supercond. 2012, 473, 41–47. [Google Scholar] [CrossRef]
  13. Tsai, W.; Hahn, H.T. Introduction to Composite Materials; Technomic Publishing Co. Inc.: Stamford, CT, USA, 1980; pp. 167–216. [Google Scholar]
  14. Kandola, B.K.; Bhatti, W.; Kandare, E. A comparative study on the efficacy of varied surface coatings in fireproofing glass/epoxy composites. Polym. Degrad. Stab. 2012, 97, 2418–2427. [Google Scholar] [CrossRef]
  15. Kandola, B.K.; Pornwannachai, W. Enhancement of passive fire protection ability of inorganic fire retardants in vinyl ester resin using glass frit synergists. J. Fire Sci. 2010, 28, 357–381. [Google Scholar] [CrossRef]
Figure 1. Differential scanning calorimetric (DSC) curve of UMECO MTM-45-1 prepregs.
Coatings 06 00022 g001
Figure 2. Digital photographs (i) and scanning electron microscopy (SEM) (iiiv) images of (a) CRE-P/FlekS, (b) CRE-Semi/Flek, (c) CRE-P/ReS and (d) CRE-Semi/Re sample surfaces at various magnifications.
Coatings 06 00022 g002
Figure 3. (a) Heat release rate (HRR) and (b) mass loss versus time curves of the control CRE at 35 and 50 kW/m2 heat fluxes.
Coatings 06 00022 g003
Figure 4. Heat release rate (HRR) versus time curves of the control and coated samples with (a) Flekashield and (b) Recoxit particles at 50 kW/m2 heat flux.
Coatings 06 00022 g004
Figure 5. Mass loss versus time curves of the control and coated samples with (a) Flekashield and (b) Recoxit particles at 50 kW/m2 heat flux.
Coatings 06 00022 g005
Figure 6. Digital images of the char residues of (a) CRE-P/FlekS, (b) CRE-Semi/Flek, (c) CRE-P/ReS and (d) CRE-Semi/Re samples after the cone test at 50 kW/m2 heat flux.
Coatings 06 00022 g006
Figure 7. Images of impact damage and damage observations (see inset description) on the front (impacted side) of (a) CRE-P/FlekS, (b) CRE-Semi/Flek, (c) CRE-P/ReS and (d) CRE-Semi/Re samples after 5 J drop-weight impact tests. Damage observation (Dam) is as follows: V, visible surface damage (the coating is damaged by impact tup at a local area); D, debonding of coating, and; C, cracking of coating. Area of the damage (measured by image analysis software) is given as mm2.
Coatings 06 00022 g007
Table 1. Physical properties of the carbon fiber-reinforced (CRE) composite (75 mm × 150 mm plaque) samples and the coatings applied on the surfaces of the composite samples. P = phenolic, Cp = ceramic particle: Flek (Flekashield) or Re = (Recoxit) and S = sieved.
SampleCeramic Particle and SizeCoating Thickness (µm)Mass of Coating (g)Ceramic Particle Deposited (wt %, w.r.t laminate)
CRE-P/FlekSFlekashield (300–400 µm)335 ± 203.55 ± 0.041.67 ± 0.61
CRE-Semi/Flek470 ± 136.20 ± 0.5012.90 ± 0.52
CRE-P/ReSRecoxit (4 µm)510 ± 456.40 ± 0.4012.92 ± 0.40
CRE-Semi/Re413 ± 1411.35 ± 0.8221.76 ± 0.72
Table 2. Cone calorimetric data for control and all coated samples at 35 and 50 kW/m2 heat flux.
SampleSpecimen No.TTI (s)TTI (s)PHRR (kW/m²)TPHRR (s)THR (MJ/m²)
35 kW/m2 heat flux
CRE1, 2, 3173 ± 14312 ± 17302 ± 16218 ± 1732.1 ± 2.8
CRE-P/FlekS1, 2172 ± 15331 ± 16258 ± 5255 ± 2533.0 ± 0.8
3 *1.5
CRE-Semi/Flek1, 2269 ± 1443 ± 10230 ± 14355 ± 4317.4 ± 1.9
324643127531230.5
CRE-P/ReS1, 3250 ± 1420 ± 37315 ± 53301 ± 733.8 ± 5.1
2 * 2.1
CRE-Semi/Re1, 2, 3262 ± 11451 ± 13289 ± 21306 ± 429.7 ± 3.1
50 kW/m2 heat flux
CRE1, 2106 ± 14255 ± 34358 ± 25174 ± 236.3 ± 0.7
CRE-P/FlekS1 *2.09
211026223521830.9
CRE-Semi/Flek1, 2132 ± 7285 ± 16247 ± 51189 ± 525.8 ± 1.8
CRE-P/ReS1, 2179 ± 6364 ± 27288 ± 13263 ± 2531.2 ± 1.6
CRE-Semi/Re1, 2143 ± 6303 ± 3290 ± 31240 ± 1637.6 ± 0.3
* indicates that the sample did not ignite; TTI is the time-to-ignition; FO is flame-out time; PHRR is the peak heat release rate; TPHRR is the time to reach the peak value of the heat release rate (HRR); THR is the total heat release.
Table 3. The time required to reach the selected temperatures at the surface and back surface of all CRE samples at 35 kW/m2 heat flux.
SampleTime (s) to Reach
180 °C250 °C
Back SurfacetBack Surfacet
CRE4890
CRE-P/FlekS151[+103]262[+172]
CRE-Semi/Flek82[+34]129[+39]
CRE-P/ReS77[+29]122[+32]
CRE-Semi/Re62[+14]116[+26]
The data in brackets [], represent the increase (+) in time to reach a selected point of temperature w.r.t the control sample.
Table 4. The weight loss (wt %) after the water soak test and tape pull test.
SampleWater Soak TestTape Pull Test
% wt Loss after 24 h Drying at Room Temperature% wt Loss after Drying at 100 °C for 2 h% wt Loss after Test% Peeling
CRE-P/FlekS−0.08 ± 0.01−0.17 ± 0.010.09 ± 0.010.56 ± 0.02
CRE-Semi/Flek−0.02 ± 0.01−0.09 ± 0.030.02 ± 0.010.18 ± 0.03
CRE-P/ReS−0.06 ± 0.01−0.16 ± 0.020.03 ± 0.010.19 ± 0.01
CRE-Semi/Re−0.11 ± 0.01−0.31 ± 0.030.03 ± 0.010.12 ± 0.07
Table 5. The impact and flexural moduli for all CRE composite laminates.
SampleImpactFlexuralFlexural Modulus after Exposure to 35 kW/m2
Modulus, Ei (GPa)Ei (%)Modulus, Ef (GPa)Ef (%)120 s (GPa)240 s (GPa)
CRE41.9 ± 0.2 38.4 ± 2.926.3 ± 17.5 ± 1
CRE-P/FlekS38.3 ± 0.2 −8.639.5 ± 1.9+2.830.5 ± 26.2 ± 0.5
CRE-Semi/Flek37.3 ± 0.5−10.938.6 ± 3.3+0.531.3 ± 214.1 ± 3.5
CRE-P/ReS35.5 ± 0.1 −15.337.8 ± 2.8−1.529.0 ± 18.3 ± 2.5
CRE-Semi/Re34.0 ± 0.4 −18.935.8 ± 2.7−6.833.4 ± 216.5 ± 2
Flexural moduli for all samples have been normalized to 40% fiber volume fraction; the percent changes in modulus parameters ∆Ei and ∆Ef are w.r.t. the control sample with the (–) and (+) signs representing reductions and enhancements, respectively.

