
Influence of Experimental Parameters Using the Dip-Coating Method on the Barrier Performance of Hybrid Sol-Gel Coatings in Strong Alkaline Environments


Abstract
:1. Introduction
2. Experimental Work
2.1. Reagents
2.2. Sol-Gel Synthesis Procedure of Ureasilicate Coatings
2.3. Coating Deposition
2.4. Surface Characterization
2.5. Electrochemical Measurements

| Organic-inorganic hybrid (OIH) coating U(400) | Electrochemical measurements | |
|---|---|---|
| Coatings were cured at 40 °C for 15 days | 1 Layer Rt = 0 s | EIS, potentiodynamic polarization curves and igal in SCPS |
| 1 Layer Rt = 100 s | ||
| 3 Layers Rt = 0 s a | ||
| Coatings were cured at 40 °C for 15 days between each layer deposited | 2 Layers Rt = 0 s | igal in SCPS |
| 2 Layers Rt = 100 s | ||
| 3 Layers Rt = 0 s | ||
| 3 Layers Rt = 100 s | ||
2.5.1. Macrocell Current Density (igal)
2.5.2. Electrochemical Impedance Spectroscopy (EIS) and Potentiodynamic Polarization Curves Measurements
3. Results and Discussion
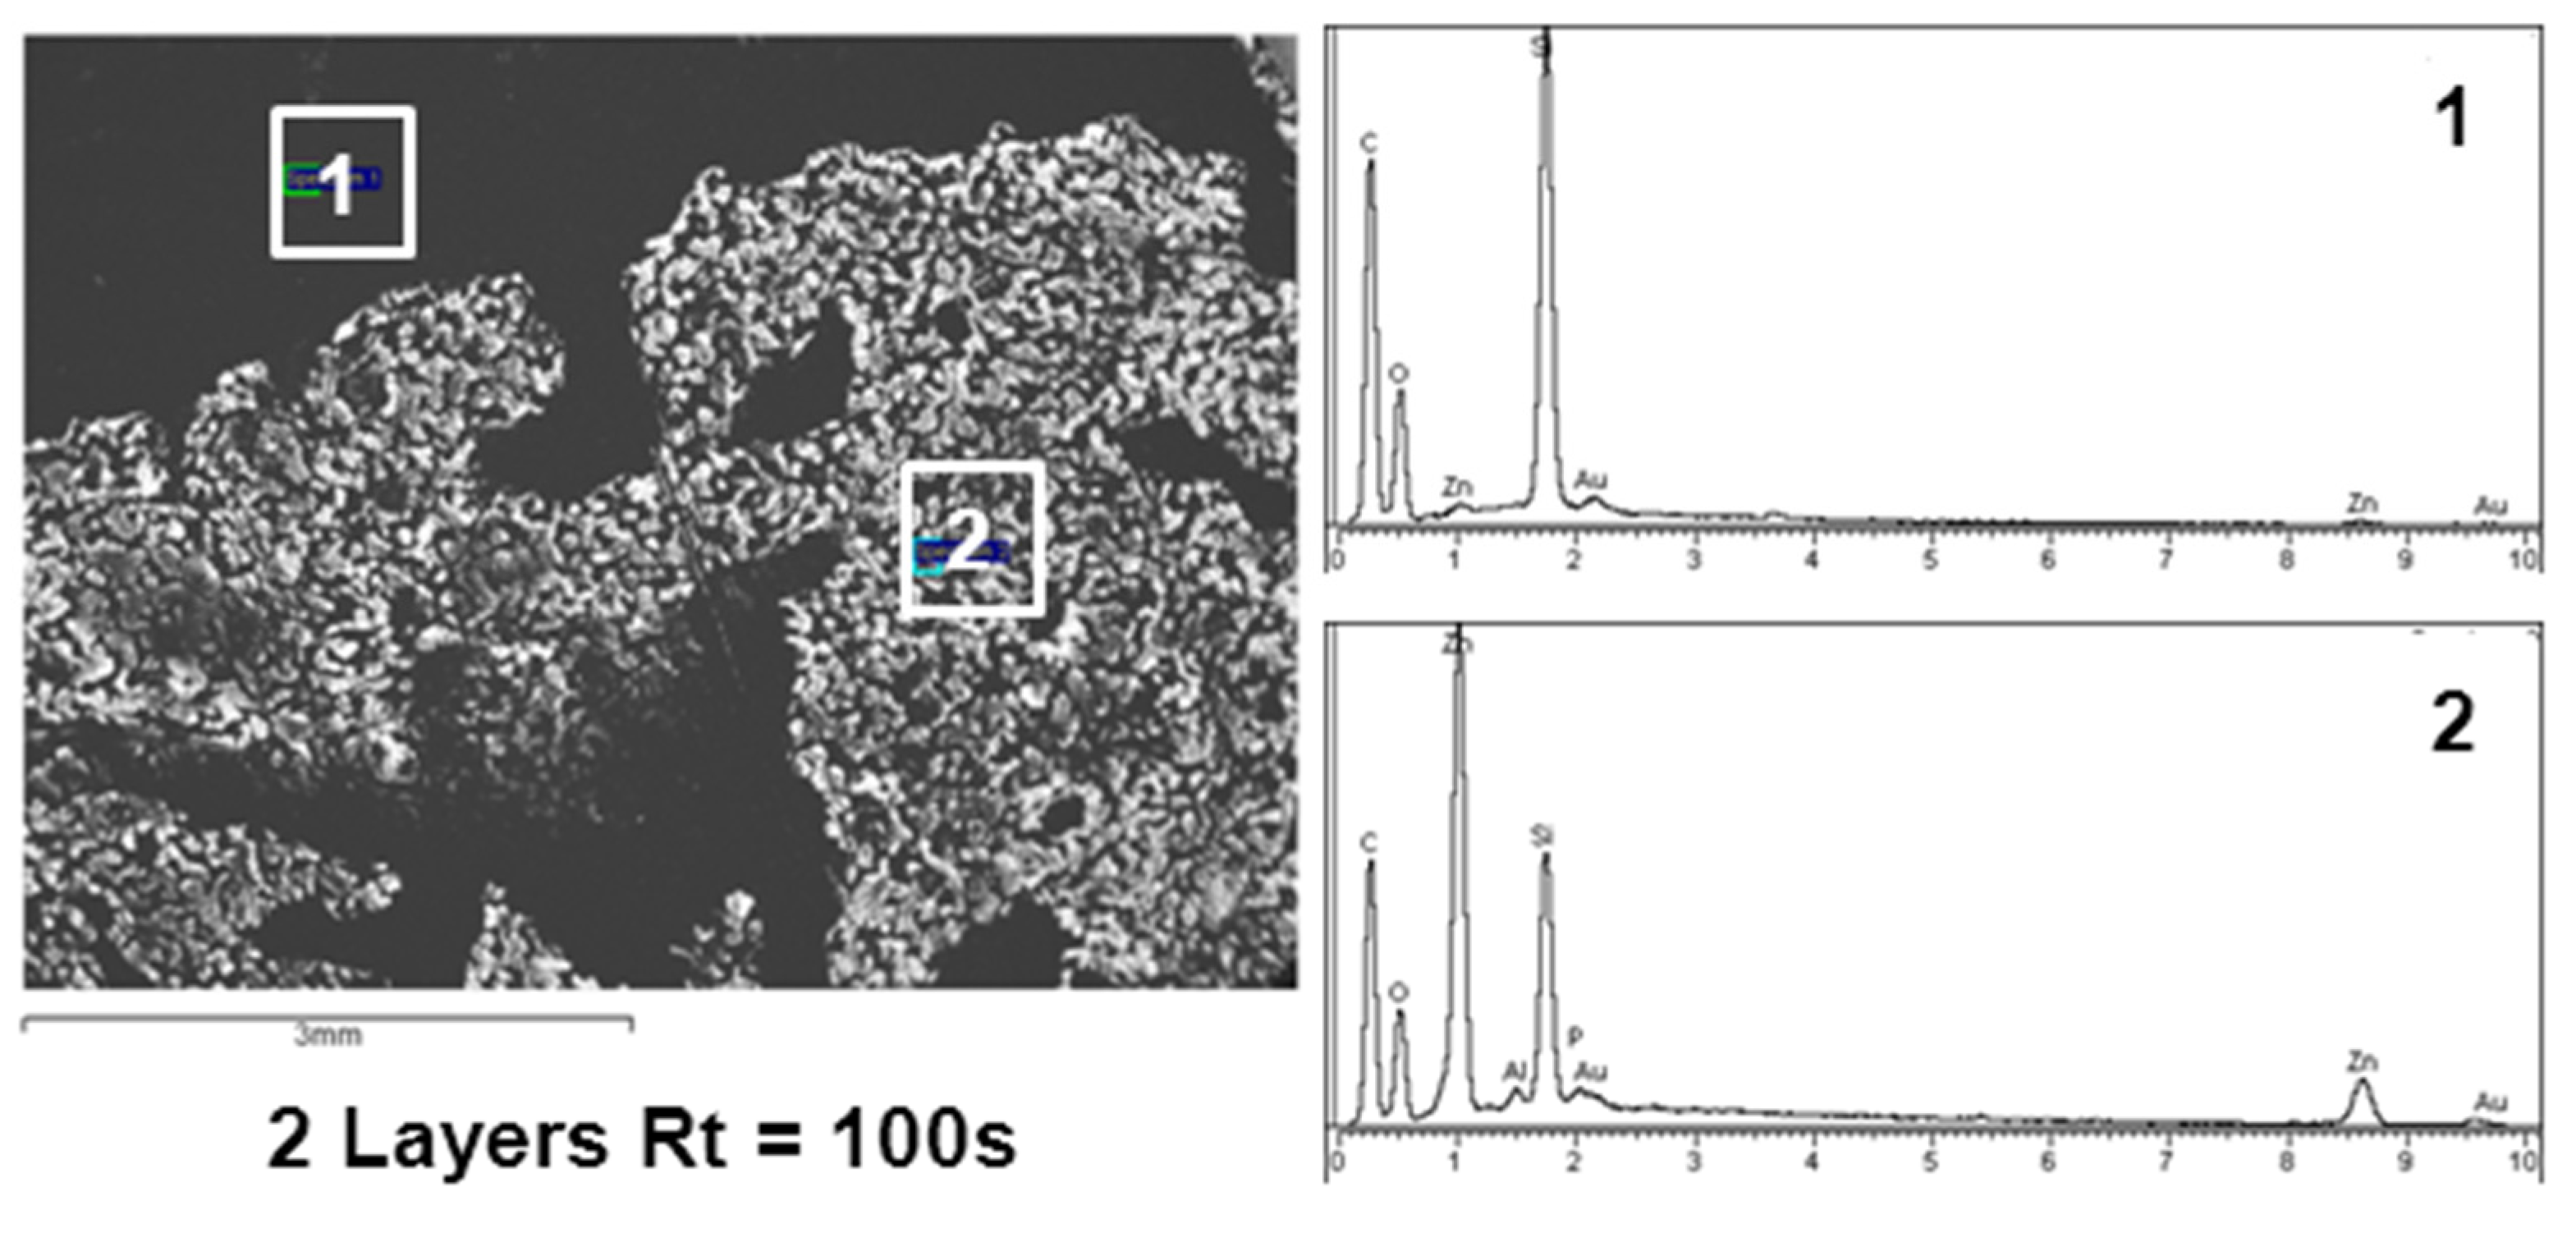
3.1. Surface Characterization
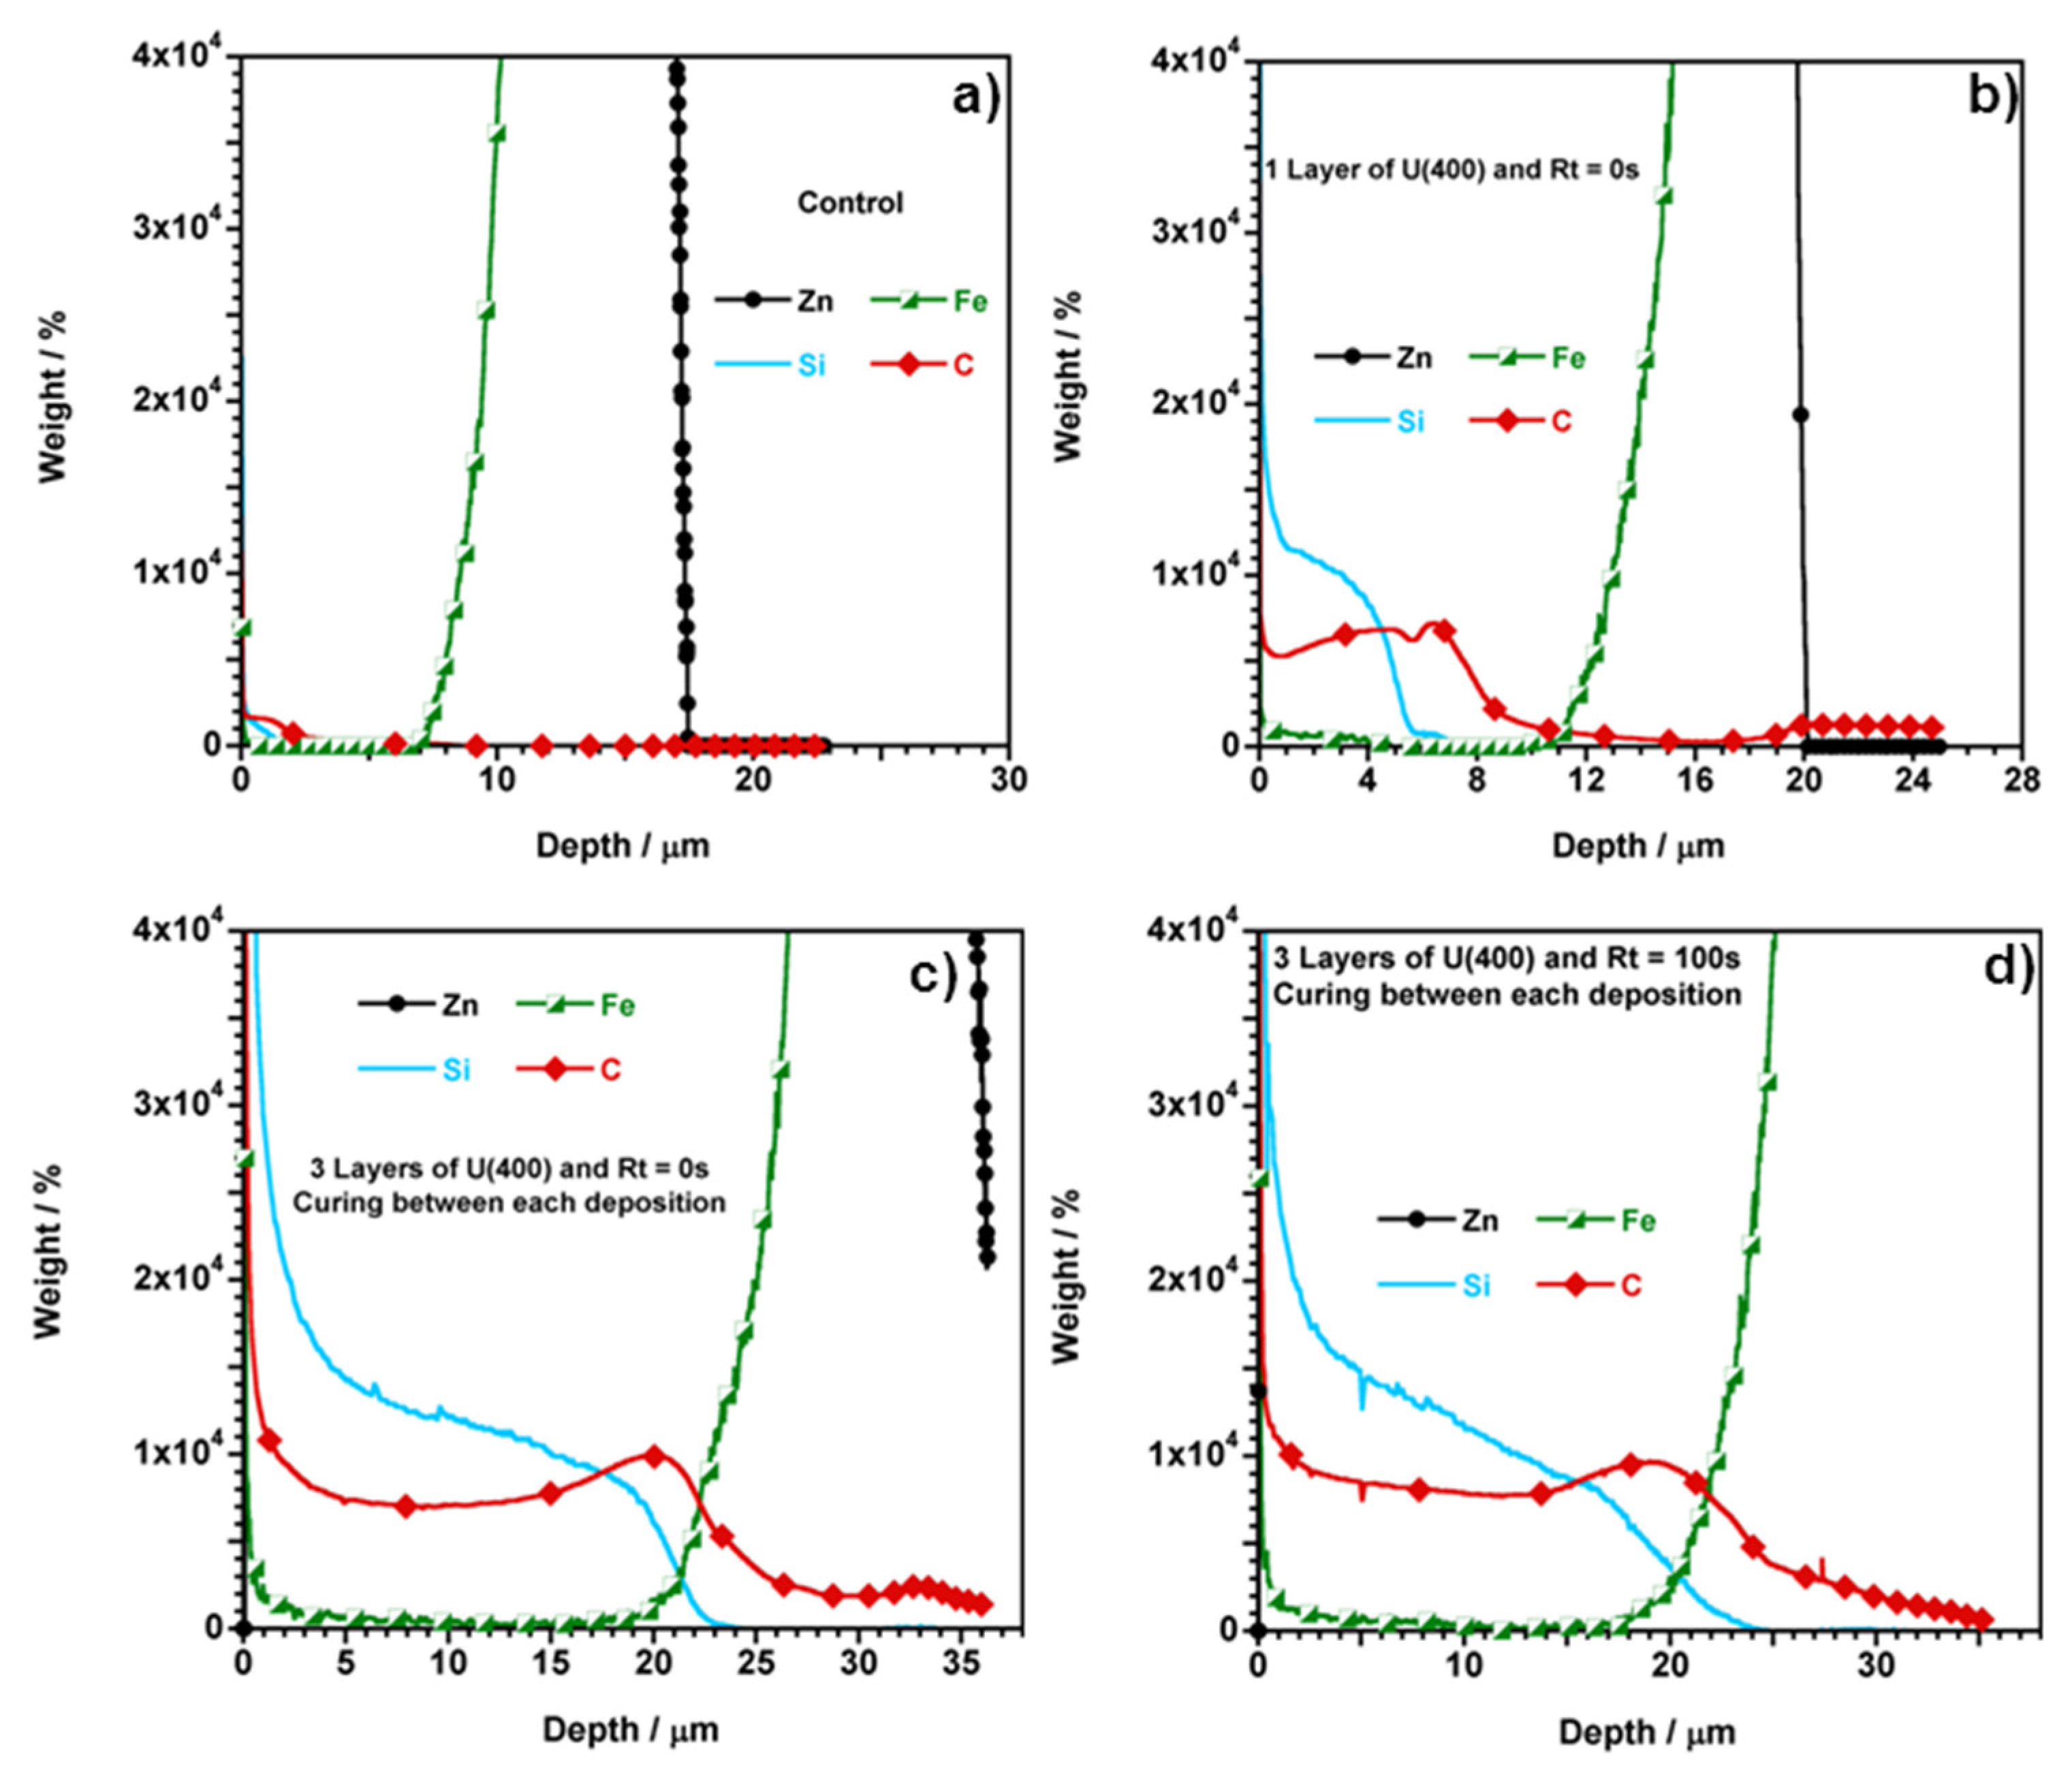
| Samples | Dipping steps | Rt/s | Depth a/μm | OIH Thickness/μm |
|---|---|---|---|---|
| (OIH + Zn layer) | (OIH + Zn layer) − Zn layer (control) | |||
| Uncoated HDGS (control) | – | – | 19 | n.a. |
| Coated Samples | ||||
| Curing between each deposition | 1 | 0 | 21 | 2 |
| 2 | 27 | 8 | ||
| 3 | 37 | 18 | ||
| 3 b | 22 | 3 | ||
| Curing between each deposition | 1 | 100 | 21 | 2 |
| 2 | 28 | 9 | ||
| 3 | 36 | 17 | ||
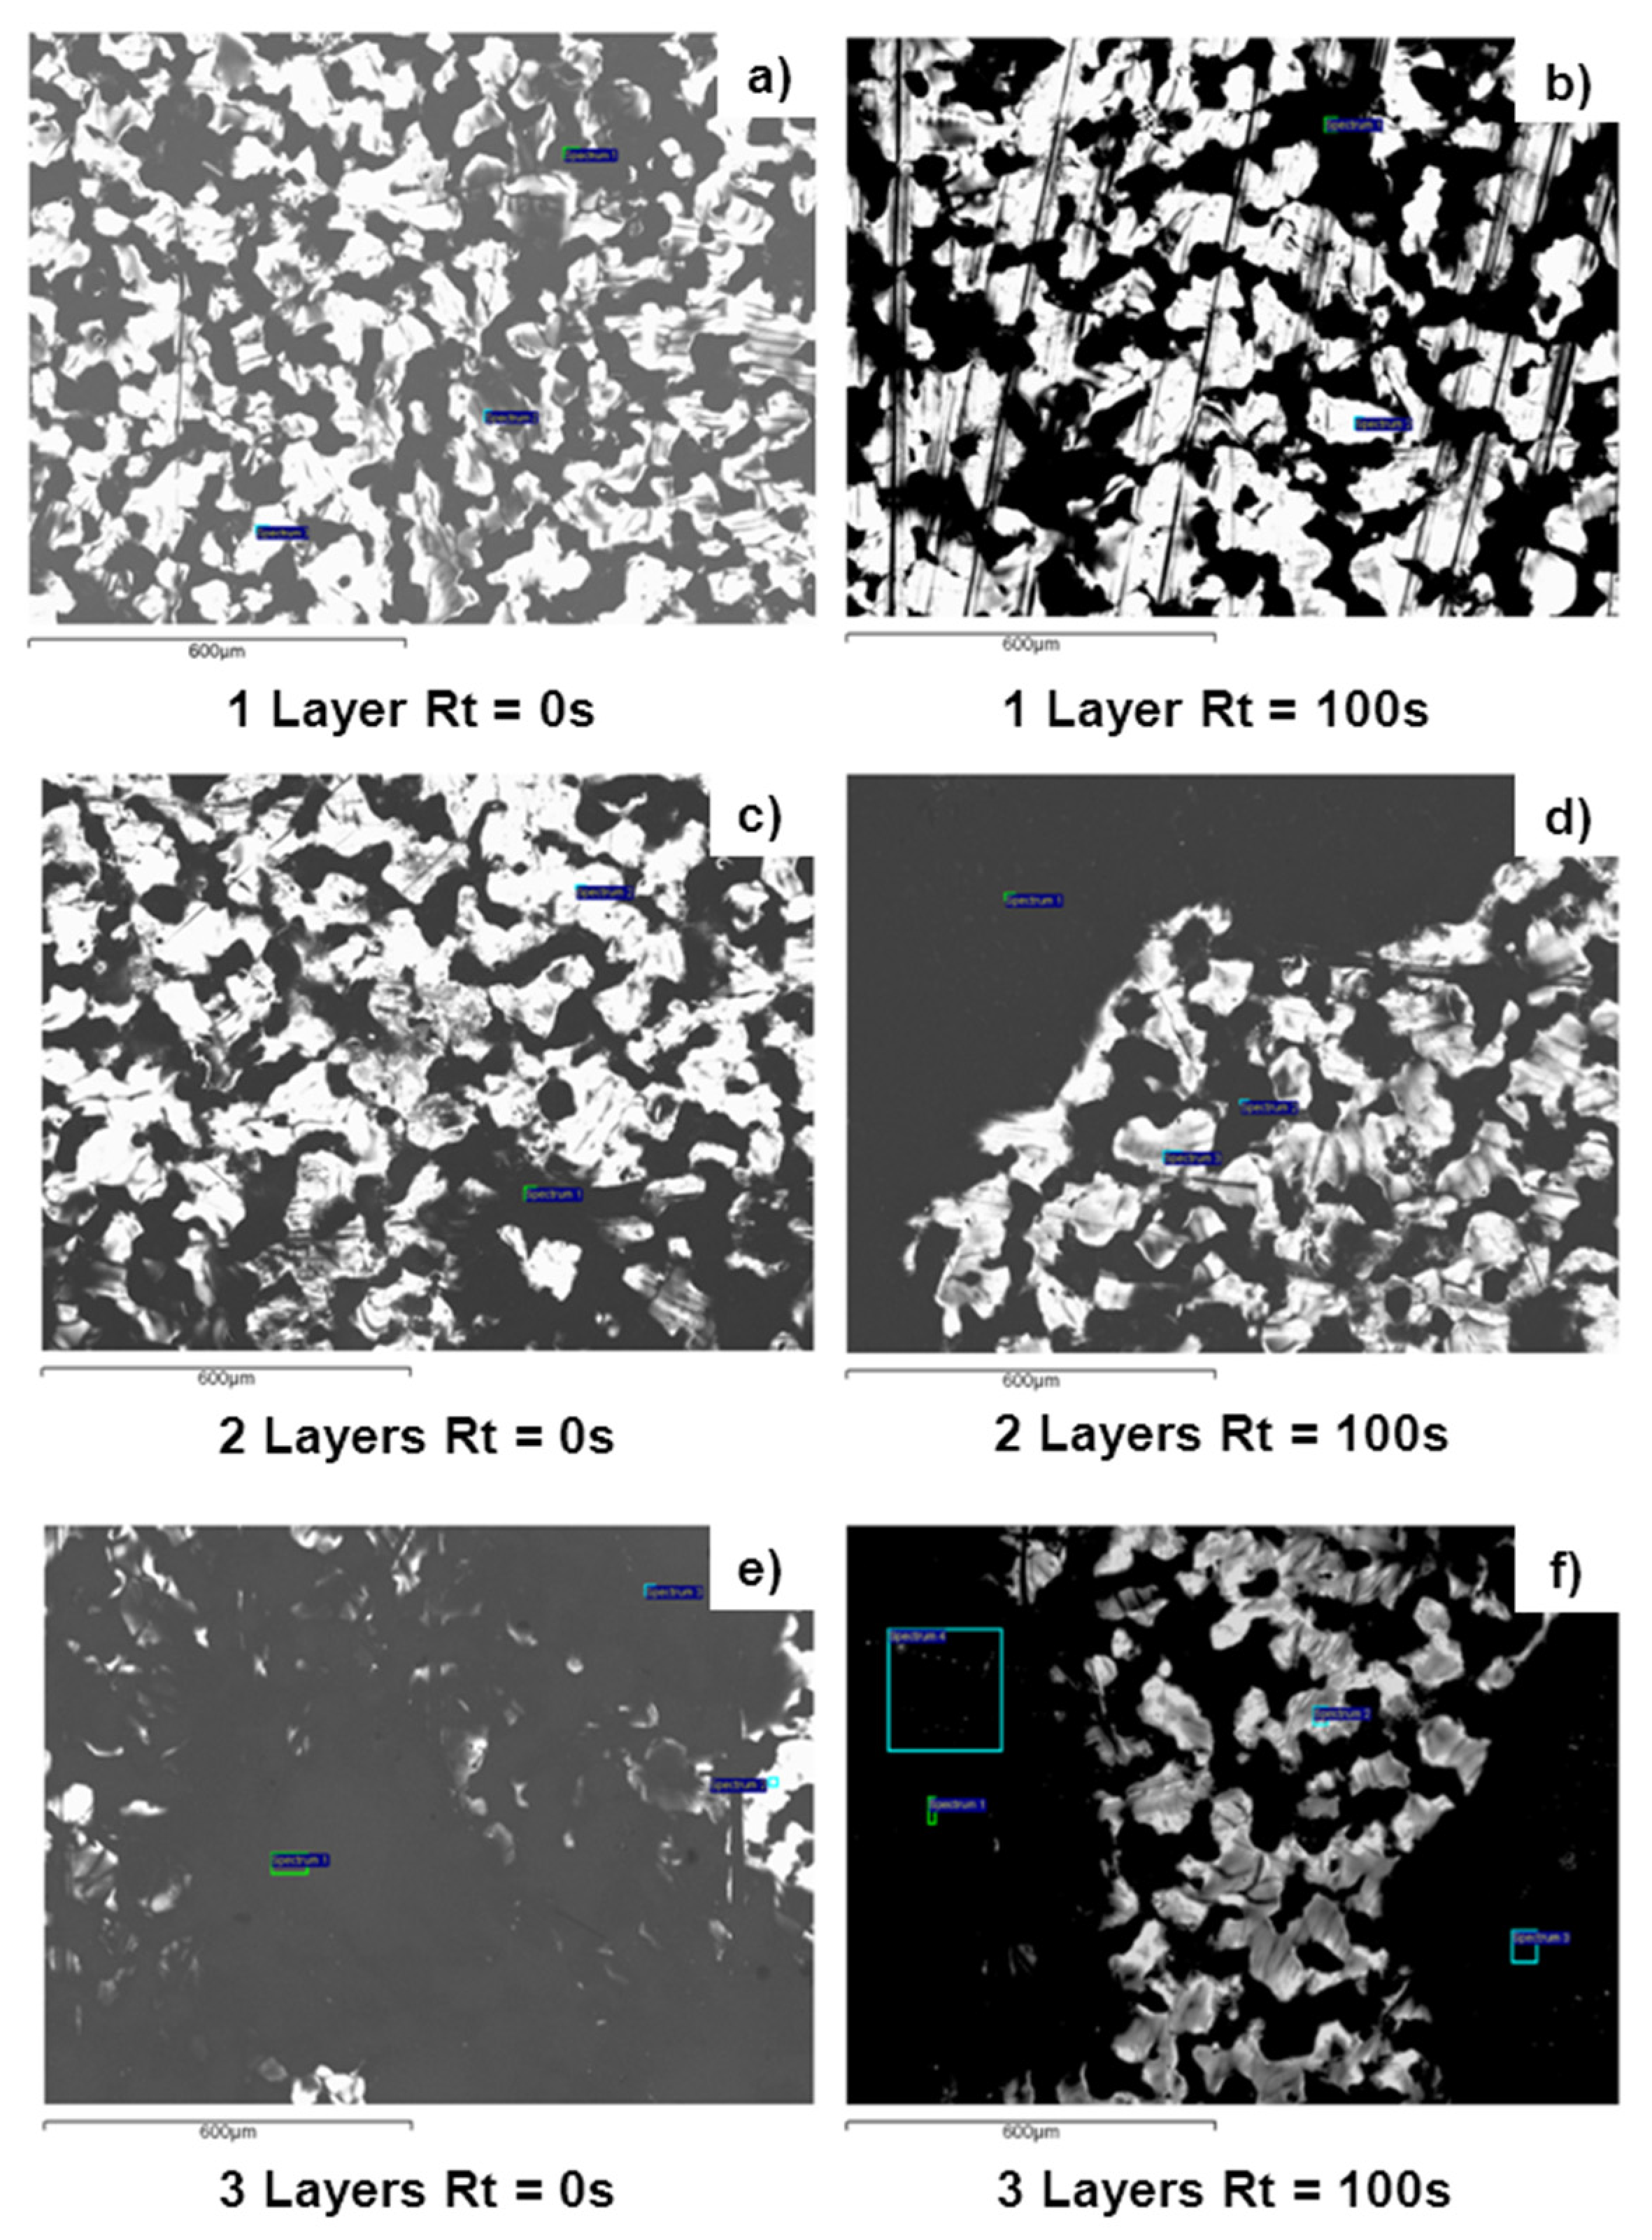
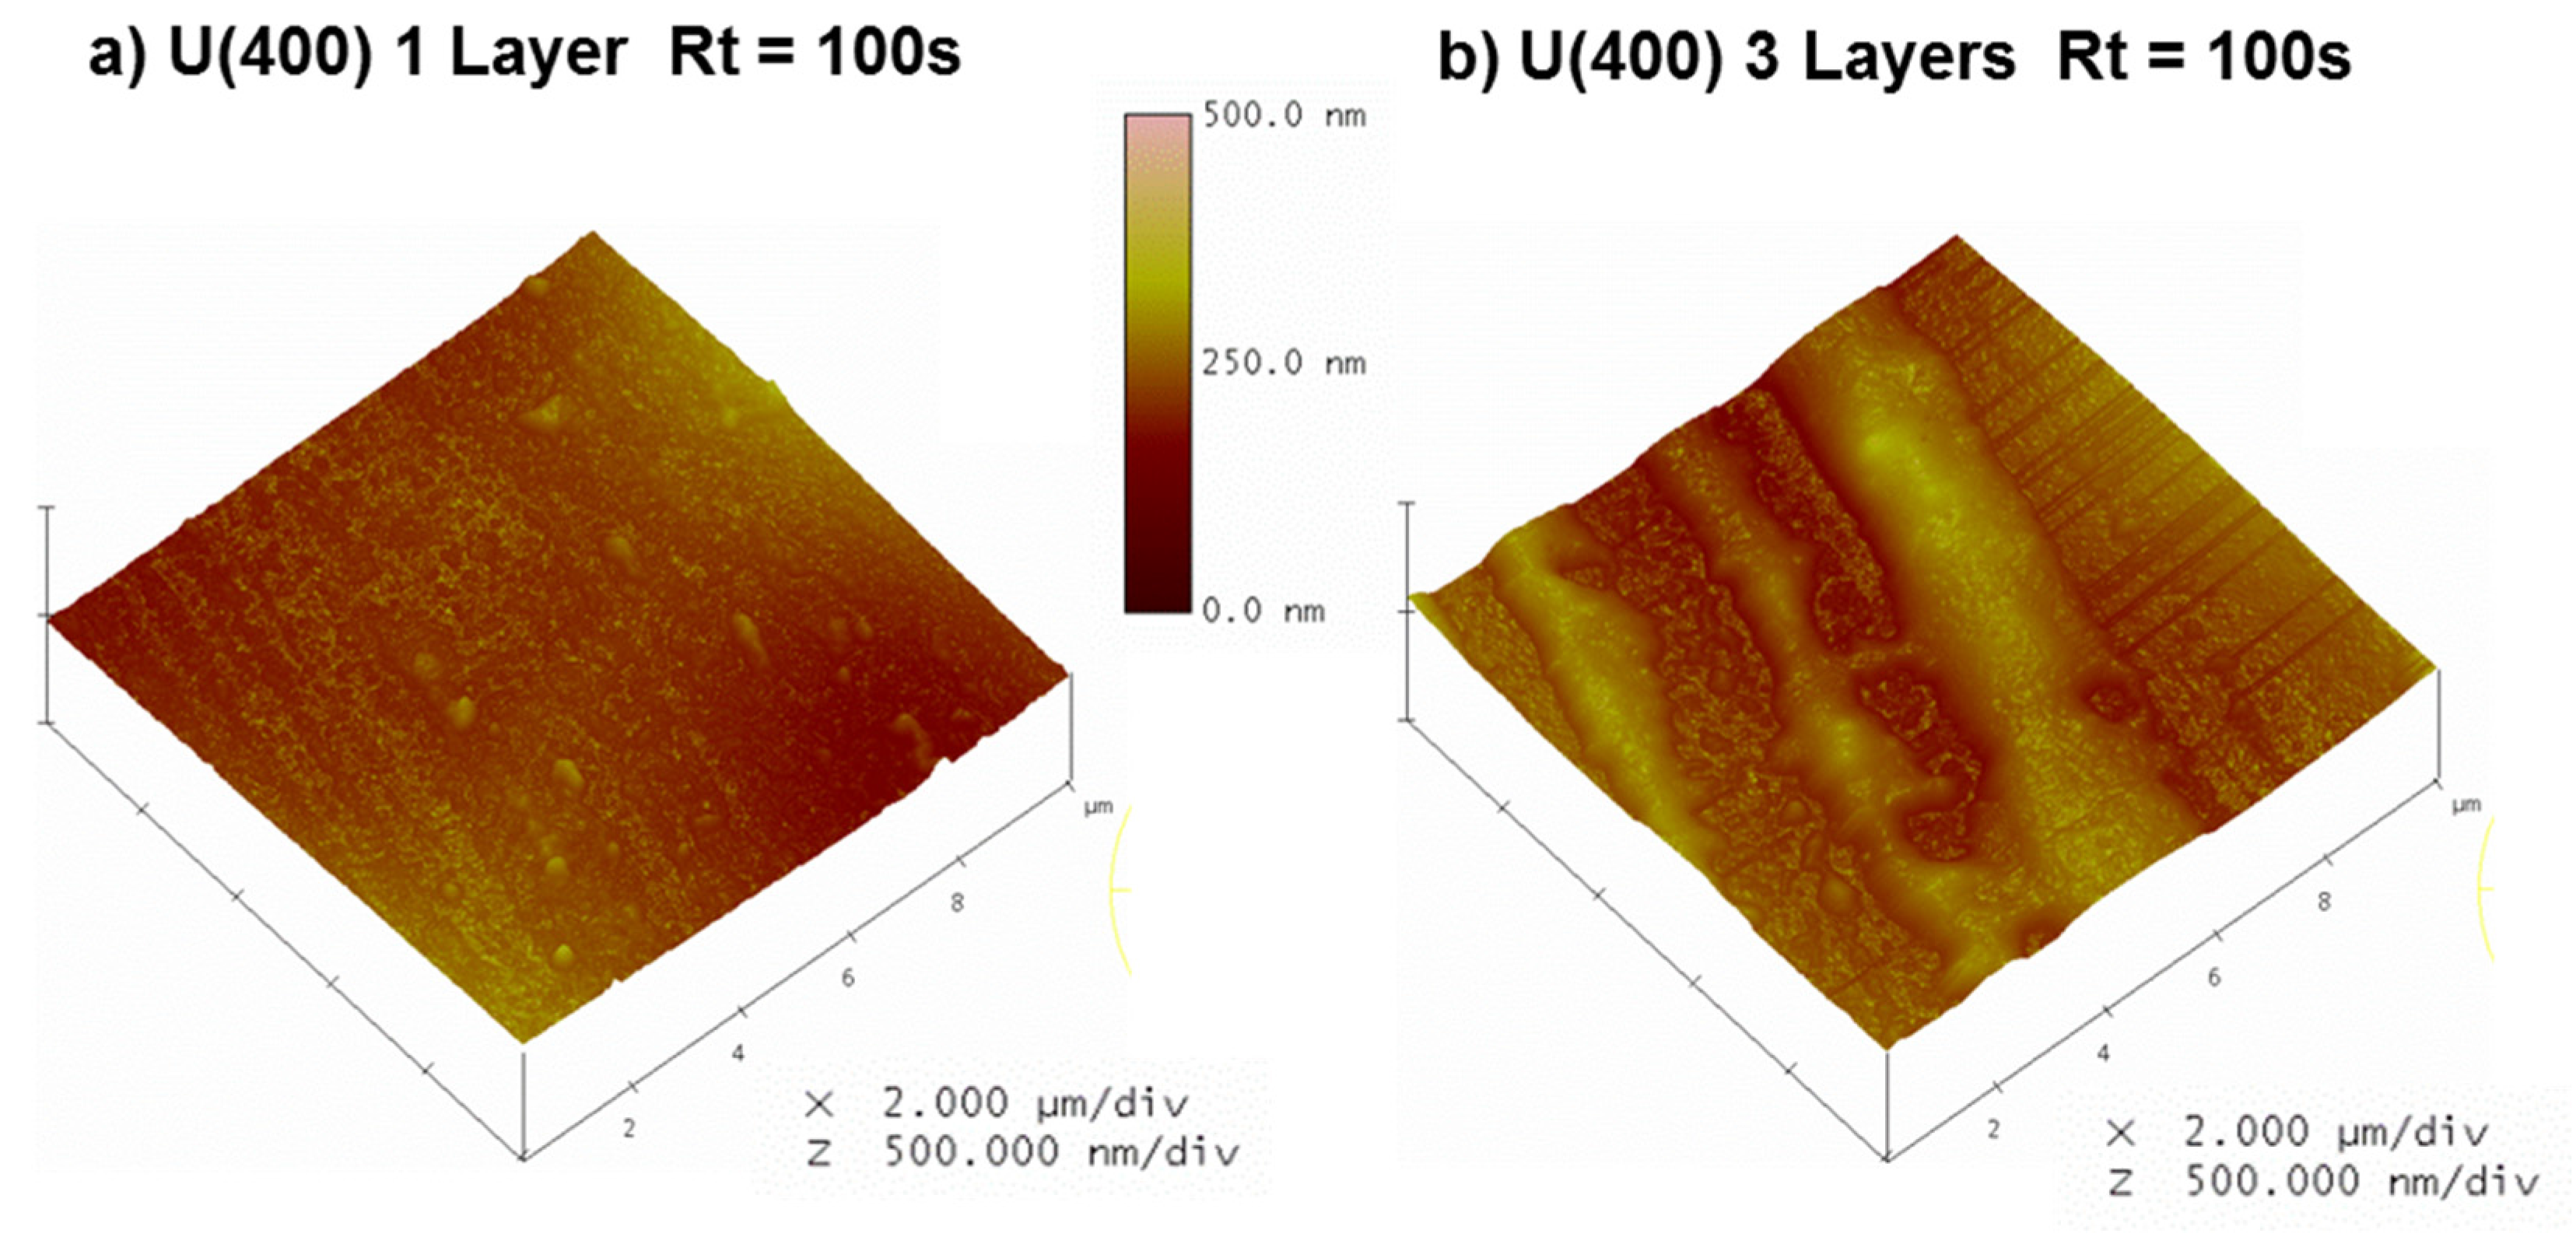
| Sample | Rq/nm | Ra/nm | Rmax/nm | |
|---|---|---|---|---|
| Uncoated HDGS | 106 | 82 | 611 | |
| 1 Layer | Rt = 0 s | 36 | 27 | 330 |
| Rt = 100 s | 17 | 13 | 135 | |
| 3 Layers | Rt = 0 s a | 28 | 21 | 243 |
| Rt = 100 s | 23 | 19 | 153 | |
3.2. Electrochemical Measurements
3.2.1. Electrochemical Impedance Spectroscopy (EIS)
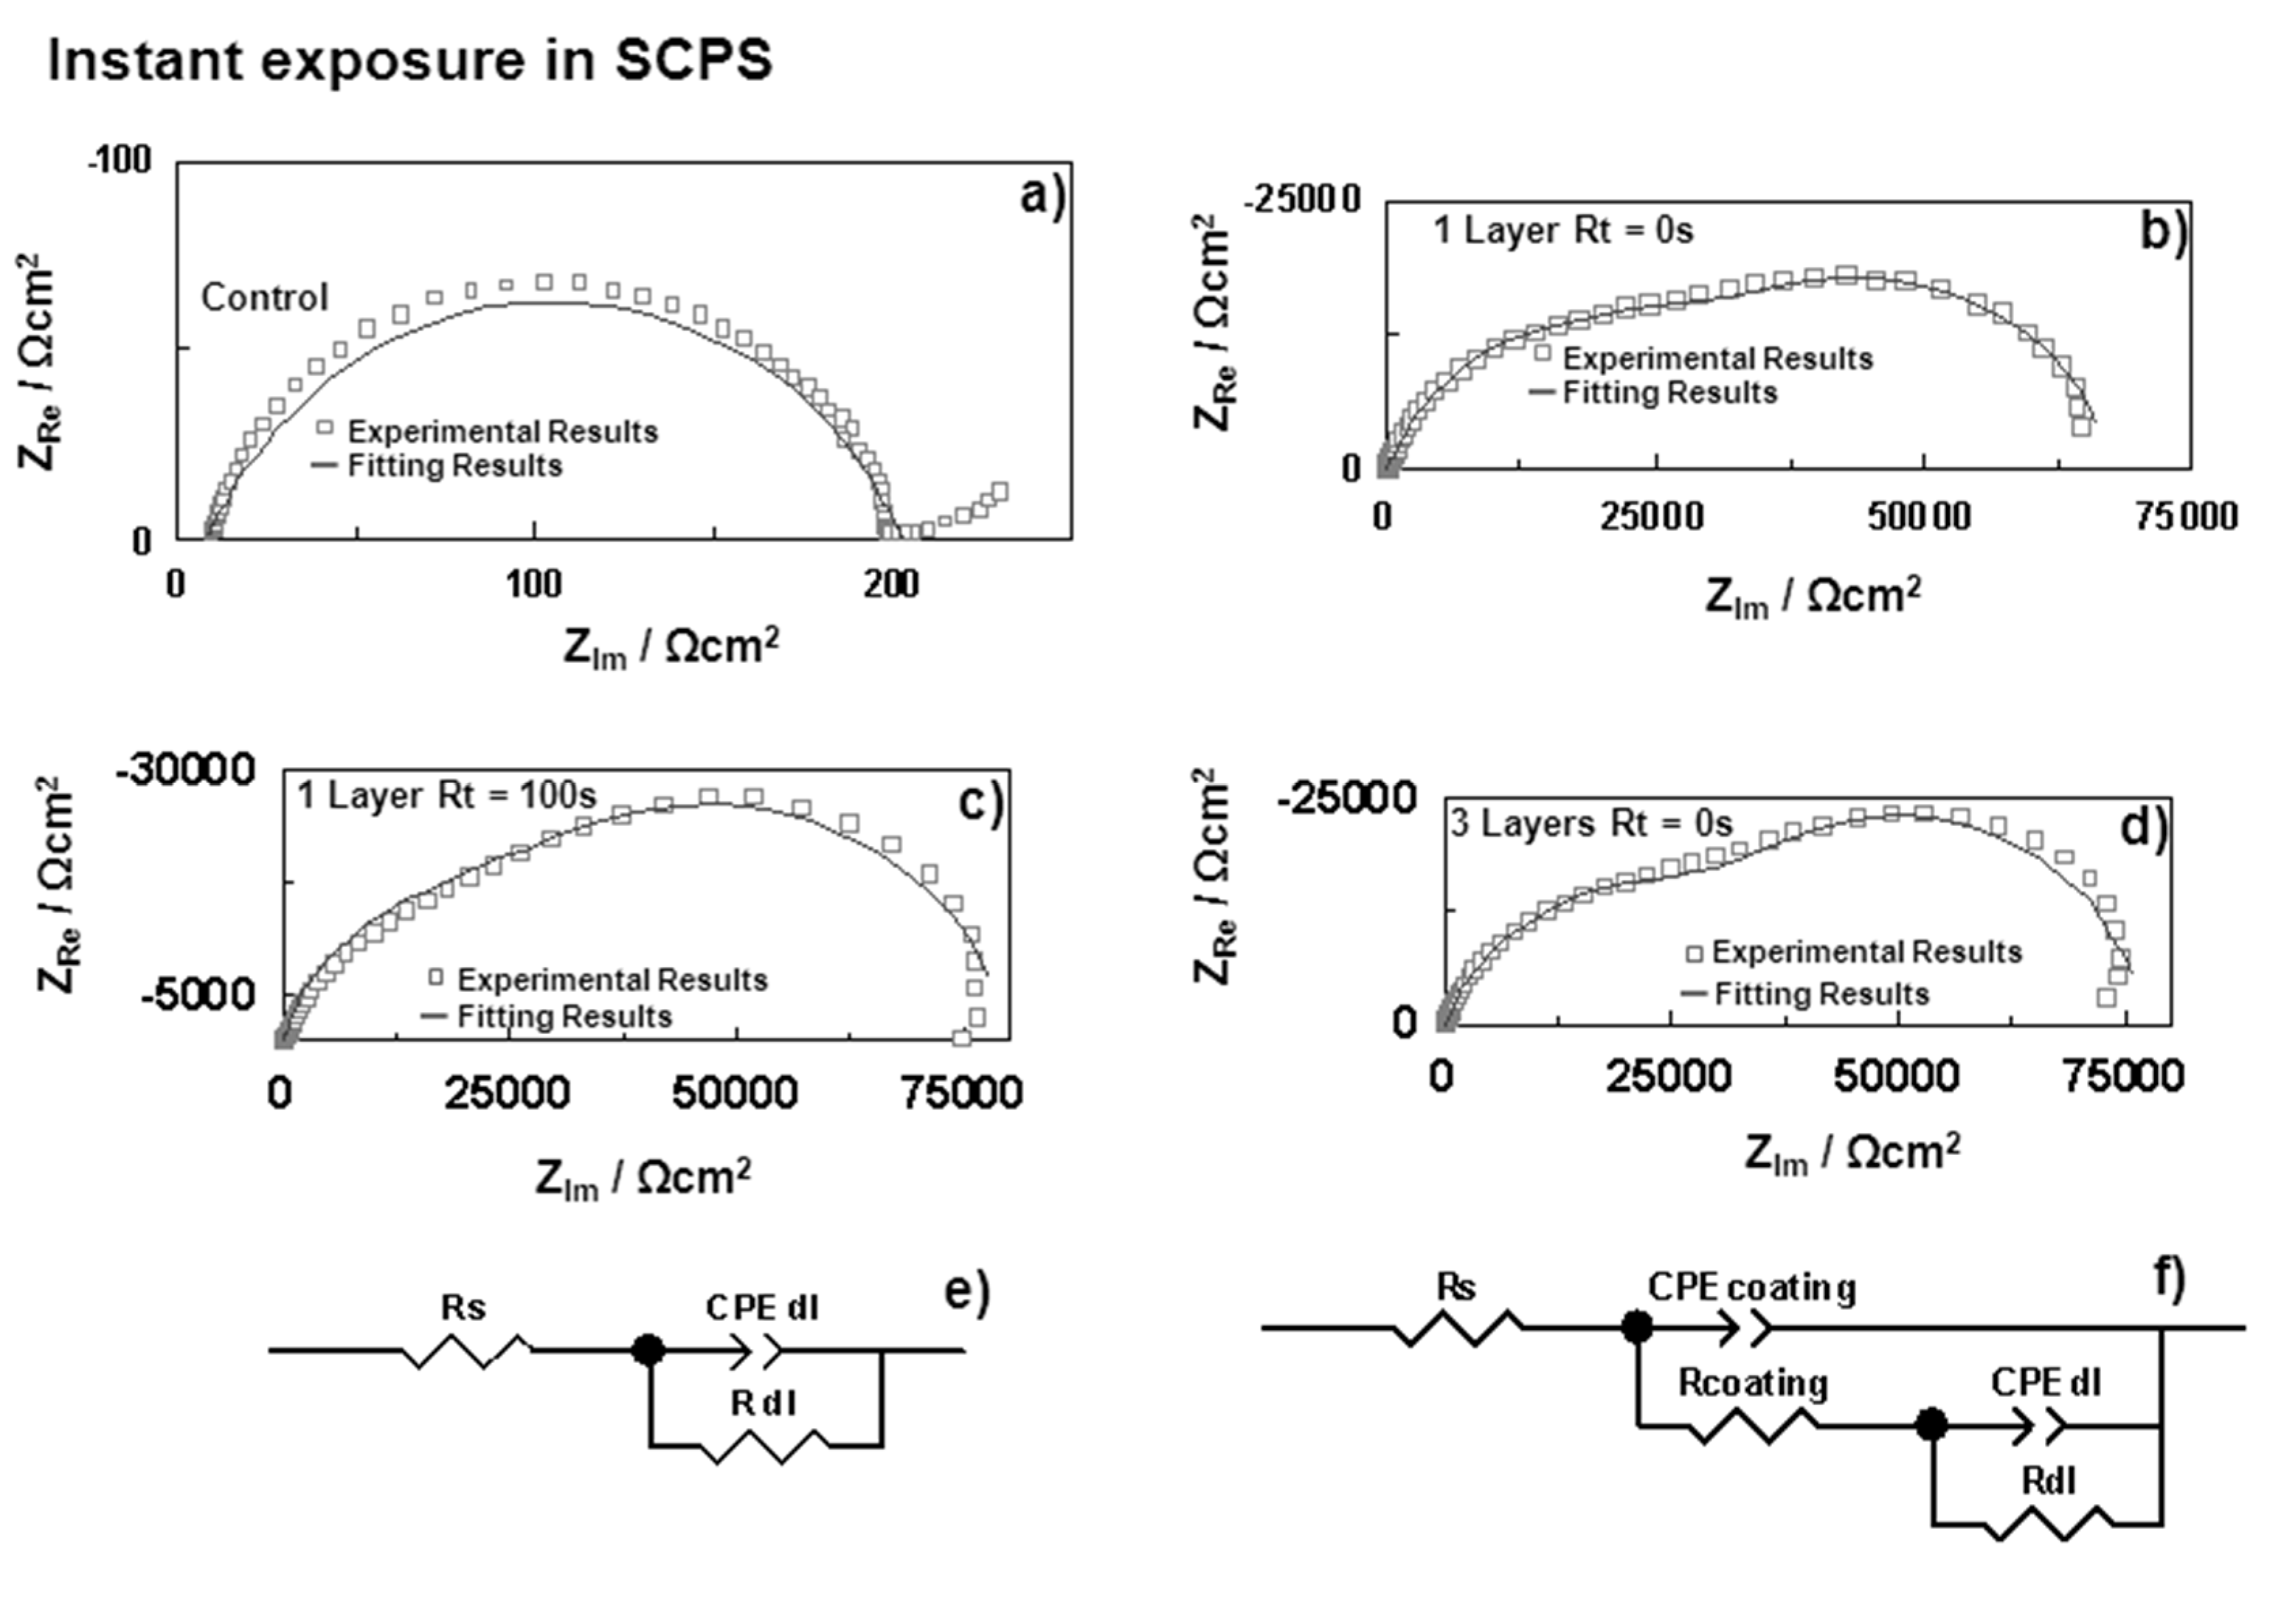
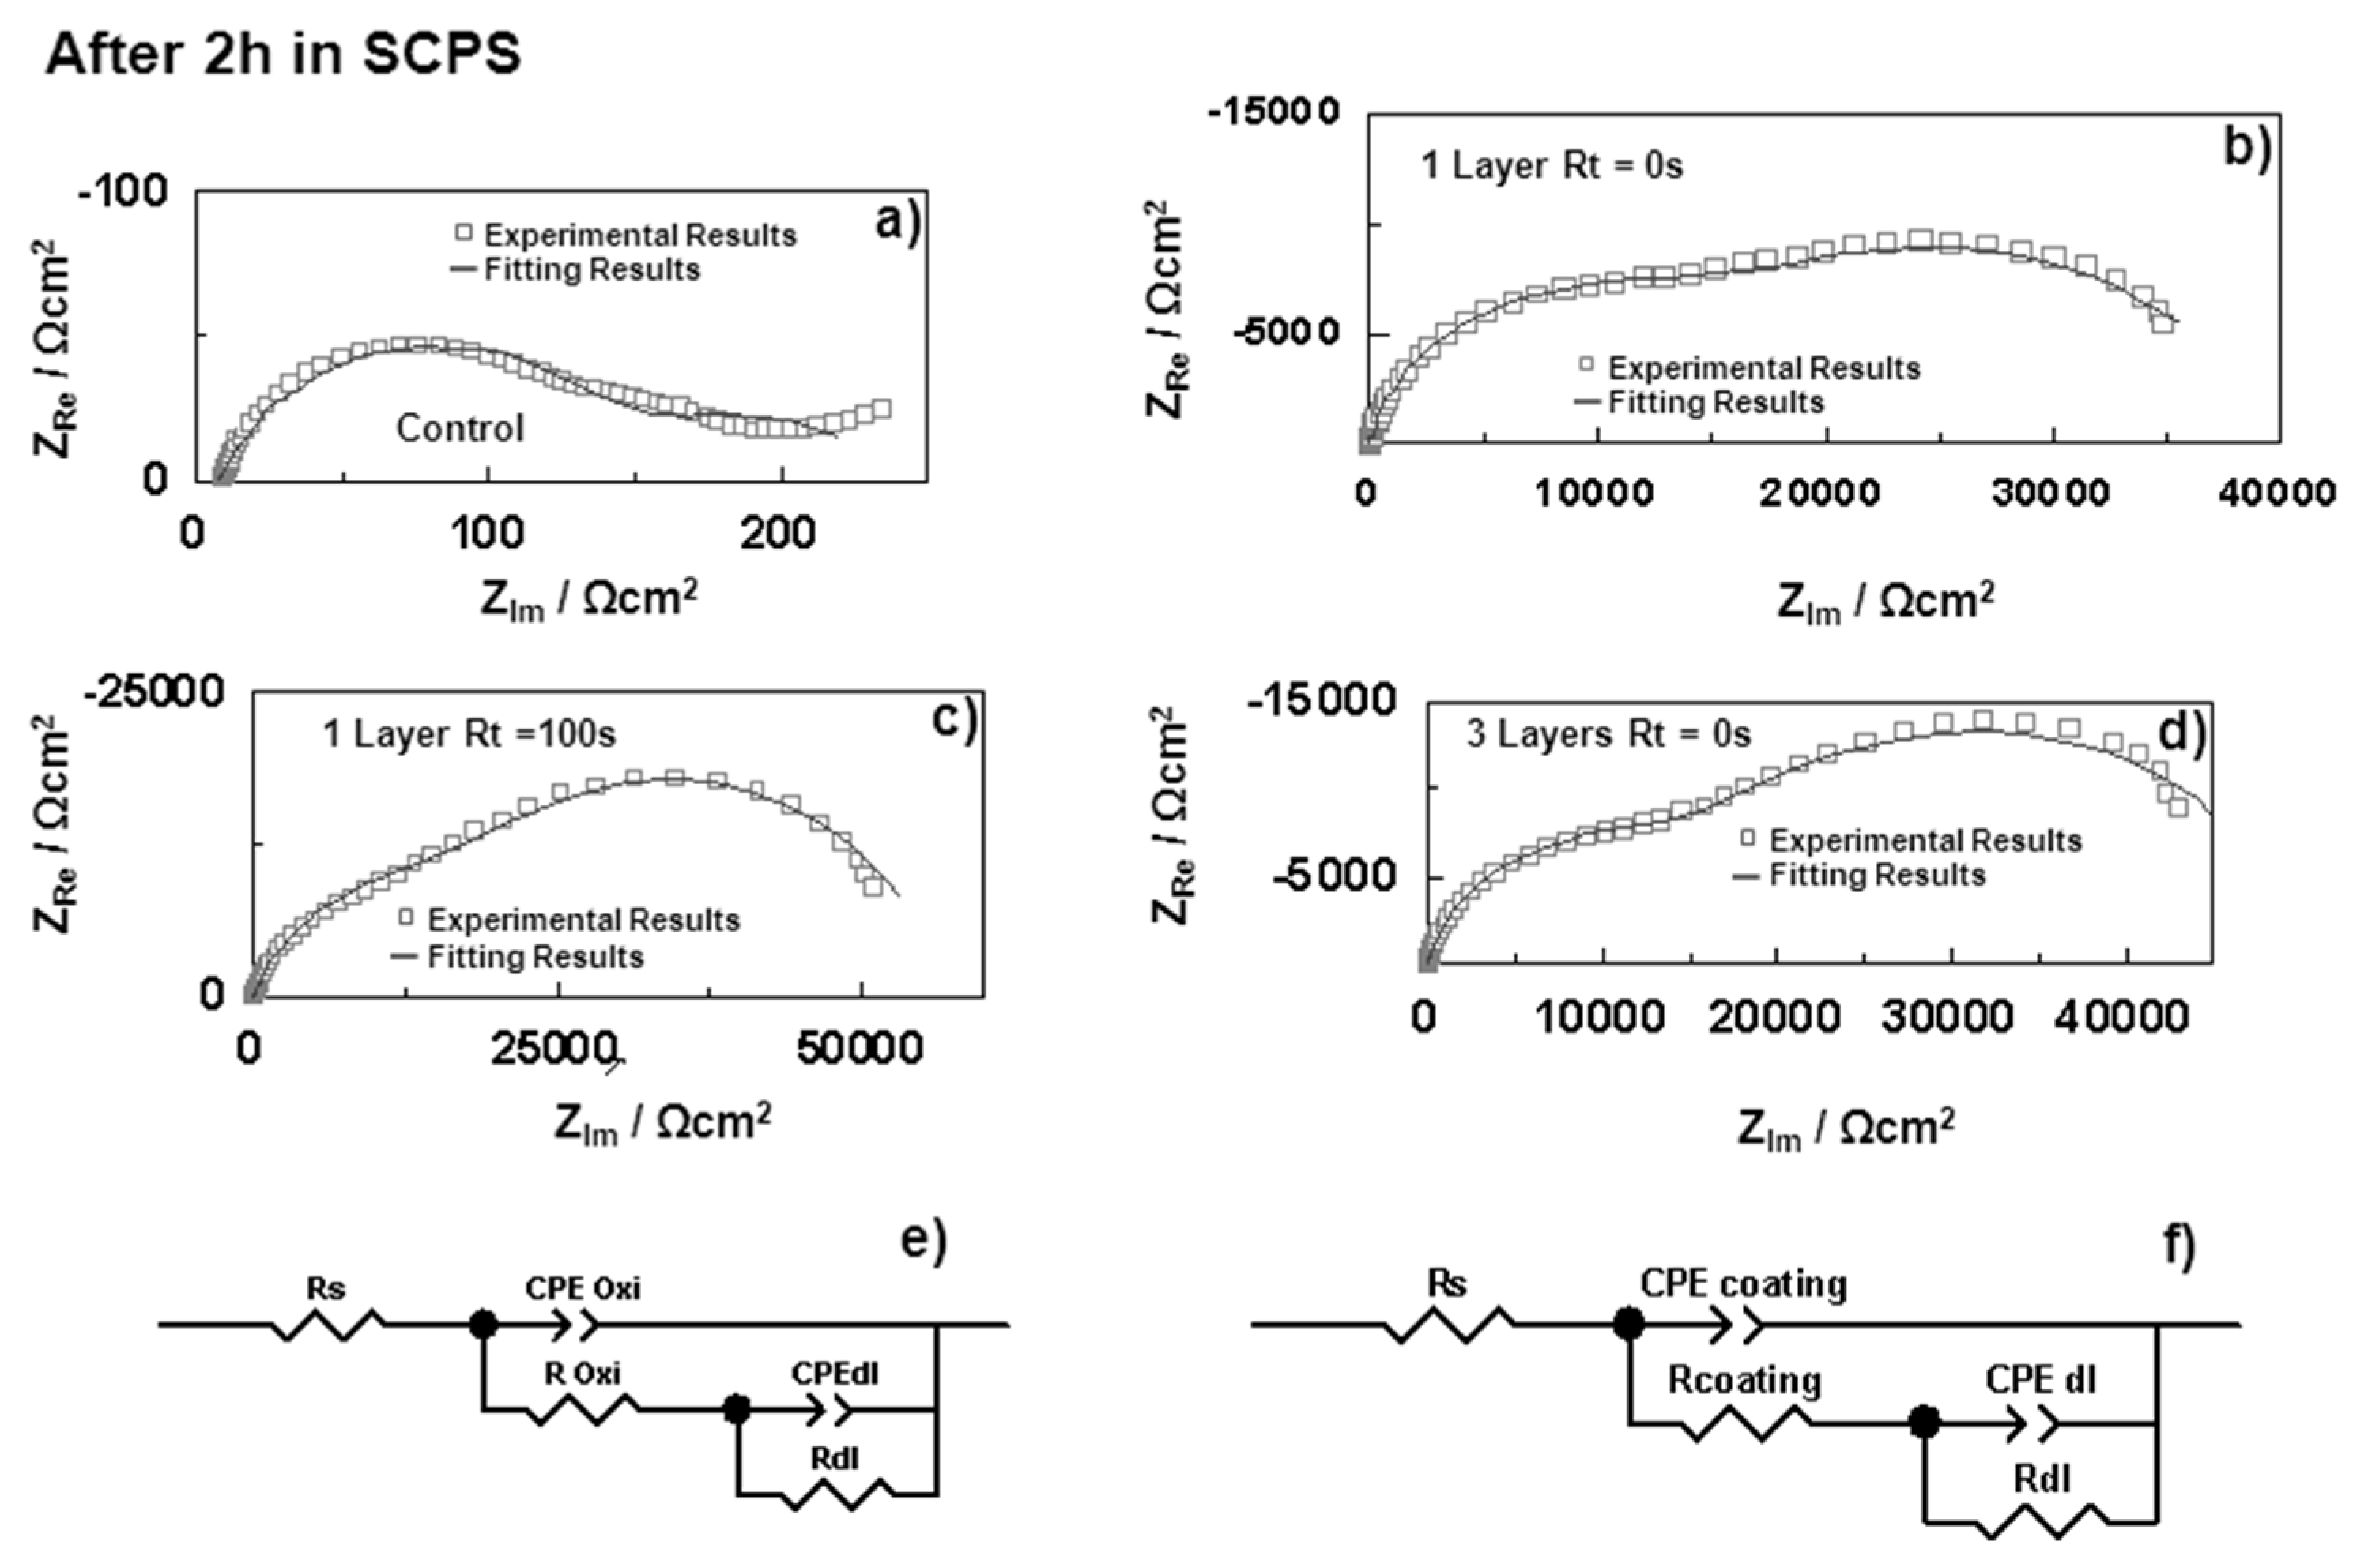
| Samples | Rs (Ω·cm2) | CPEoxide (sα Ω−1·cm−2) | αoxide | Coxide (F·cm−2) | Roxide (Ω·cm2) | CPEdl (sα Ω−1·cm−2) | αdl | Cdl (F·cm−2) | Rdl (Ω·cm2) | |
|---|---|---|---|---|---|---|---|---|---|---|
| HDGS uncoated | 0 h | 8.29 | – | – | – | – | 8.74 × 10⁻² | 0.73 | 1.91 × 10⁻⁵ | 1.95 × 10² |
| 2 h | 8.24 | 1.41 × 10⁻⁴ | 0.74 | 3.39 × 10⁻⁵ | 1.38 × 10² | 1.47 × 10⁻² | 0.50 | 2.08 × 10⁻² | 9.61 × 101 | |
| OIH Coating (Layer) | Double layer (Substrate/OIH) | |||||||||
| U(400) 1 Layer Rt = 0 s | 0 h | 16.83 | 5.13 × 10⁻⁶ | 0.78 | 3.21 × 10⁻⁶ | 3.74 × 10⁴ | 4.40 × 10⁻⁵ | 0.89 | 4.53 × 10⁻⁵ | 2.91 × 10⁴ |
| 2 h | 16.13 | 7.40 × 10⁻⁶ | 0.85 | 5.06 × 10⁻⁶ | 1.58 × 10⁴ | 8.03 × 10⁻⁵ | 0.68 | 1.10 × 10⁻⁵ | 2.43 × 10⁴ | |
| U(400) 1 Layer Rt = 100 s | 0 h | 20.76 | 6.29 × 10⁻⁶ | 0.83 | 4.74 × 10⁻⁶ | 4.09 × 10⁴ | 2.54 × 10⁻⁵ | 0.88 | 2.54 × 10⁻⁵ | 3.95 × 10⁴ |
| 2 h | 23.33 | 1.45 × 10⁻⁵ | 0.74 | 1.09 × 10⁻⁵ | 3.01 × 10⁴ | 6.80 × 10⁻⁵ | 0.95 | 7.02 × 10⁻⁵ | 2.69 × 10⁴ | |
| U(400) 3 Layers a | 0 h | 17.97 | 4.89 × 10⁻⁶ | 0.76 | 3.02 × 10⁻⁶ | 4.38 × 10⁴ | 3.45 × 10⁻⁵ | 0.98 | 3.47 × 10⁻⁵ | 3.36 × 10⁴ |
| 2 h | 21.13 | 7.26 × 10⁻⁶ | 0.83 | 4.73 × 10⁻⁶ | 1.71 × 10⁴ | 6.66 × 10⁻⁵ | 0.74 | 8.93 × 10⁻⁵ | 3.46 × 10⁴ | |
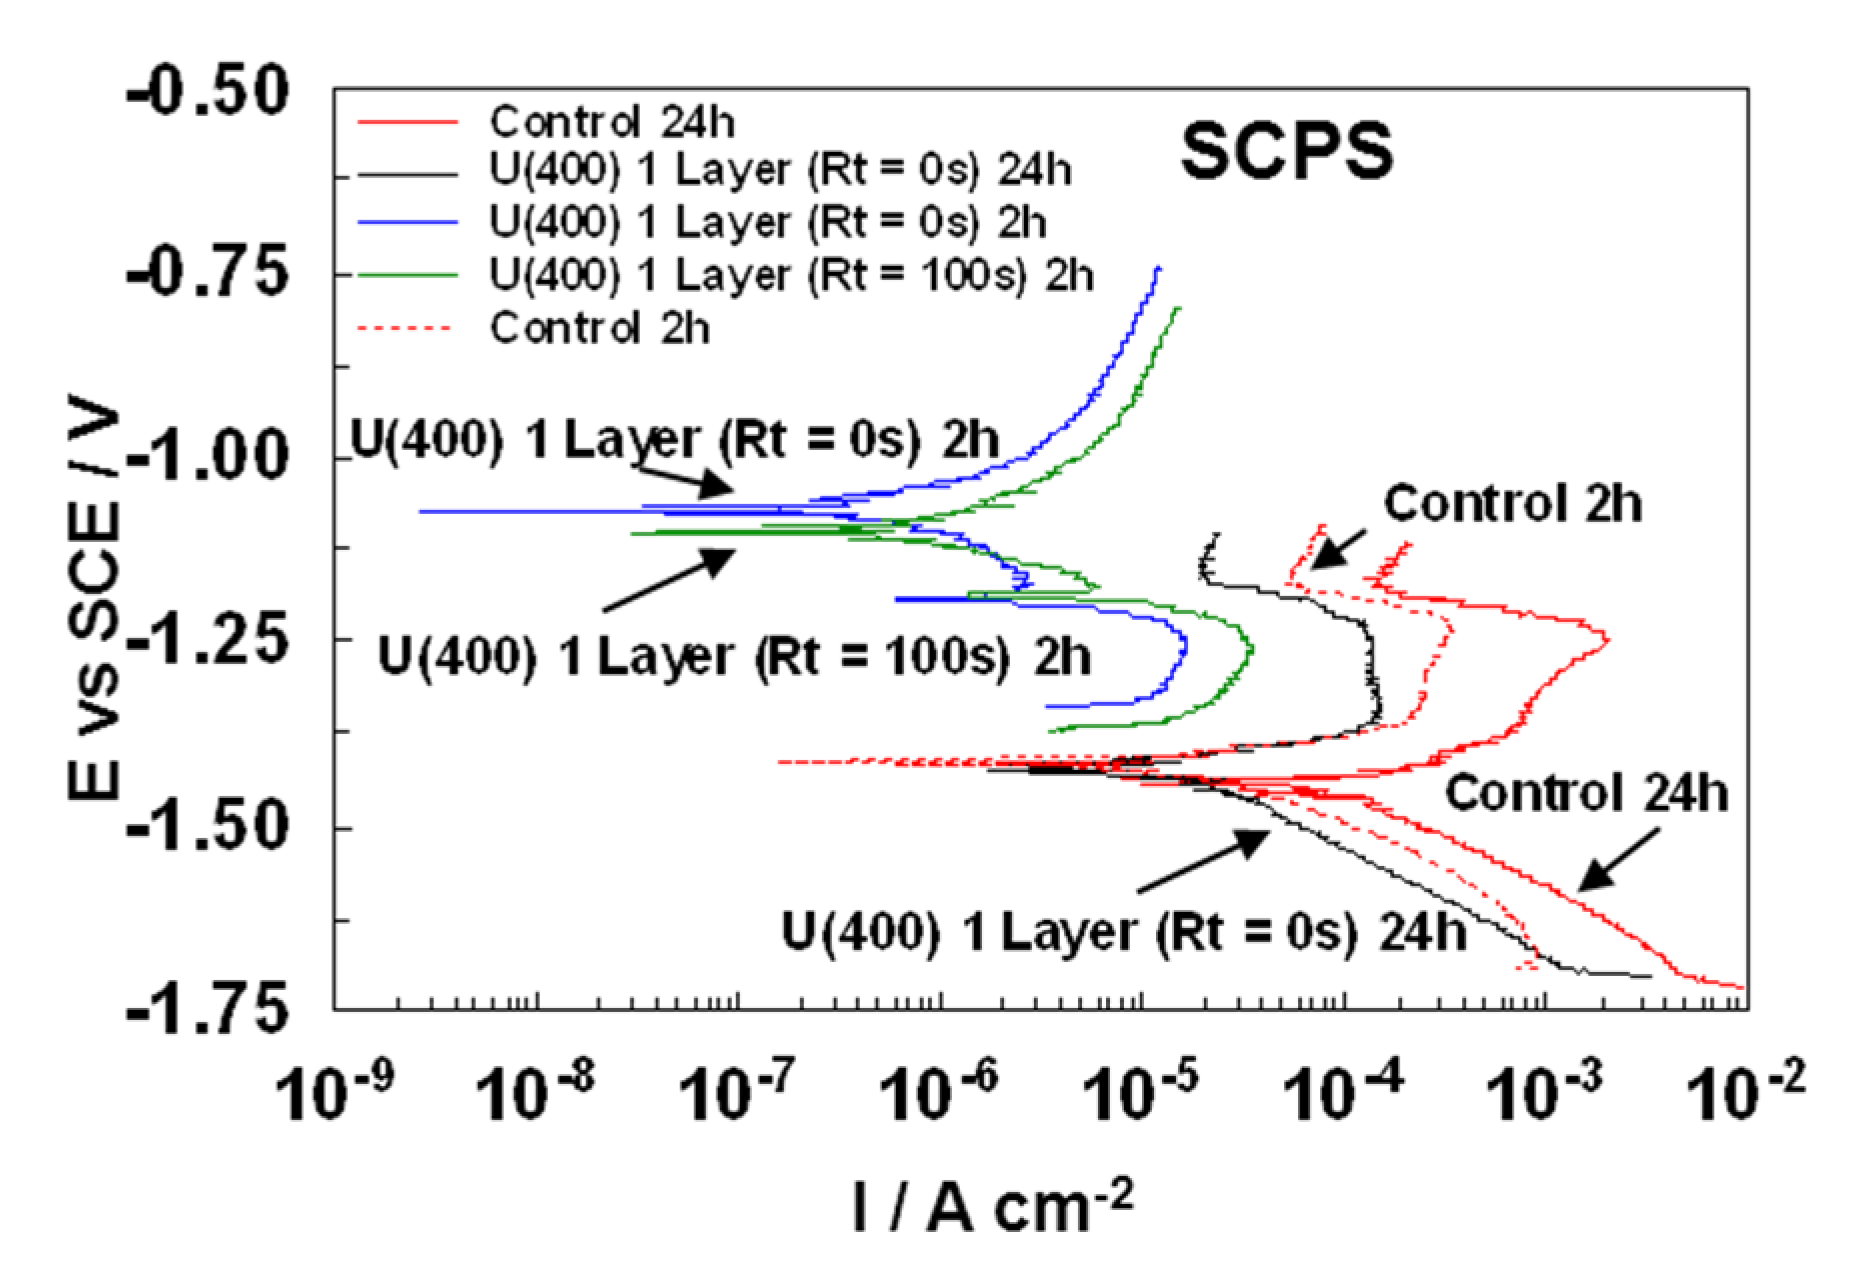
3.2.2. Potentiodynamic Polarization Studies
| Samples | ßa | ßc | Ecorr | icorr | Rp | PE |
|---|---|---|---|---|---|---|
| (V vs. SCE) | (V vs. SCE) | (V vs. SCE) | (A·cm−2) | (Ω·cm2) | % | |
| t = 2 h in SCPS | ||||||
| HDGS uncoated (control) | 0.101 | 0.035 | −1.41 | 2.87 × 10⁻⁵ | 3.90 × 10² | – |
| HDGS_U(400) 1 Layer Rt = 0 s | 0.045 | 0.319 | −1.13 | 1.28 × 10⁻⁶ | 1.33 × 10⁴ | 96 |
| HDGS_U(400) 1 Layer Rt = 100 s | 0.059 | 0.115 | −1.11 | 6.71 × 10⁻⁷ | 2.54 × 10⁴ | 98 |
| t = 24 h in SCPS | ||||||
| HDGS uncoated (control) | 0.127 | 0.087 | −1.45 | 9.99 × 10⁻⁵ | 2.24 × 10² | – |
| HDGS_U(400) 1 Layer Rt = 0 s | 0.046 | 0.139 | −1.41 | 1.66 × 10⁻⁵ | 2.76 × 10³ | 83 |
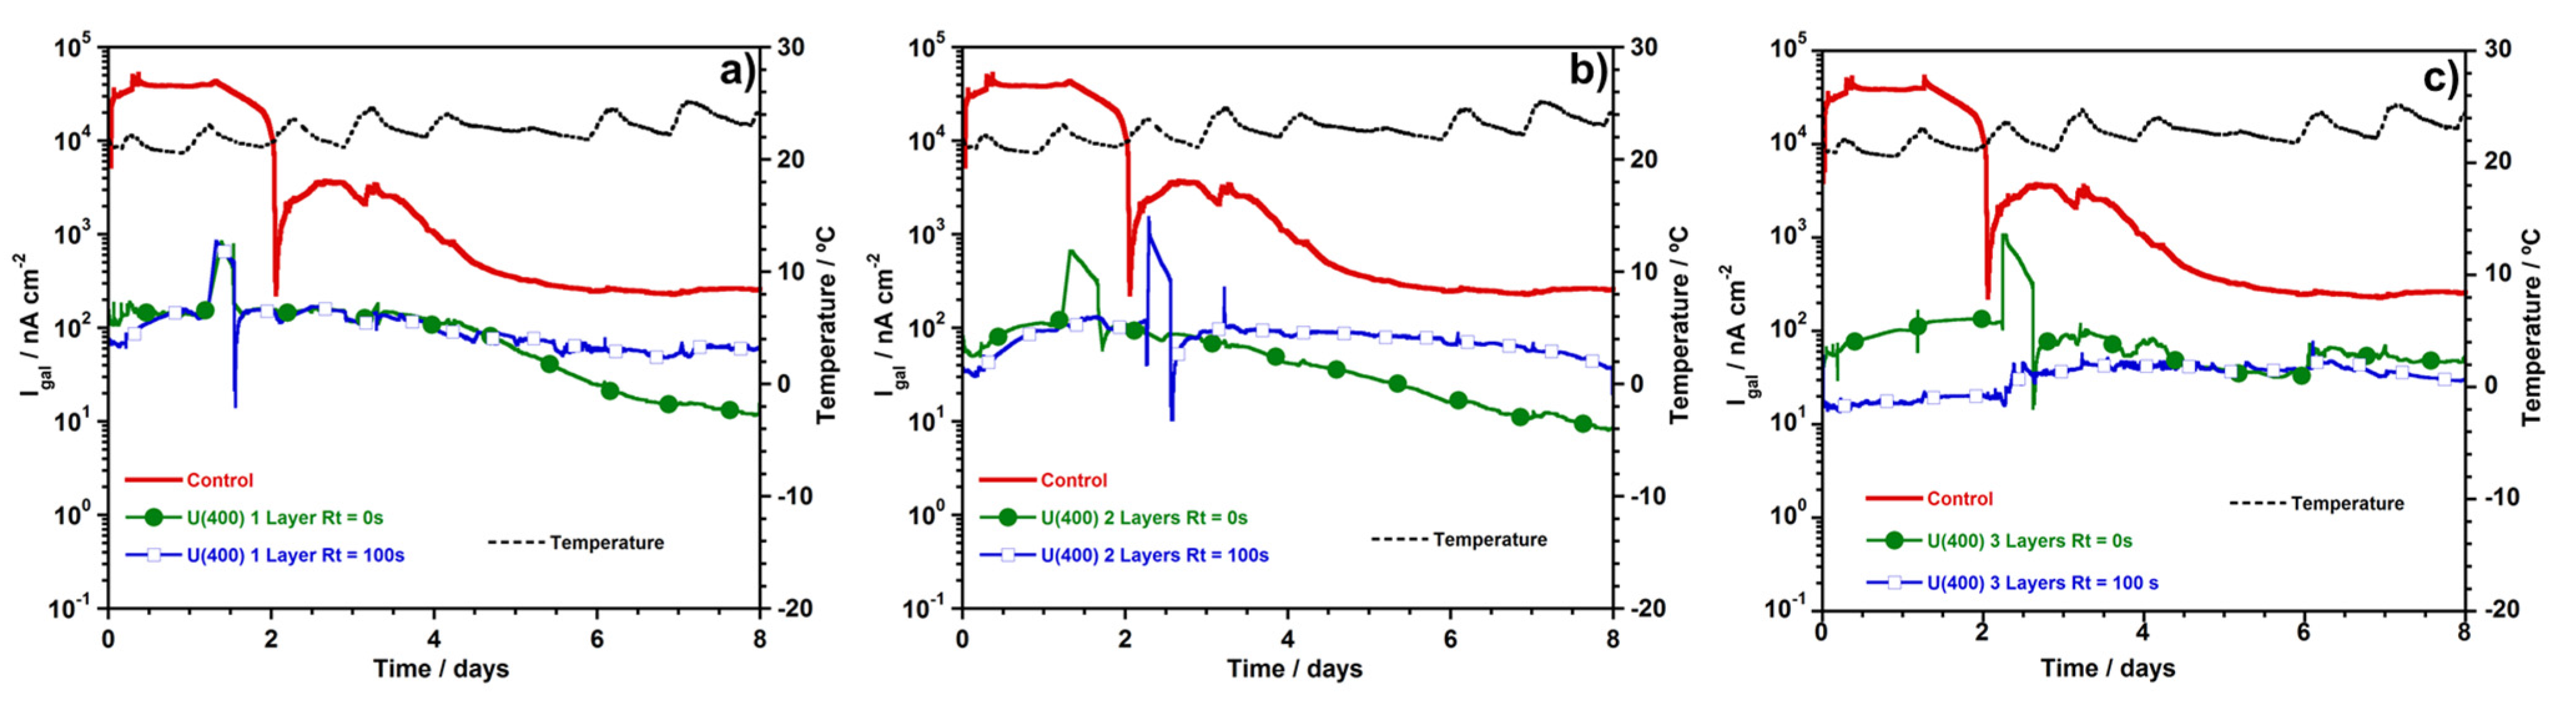
3.2.3. Macrocell Current Density (igal)
4. Conlusions
Acknowledgments
Author Contributions
Conflicts of Interest
References
- Virmani, Y.P. Corrosion Costs and Preventive Strategies in the United States; US Department of Transportation: Philadelphia, PA, USA, 2002; pp. 1–16. [Google Scholar]
- Ormellese, M.; Berra, M.; Bolzoni, F.; Pastore, T. Corrosion inhibitors for chlorides induced corrosion in reinforced concrete structures. Cem. Concr. Res. 2006, 36, 536–547. [Google Scholar] [CrossRef]
- Böhni, H. Corrosion in Reinforced Concrete Structures; Woodhead Publishing Ltd.: Cambridge, UK, 2005. [Google Scholar]
- Page, C.L.; Treadaway, K.W.J. Aspects of the electrochemistry of steel in concrete. Nature 1982, 297, 109–115. [Google Scholar] [CrossRef]
- Blunt, J.; Jen, G.; Ostertag, C.P. Enhancing corrosion resistance of reinforced concrete structures with hybrid fiber reinforced concrete. Corros. Sci. 2015, 92, 182–191. [Google Scholar] [CrossRef]
- Pereira, E.V.; Figueira, R.B.; Salta, M.M.; Fonseca, I.T.E. Long-term efficiency of two organic corrosion inhibitors for reinforced concrete. Mater. Sci. Forum 2010, 636–637, 1059–1064. [Google Scholar]
- Yeomans, S.R. Galvanized Steel Reinforcement in Concrete; Elsevier: Amsterdam, The Netherlands, 2004. [Google Scholar]
- Bellezze, T.; Malavolta, M.; Quaranta, A.; Ruffini, N.; Roventi, G. Corrosion behaviour in concrete of three differently galvanized steel bars. Cem. Concr. Compos. 2006, 28, 246–255. [Google Scholar] [CrossRef]
- Recio, F.J.; Alonso, M.C.; Gaillet, L.; Sánchez, M. Hydrogen embrittlement risk of high strength galvanized steel in contact with alkaline media. Corros. Sci. 2011, 53, 2853–2860. [Google Scholar] [CrossRef]
- Brachet, M.; Raharinaivo, M.A. Des aciers à haute résistance, galvanisés, utilisables comme armatures de béton précontraint. Mater. Struct. 1975, 8, 323–327. (In French) [Google Scholar]
- Akamphon, S.; Sukkasi, S.; Boonyongmaneerat, Y. Reduction of zinc consumption with enhanced corrosion protection in hot-dip galvanized coatings: A process-based cost analysis. Resour. Conserv. Recycl. 2012, 58, 1–7. [Google Scholar] [CrossRef]
- Porter, F.C. Corrosion Resistance of Zinc and Zinc Alloys; CRC Press: Boca Raton, FL, USA, 1994. [Google Scholar]
- Figueira, R.B.; Silva, C.J.R.; Pereira, E.V.; Salta, M.M. Corrosion of hot-dip galvanized steel reinforcement. Corros. E Prot. Mater. 2014, 33, 51–61. [Google Scholar]
- Hamad, B.S.; Mike, J.A. Bond strength of hot-dip galvanized reinforcement in normal strength concrete structures. Constr. Build. Mater. 2005, 19, 275–283. [Google Scholar] [CrossRef]
- Macías, A.; Andrade, C. Corrosion of galvanized steel in dilute Ca(OH)2 solutions (pH 11·1–12·6). Br. Corros. J. 1987, 22, 162–171. [Google Scholar] [CrossRef]
- Macias, A.; Andrade, C. Corrosion of galvanized steel reinforcements in alkaline solutions: Part 1: Electrochemical results. Br. Corros. J. 1987, 22, 113–118. [Google Scholar] [CrossRef]
- Macias, A.; Andrade, C. Corrosion of galvanized steel reinforcements in alkaline solutions: Part 2: SEM study and identification of corrosion products. Br. Corros. J. 1987, 22, 119–130. [Google Scholar] [CrossRef]
- Macías, A.; Andrade, C. Corrosion rate of galvanized steel immersed in saturated solutions of Ca(OH)2 in the pH range 12–13·8. Br. Corros. J. 1983, 18, 82–87. [Google Scholar] [CrossRef]
- Figueira, R.B.; Silva, C.J.R.; Pereira, E.V. Organic–inorganic hybrid sol–gel coatings for metal corrosion protection: A review of recent progress. J. Coat. Technol. Res. 2014, 1–35. [Google Scholar]
- Balgude, D.; Sabnis, A. Sol–gel derived hybrid coatings as an environment friendly surface treatment for corrosion protection of metals and their alloys. J. Sol-Gel Sci. Technol. 2012, 64, 124–134. [Google Scholar] [CrossRef]
- Guglielmi, M. Sol-gel coatings on metals. J. Sol-Gel Sci. Technol. 1997, 8, 443–449. [Google Scholar]
- Figueira, R.B.; Silva, C.J.; Pereira, E.V.; Salta, M.M. Ureasilicate hybrid coatings for corrosion protection of galvanized steel in cementitious media. J. Electrochem. Soc. 2013, 160, C467–C479. [Google Scholar] [CrossRef]
- Sánchez, M.; Alonso, M.C.; Cecílio, P.; Montemor, M.F.; Andrade, C. Electrochemical and analytical assessment of galvanized steel reinforcement pre-treated with Ce and La salts under alkaline media. Cem. Concr. Compos. 2006, 28, 256–266. [Google Scholar] [CrossRef]
- ASTM G109 Test Method for Determining Effects of Chemical Admixtures on Corrosion of Embedded Steel Reinforcement in Concrete Exposed to Chloride Environments; ASTM International: West Conshohocken, PA, USA, 2007.
- ISO 16962:2005 Surface Chemical Analysis—Analysis of Zinc- and/or Aluminium-Based Metallic Coatings by Glow-Discharge Optical-Emission Spectrometry; ISO: Geneva, Switzerland, 2005.
- Khulbe, K.C.; Feng, C.Y.; Matsuura, T. Synthetic Polymeric Membranes; pringer Laboratory; SSpringer Berlin Heidelberg: Berlin, Heidelberg, Germany, 2008. [Google Scholar]
- Zheludkevich, M.L.; Yasakau, K.A.; Bastos, A.C.; Karavai, O.V.; Ferreira, M.G.S. On the application of electrochemical impedance spectroscopy to study the self-healing properties of protective coatings. Electrochem. Commun. 2007, 2622–2628. [Google Scholar] [CrossRef]
- Arthanareeswari, M.; Narayanan, T.S.N.S.; Kamaraj, P.; Tamilselvi, M. Polarization and impedance studies on zinc phosphate coating developed using galvanic coupling. J. Coat. Technol. Res. 2012, 9, 39–46. [Google Scholar] [CrossRef]
- Lamaka, S.V.; Zheludkevich, M.L.; Yasakau, K.A.; Serra, R.; Poznyak, S.K.; Ferreira, M.G.S. Nanoporous titania interlayer as reservoir of corrosion inhibitors for coatings with self-healing ability. Prog. Org. Coat. 2007, 58, 127–135. [Google Scholar] [CrossRef]
- Barsoukov, E.; Macdonald, J.R. Impedance Spectroscopy: Theory, Experiment, and Applications, 2nd Ed. ed; Wiley: Hoboken, NJ, USA, 2005. [Google Scholar]
- Orazem, M.E.; Tribollet, B. Electrochemical Impedance Spectroscopy; Wiley: Hoboken, NJ, USA, 2008. [Google Scholar]
- Hirschorn, B.; Orazem, M.E.; Tribollet, B.; Vivier, V.; Frateur, I.; Musiani, M. Determination of effective capacitance and film thickness from constant-phase-element parameters. Electrochim. Acta 2010, 55, 6218–6227. [Google Scholar] [CrossRef]
- Hsu, C.H.; Mansfeld, F. Technical note: concerning the conversion of the constant phase element parameter Y0 into a capacitance. Corrosion 2001, 57. [Google Scholar] [CrossRef]
- Lebrini, M.; Fontaine, G.; Gengembre, L.; Traisnel, M.; Lerasle, O.; Genet, N. Corrosion behaviour of galvanized steel and electroplating steel in aqueous solution: AC impedance study and XPS. Appl. Surf. Sci. 2008, 254, 6943–6947. [Google Scholar] [CrossRef]
- Lebrini, M.; Fontaine, G.; Gengembre, L.; Traisnel, M.; Lerasle, O.; Genet, N. Corrosion protection of galvanized steel and electroplating steel by decanoïc acid in aqueous solution: Electrochemical impedance spectroscopy, XPS and ATR-FTIR. Corros. Sci. 2009, 51, 1201–1206. [Google Scholar] [CrossRef]
- Corfias, C.; Pebere, N.; Lacabanne, C. Characterization of a thin protective coating on galvanized steel by electrochemical impedance spectroscopy and a thermostimulated current method. Corros. Sci. 1999, 41, 1539–1555. [Google Scholar] [CrossRef]
- Hamlaoui, Y.; Tifouti, L.; Pedraza, F. Corrosion behaviour of molybdate–phosphate–silicate coatings on galvanized steel. Corros. Sci. 2009, 51, 2455–2462. [Google Scholar] [CrossRef]
- Ahmad, S.; Zafar, F.; Sharmin, E.; Garg, N.; Kashif, M. Synthesis and characterization of corrosion protective polyurethanefattyamide/silica hybrid coating material. Prog. Org. Coat. 2012, 73, 112–117. [Google Scholar] [CrossRef]
- Figueira, R.M.; Pereira, E.V.; Silva, C.J.R.; Salta, M.M. Corrosion protection of hot dip galvanized steel in mortar. Port. Electrochim. Acta 2013, 31, 277–287. [Google Scholar] [CrossRef]
- González, J.A.; Vazquez, A.J. Effect of four coating structures on corrosion kinetic of galvanized reinforcement in concrete. Matér. Constr. 1984, 17, 409–414. [Google Scholar] [CrossRef]
- Everett, L.H.; Treadaway, K.W.J. The Use of Galvanised Steel Reinforcement in Building; Building Research Station, Ministry of Public Building and Works: Garston, UK, 1970. [Google Scholar]
- Andrade, M.C.; Macias, A. Galvanized Reinforcements in Concrete. In Surface Coatings—2; Wilson, A.D., Nicholson, J.W., Prosser, H.J., Eds.; Springer: Dordrecht, The Netherlands, 1988; pp. 137–182. [Google Scholar]
© 2015 by the authors; licensee MDPI, Basel, Switzerland. This article is an open access article distributed under the terms and conditions of the Creative Commons Attribution license (http://creativecommons.org/licenses/by/4.0/).
Share and Cite
Figueira, R.B.; Silva, C.J.R.; Pereira, E.V. Influence of Experimental Parameters Using the Dip-Coating Method on the Barrier Performance of Hybrid Sol-Gel Coatings in Strong Alkaline Environments. Coatings 2015, 5, 124-141. https://doi.org/10.3390/coatings5020124
Figueira RB, Silva CJR, Pereira EV. Influence of Experimental Parameters Using the Dip-Coating Method on the Barrier Performance of Hybrid Sol-Gel Coatings in Strong Alkaline Environments. Coatings. 2015; 5(2):124-141. https://doi.org/10.3390/coatings5020124
Chicago/Turabian StyleFigueira, Rita B., Carlos J. R. Silva, and Elsa V. Pereira. 2015. "Influence of Experimental Parameters Using the Dip-Coating Method on the Barrier Performance of Hybrid Sol-Gel Coatings in Strong Alkaline Environments" Coatings 5, no. 2: 124-141. https://doi.org/10.3390/coatings5020124