Tuning the Photocatalytic Activity of Anatase TiO2 Thin Films by Modifying the Preferred <001> Grain Orientation with Reactive DC Magnetron Sputtering


Abstract
:
1. Introduction
2. Experimental
2.1. Deposition of TiO2 Anatase Thin Films
2.2. Structural and Morphological Characterization
2.3. Optical Measurements
2.4. Photocatalytic Measurements
3. Results and Discussions
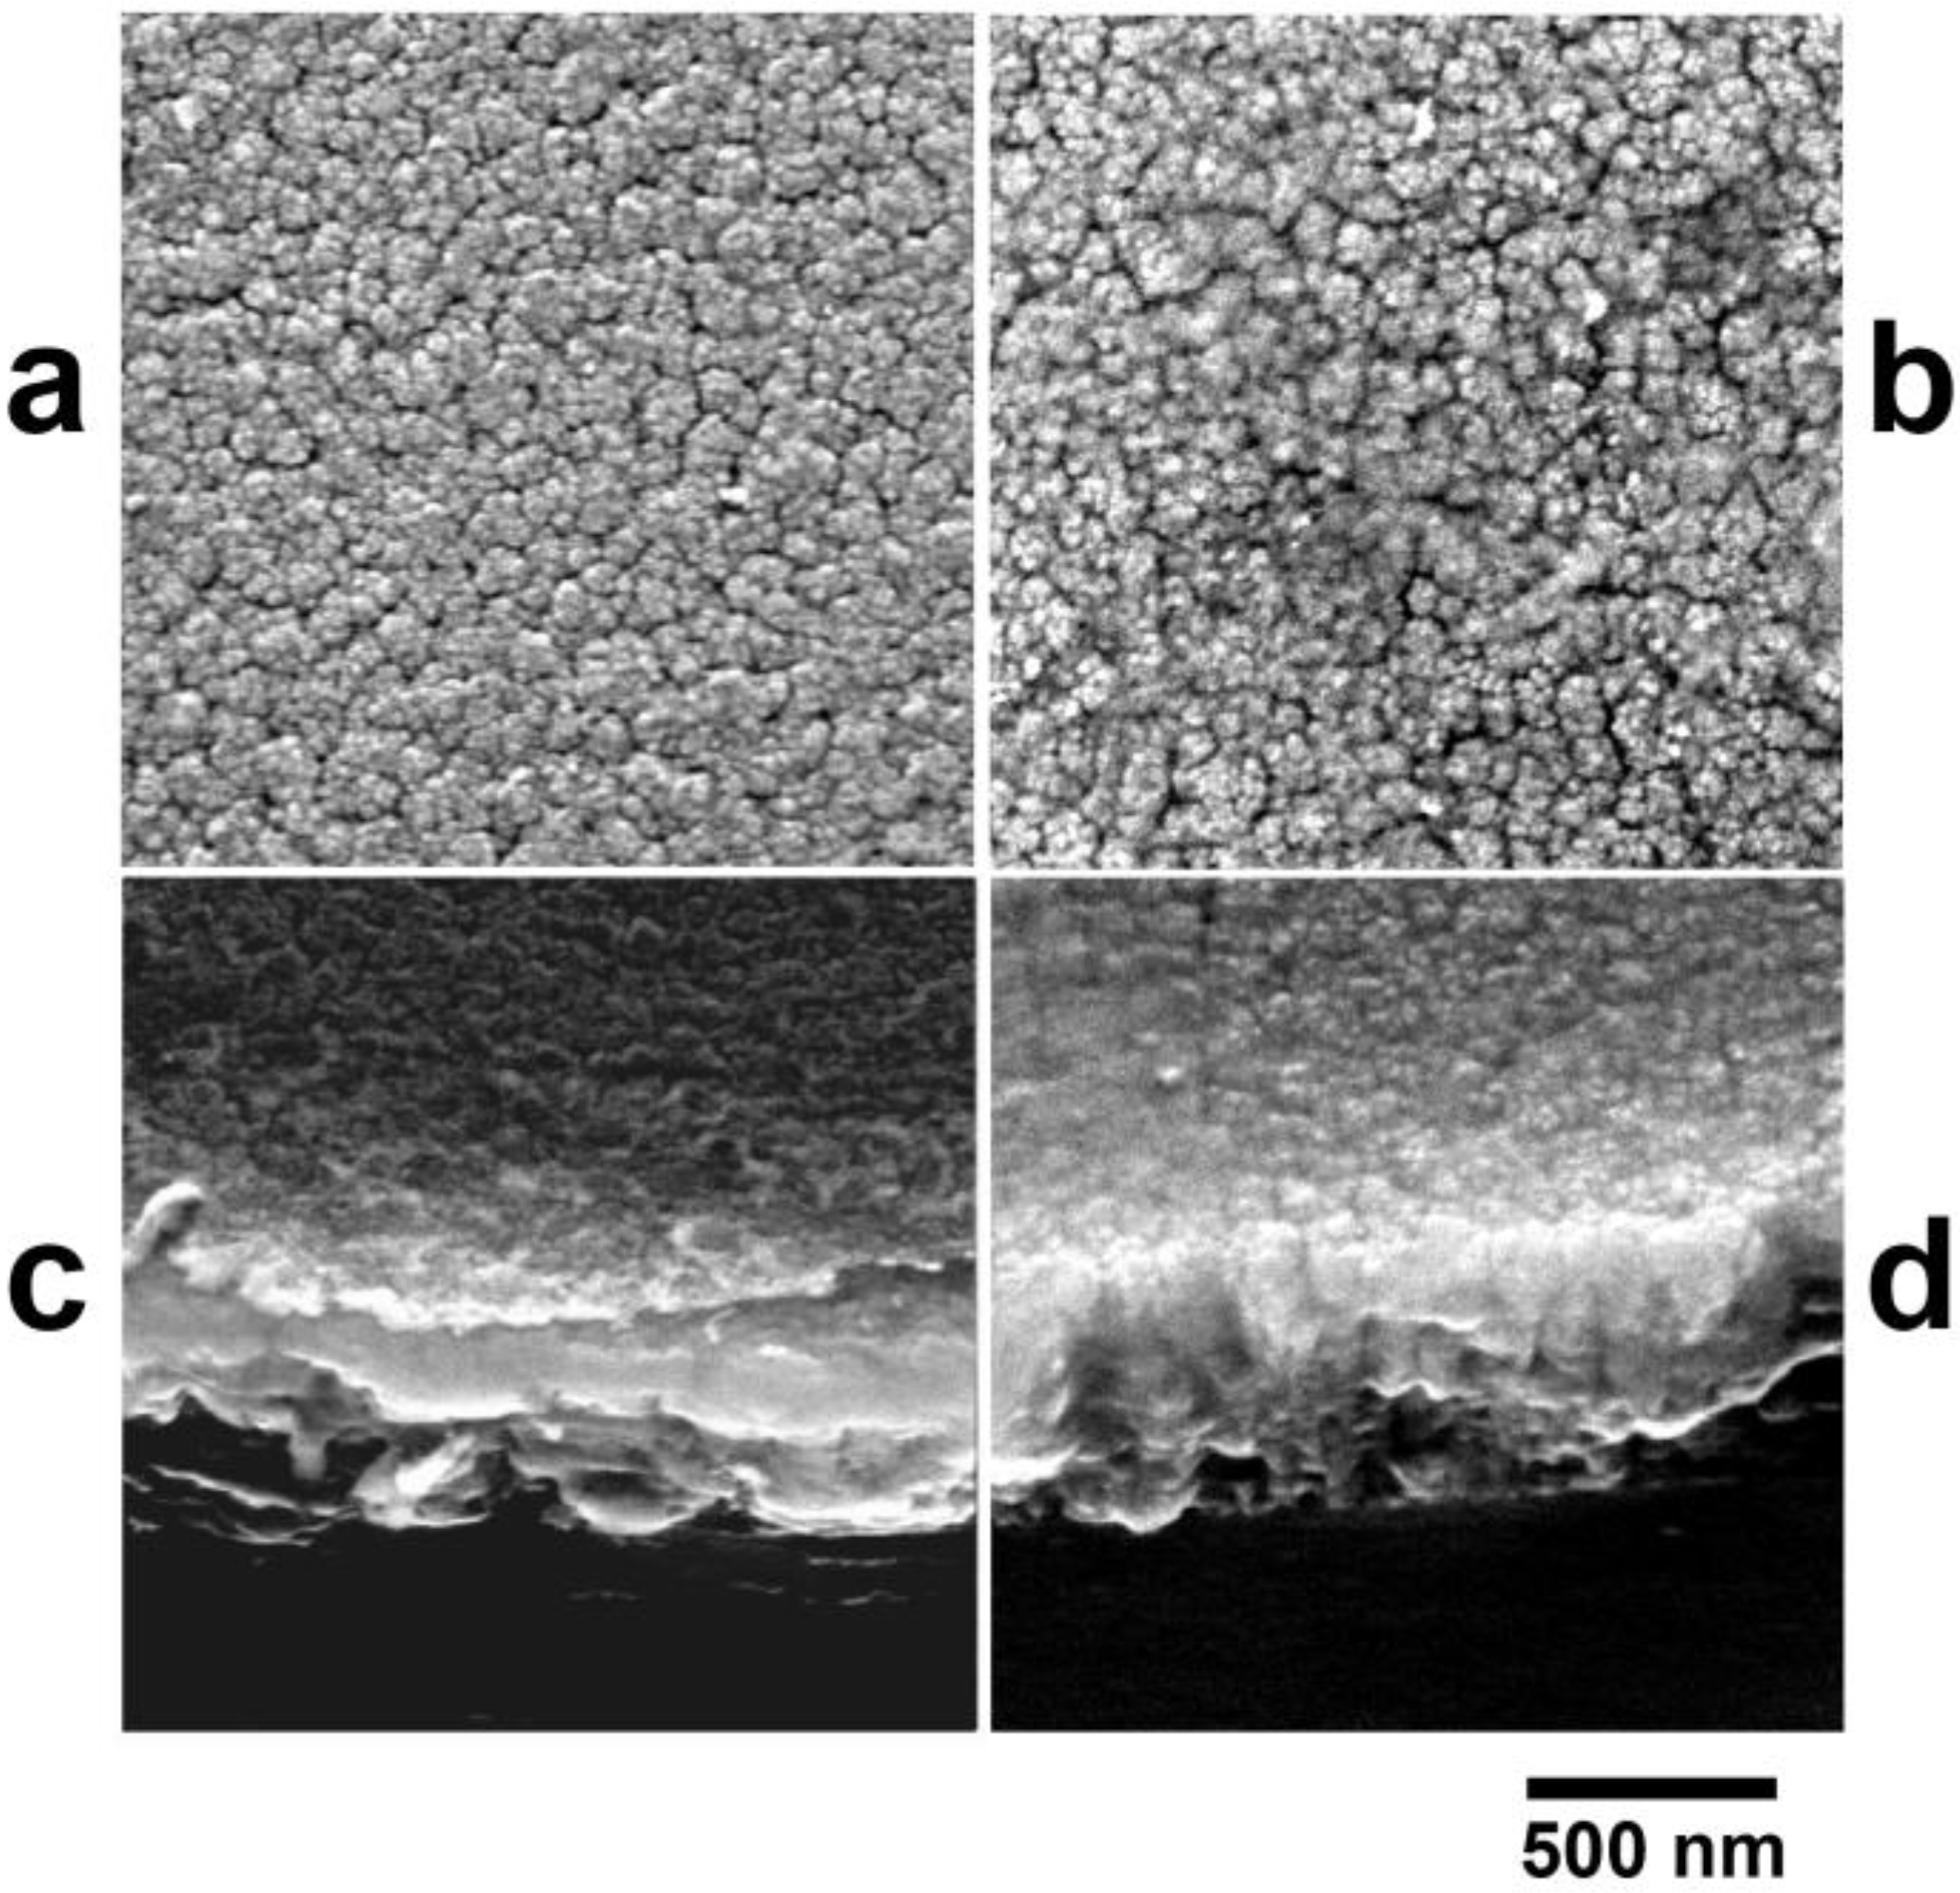
3.1. Film Structure and Morphology


| Deposition parameters and physical properties | PO2 = 0.65 mTorr | PO2 = 0.95 mTorr | PO2 = 1.30 mTorr |
|---|---|---|---|
| Total pressure (mTorr) | 20 | ||
| Total flow (mL·min−1) | 62 | 63 | 64 |
| O2 flow (mL·min−1) | 2 | 3 | 4 |
| Ar flow, (mL·min−1) | 60 | 60 | 60 |
| Sputtering power (W) | 212 | 224 | 245 |
| Sputtering rate (nm·min−1) | 16 | 17 | 19 |
| Stoichiometry of post-annealed films (from EDX, expressed as IO Kα/ITi Kα) | 0.652 | 0.650 | 0.645 |
| Morphology | |||
| Thickness, d (nm) | 574 | 579 | 664 |
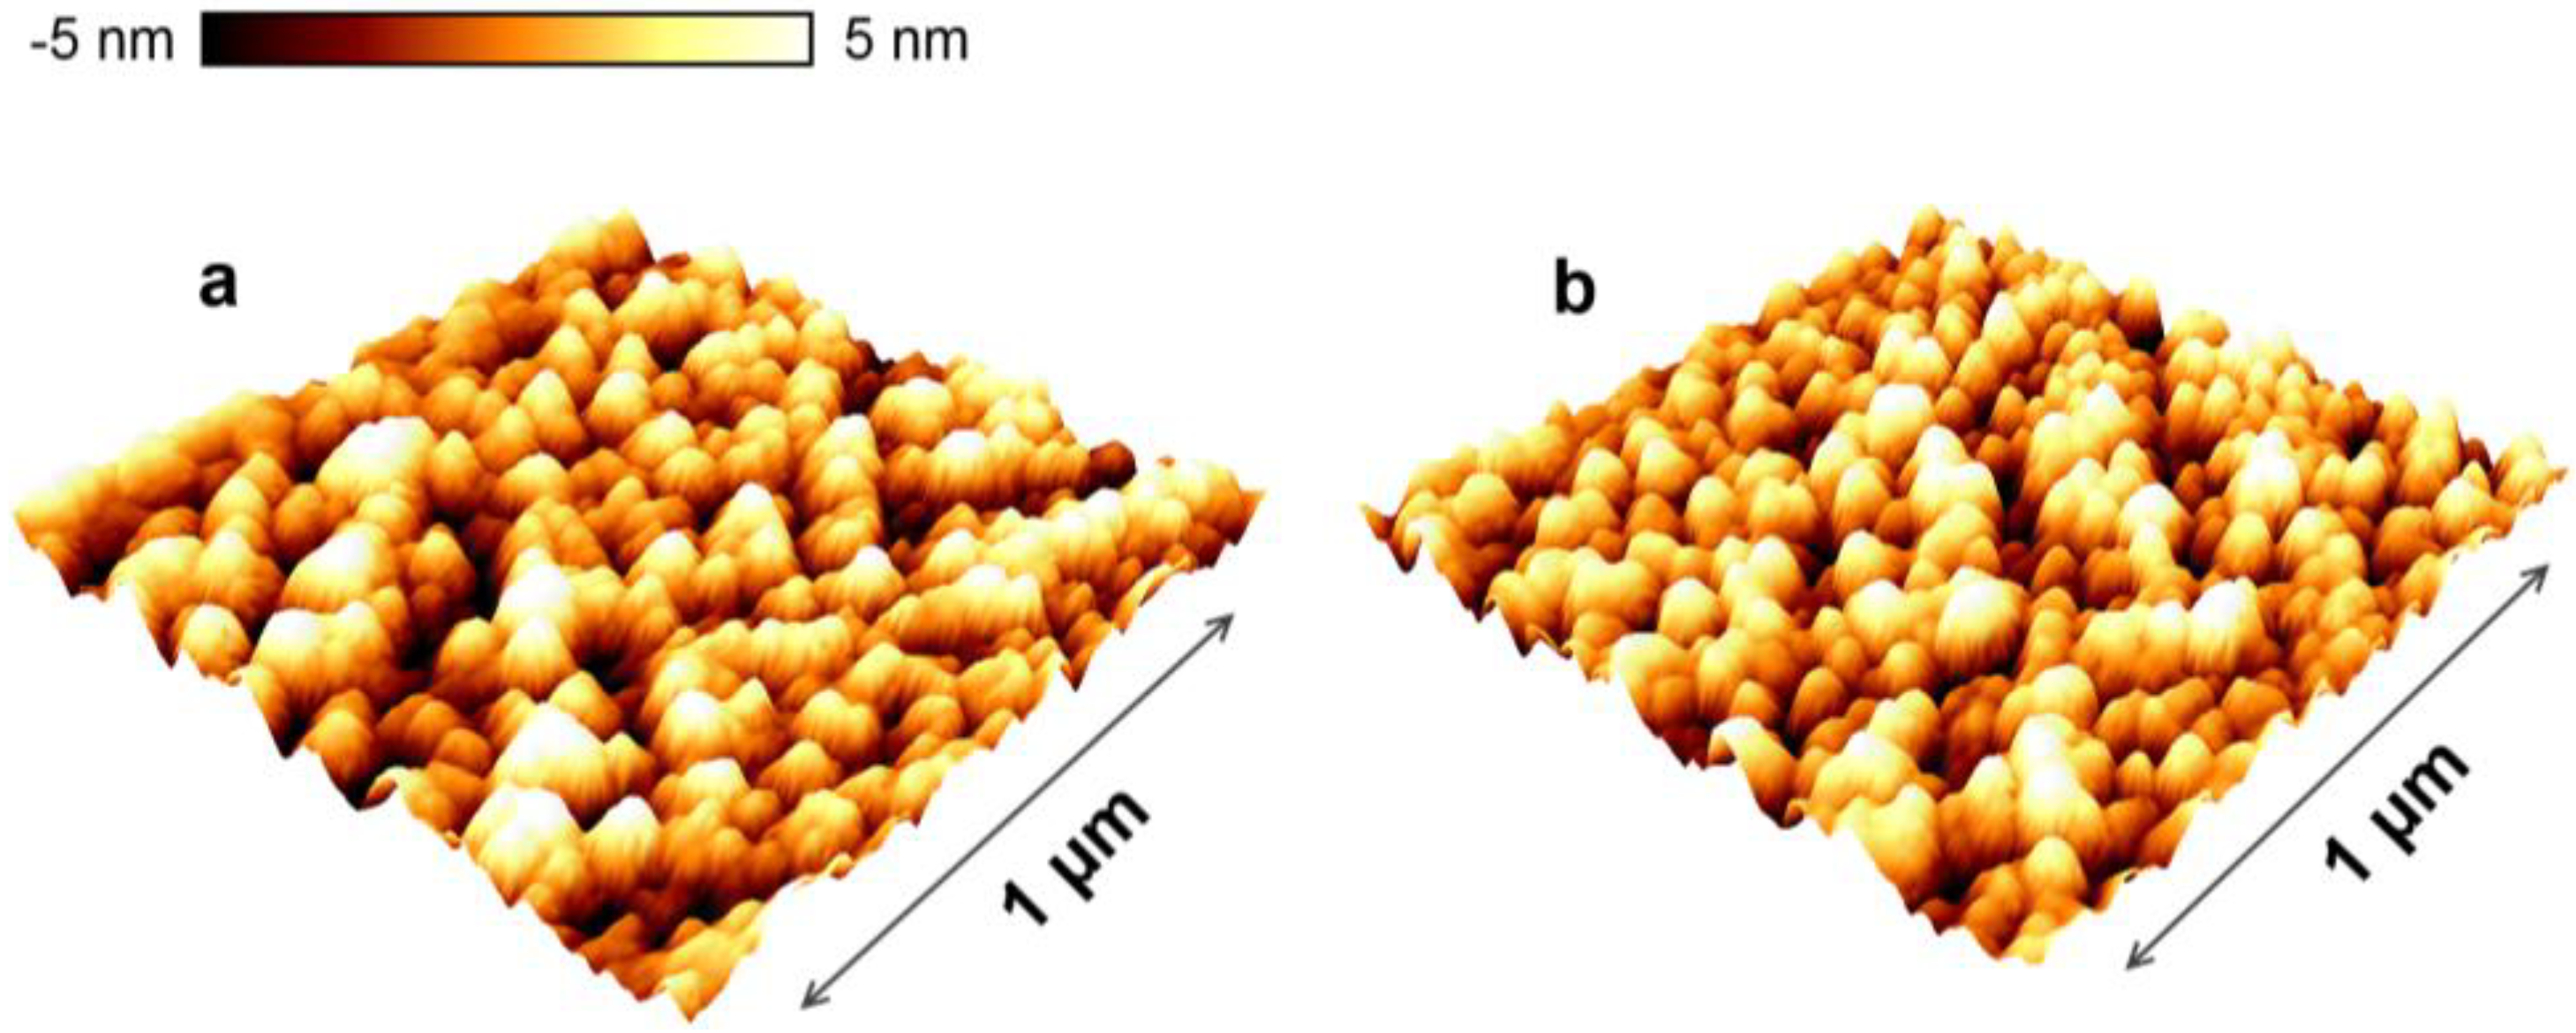
| AFM rms roughness (nm) | 1.3 | 1.1 | 1.4 |
| Crystallographic properties | |||
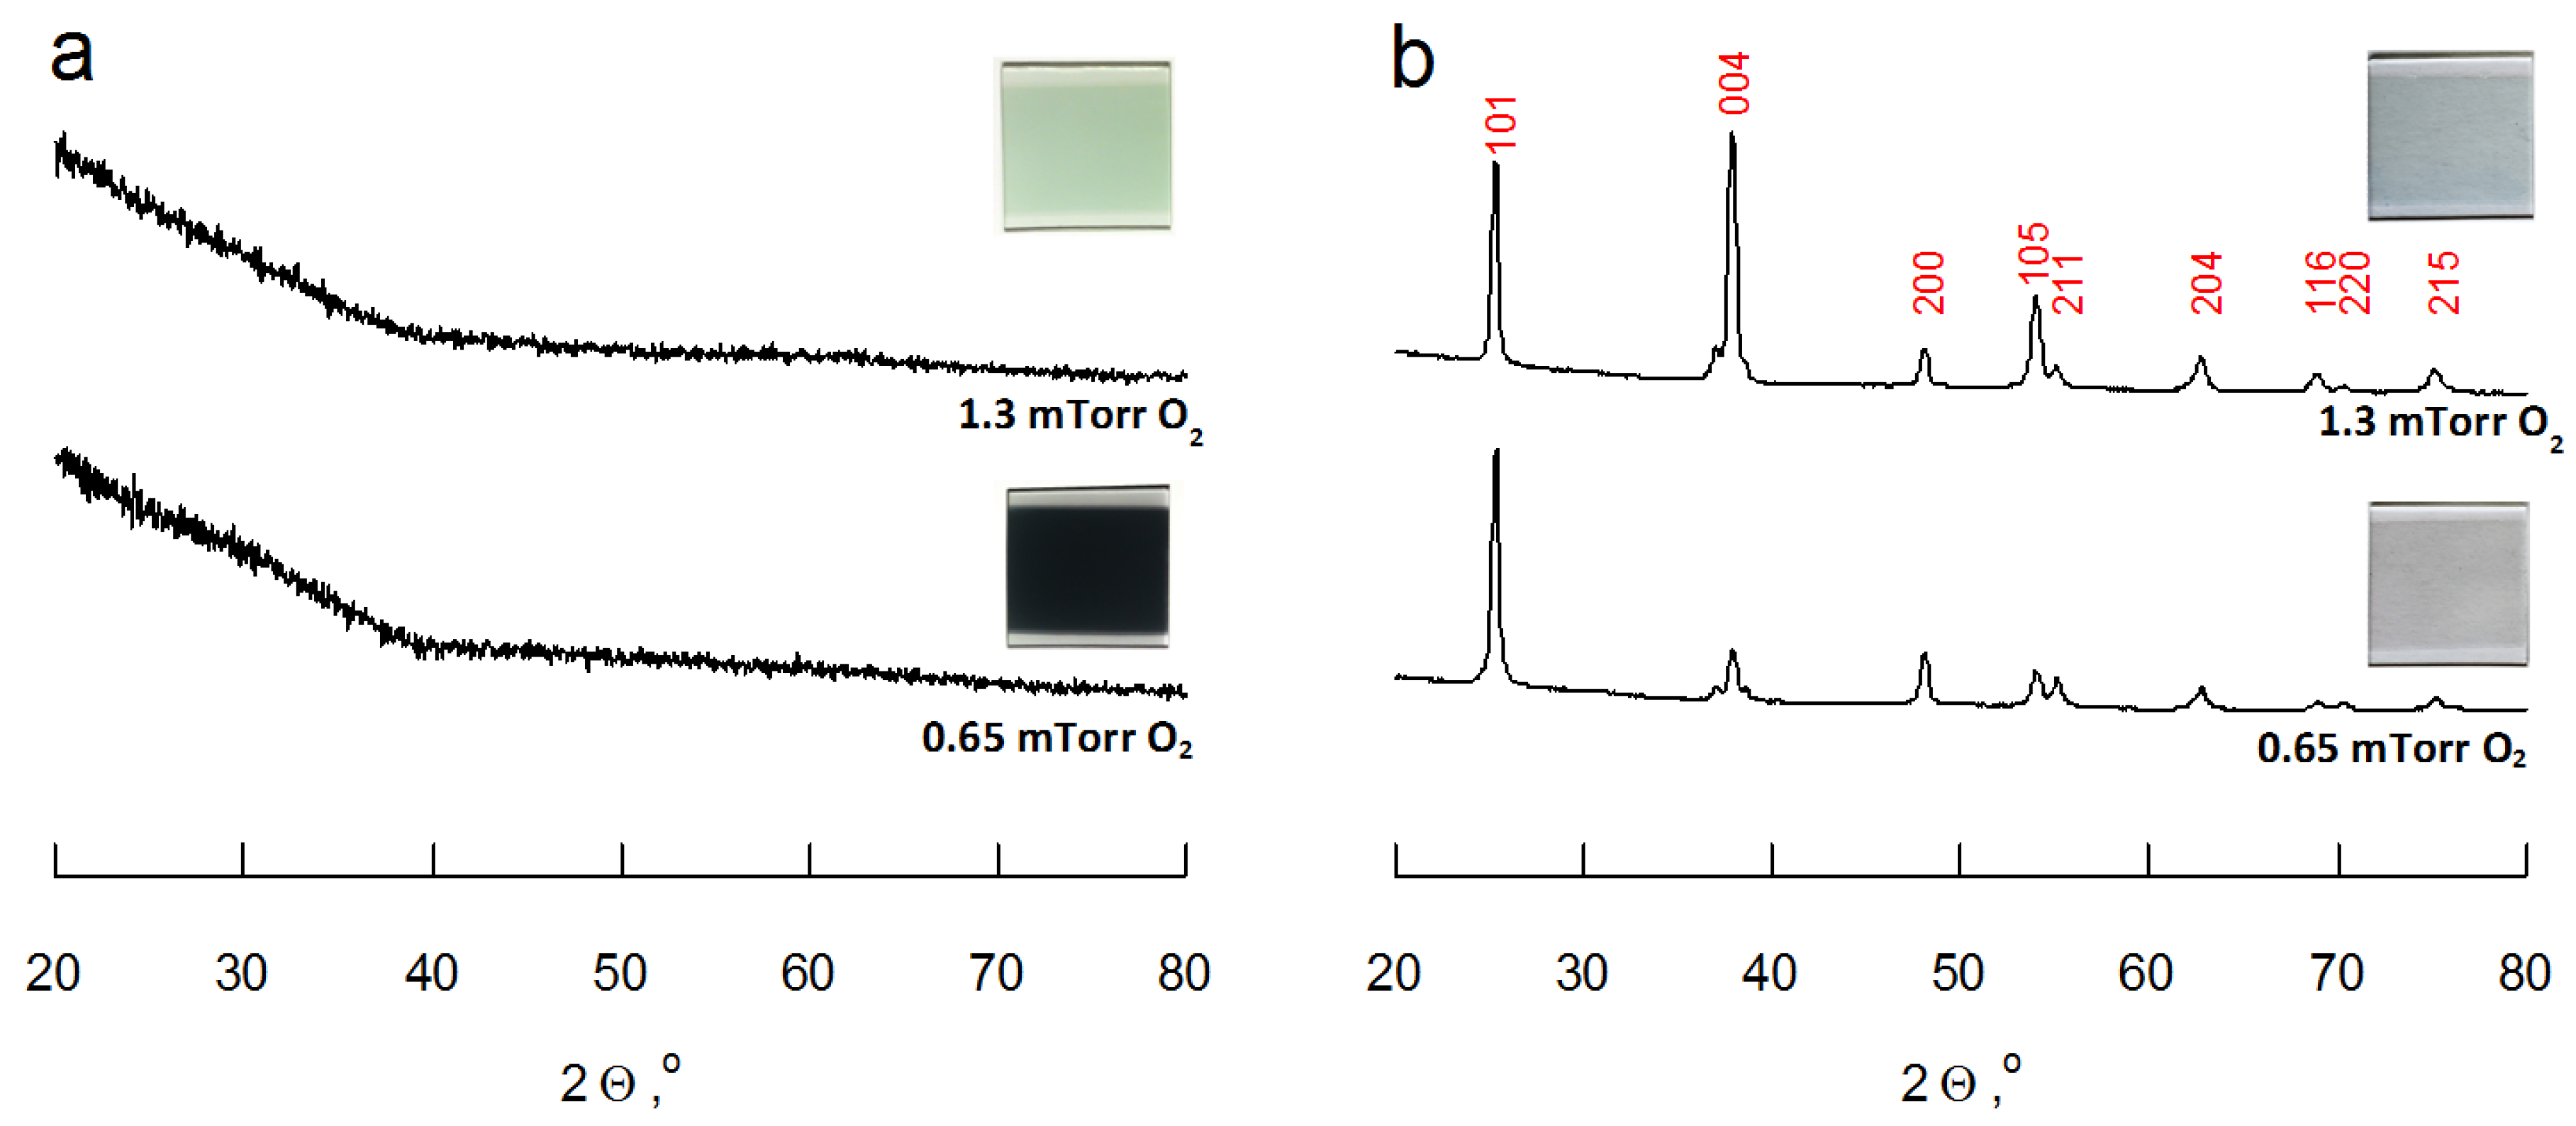
| March-Dollase (MD) parameter | 0.966 | 0.810 | 0.637 |
| Preferential <004> orientation, % | 2 | 12 | 25 |
| Mean crystalline size (nm) | 24.2 | 26 | 22.1 |
| Optical properties | |||
| Refractive index, n | 2.23 | 2.15 | 2.04 |
| Packing density (Pullker), % | 88 | 84 | 79 |
| Optical bandgap, Eg (eV) | 3.32 | 3.29 | 3.29 |
3.2. Optical Measurements


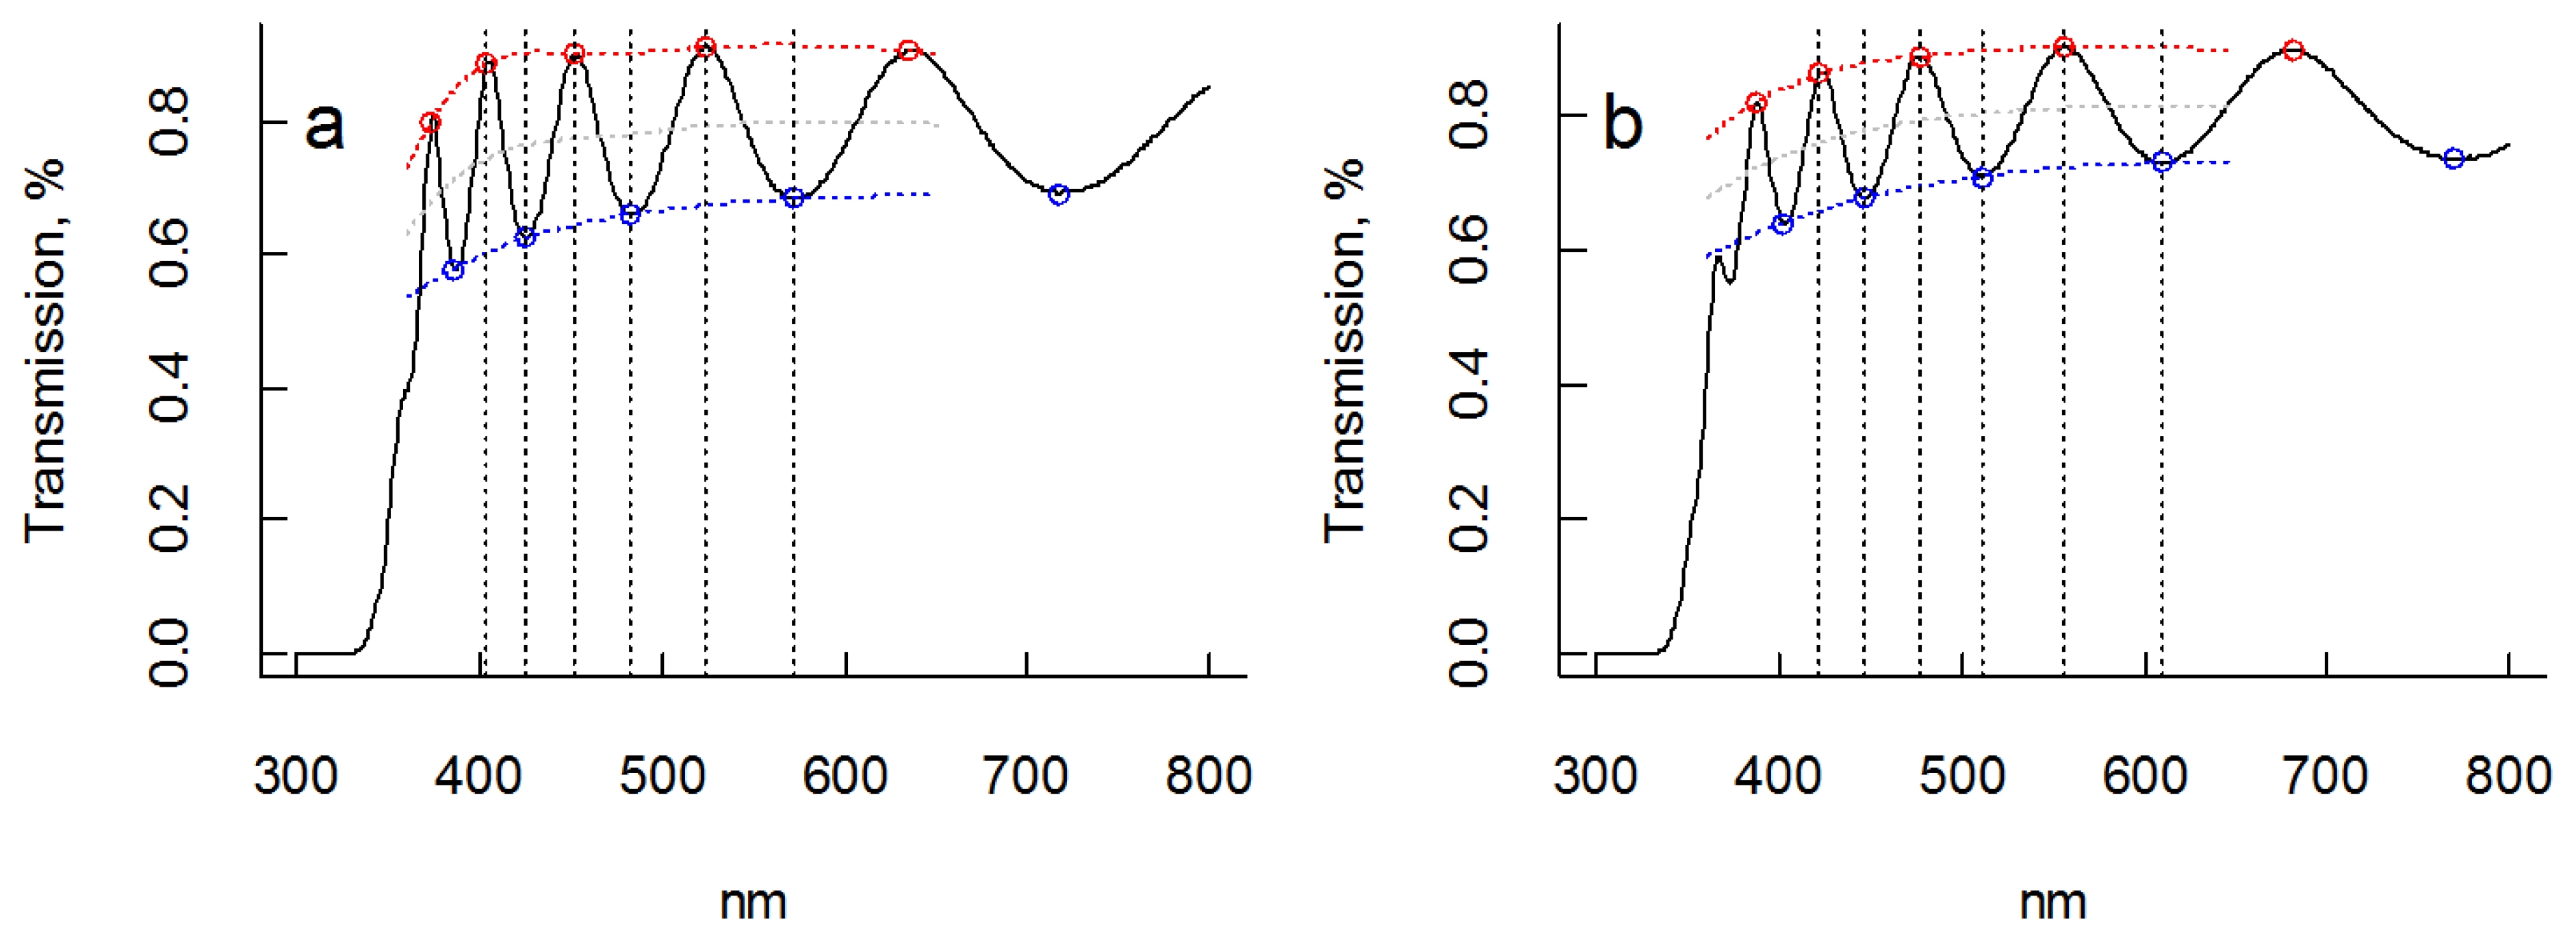


 as a function of photon energy, E = hν, should yield a linear dependence assuming parabolic band dispersion. This is a good approximation close to Eg (E > Eg). A linear region is discerned for both films in the region ~3.4 to ~3.6 eV, and extrapolation yields Eg ≈ 3.3 eV for both samples in fair agreement with tabulated data of bulk anatase TiO2 (Eg = 3.2 eV). Corresponding Tauc plots of versus E are shown in Figure 5. vs. photon energy, E, and least square linear fit of data for films with (a) no orientation and (b) preferential <001> orientation. In both cases the optical bandgap was estimated to be 3.3 eV.
vs. photon energy, E, and least square linear fit of data for films with (a) no orientation and (b) preferential <001> orientation. In both cases the optical bandgap was estimated to be 3.3 eV.
as a function of photon energy, E = hν, should yield a linear dependence assuming parabolic band dispersion. This is a good approximation close to Eg (E > Eg). A linear region is discerned for both films in the region ~3.4 to ~3.6 eV, and extrapolation yields Eg ≈ 3.3 eV for both samples in fair agreement with tabulated data of bulk anatase TiO2 (Eg = 3.2 eV). Corresponding Tauc plots of versus E are shown in Figure 5. vs. photon energy, E, and least square linear fit of data for films with (a) no orientation and (b) preferential <001> orientation. In both cases the optical bandgap was estimated to be 3.3 eV.
vs. photon energy, E, and least square linear fit of data for films with (a) no orientation and (b) preferential <001> orientation. In both cases the optical bandgap was estimated to be 3.3 eV.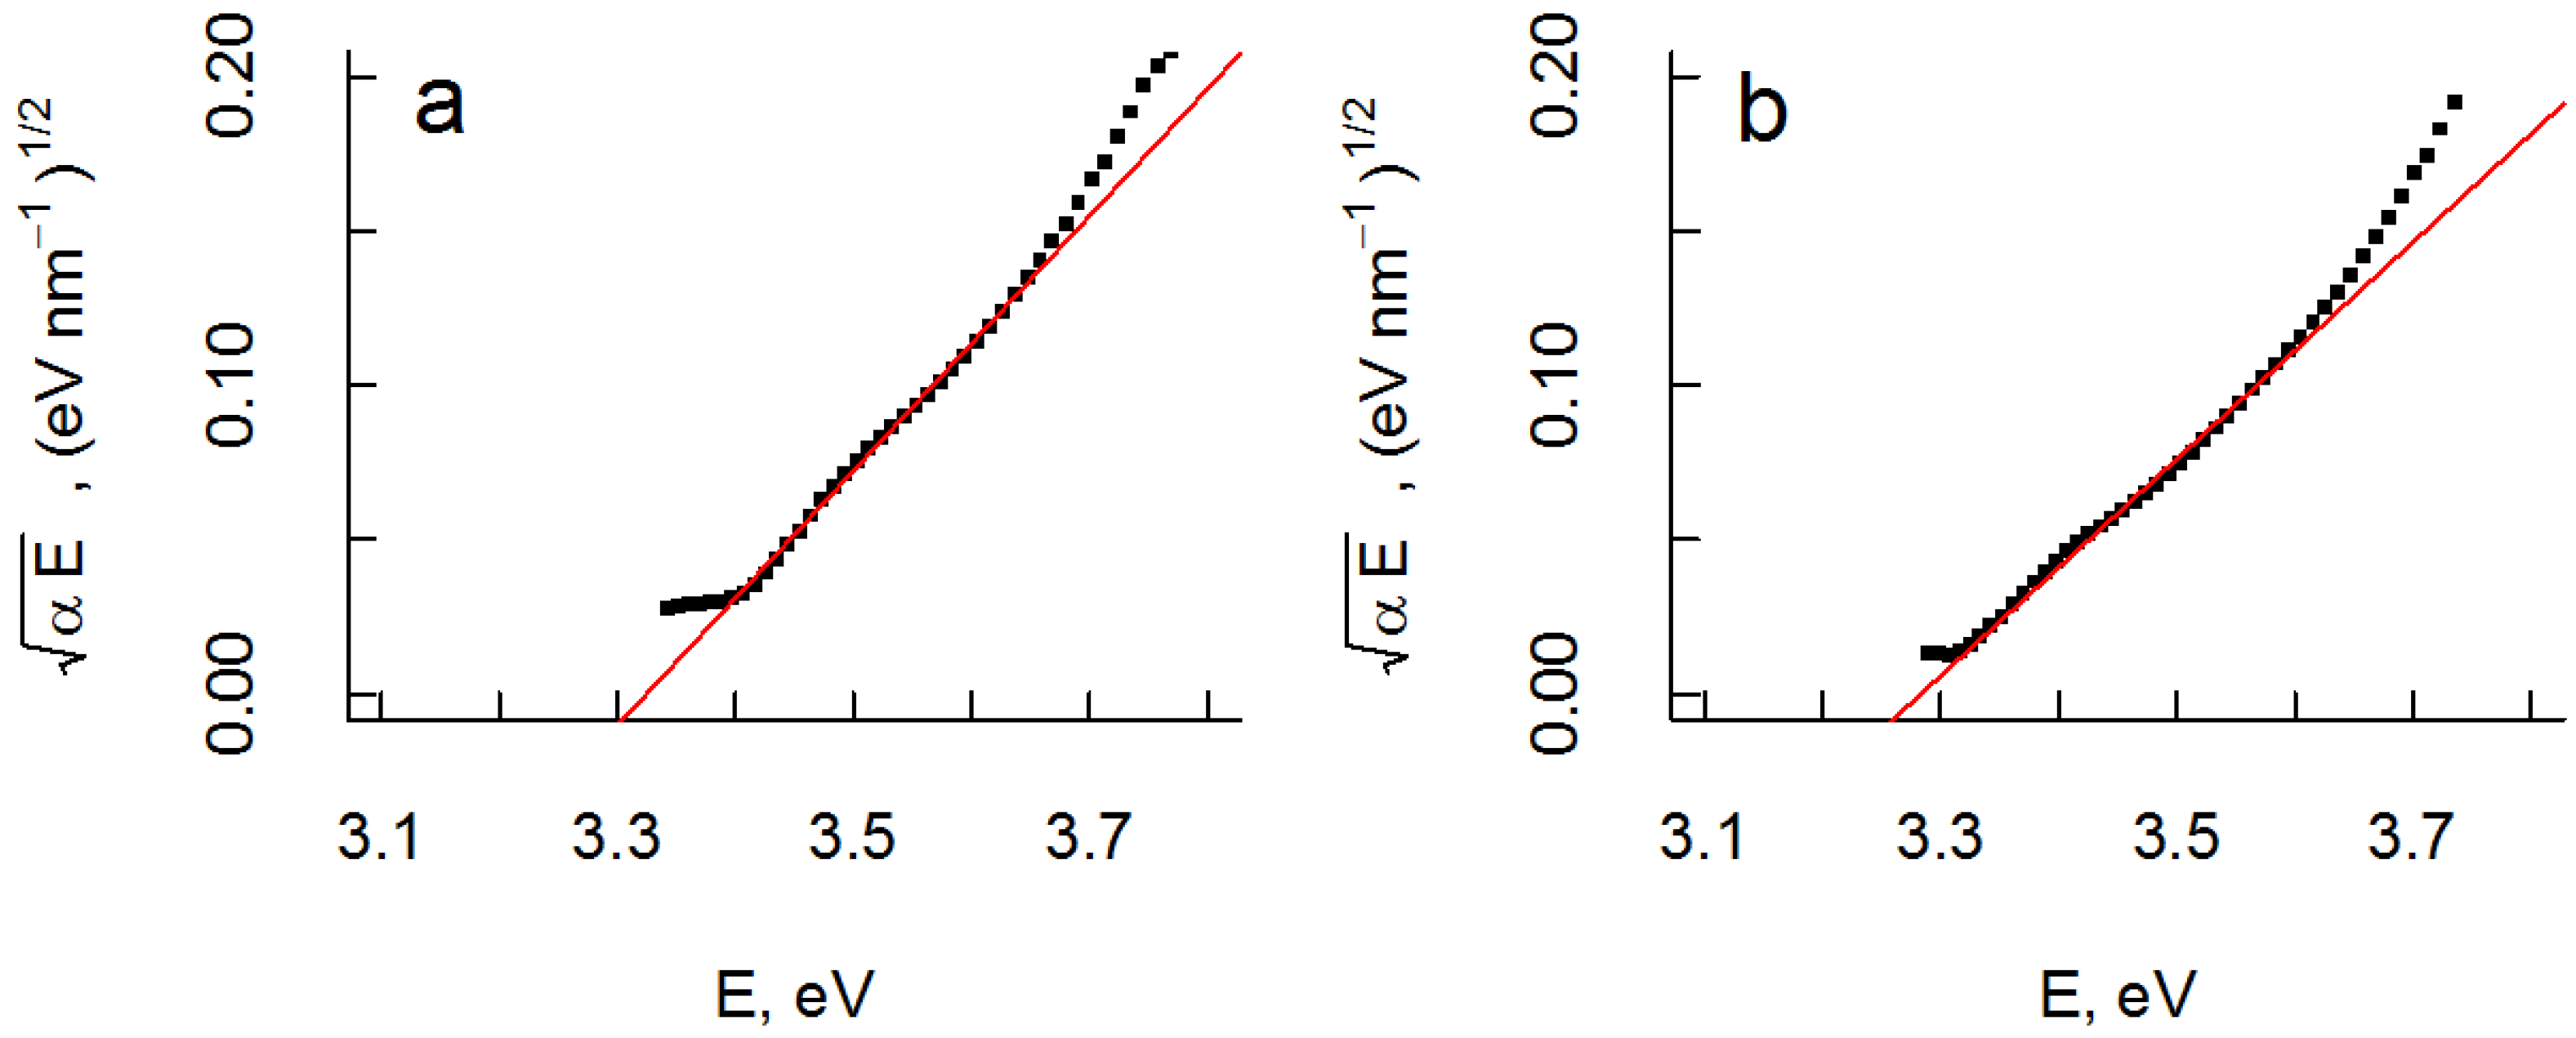
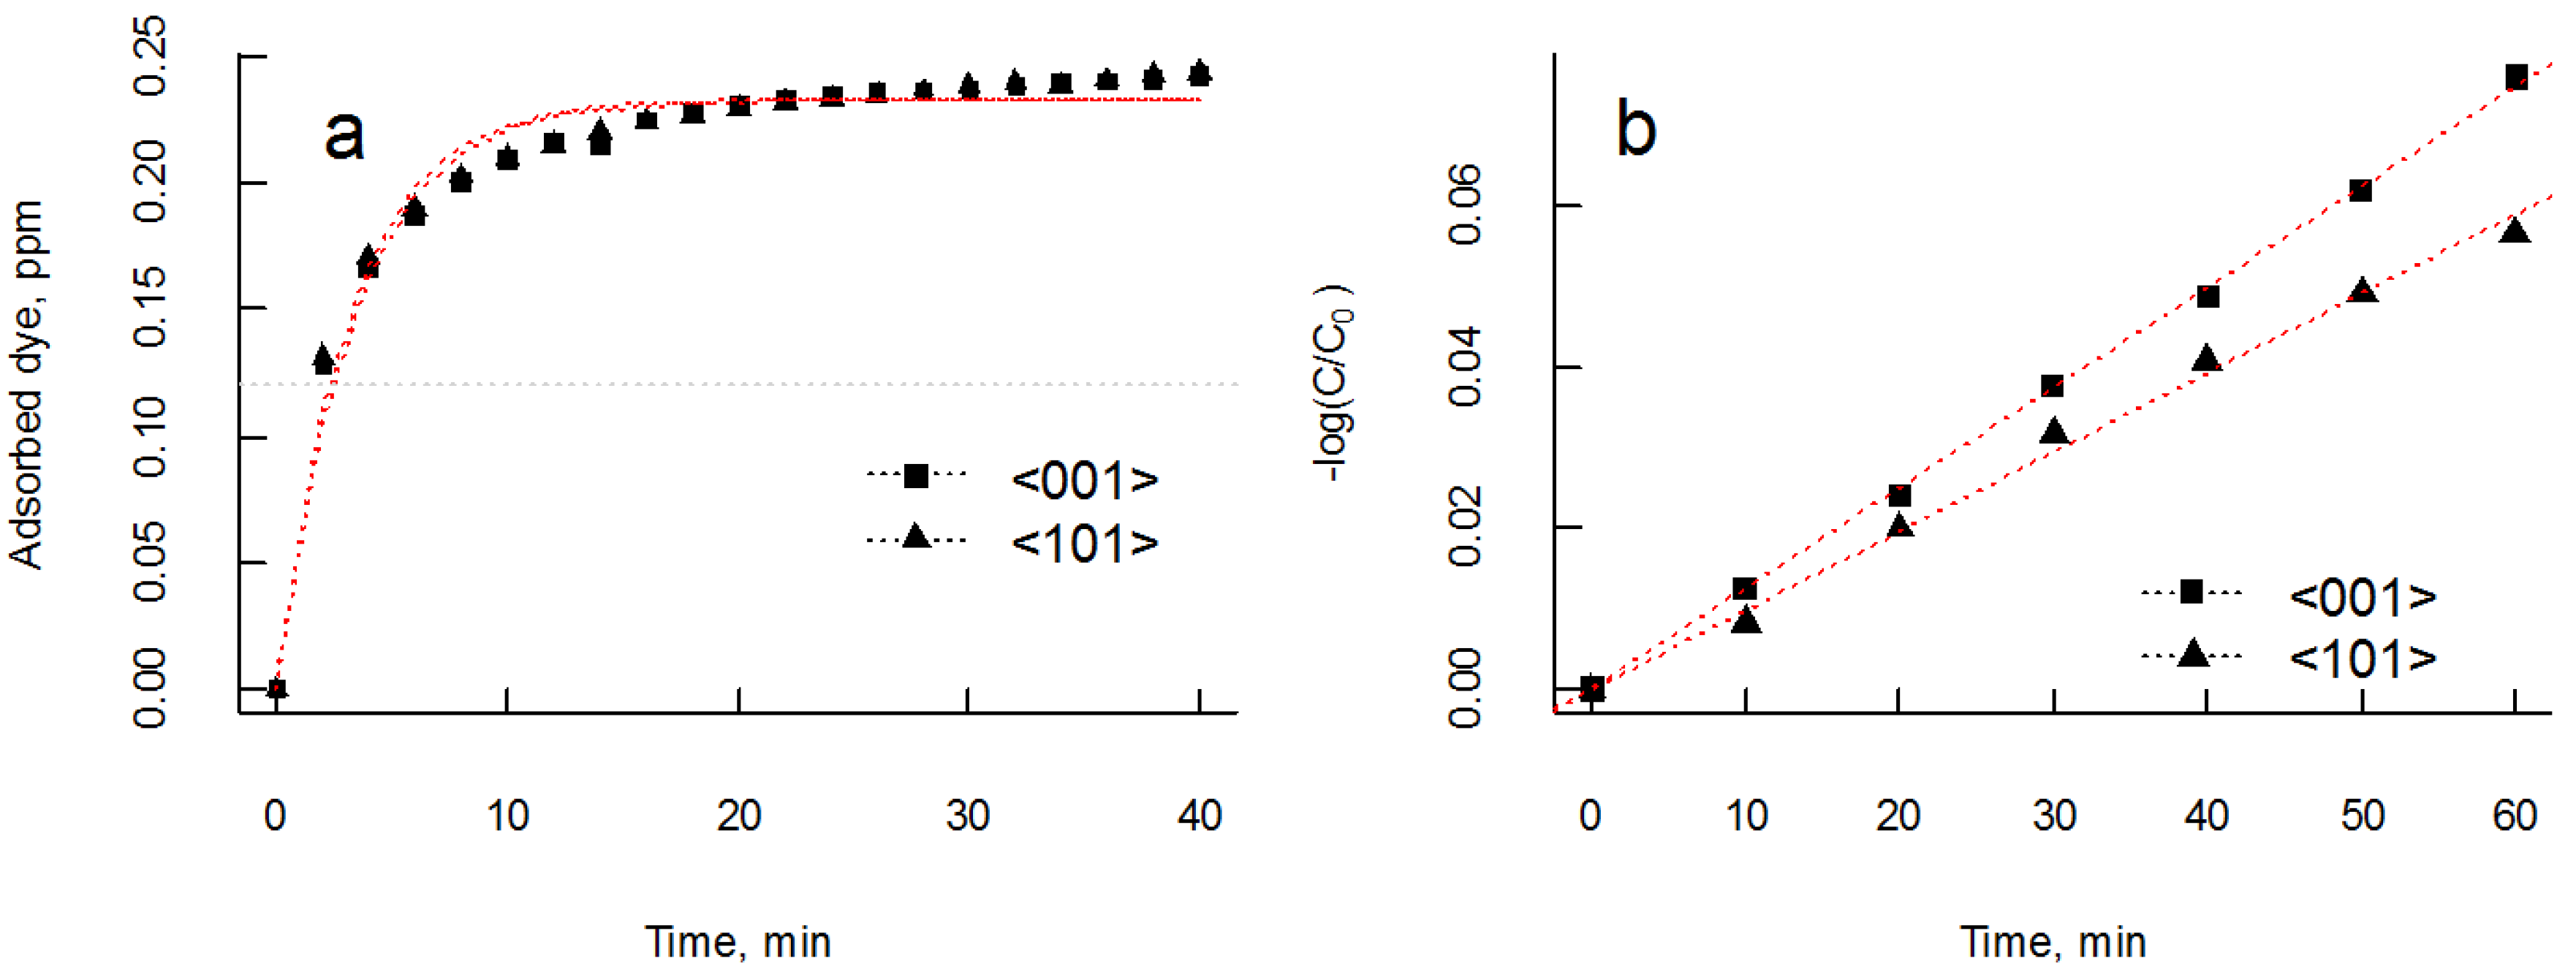
3.3. Photocatalytic Properties


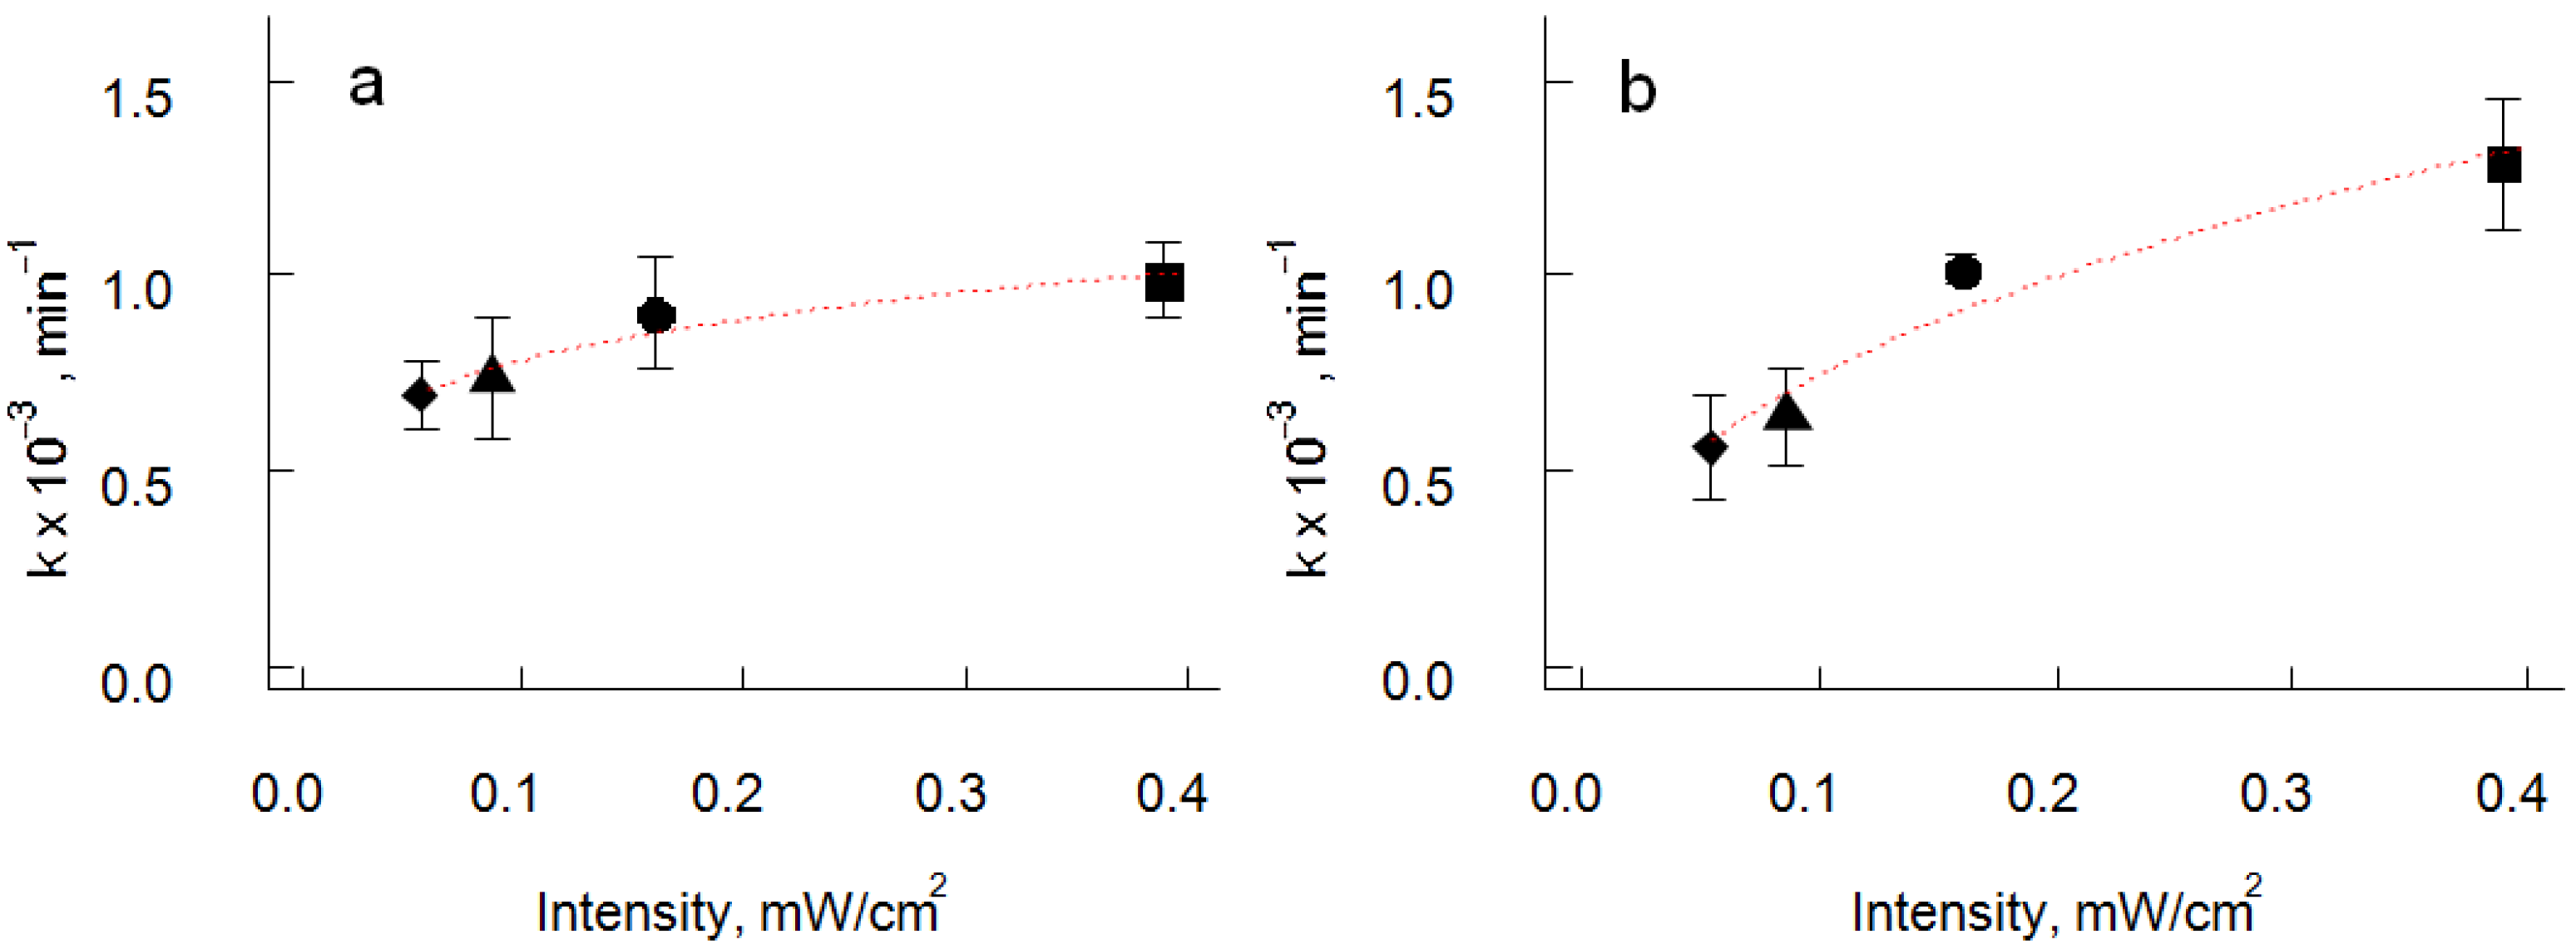
| Samples | Orientation | ||
|---|---|---|---|
| <101> (random) | <001> | ||
| Apparent rate constant, k′<hkl> (×10−3 min−1) | 0.986 ± 0.09 | 1.286 ± 0.17 | |
| Intensity independent rate constant, k″<hkl> (×10−3 min−1) | 1.19 | 1.95 | |
| UV intensity reaction order, a | 0.18 | 0.42 | |
4. Conclusions
Acknowledgements
Author Contributions
Conflicts of Interest
References
- Paz, Y.; Luo, Z.; Rabenberg, L.; Heller, A.J. Photooxidative self-cleaning transparent titanium-dioxide films on glass. Mater. Research. Soc. 1995, 10, 2842–2848. [Google Scholar] [CrossRef]
- Mellott, N.P.; Durucan, C.; Pantano, C.G.; Guglielmi, M. Commercial and laboratory prepared titanium dioxide thin films for self-cleaning glasses: Photocatalytic performance and chemical durability. Thin Solid Films 2006, 502, 112–120. [Google Scholar] [CrossRef]
- Ganesh, V.A.; Raut, H.K.; Nair, A.S.; Ramakrishna, S. A review on self-cleaning coatings. J. Mater. Chem. 2011, 21, 16304–16322. [Google Scholar]
- Evans, P.; Sheel, D.W. Photoactive and antibacterial TiO2 thin films on stainless steel. Surf. Coat. Technol. 2007, 201, 9319–9324. [Google Scholar] [CrossRef]
- Fu, G.; Vary, P.S.; Lin, C.-T. Anatase TiO2 nanocomposites for antimicrobial coatings. J. Phys. Chem. B. 2005, 109, 8889–8898. [Google Scholar]
- Parkin, I.P.; Palgrave, R.G. Self-cleaning coatings. J. Mater. Chem. 2005, 15, 1689–1695. [Google Scholar]
- Mills, A.; Lepre, A.; Elliott, N.; Bhopal, S.; Parkin, I.P.; O’Neill, S.A. Characterisation of the photocatalyst Pilkington Activ (TM): A reference film photocatalyst? J. Photochem. Photobiol. A. 2003, 160, 213–224. [Google Scholar] [CrossRef]
- Guo, S.; Wu, Z.-B.; Zhao, W.-R. TiO2-based building materials: Above and beyond traditional applications. Chin. Sci. Bull. 2009, 54, 1137–1142. [Google Scholar] [CrossRef]
- Matsuda, A.; Kotani, Y.; Kogure, T.; Tatsumisago, M.; Minami, T. Transparent anatase nanocomposite films by the sol-gel process at low temperatures. J. Am. Ceram. Soc. 2000, 83, 229–239. [Google Scholar]
- Abou-Helal, M.O.; Seeber, W.T. Preparation of TiO2 thin films by spray pyrolysis to be used as a photocatalyst. App. Surf. Sci. 2002, 195, 53–62. [Google Scholar]
- Liu, G.X.; Shan, F.K.; Lee, W.J.; Lee, G.H.; Kim, I.S.; Shin, B.C.; Yoon, S.G.; Cho, C.R. Transparent titanium dioxide thin film deposited by plasma-enhanced atomic layer deposition. Integrat. Ferroelectr. 2006, 81, 239–248. [Google Scholar] [CrossRef]
- Haseeb, A.S.M.A.; Hasan, M.M.; Masjuki, H.H. Structural and mechanical properties of nanostructured TiO2 thin films deposited by RF sputtering. Surf. Coat. Technol. 2010, 205, 338–344. [Google Scholar] [CrossRef]
- Howitt, D.G.; Harker, A.B. The oriented growth of anatase in thin films of amorphous titania. J. Mater. Res. 1987, 2, 201–210. [Google Scholar] [CrossRef]
- Diebold, U.; Ruzycki, N.; Herman, G.; Selloni, A. One step towards bridging the materials gap: Surface studies of TiO2 anatase. Catal. Today 2003, 85, 93–100. [Google Scholar] [CrossRef]
- Lazzeri, M.; Vittadini, A.; Selloni, A. Structure and energetics of stoichiometric TiO2 anatase surfaces. Phys. Rev. B. 2001, 63. [Google Scholar] [CrossRef]
- Gong, X.; Selloni, A. Reactivity of anatase TiO2 nanoparticles: The role of the minority (001) surface. J. Phys. Chem. B 2005, 109, 19560–19562. [Google Scholar]
- Vittadini, A.; Selloni, A.; Rotzinger, F.P.; Grätzel, M. Structure and energetics of water adsorbed at TiO2 anatase (101) and (001) surfaces. Phys. Rev. Lett. 1998, 81, 2954–2957. [Google Scholar] [CrossRef]
- Nguyen, C.K.; Cha, H.G.; Kang, Y.S. Axis-Oriented, Anatase TiO2 Single Crystals with Dominant {001} and {100} Facets. Cryst. Growth Des. 2011, 11, 3947–3953. [Google Scholar] [CrossRef]
- Liu, B.; Aydil, E.S. Anatase TiO2 films with reactive {001} facets on transparent conductive substrate. Chem. Commun. 2011, 47, 9507–9509. [Google Scholar] [CrossRef]
- Wang, L.; Zang, L.; Zhao, J.; Wang, C. Green synthesis of shape-defined anatase TiO2 nanocrystals wholly exposed with {001} and {100} facets. Chem. Commun. 2012, 48, 11736–11738. [Google Scholar] [CrossRef]
- Zhang, J.; Chen, W.; Xi, J.; Ji, Z. {001} Facets of anatase TiO2 show high photocatalytic selectivity. Mater. Lett. 2012, 79, 259–262. [Google Scholar] [CrossRef]
- Cao, F.-L.; Wang, J.-G.; Lv, F.-J.; Zhang, D.-Q.; Huo, Y.-N.; Li, G.-S.; Li, H.-X.; Zhu, J. Photocatalytic oxidation of toluene to benzaldehyde over anatase TiO2 hollow spheres with exposed {001} facets. Catal. Commun. 2011, 12, 946–950. [Google Scholar] [CrossRef]
- Li, B.; Zhao, Z.; Gao, F.; Wang, X.; Qiu, J. Mesoporous microspheres composed of carbon-coated TiO2 nanocrystals with exposed {001} facets for improved visible light photocatalytic activity. App. Catal. B. 2014, 147, 958–964. [Google Scholar] [CrossRef]
- Lyandres, O.; Finkelstein-Shapiro, D.; Chakthranont, P.M.; Graham, K.; Gray, A. Preferred Orientation in Sputtered TiO2 Thin Films and Its Effect on the Photo-Oxidation of Acetaldehyde. Chem. Mater. 2012, 24, 3355–3362. [Google Scholar] [CrossRef]
- Meng, L.-J.; dos Santos, M.P. The influence of oxygen partial-pressure on the properties of dc reactive magnetron-sputtered titanium-oxide films. Thin Solid Films 1993, 226, 22–29. [Google Scholar] [CrossRef]
- Sério, S.; Melo Jorge, M.E.; Maneira, M.J.P.; Nunes, Y. Influence of O2 partial pressure on the growth of nanostructured anatase phase TiO2 thin films prepared by DC reactive magnetron sputtering. Mat. Chem. Phys. 2011, 126, 73–81. [Google Scholar]
- Le Bellac, D.; Niklasson, G.A.; Granqvist, C.G. Angular-selective optical transmittance of anisotropic inhomogeneous Cr-based films made by sputtering. J. Appl. Phys. 1995, 77, 6145–6151. [Google Scholar] [CrossRef]
- Kharrazi, M.; Azens, A.; Kullman, L.; Granqvist, C.G. High-rate dual-target dc magnetron sputter deposition of electrochromic MoO3 films. Thin Solid Films 1997, 295, 117–121. [Google Scholar] [CrossRef]
- Stefanov, B.I.; Kaneva, N.V.; Puma, G.L.; Dushkin, C.D. Novel integrated reactor for evaluation of activity of supported photocatalytic thin films: Case of methylene blue degradation on TiO2 and nickel modified TiO2 under UV and visible light. Colloids Surf. A 2011, 382, 219–225. [Google Scholar] [CrossRef]
- Rietveld, H.M. A profile refinement method for nuclear and magnetic structures. J. Appl. Crystallogr. 1969, 2, 65–71. [Google Scholar] [CrossRef]
- Kraus, W.; Nolze, G. POWDER CELL—A program for the representation and manipulation of crystal structures and calculation of the resulting X-ray powder patterns. J. Appl. Crystallogr. 1996, 29, 301–303. [Google Scholar] [CrossRef]
- Horn, M.; Schwerdtfeger, C.F.; Meagher, E.P. Refinement of structure of anatase at several temperatures. Z. Krist. 1972, 136, 273–281. [Google Scholar]
- Dollase, W.A. Correction of intensities for preferred orientation in powder diffractometry—Application of the march model. J. Appl. Crystallogr. 1986, 19, 267–272. [Google Scholar] [CrossRef]
- Zolotoyabko, E. Determination of the degree of preferred orientation within the March-Dollase approach. J. Appl. Crystallogr. 2009, 42, 513–518. [Google Scholar] [CrossRef]
- R—A language and environment for statistical computing; R Foundation for Statistical Computing: Vienna, Austria. Available online: http://www.R-project.org/ (accessed on 9 July 2014).
- Swanepoel, R. Determination of the thickness and optical-constants of amorphous-silicon. J. Phys. E Sci. Instrum. 1983, 16, 1214–1222. [Google Scholar] [CrossRef]
- Pulker, H.K. Characterization of optical thin-films. Appl. Optic. 1979, 18, 1969–1977. [Google Scholar] [CrossRef]
- Hong, S.; Kim, E.; Kim, D.-W.; Sung, T.-H.; No, K. On measurement of optical band gap of chromium oxide films containing both amorphous and crystalline phases. J. Non-Cryst. Solids 1997, 221, 245–254. [Google Scholar]
- Mills, A.; Wang, J.; Ollis, D.F. Kinetics of liquid phase semiconductor photoassisted reactions: Supporting observations for a pseudo-steady-state model. J. Phys. Chem. B 2006, 110, 14386–14390. [Google Scholar]
- Yang, Y.; Wang, G.; Deng, Q.; Kang, S.; Ng, D.H.L.; Zhao, H. A facile synthesis of single crystal TiO2 nanorods with reactive {100} facets and their enhanced photocatalytic activity. CrystEngComm 2014, 16, 3091–3096. [Google Scholar] [CrossRef]
© 2014 by the authors; licensee MDPI, Basel, Switzerland. This article is an open access article distributed under the terms and conditions of the Creative Commons Attribution license (http://creativecommons.org/licenses/by/3.0/).
Share and Cite
Stefanov, B.; Österlund, L. Tuning the Photocatalytic Activity of Anatase TiO2 Thin Films by Modifying the Preferred <001> Grain Orientation with Reactive DC Magnetron Sputtering. Coatings 2014, 4, 587-601. https://doi.org/10.3390/coatings4030587
Stefanov B, Österlund L. Tuning the Photocatalytic Activity of Anatase TiO2 Thin Films by Modifying the Preferred <001> Grain Orientation with Reactive DC Magnetron Sputtering. Coatings. 2014; 4(3):587-601. https://doi.org/10.3390/coatings4030587
Chicago/Turabian StyleStefanov, B., and L. Österlund. 2014. "Tuning the Photocatalytic Activity of Anatase TiO2 Thin Films by Modifying the Preferred <001> Grain Orientation with Reactive DC Magnetron Sputtering" Coatings 4, no. 3: 587-601. https://doi.org/10.3390/coatings4030587