
Mutual Impact of Four Organic Calcium Salts on the Formation and Properties of Micro-Arc Oxidation Coatings on AZ31B Magnesium Alloys

 , and
, and
Abstract
:1. Introduction
2. Experimental Section
2.1. MAO Preparation
2.2. Characterization of MAO Samples
2.2.1. Surface and Cross-Sectional Analysis
2.2.2. Electrochemical Analysis
3. Results
3.1. Characteristics of MAO Samples
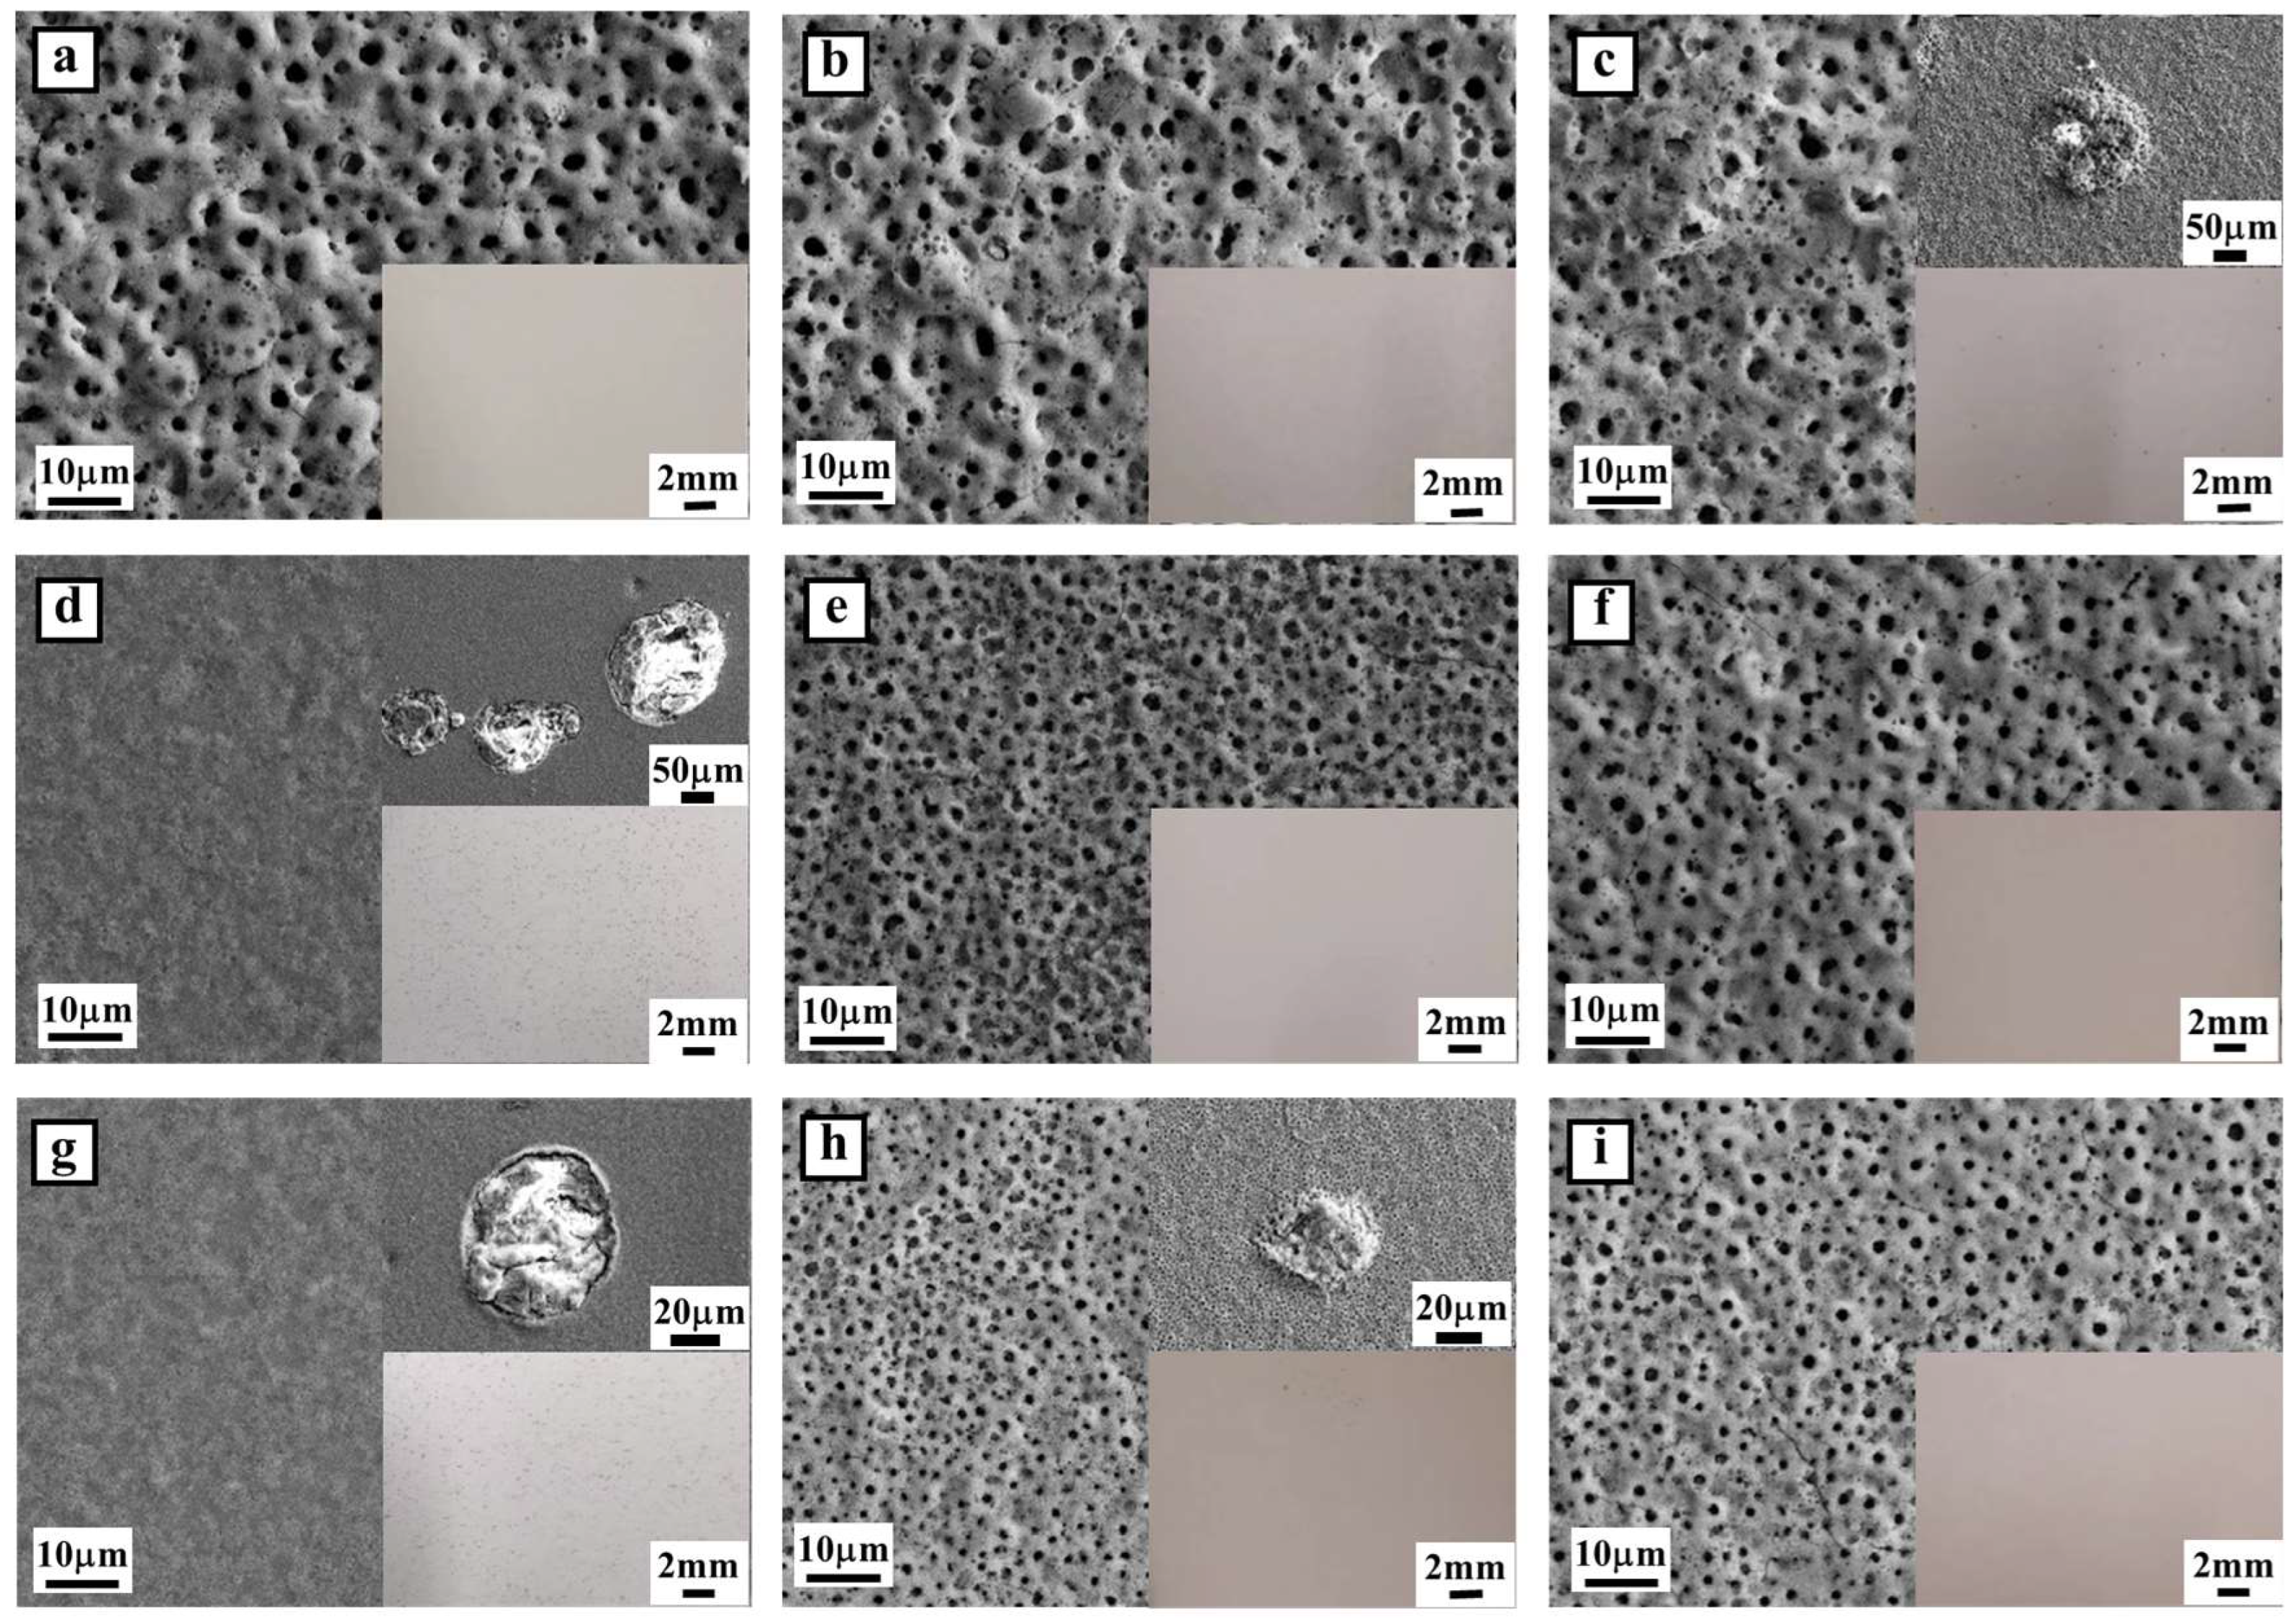
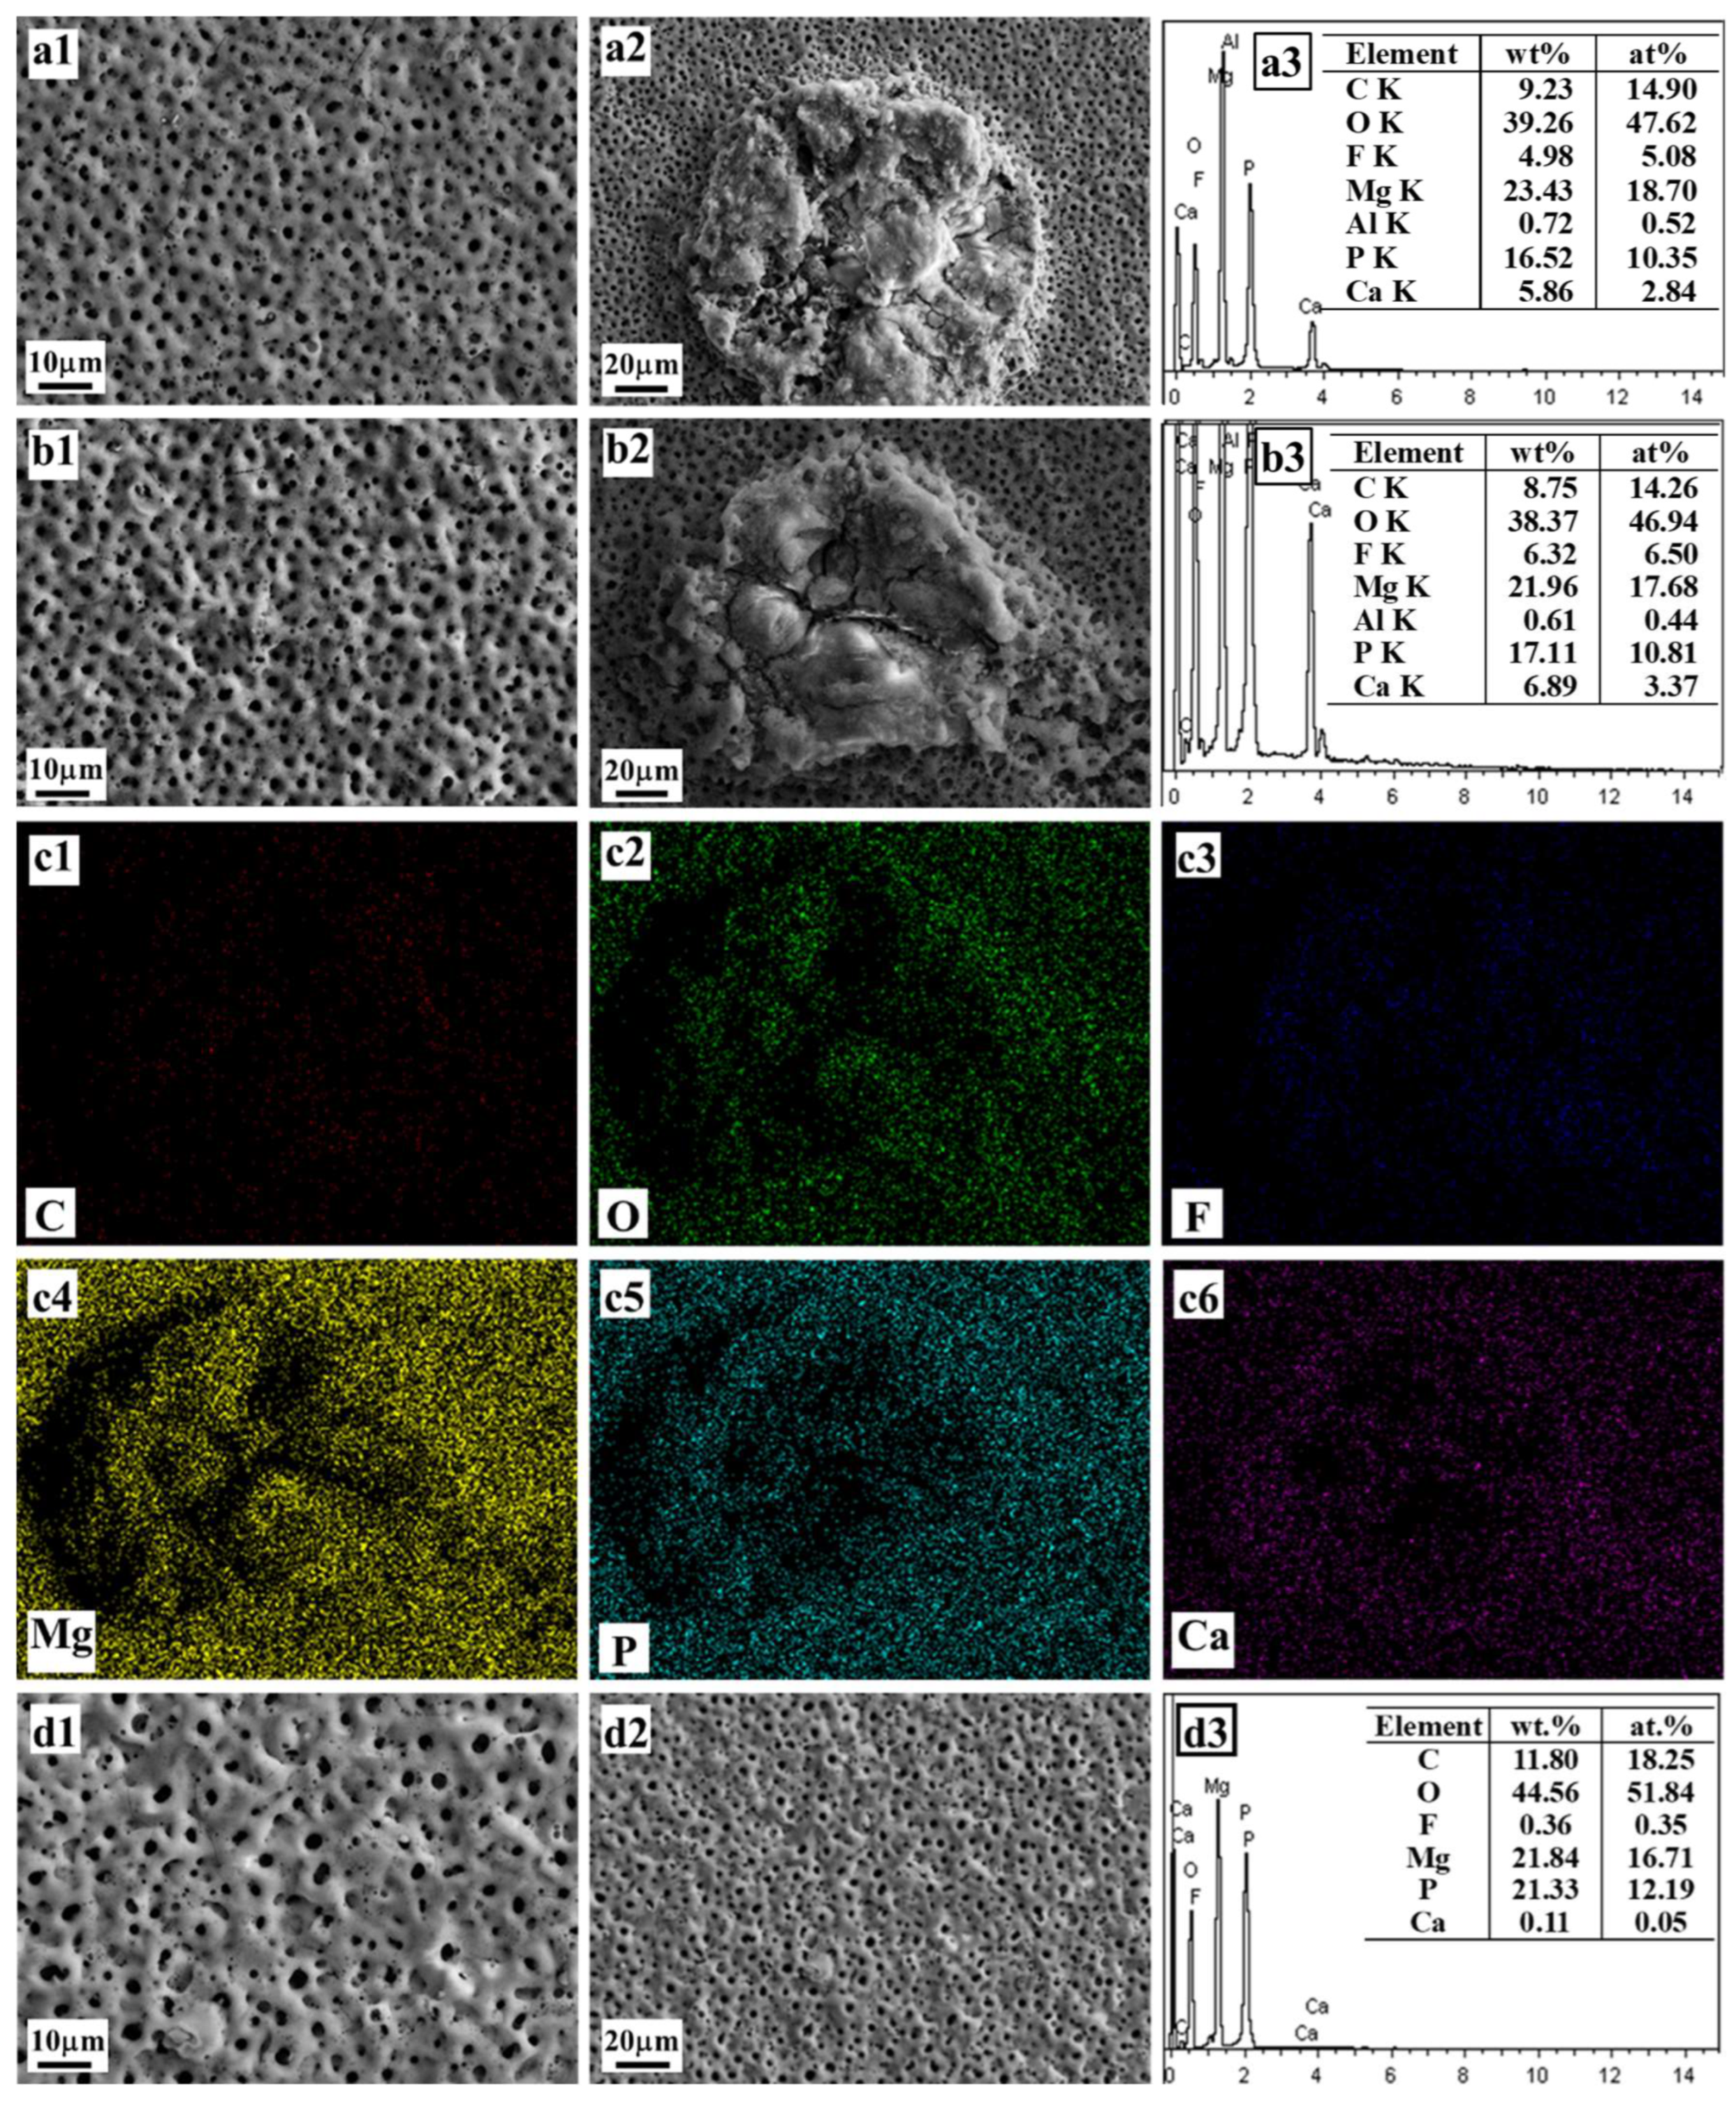
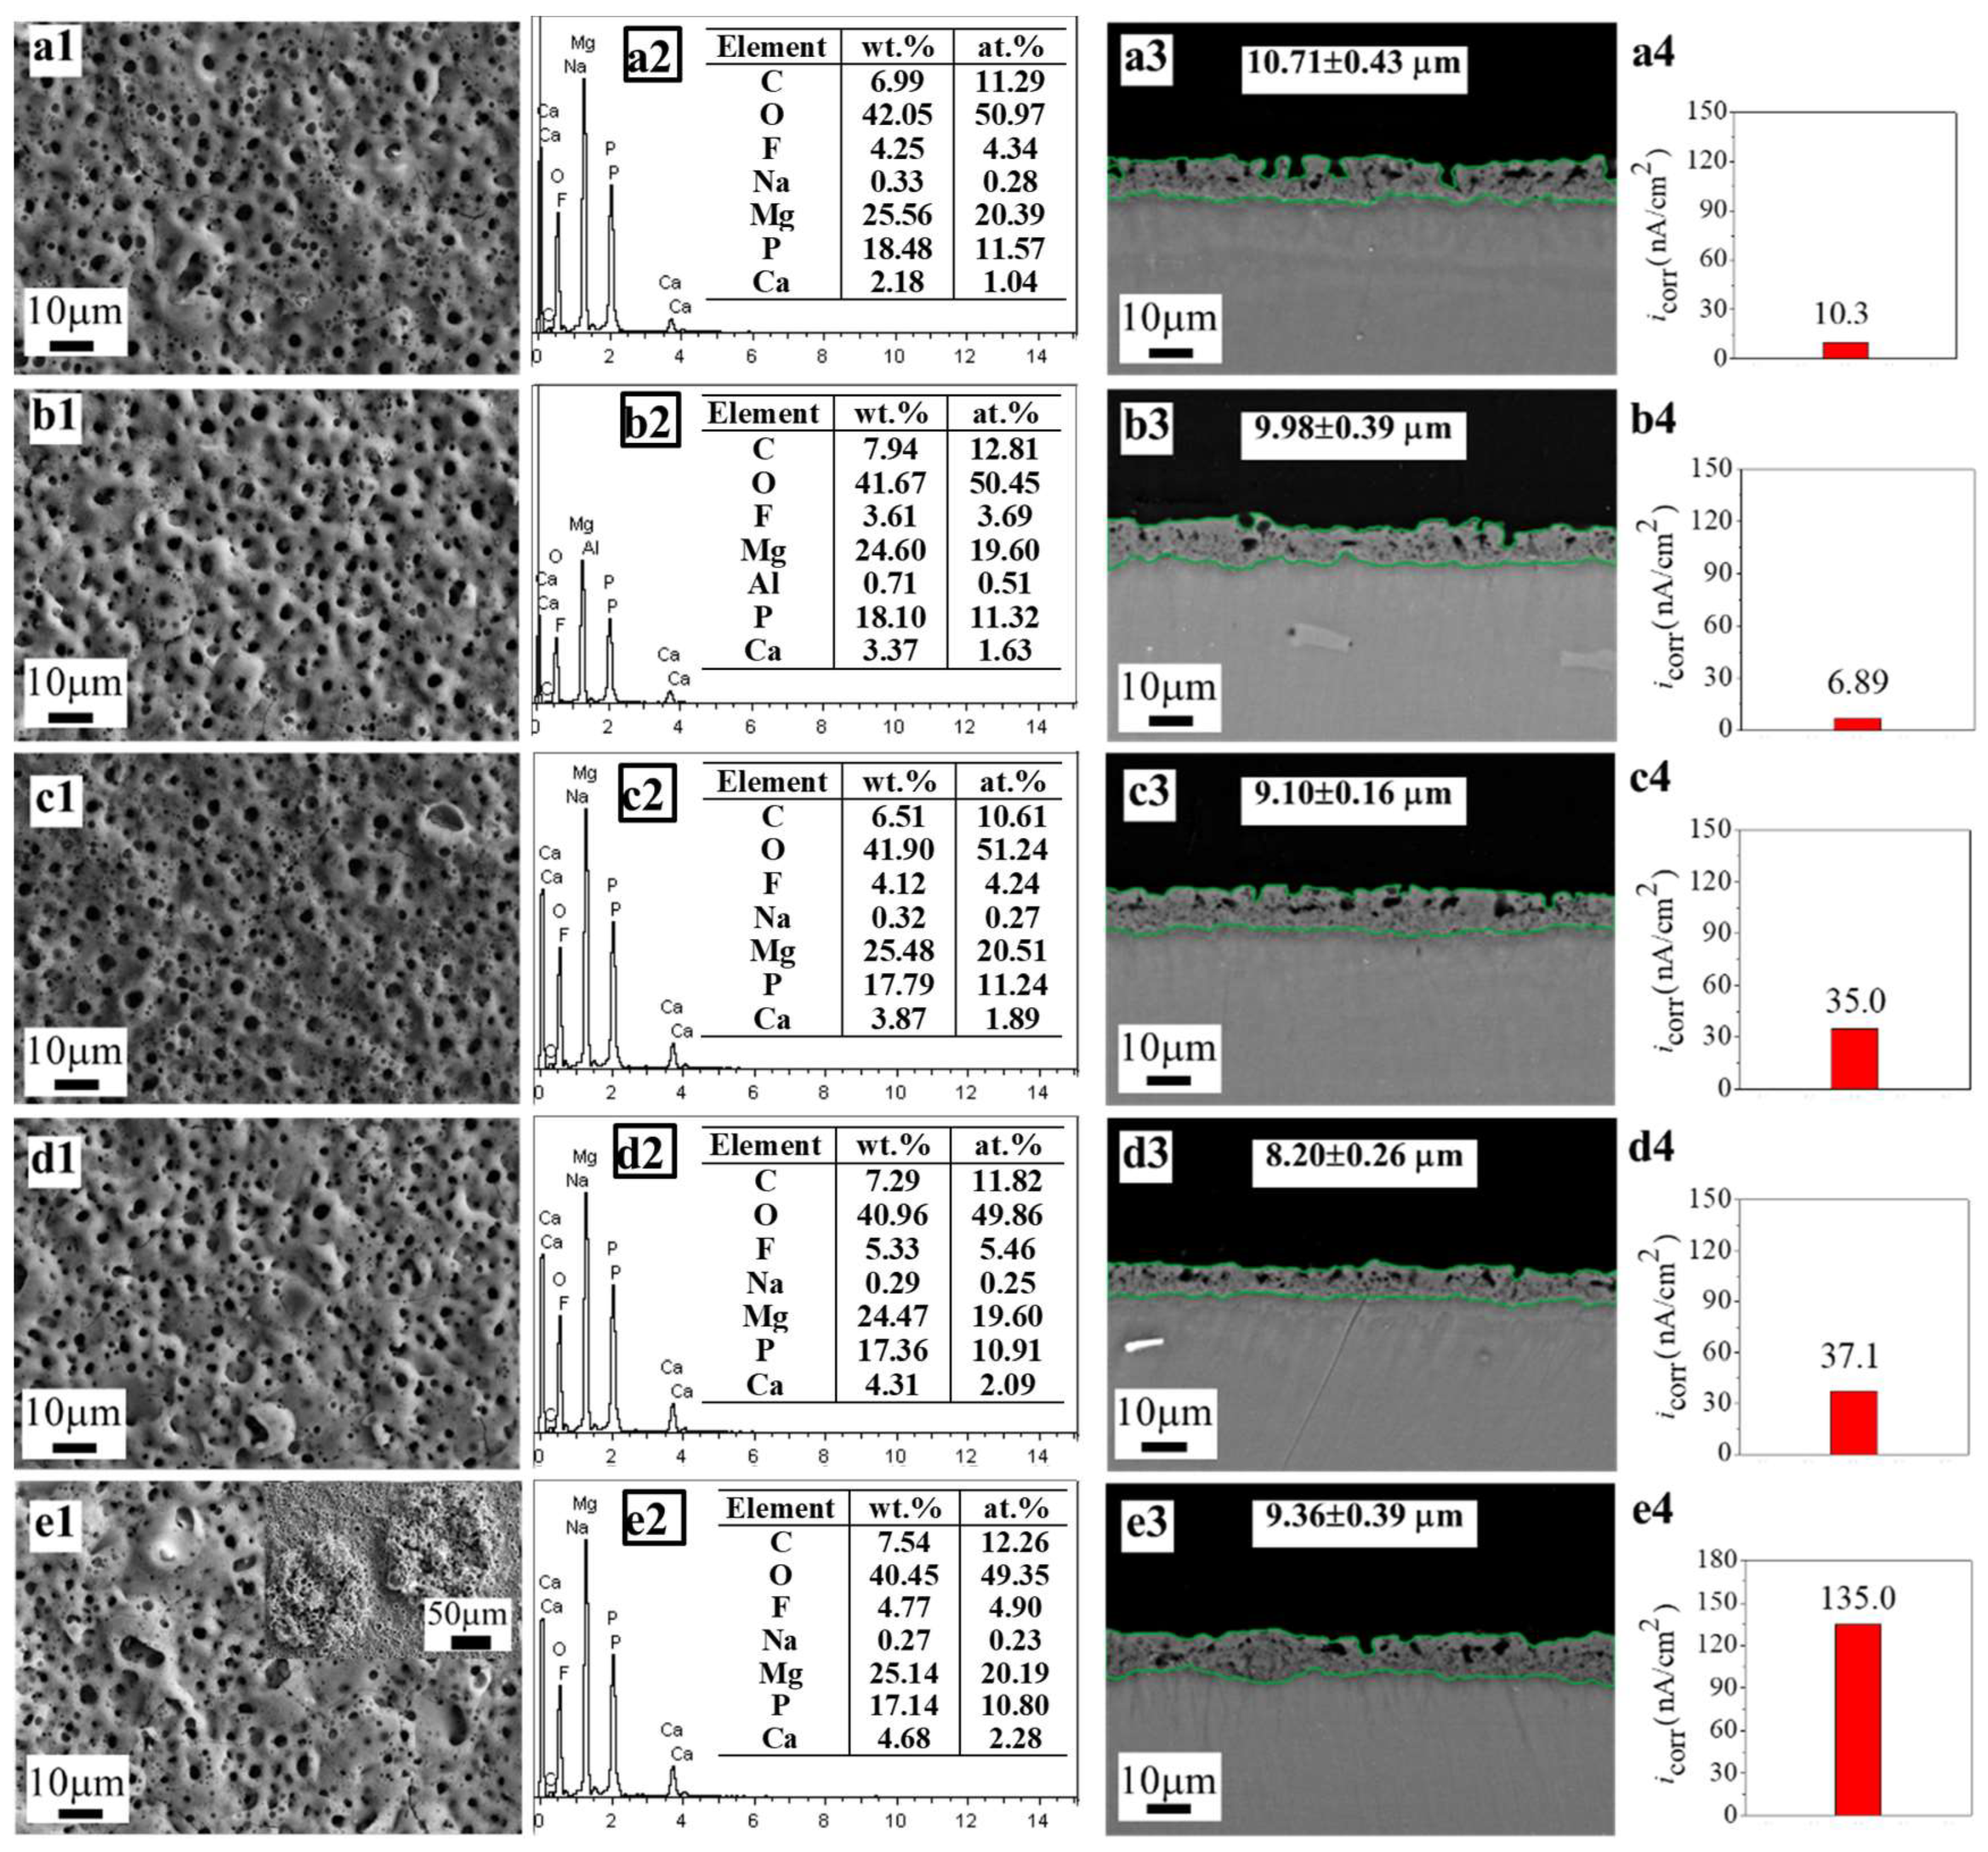
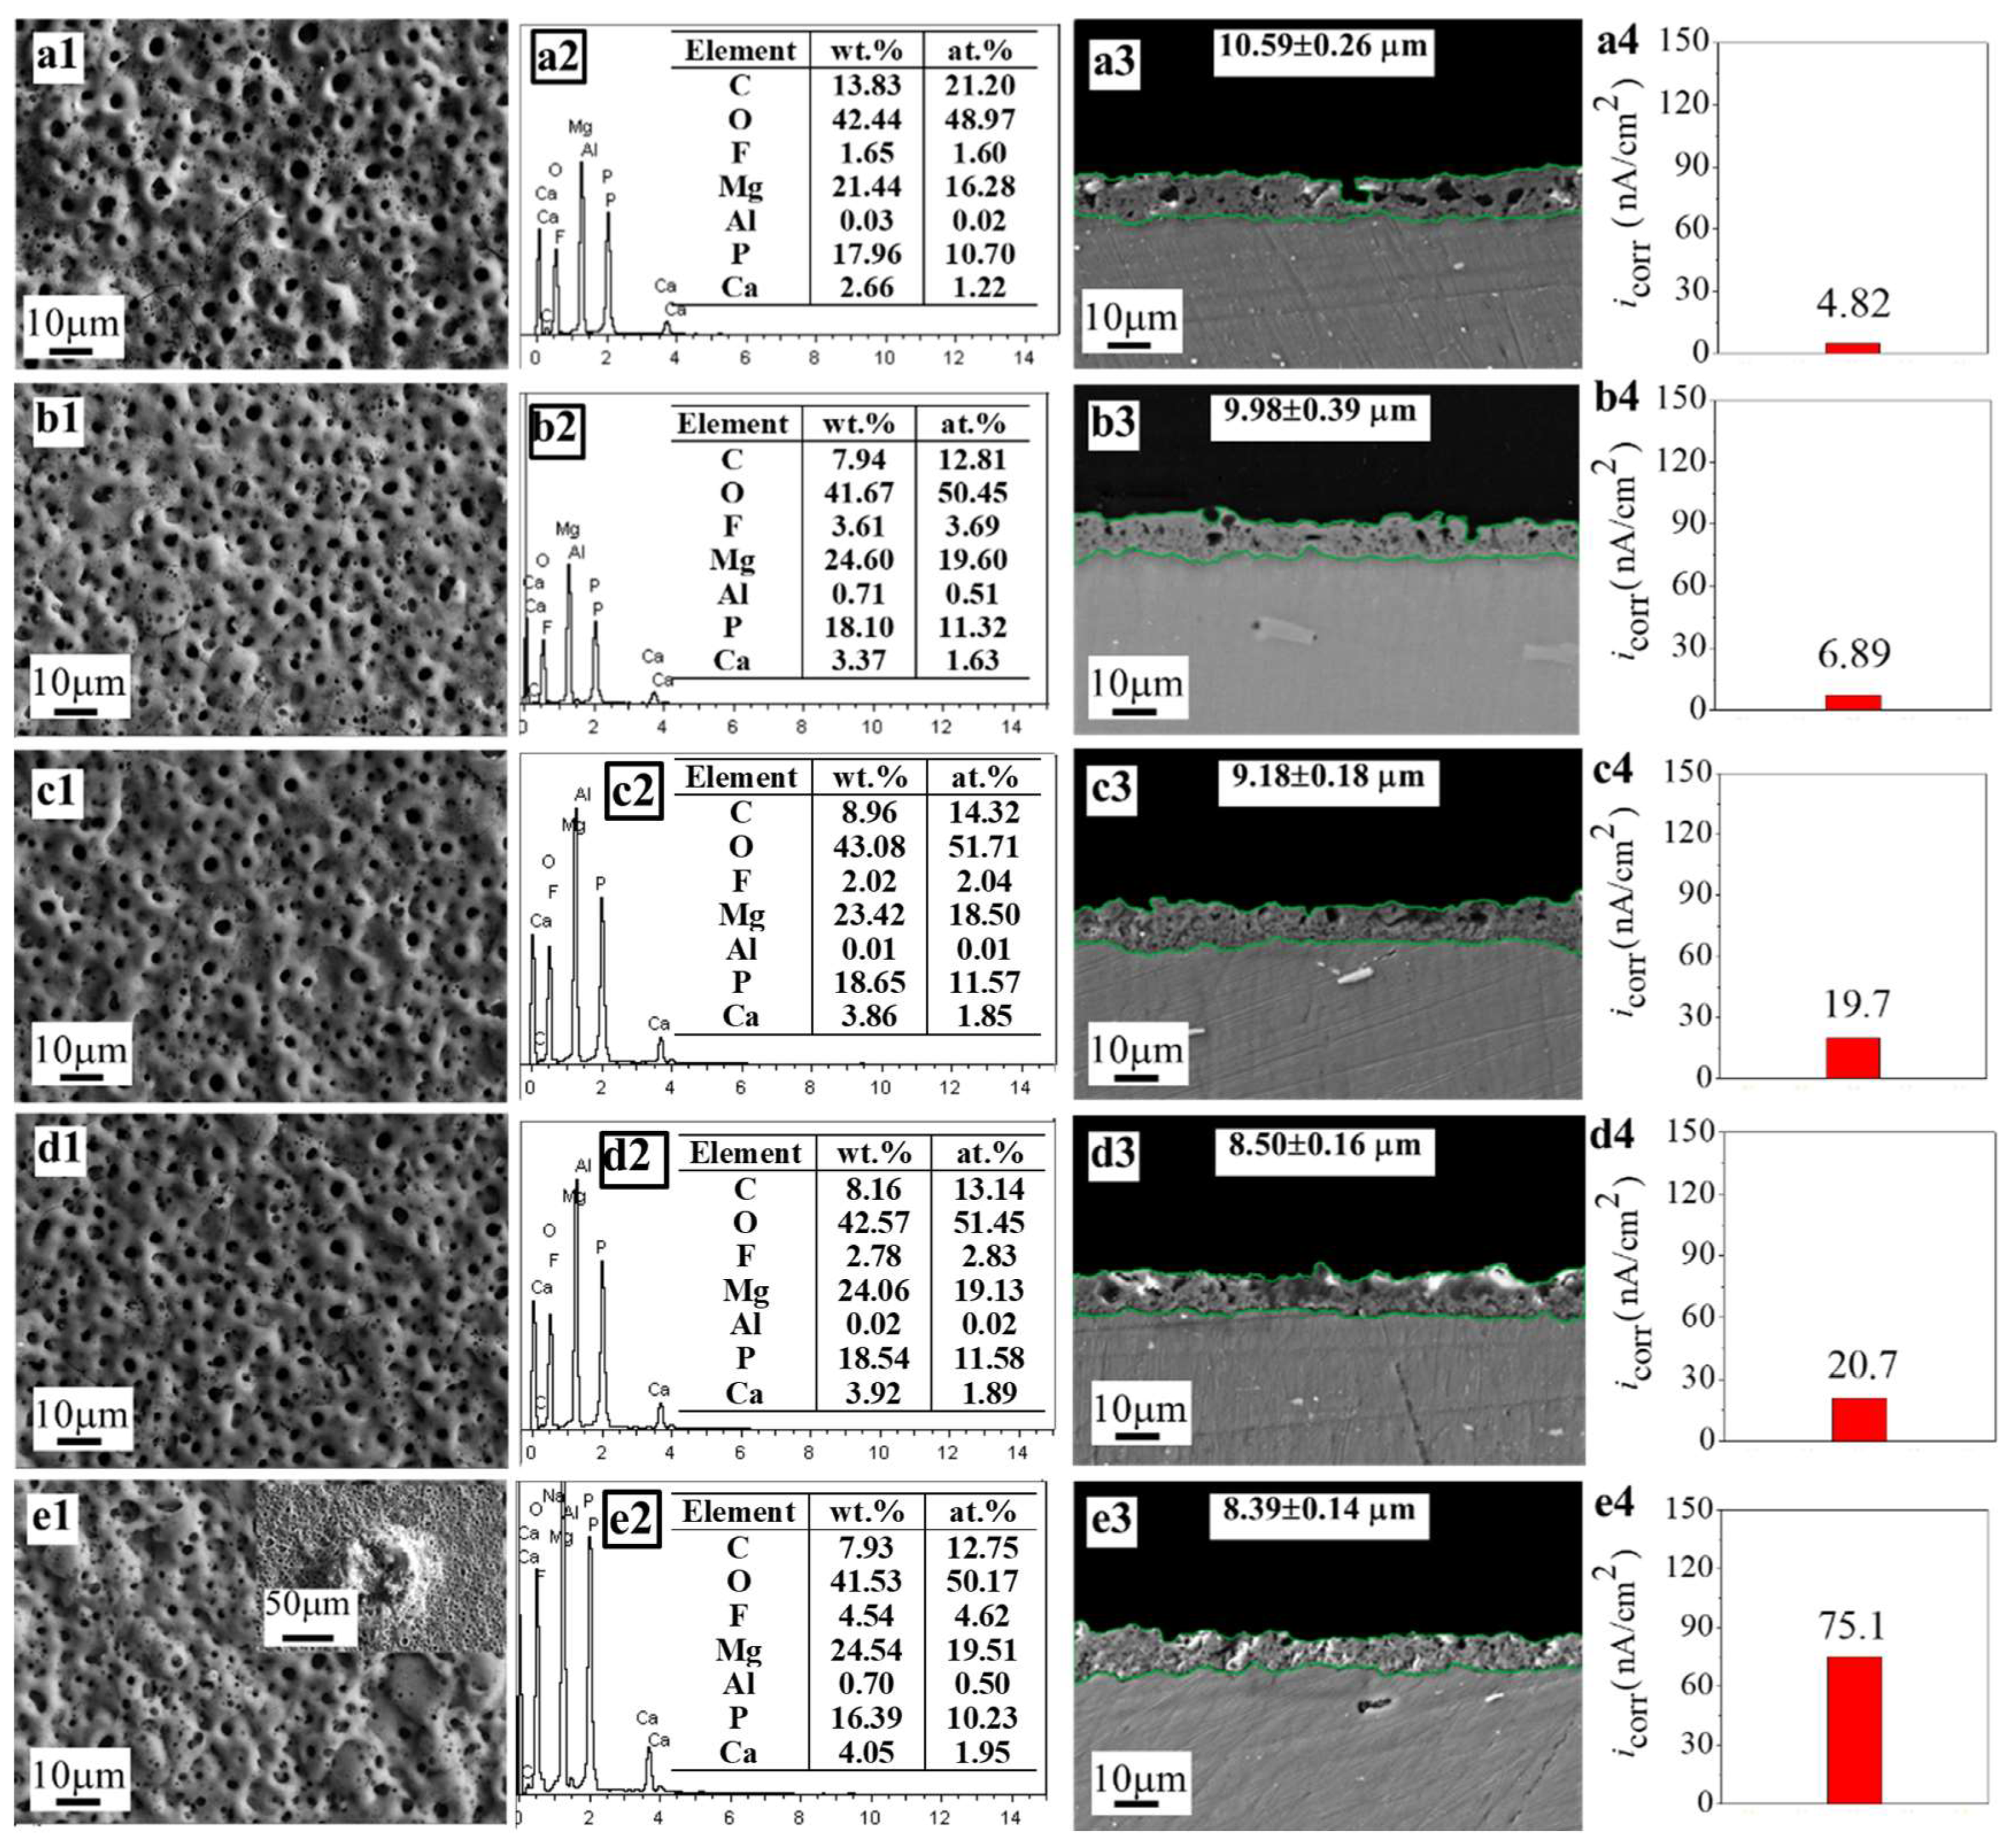
3.1.1. Morphology and Chemical Composition
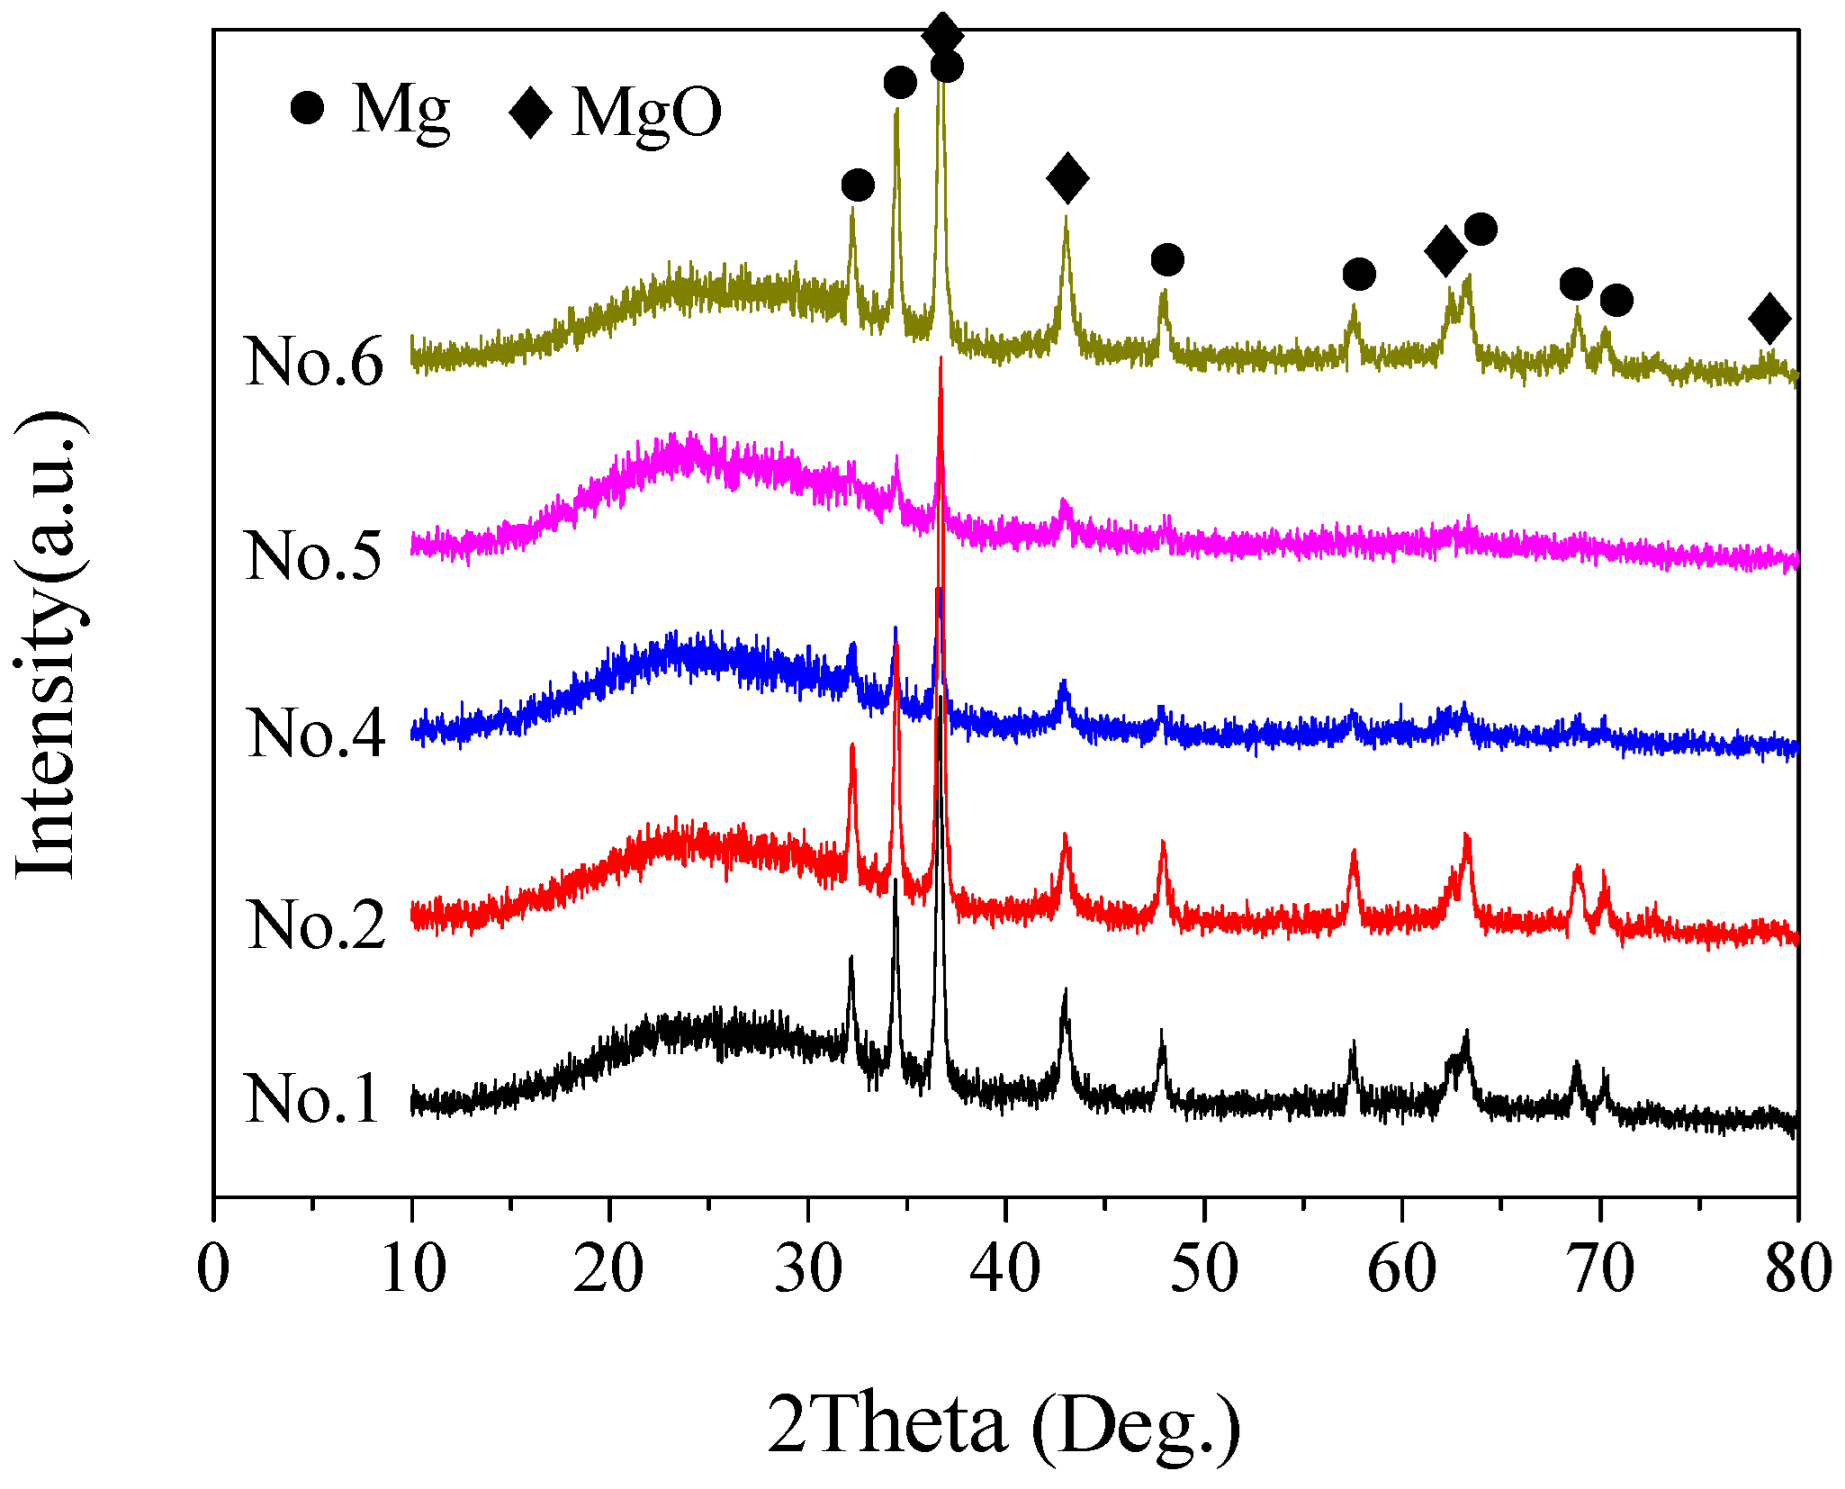
3.1.2. XRD Analysis
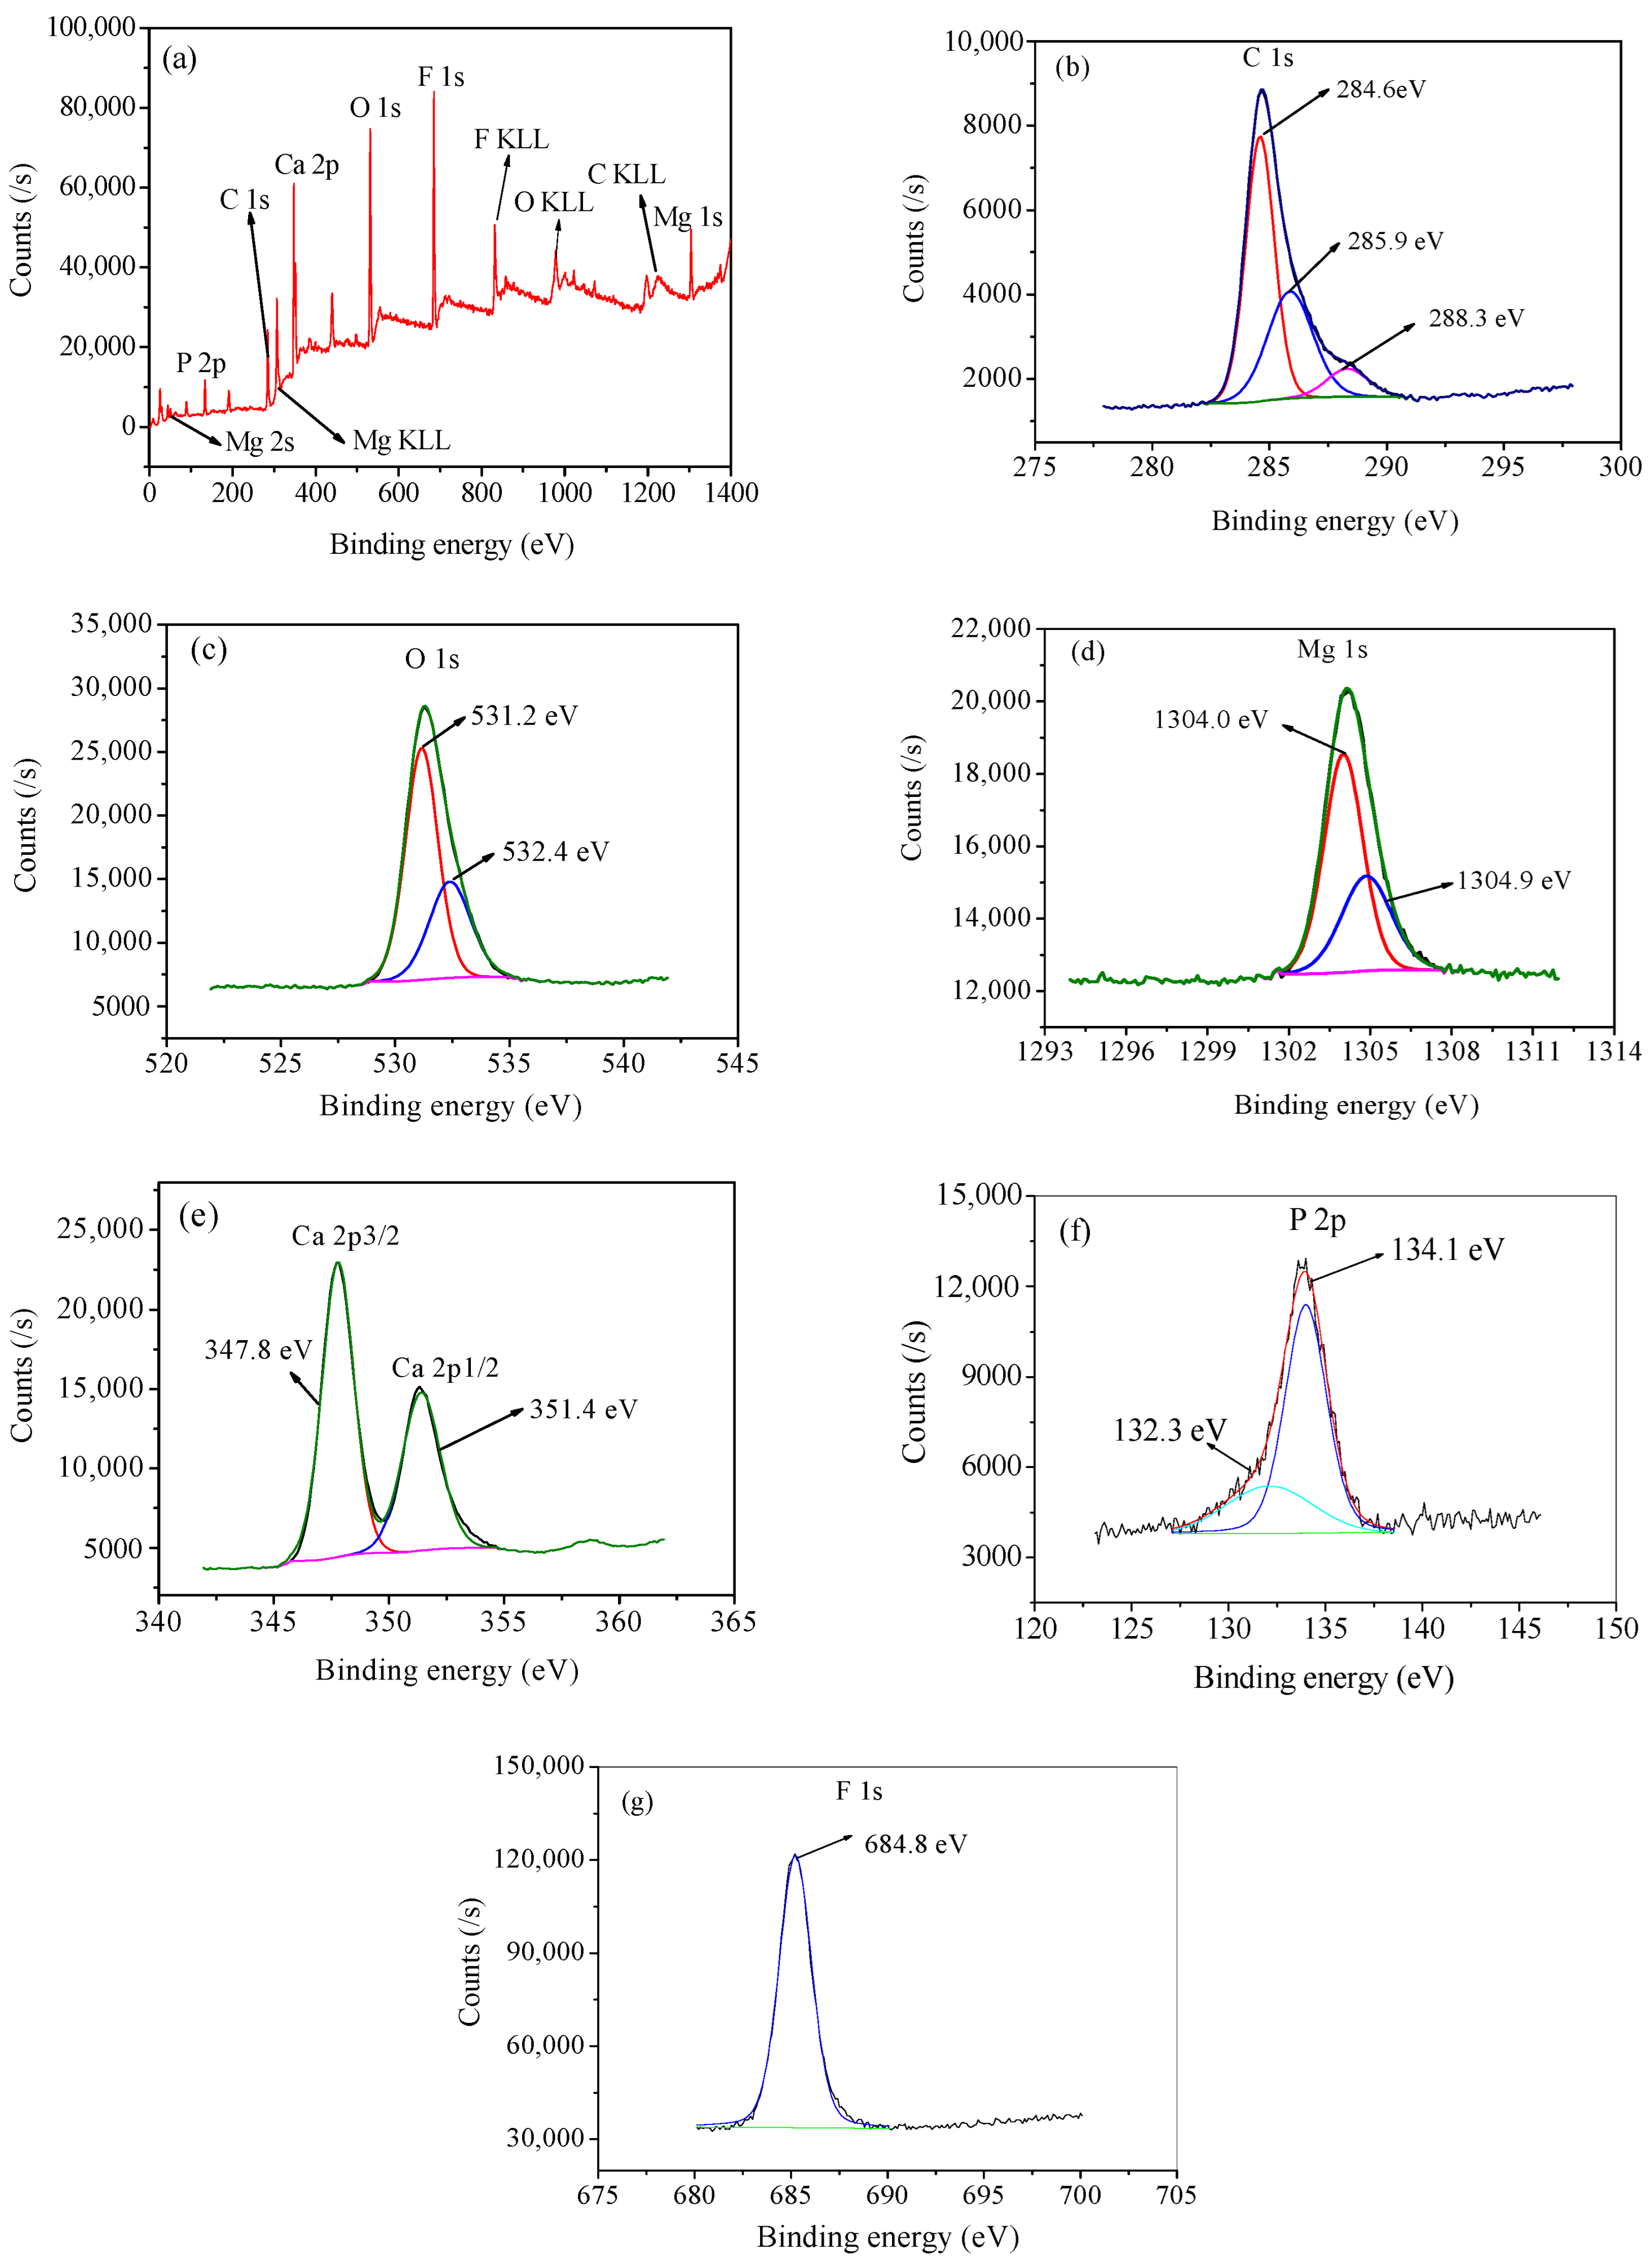
3.1.3. XPS Analysis
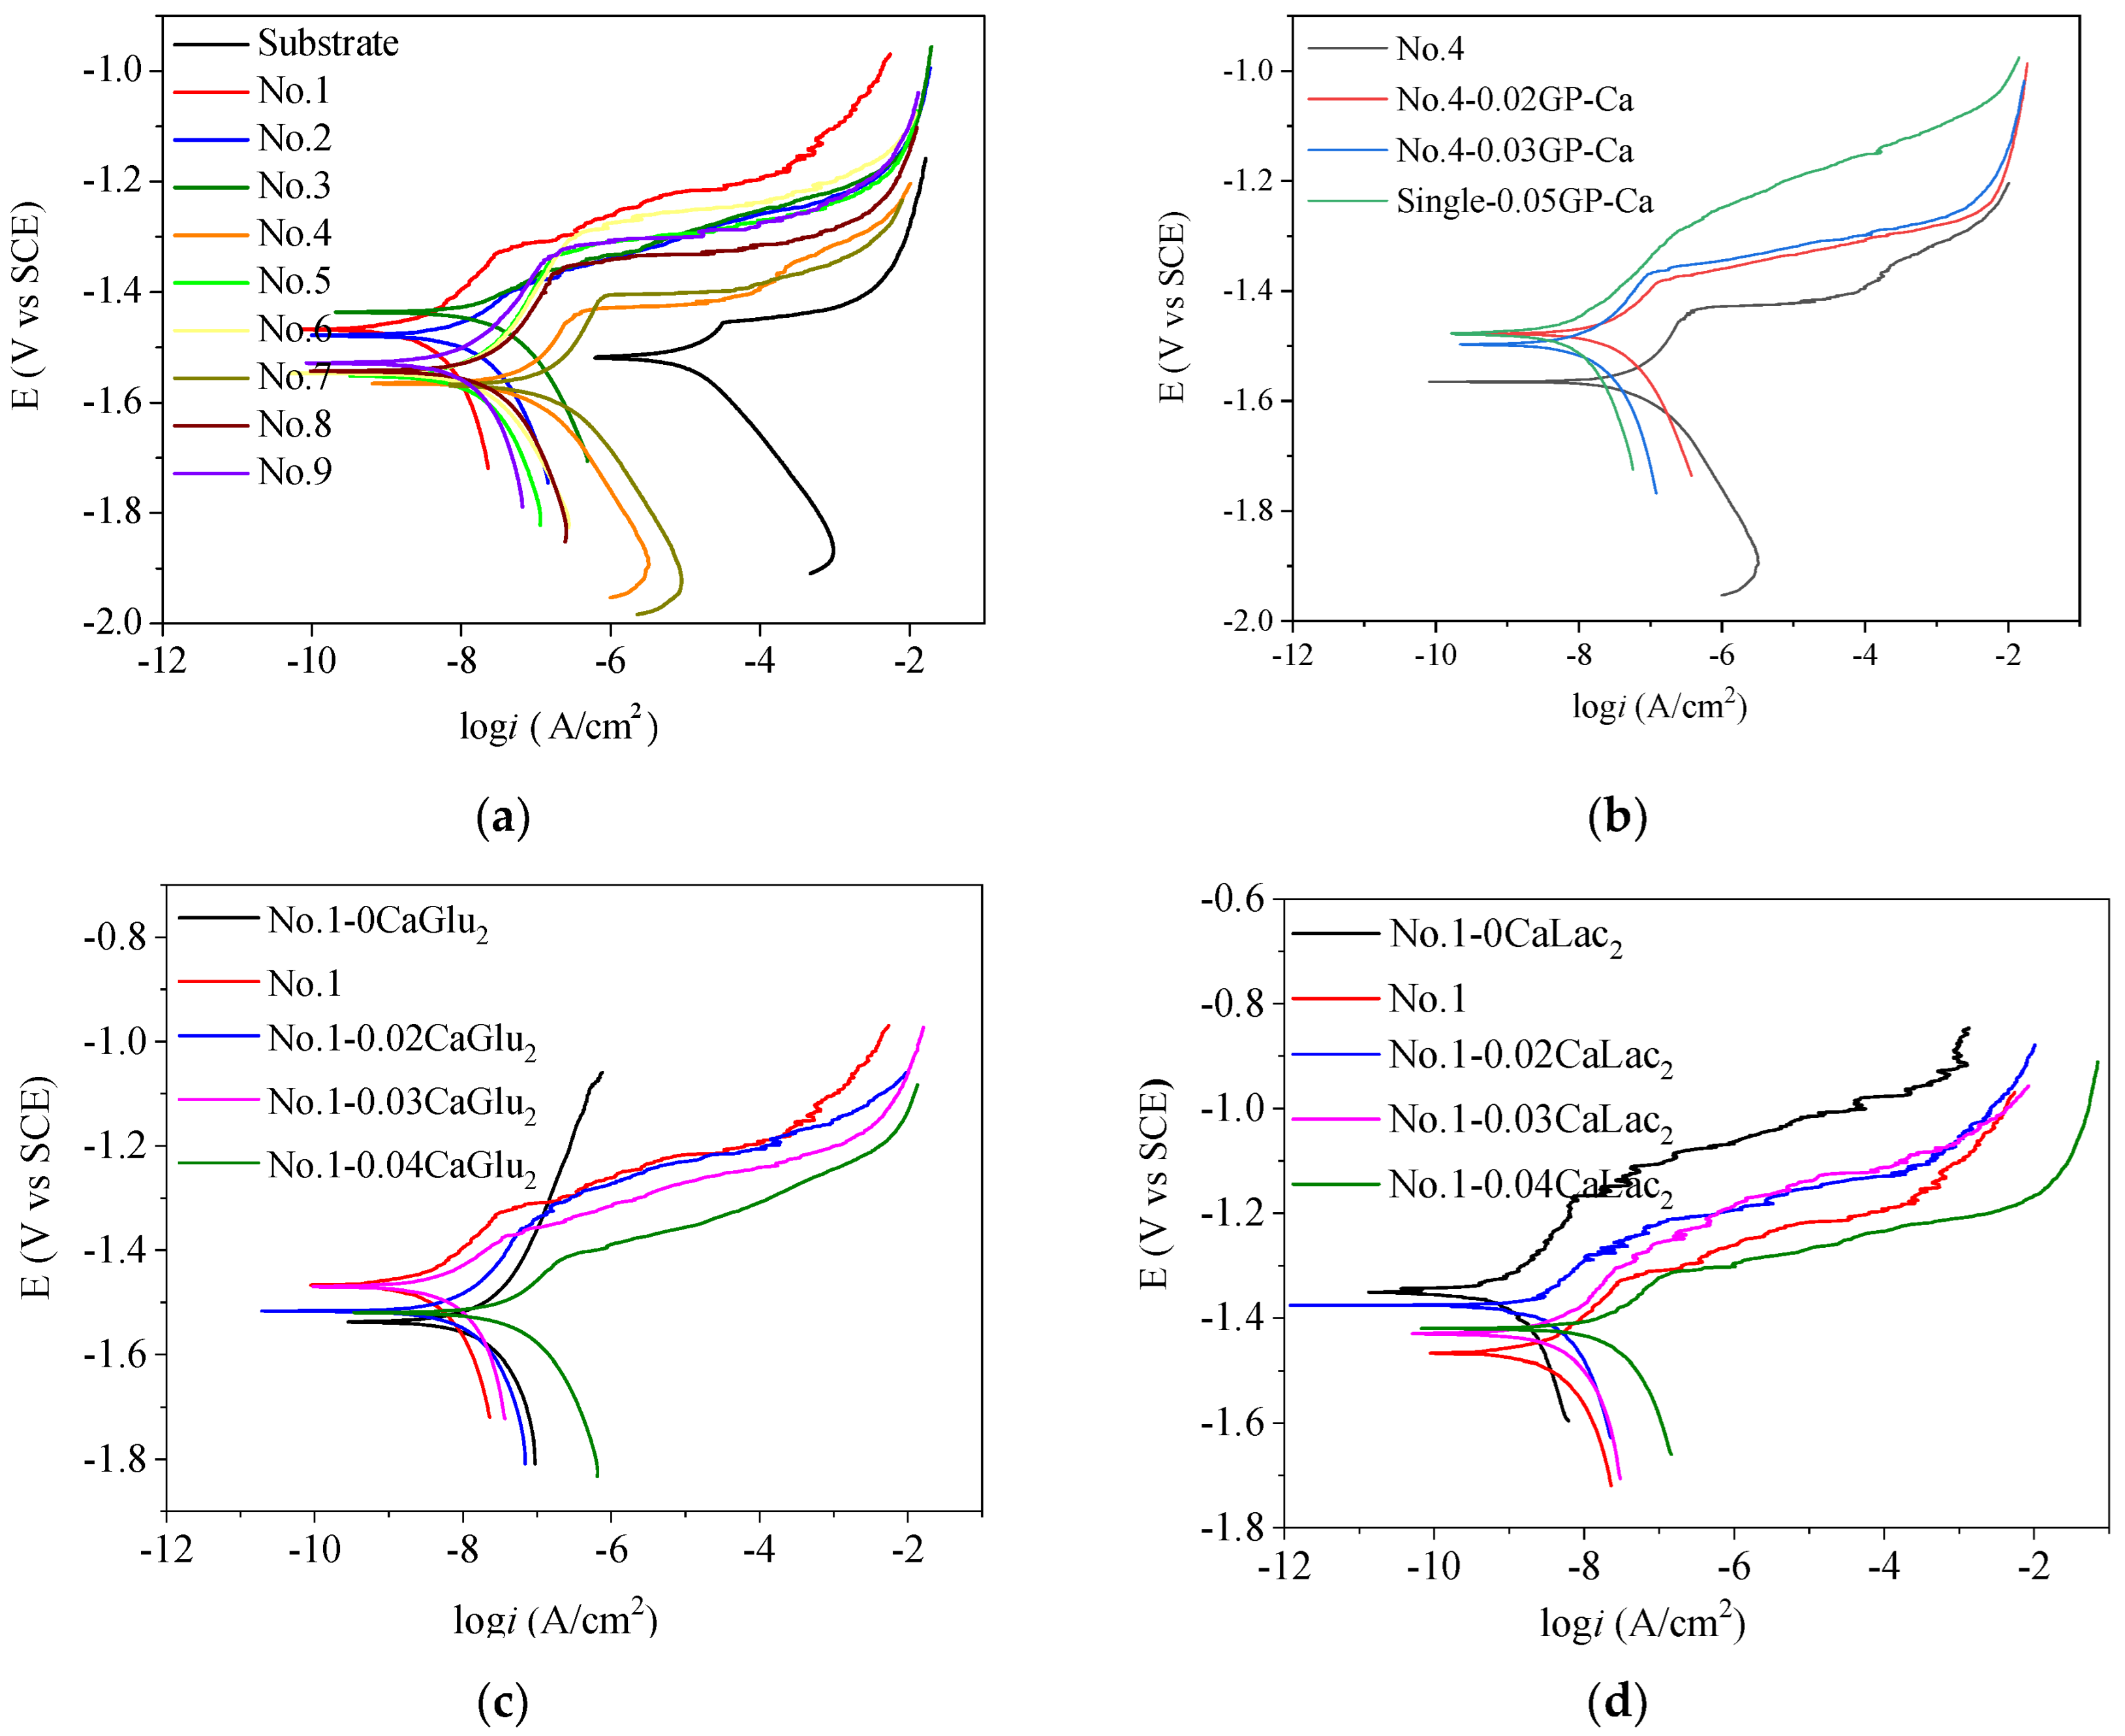
3.1.4. Electrochemical Analysis
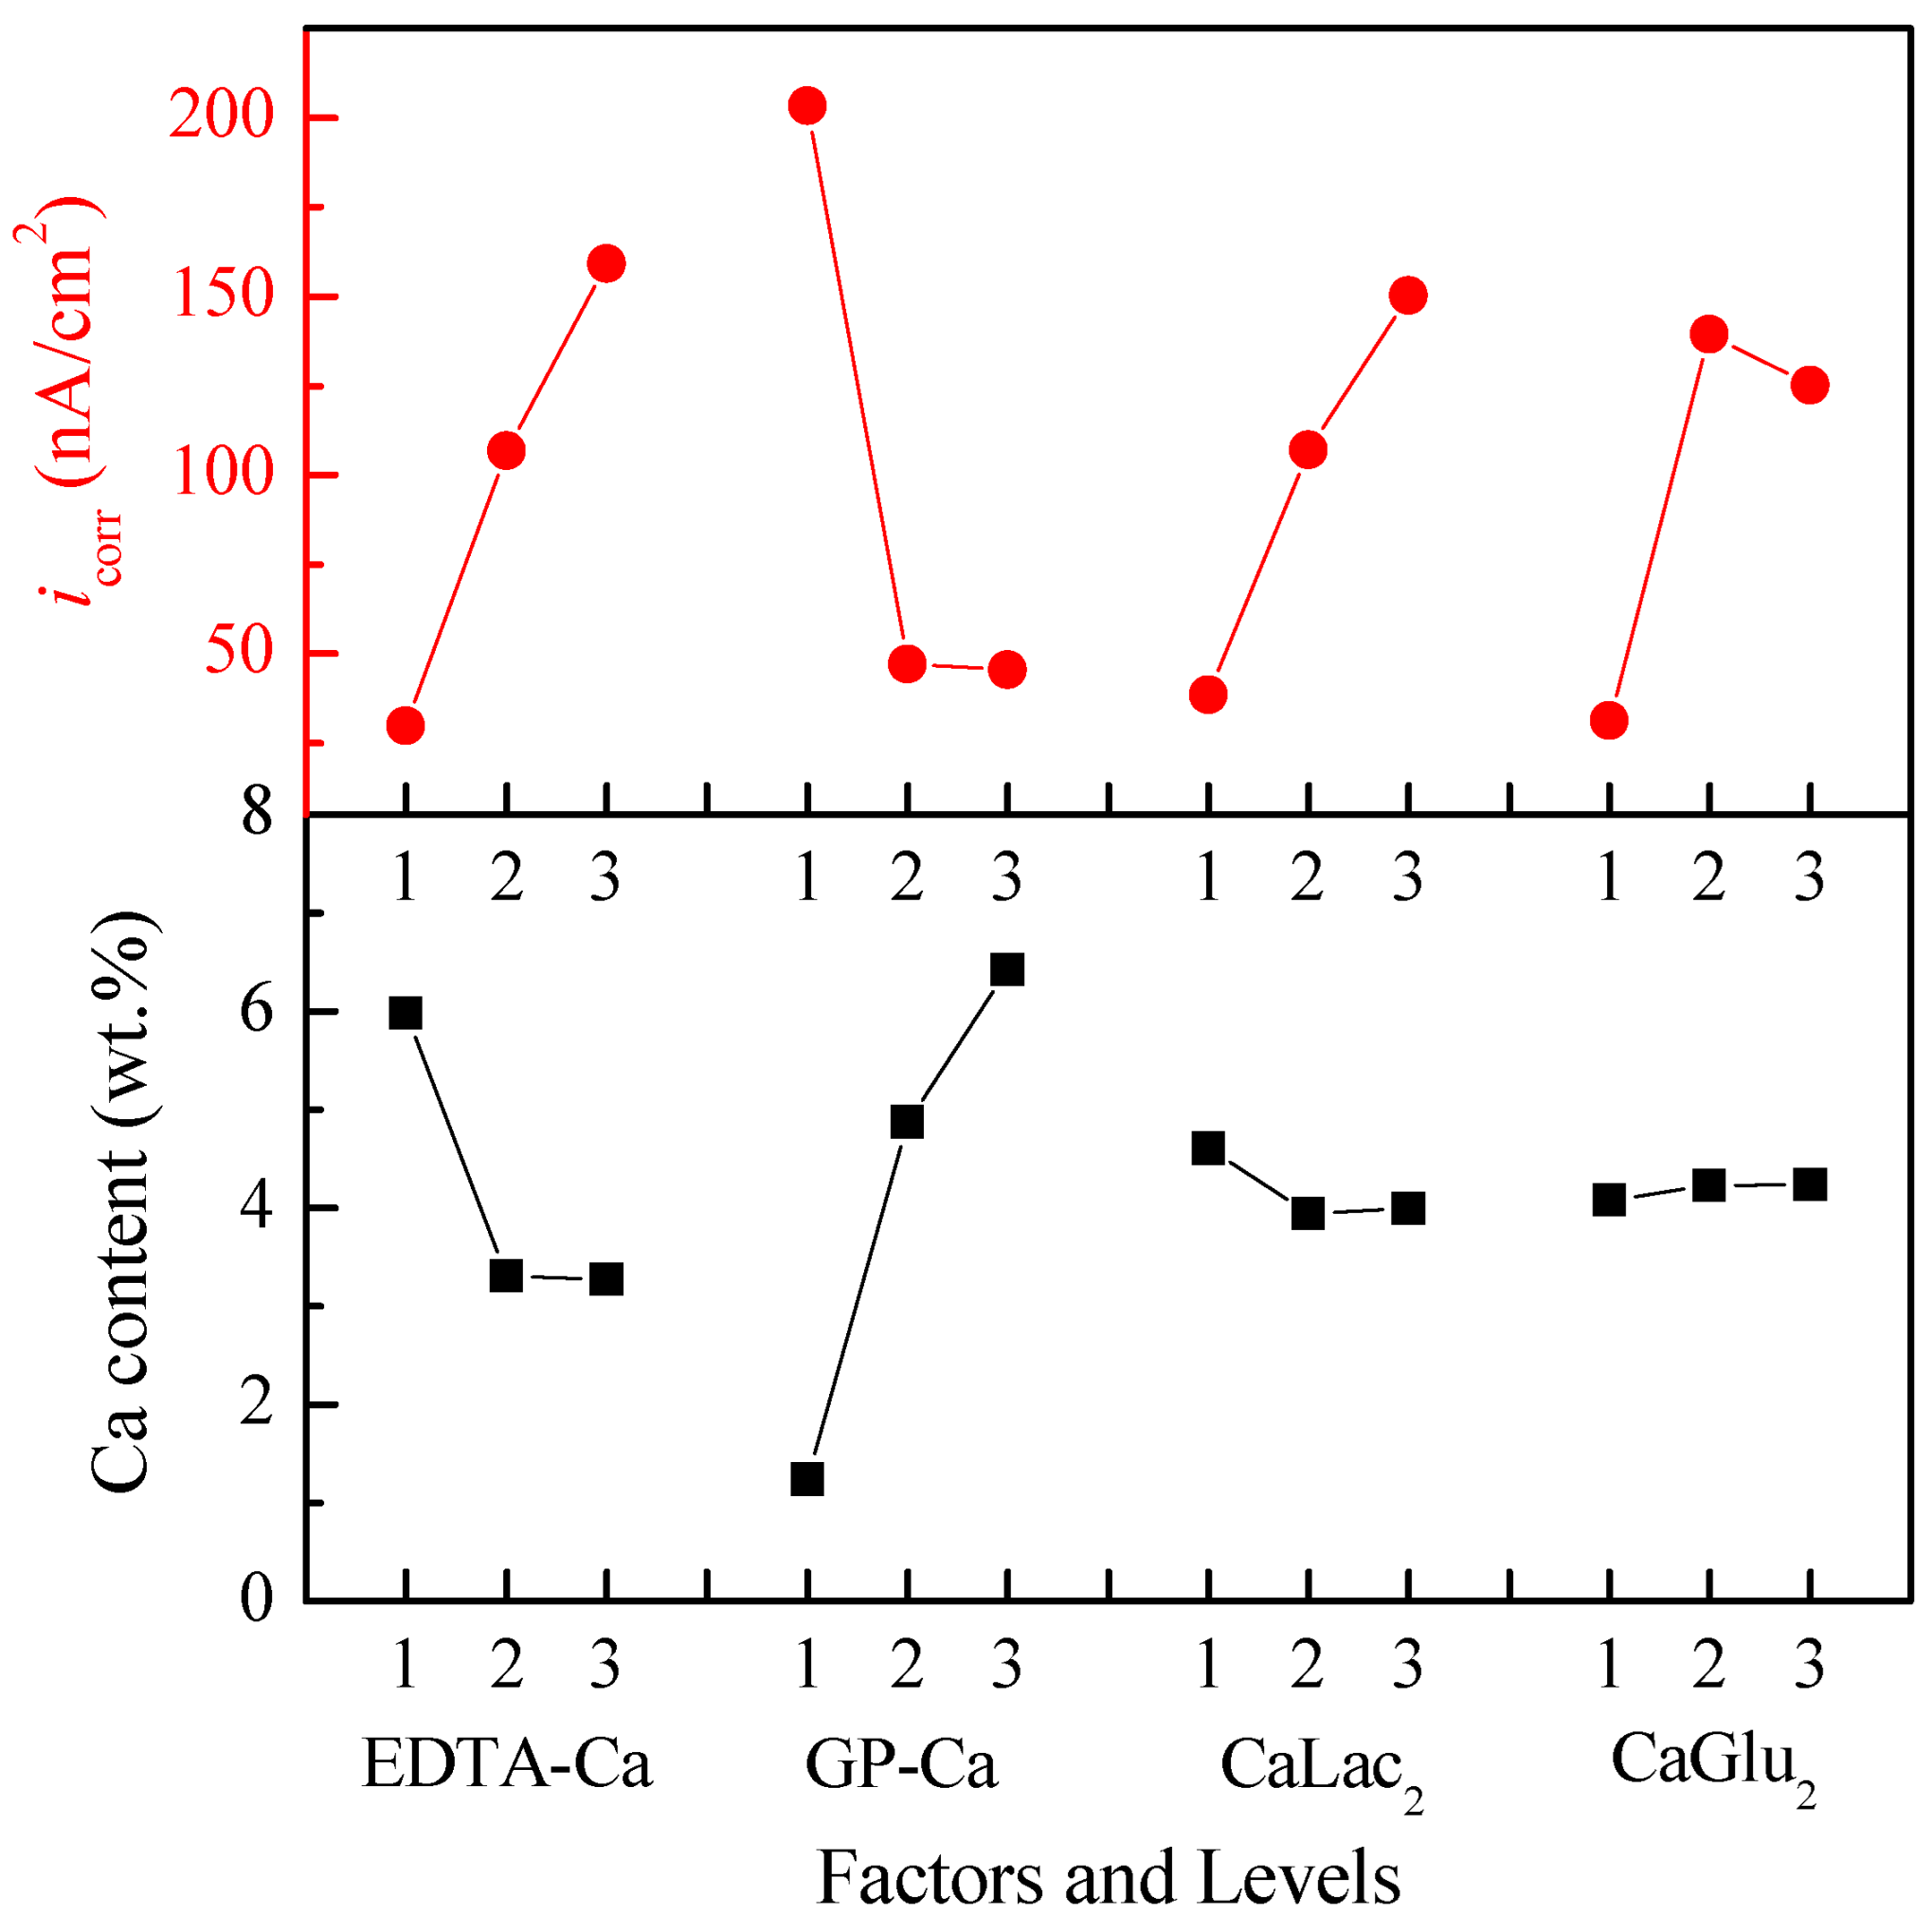
3.2. Orthogonal Experiment Results
3.3. Single-Factor Experiments
3.3.1. Effect of GP–Ca Concentration
3.3.2. Effect of CaGlu2 Concentration
3.3.3. Effect of CaLac2 Concentration
4. Discussion
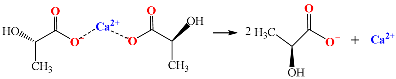
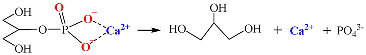
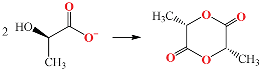
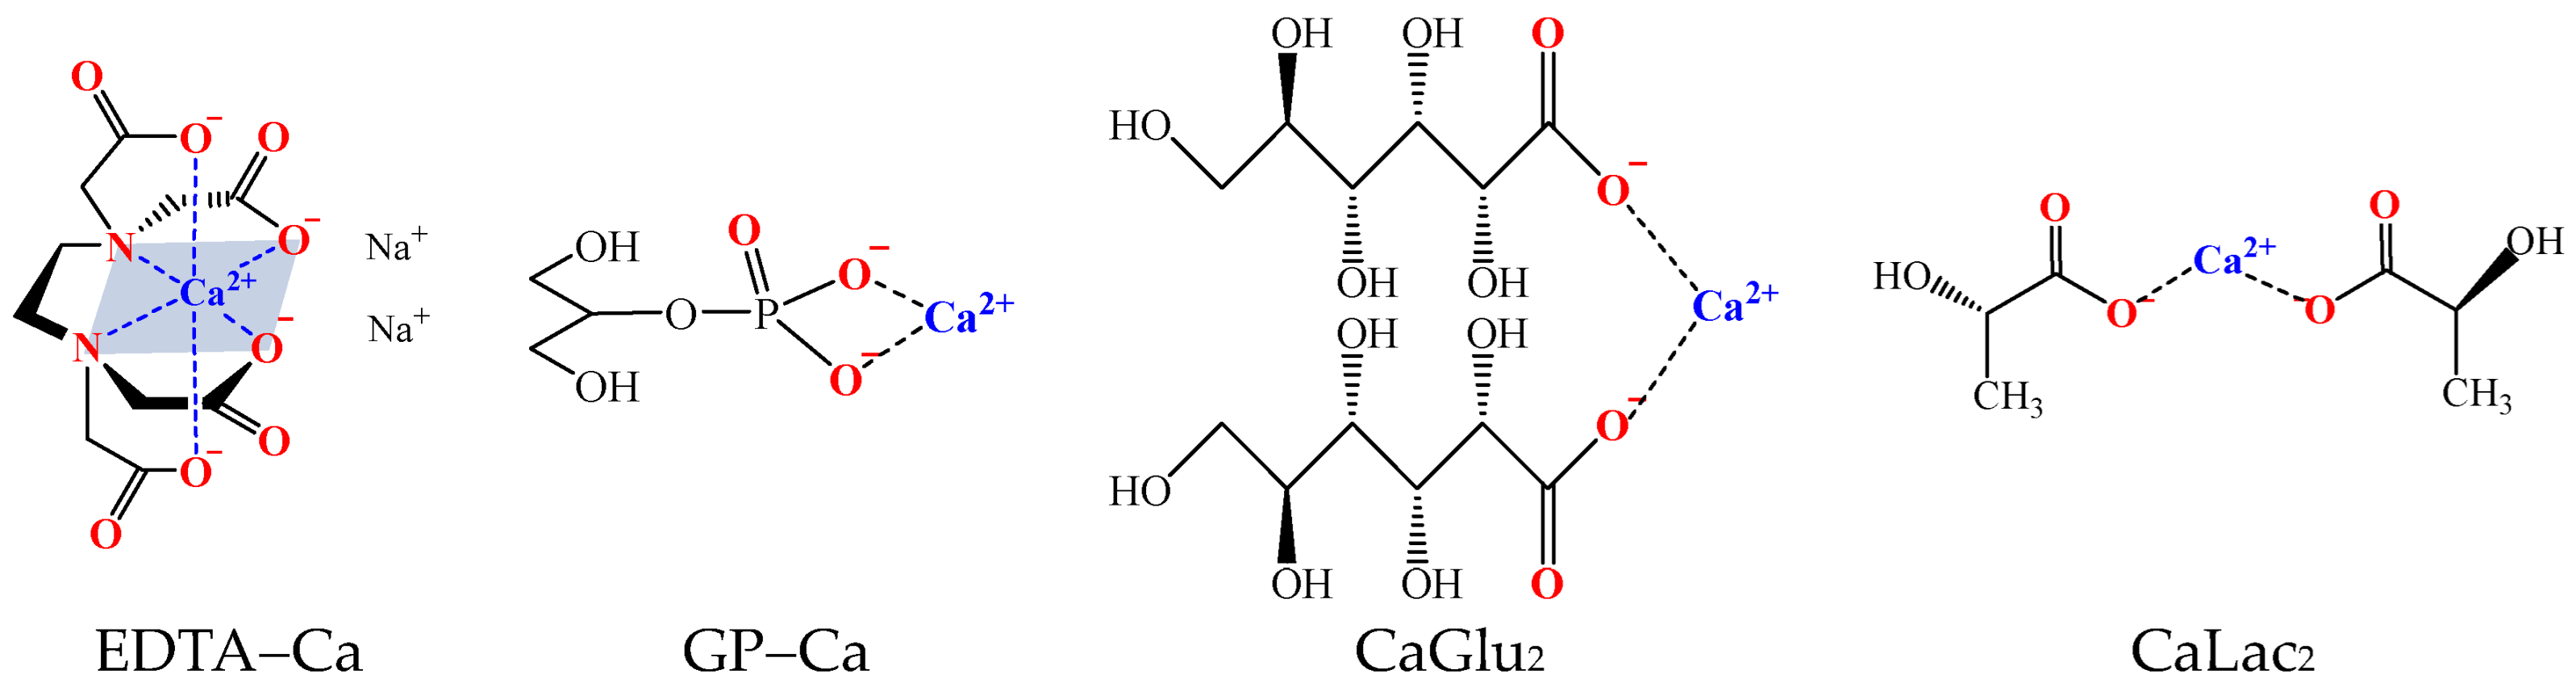
4.1. Formation of Ca–P MAO Coatings
4.2. Effects of the Calcium Salts Concentration
4.2.1. Effect of GP–Ca Concentration
4.2.2. Effect of CaGlu2 and CaLac2 Concentrations
4.2.3. Effect of Total Concentration of the Four Calcium Salts ([Ca2+]T)
5. Conclusions
Author Contributions
Funding
Institutional Review Board Statement
Informed Consent Statement
Data Availability Statement
Conflicts of Interest
References
- Kaseem, M.; Fatimah, S.; Nashrah, N.; Ko, Y.G. Recent progress in surface modification of metals coated by plasma electrolytic oxidation: Principle, structure, and performance. Prog. Mater. Sci. 2021, 117, 100735. [Google Scholar] [CrossRef]
- Abbas, S.; Hamid, R.B.-R.; Somayeh, A.; Ahmad, F.I.; Safian, S.; Seeram, R.; Mohammadreza, D.; Filippo, B. A comprehensive review on surface modifications of biodegradable mangesium-based implant alloy: Polymer coatings opportunities and challenges. Coatings 2021, 11, 747. [Google Scholar]
- Narayanan, T.S.; Park, I.S.; Lee, M.H. Strategies to improve the corrosion resistance of microarc oxidation (MAO) coated magnesium alloys for degradable implants: Prospects and challenges. Prog. Mater. Sci. 2014, 60, 1–71. [Google Scholar] [CrossRef]
- Zhang, L.; Zhang, J.Q.; Chen, C.F.; Gu, Y.H. Advances in microarc oxidation coated AZ31 Mg alloys for biomedical applications. Corros. Sci. 2015, 91, 7–28. [Google Scholar] [CrossRef]
- Guo, L.; Wu, W.; Zhou, Y.F.; Zhang, F.; Zeng, R.C.; Zeng, J.M. Layered double hydroxide coatings on magnesium alloys: A review. J. Mater. Sci. Technol. 2018, 34, 1455–1466. [Google Scholar] [CrossRef]
- Shao, Y.; Zeng, R.C.; Li, S.Q.; Cui, L.Y.; Zou, Y.H.; Guan, S.K.; Zheng, Y.F. Advances in antibacterial magnesium alloys and surface coatings on magnesium alloys: A review. Acta Metall. Sin. (Engl. Lett.) 2020, 33, 615–629. [Google Scholar] [CrossRef]
- Chen, Y.M.; Xiao, M.; Zhao, H.; Yang, B.C. On the anti-tumor properties of biomedical magnesium metal. J. Mater. Chem. B 2015, 3, 849–858. [Google Scholar] [CrossRef]
- Ma, N.; Chen, Y.M.; Yang, B.C. Magnesium metal—A potential biomaterial with antibone cancer properties. J. Biomed. Mater. Res. A 2014, 102, 2644–2651. [Google Scholar]
- Qin, J.; Shi, X.T.; Li, H.Y.; Zhao, R.F.; Li, G.Q.; Zhang, S.F.; Ding, L.Y.; Cui, X.J.; Zhao, Y.; Zhang, R.F. Performance and failure process of green recycling solutions for preparing high degradation resistance coating on biomedical magnesium alloys. Green Chem. 2022, 24, 8113–8130. [Google Scholar] [CrossRef]
- Cheng, Y.L.; Feng, T.; Cheng, Y.L. A systematic study of the role of cathodic polarization and new findings on the soft sparking phenomenon from plasma electrolytic oxidation of an Al-Cu-Li alloy. J. Electrochem. Soc. 2022, 169, 071505. [Google Scholar] [CrossRef]
- Li, X.J.; Zhang, M.; Wen, S.; Mao, X.; Huo, W.G.; Guo, Y.Y.; Wang, Y.X. Microstructure and wear resistance of micro-arc oxidation ceramic coatings prepared on 2A50 aluminum alloys. Surf. Coat. Technol. 2020, 394, 125853. [Google Scholar] [CrossRef]
- He, X.R.; Feng, T.; Cheng, Y.L.; Hu, P.F.; Le, Z.Z.; Liu, Z.H.; Cheng, Y.L. Fast formation of a black inner α-Al2O3 layer doped with CuO on Al–Cu–Li alloy by soft sparking PEO process. Am. Ceram. Soc. 2023, 106, 7019–7042. [Google Scholar] [CrossRef]
- Dai, W.B.; Zhang, C.; Yue, H.T.; Li, Q.; Guo, C.G.; Zhang, J.Z.; Zhao, G.C.; Yang, X.L. A review on the fatigue performance of micro-arc oxidation coated Al alloys with micro-defects and residual stress. J. Mater. Res. Technol. 2023, 25, 4554–4581. [Google Scholar] [CrossRef]
- Guo, Y.; Xu, L.; Luan, J.; Wan, Y.; Li, R. Effect of carbon nanotubes additive on tribocorrosion performance of micro-arc oxidized coatings on Ti6Al4V alloy. Surf. Interfaces 2022, 28, 101626. [Google Scholar] [CrossRef]
- Zhang, Y.; Luo, S.; Wang, Q.; Ramachandran, C.S. Effect of hydrothermal treatment on the surface characteristics and bioactivity of HAP based MAO coating on Ti-6Al-4V alloy. Surf. Coat. Technol. 2023, 464, 129566. [Google Scholar] [CrossRef]
- Cao, G.Q.; Yang, L.; Yang, Y.Y.; Feng, L.Z.; Zhang, X.L.; Li, J.; Liu, B.D. Low-temperature selective catalytic reduction of NOx with NH3 over in-situ grown MnOx-Fe2O3/TiO2/Ti monolithic catalyst. J. Alloys Compd. 2023, 938, 168481. [Google Scholar] [CrossRef]
- Liu, Y.Z.; Chen, C.T.; Liang, T.; Wang, Y.P.; Zhao, R.F.; Li, G.Q.; Bai, C.G.; Wu, Y.X.; Yu, F.L.; Sheng, L.Y.; et al. In vitro long-term antibacterial performance and mechanism of Zn-doped micro-arc oxidation coatings. Colloids. Surf. B. 2024, 233, 113634. [Google Scholar] [CrossRef]
- Ming, X.W.; Wu, Y.; Zhang, Z.Y.; Li, Y. Micro-arc oxidation in titanium and its alloys: Development and potential of implants. Coatings 2023, 13, 2064. [Google Scholar] [CrossRef]
- Liu, Z.H.; Le, Z.Z.; He, X.R.; Cheng, Y.L.; Hu, P.F.; Cheng, Y.L. Plasma electrolytic oxidation of tantalum in an aluminate electrolyte: Effect of cathodic polarization and frequency. Ceram. Int. 2023, 49, 35042–35062. [Google Scholar] [CrossRef]
- Blawert, C.; Dietzel, W.; Ghali, E.; Song, G. Anodizing treatments for magnesium alloys and their effect on corrosion resistance in various environments. Adv. Eng. Mater. 2006, 8, 511–533. [Google Scholar] [CrossRef]
- Yao, Z.P.; Li, L.L.; Liu, X.R.; Jiang, Z.H. Preparation of ceramic conversion layers containing Ca and P on AZ91D Mg alloys by plasma electrolytic oxidation. Surf. Eng. 2010, 26, 317–320. [Google Scholar] [CrossRef]
- Hu, C.; Ashok, D.; Nisbet, R.D.; Gautama, V. Bioinspired surface modification of orthopedic implants for bone tissue engineering. Biomaterials 2019, 219, 119366. [Google Scholar] [CrossRef] [PubMed]
- Dou, J.H.; Gu, G.C.; Chen, C.Z. Effects of calcium salts on microstructure and corrosion behavior of micro-arc oxidation coatings on Mg-2Zn-1Ca-0.8Mn alloy. Mater. Lett. 2017, 196, 42–45. [Google Scholar] [CrossRef]
- Chang, L.M.; Tian, L.F.; Liu, W.; Duan, X.Y. Formation of dicalcium phosphate dihydrate on magnesium alloy by micro-arc oxidation coupled with hydrothermal treatment. Corros. Sci. 2013, 72, 118–124. [Google Scholar] [CrossRef]
- Zhu, Y.Y.; Gao, W.D.; Huang, H.D.; Chang, W.H.; Zhang, S.F.; Zhang, R.F.; Zhao, R.F.; Zhang, Y.J. Investigation of corrosion resistance and formation mechanism of calcium-containing coatings on AZ31B magnesium alloy. Appl. Surf. Sci. 2019, 487, 581–592. [Google Scholar] [CrossRef]
- Shi, X.T.; Wang, Y.; Li, H.Y.; Zhang, S.F.; Zhao, R.F.; Li, G.Q.; Zhang, R.F.; Sheng, Y.; Cao, S.Y.; Zhao, Y.J.; et al. Corrosion resistance and biocompatibility of calcium-containing coatings developed in near-neutral solutions containing phytic acid and phosphate acid on AZ31B alloy. J. Alloys Compd. 2020, 823, 153721. [Google Scholar] [CrossRef]
- Miao, X.; Shi, X.T.; Shen, Y.L.; Zhang, W.X.; Hu, W.X.; Zhang, S.F.; Huang, X.W.; Wang, Y.; Zhao, R.F.; Zhang, R.F. Investigation of hexamethylenetetramine effects on formation and corrosion resistance of anodic coatings developed on AZ31B alloys. Surf. Coat. Technol. 2022, 447, 128824. [Google Scholar] [CrossRef]
- Ou, H.H.; Tran, Q.; Lin, P.H. A synergistic effect between gluconate and molybdate on corrosion inhibition of recirculating cooling water systems. Corros. Sci. 2018, 133, 231–239. [Google Scholar] [CrossRef]
- Lahodny-Šarc, O.; Kapor, F. Corrosion inhibition of carbon steel in the near neutral media by blends of tannin and calcium gluconate. Mater. Corros. 2002, 53, 264–268. [Google Scholar] [CrossRef]
- Criado, M.; Monticelli, C.; Fajardo, S.; Gelli, D.; Grassi, V.; Bastidas, J.M. Organic corrosion inhibitor mixtures for reinforcing steel embedded in carbonated alkali-activated fly as mortar. Constr. Build. Mater. 2012, 35, 30–37. [Google Scholar] [CrossRef]
- Vololonirina, O.; Sellier, A.; Arliguie, G. Development and validation of a numerical model to predict the penetration of a glycerophosphate-based corrosion inhibitor through concrete. Constr. Build. Mater. 2012, 37, 541–547. [Google Scholar] [CrossRef]
- Qin, J.; Chen, Y.Q.; Chen, C.T.; Zhong, S.; Yan, Z.K.; Liu, W.J.; Wang, Y.B.; Lai, X.Y.; Zhao, Y.; Zhao, R.F.; et al. Preparation of HA-containing coating by one-step MAO on titanium alloys through synergistic effect of calcium gluconate and calcium glycerophosphate. Surf. Coat. Technol. 2023, 466, 129655. [Google Scholar] [CrossRef]
- Vavrusova, M.; Munk, M.B.; Skibsted, L.H. Aqueous solubility of calcium L-lactate, calcium D-gluconate, and calcium D-Lactobionate: Importance of complex formation for solubility increase by hydroxycarboxylate mixtures. J. Agric. Food Chem. 2013, 61, 8207–8214. [Google Scholar] [CrossRef] [PubMed]
- Kutus, B.; Gaona, X.; Pallagi, A.; Pálinkó, I.; Altmaier, M.; Sipos, P. Recent advances in the aqueous chemistry of the calcium(II)-gluconate system-Equilibria, structure and composition of the complexes forming in neutral and in alkaline solutions. Coord. Chem. Rev. 2020, 417, 213337. [Google Scholar] [CrossRef]
- Dudás, C.; Kutus, B.; Böszörményi, E.; Peintler, G.; Kele, Z.; Pálinkó, I.; Sopos, P. Calcium complexing behavior of lactate in neutral to highly alkaline medium. J. Mol. Struct. 2019, 1180, 491–498. [Google Scholar] [CrossRef]
- Ducasse-Lapeyrusse, J.; Gagné, R.; Lors, C.; Damidot, D. Effect of calcium gluconate, calcium lactate and urea on the kinetics of self-healing in mortars. Constr. Build. Mater. 2017, 57, 489–497. [Google Scholar] [CrossRef]
- Udoh, I.I.; Shi, H.W.; Daniel, E.F.; Li, J.Y.; Gu, S.H.; Liu, F.C.; Han, E.H. Active anticorrosion and self-healing coatings: A review with focus on multi-action smart coating strategies. J. Mater. Sci. Technol. 2022, 116, 224–237. [Google Scholar] [CrossRef]
- Xu, J.L.; Tao, S.C.; Bao, L.Z.; Luo, J.M.; Zheng, Y.F. Effects of Mo contents on the microstructure, properties and cytocompatibility of the microwave sintered porous Ti-Mo alloys. Mater. Sci. Eng. C. 2019, 97, 156–165. [Google Scholar] [CrossRef]
- Zhu, Y.Y.; Chang, W.H.; Zhang, S.F.; Song, Y.W.; Huang, H.D.; Zhao, R.F.; Li, G.Q.; Zhang, R.F.; Zhang, Y.J. Investigation on corrosion resistance and formation mechanism of a P-F-Zr contained Micro-arc oxidation coating on AZ31B magnesium alloy using an orthogonal method. Coatings 2019, 9, 197. [Google Scholar] [CrossRef]
- Jia, Z.J.; Li, M.; Liu, Q.; Xu, X.C.; Cheng, Y.; Zheng, Y.F.; Xi, T.F.; Wei, S.C. Micro-arc oxidation of a novel Mg-1Ca alloy in three alkaline KF electrolytes: Corrosion resistance and cytotoxicity. Appl. Surf. Sci. 2014, 292, 1030–1039. [Google Scholar] [CrossRef]
- Demri, B.; Muster, D. XPS study of some calcium compounds. J. Mater. Process. Technol. 1995, 55, 311–314. [Google Scholar] [CrossRef]
- Tang, H.; Han, Y.; Wu, T.; Tao, W.; Jian, X.; Wu, Y.F.; Xu, F.J. Synthesis and properties of hydroxyapatite-containing coating on AZ31 magnesium alloy by micro-arc oxidation. Appl. Surf. Sci. 2017, 400, 391–404. [Google Scholar] [CrossRef]
- Chen, G.D.; Liang, X.Y.; Zhang, P.; Lin, S.T.; Cai, C.C.; Yu, Z.Y.; Liu, J. Bioinspired 3S printing of functional materials by harnessing enzyme-induced biomineralization. Adv. Funct. Mater. 2022, 32, 2113262. [Google Scholar] [CrossRef]
- Isam, A.Z.; Robert, J.; Mohammed, A.; Moayed, A.; Farzad, D.; Hussameldin, I. Crude glycerol as an innovative corrosion inhibitor. Appl. Syst. Innov. 2018, 1, 12. [Google Scholar]
- Foreman, M.M.; Terry, L.M.; Weber, J.M. Binding pocket response of EDTA complexes with alkaline earth dications to stepwise hydration-structural insight from infrared spectra. J. Phys. Chem. A 2023, 127, 5374–5381. [Google Scholar] [CrossRef]
- Park, H.W.; Bae, E.Y.; Lee, J.J.; Park, J.W.; Choi, W.Y. Effect of anchoring group in Ru-bipyridyl sensitizers on the photoelectrochemical behavior of dye-sensitized TiO2 electrodes: Carboxylate versus phosphonate linkages. J. Phys. Chem. B 2006, 110, 8740–8749. [Google Scholar] [CrossRef]
- Makurat, K.; Asprolewicz, B.; Ossowska, A. Recent advances in electrochemistry surface treated titanium and its alloys for biomedical applications: A review of anodic and plasma electrolytic oxidation methods. Mater. Today Commun. 2023, 34, 105425. [Google Scholar] [CrossRef]
- Zhu, W.; Fang, Y.J.; Zheng, H.; Tan, G.; Cheng, H.; Ning, C. Effect of applied voltage on phase components of composite coatings prepared by micro-arc oxidation. Thin Solid Films 2013, 544, 79–82. [Google Scholar] [CrossRef]


| Experiment No. | Concentration of Calcium Salt (mol/L) | Ca Content (wt.%) | icorr (nA/cm2) | |||
|---|---|---|---|---|---|---|
| EDTA–Ca | GP–Ca | CaLac2 | CaGlu2 | |||
| No. 1 | 0.01 | 0.01 | 0.01 | 0.01 | 3.37 | 6.89 |
| No. 2 | 0.01 | 0.02 | 0.02 | 0.02 | 6.48 | 27.7 |
| No. 3 | 0.01 | 0.03 | 0.03 | 0.03 | 8.08 | 55.1 |
| No. 4 | 0.02 | 0.01 | 0.02 | 0.03 | 0.19 | 246 |
| No. 5 | 0.02 | 0.02 | 0.03 | 0.01 | 3.72 | 39.7 |
| No. 6 | 0.02 | 0.03 | 0.01 | 0.02 | 6.02 | 34.5 |
| No. 7 | 0.03 | 0.01 | 0.03 | 0.02 | 0.19 | 356 |
| No. 8 | 0.03 | 0.02 | 0.01 | 0.03 | 4.45 | 74.0 |
| No. 9 | 0.03 | 0.03 | 0.02 | 0.01 | 5.16 | 47.0 |
| k1 | 5.98 (29.90) | 1.25 (203.0) | 4.61 (38.46) | 4.08 (31.20) | ||
| k2 | 3.31 (106.7) | 4.88 (47.13) | 3.94 (106.9) | 4.23 (139.40) | ||
| k3 | 3.27 (159.0) | 6.42 (45.53) | 4.00 (150.27) | 4.24 (125.03) | ||
| Difference | 2.71 (129.10) | 5.17 (157.43) | 0.67 (111.80) | 0.16 (108.20) | ||
| Rank | 2 (2) | 1 (1) | 3 (3) | 4 (4) | ||
| Sample | Concentration of Calcium Salt (mol/L) | Coating Feature | Ca Content (wt.%) | ||||
|---|---|---|---|---|---|---|---|
| EDTA–Ca | GP–Ca | CaLac2 | CaGlu2 | [Ca]T | |||
| No. 4 | 0.02 | 0.01 | 0.02 | 0.03 | 0.08 | corrosion pits | 0.19 |
| No. 4–0.02GP–Ca | 0.02 | 0.02 | 0.02 | 0.03 | 0.09 | localized ablation | 5.86 |
| No. 4–0.03GP–Ca | 0.02 | 0.03 | 0.02 | 0.03 | 0.10 | localized ablation | 6.89 |
| Single–0.05GP–Ca | 0 | 0.05 | 0 | 0 | 0.05 | typically porous | 0.11 |
| No. 1–0CaGlu2 | 0.01 | 0.01 | 0.01 | 0 | 0.03 | typically porous | 2.18 |
| No. 1–0.01CaGlu2 (No. 1) | 0.01 | 0.01 | 0.01 | 0.01 | 0.04 | typically porous | 3.37 |
| No. 1–0.02CaGlu2 | 0.01 | 0.01 | 0.01 | 0.02 | 0.05 | typically porous | 3.87 |
| No. 1–0.03CaGlu2 | 0.01 | 0.01 | 0.01 | 0.03 | 0.06 | typically porous | 4.31 |
| No. 1–0.04CaGlu2 | 0.01 | 0.01 | 0.01 | 0.04 | 0.07 | localized ablation | 4.68 |
| No. 1–0CaLac2 | 0.01 | 0.01 | 0 | 0.01 | 0.03 | typically porous | 2.66 |
| No. 1–0.01CaLac2 (No. 1) | 0.01 | 0.01 | 0.01 | 0.01 | 0.04 | typically porous | 3.37 |
| No. 1–0.02CaLac2 | 0.01 | 0.01 | 0.02 | 0.01 | 0.05 | typically porous | 3.86 |
| No. 1–0.03CaLac2 | 0.01 | 0.01 | 0.03 | 0.01 | 0.06 | typically porous | 3.92 |
| No. 1–0.04CaLac2 | 0.01 | 0.01 | 0.04 | 0.01 | 0.07 | localized ablation | 4.05 |
| Sample | βa (mV/dec) | βc (mV/dec) | icorr (nA/cm2) | Ecorr (V) | Rp (MΩ/cm2) |
|---|---|---|---|---|---|
| Substrate | 0.7271 | 0.1435 | 4670 | −1.55 | 0.1114 |
| No. 4 | 0.5382 | 0.2855 | 246 | −1.56 | 0.3293 |
| No. 4–0.02GP–Ca | 0.2382 | 0.590 | 54.1 | −1.45 | 1.362 |
| No. 4–0.03GP–Ca | 0.3237 | 0.3833 | 64.9 | −1.49 | 1.174 |
| Single–0.05GP–Ca | 0.1549 | 0.3380 | 17.4 | −1.45 | 2.651 |
| No. 1–0CaGlu2 | 0.5972 | 0.639 | 10.3 | −1.54 | 13.014 |
| No. 1–0.01CaGlu2 (No. 1) | 0.2050 | 0.4192 | 6.89 | −1.47 | 8.676 |
| No. 1–0.02CaGlu2 | 0.501 | 0.7346 | 35.0 | −1.52 | 3.659 |
| No. 1–0.03CaGlu2 | 0.2394 | 0.5887 | 37.1 | −1.47 | 1.992 |
| No. 1–0.04CaGlu2 | 0.3206 | 0.3112 | 135 | −1.52 | 0.508 |
| No. 1–0CaLac2 | 0.3538 | 0.786 | 4.82 | −1.35 | 21.979 |
| No. 1–0.01CaLac2 (No. 1) | 0.2050 | 0.4192 | 6.89 | −1.47 | 8.676 |
| No. 1–0.02CaLac2 | 0.4691 | 0.7658 | 19.7 | −1.38 | 6.412 |
| No. 1–0.03CaLac2 | 0.3596 | 0.8103 | 20.7 | −1.43 | 5.225 |
| No. 1–0.04CaLac2 | 0.2647 | 0.5521 | 75.1 | −1.42 | 1.034 |
Disclaimer/Publisher’s Note: The statements, opinions and data contained in all publications are solely those of the individual author(s) and contributor(s) and not of MDPI and/or the editor(s). MDPI and/or the editor(s) disclaim responsibility for any injury to people or property resulting from any ideas, methods, instructions or products referred to in the content. |
© 2024 by the authors. Licensee MDPI, Basel, Switzerland. This article is an open access article distributed under the terms and conditions of the Creative Commons Attribution (CC BY) license (https://creativecommons.org/licenses/by/4.0/).
Share and Cite
Chen, C.; Shi, X.; Zhang, S.; Shen, Y.; Zhao, Y.; Zhang, R.; Zhao, R. Mutual Impact of Four Organic Calcium Salts on the Formation and Properties of Micro-Arc Oxidation Coatings on AZ31B Magnesium Alloys. Coatings 2024, 14, 140. https://doi.org/10.3390/coatings14010140
Chen C, Shi X, Zhang S, Shen Y, Zhao Y, Zhang R, Zhao R. Mutual Impact of Four Organic Calcium Salts on the Formation and Properties of Micro-Arc Oxidation Coatings on AZ31B Magnesium Alloys. Coatings. 2024; 14(1):140. https://doi.org/10.3390/coatings14010140
Chicago/Turabian StyleChen, Changtian, Xiaoting Shi, Shufang Zhang, Youliang Shen, Ying Zhao, Rongfa Zhang, and Rongfang Zhao. 2024. "Mutual Impact of Four Organic Calcium Salts on the Formation and Properties of Micro-Arc Oxidation Coatings on AZ31B Magnesium Alloys" Coatings 14, no. 1: 140. https://doi.org/10.3390/coatings14010140