
Development of Laser Cavitation Peening Using a Normal-Oscillation Nd:YAG Laser


Department of Finemechanics, Tohoku University, Sendai 980-8579, Japan
Coatings 2023, 13(8), 1395; https://doi.org/10.3390/coatings13081395
Submission received: 18 July 2023
/
Revised: 2 August 2023
/
Accepted: 7 August 2023
/
Published: 8 August 2023
(This article belongs to the Special Issue Laser Surface Engineering)
Abstract
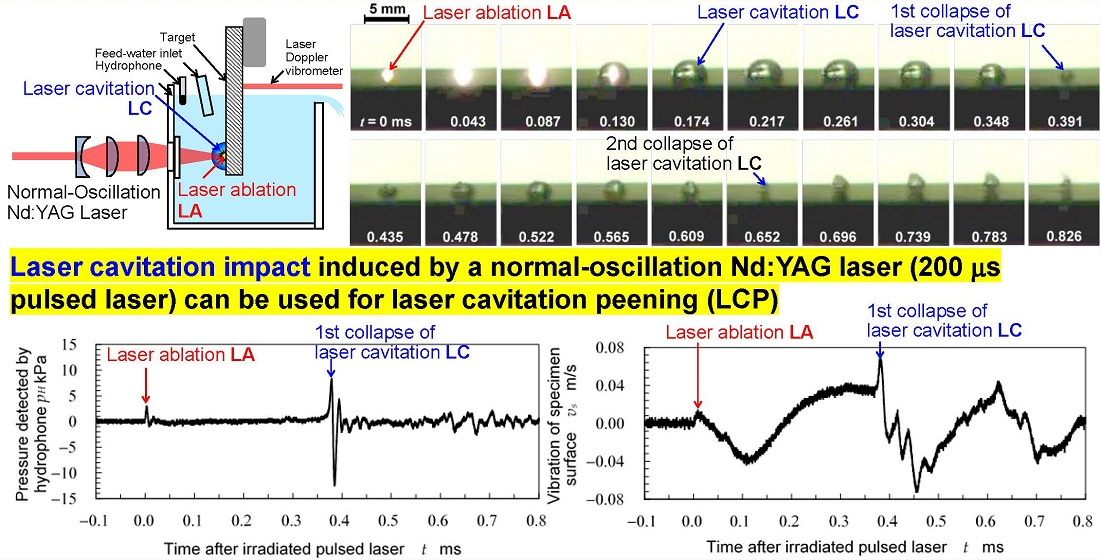
:The impact induced by cavitation bubble collapse can be utilized for mechanical surface treatment to improve fatigue properties of metals including additive manufactured metallic materials. A peening method using cavitation impact induced by a pulsed laser is called “laser cavitation peening (LCP)”. Normally, a Q-switched Nd:YAG laser, whose pulse width is a few nanoseconds, is used for LCP, which improves the fatigue strength. The problem with LCP is that the processing time is too slow. If a laser pulse whose pulse width is a few hundred microseconds can be utilized for LCP, the repetition frequency can be increased drastically using other types of laser systems such as a fiber laser. In the present paper, in order to reveal the possibility of LCP using a pulsed laser width of a few hundred microseconds, the use of LCP with a normal-oscillation Nd:YAG laser (pulse width ≈ 200 μs) was investigated. It is demonstrated that LCP with the normal-oscillation Nd:YAG laser produced curvature in an aluminum alloy plate. The shock pressure wave and impulsive vibration of the target surface at the first collapse of laser cavitation (LC), which was induced by the normal-oscillation Nd:YAG laser, was 3–4 times larger than those of laser ablation (LA).

1. Introduction
In order to improve the fatigue properties of metallic materials, mechanical surface treatments such as shot peening have been applied [1,2,3,4]. Shot peening also reduces stress corrosion cracking [5]. A novel peening method using the impact at cavitation bubble collapse has been developed, called “cavitation peening (CP)” [6]. During conventional CP, cavitation is generated by injecting a high-speed water jet into the water, i.e., a cavitating jet [6]. CP using a cavitating jet is applied for the mitigation of stress corrosion cracking of nuclear power plants [7]. CP also improves the fatigue strength of metallic materials [6], including additive manufactured metal [8]. In the case of submerged laser peening [9], a bubble is generated after laser ablation (LA), which is generated by a nanosecond laser pulse, and the bubble behaves as a cavitation bubble, subsequently producing impact at bubble collapse [6,10]. The bubble is called “laser cavitation (LC)”, while the peening method using the LC impact is named “laser cavitation peening (LCP)” [11]. LCP drastically improves the fatigue strength of magnesium alloy [12] and additive-manufactured metallic materials [6]; however, it takes time to treat the surface. Thus, an improvement in the efficiency of LCP is required. Note that a relatively longer laser pulse, e.g., microseconds, can be used for LCP, whereby the efficiency would be increased drastically, as the repetition frequency of a nanosecond laser pulse system is very limited.
In the case of laser peening, which is also called laser shock peening, there are three types. In the first case, a relatively large, pulsed laser (e.g., several joules per pulse) is used to irradiate the target, which is covered by a confining medium such as a water film [13,14,15,16,17,18,19]. In the second case, a pulsed laser (e.g., several hundred millijoules per pulse) is applied to the target, which is placed in water [9,20,21,22,23]. In the present paper, this is referred to as submerged laser peening. In both the first and the second cases, a confining medium such as water is required. In the third case, a confining medium is not required as a femtosecond laser is used [24]; this method is called dry laser peening [25,26].
In the case of submerged laser peening, LC is generated after LA, as mentioned above. When the pressure wave in water was measured, the amplitude of pressure at LA was larger than that at LC collapse [10,11]. However, when the impact passing through a metallic target was measured using a handmade impact sensor with a polyvinylidene fluoride (PVDF) film [6], the impact induced by LC collapse was larger than that induced by LA [11]. Note that the water quality (e.g., gas content) affects the LC impact [11]. Normally, during submerged laser peening, the second harmonic wavelength of a Nd:YAG laser, i.e., 532 nm, is used to minimize absorption due to water [9,23]. On the other hand, in the research area of experimental bubble dynamics using a pulsed laser, the fundamental wavelength of a Nd:YAG laser (i.e., 1064 nm) has been used [27]. There are two reasons. The first reason is that the heat is more concentrated as cavitation is a phase change from liquid to gas. The second reason is that 40% of the pulse energy at 1064 nm is lost to obtain 532 nm via wavelength conversion. When the standoff distance in water was optimized, using LCP at 1064 nm was better than at 532 nm [11].
During conventional LCP, a Q-switched pulsed laser (532 nm or 1064 nm) is used, with a pulse width of several ns. This is because LCP uses both LA impact and LC impact, although the latter is larger than the former. In order to generate LA impact, a Q-switched pulsed laser with a pulse width of a few nanoseconds is required. A high-repetition portable pulse laser with a power and pulse width of 10 mJ and 1.3 ns was developed in [28]; however, its repetition frequency is about 100 Hz, and 800–1600 pulses/mm2 are required for treatment. On the other hand, a pulsed laser with a pulse width of several hundred microseconds was shown to generate LC in dental and medical applications [11,29]. When LC impact without LA impact can treat metallic materials, a short laser pulse (e.g., pulse width of a few nanoseconds) is not required. If a pulsed laser with a pulse width of several hundred microseconds can be used for LCP, the processing efficiency can be drastically improved. Accordingly, other types of laser systems such as a fiber laser, whose maximum repetition frequency is 50 kHz, can be used for LCP. Note that the repetition frequency range of a conventional Nd:YAG laser with a Q-switch is currently dozens to hundreds of hertz. The other advantage of a pulsed laser with a relatively longer pulse width is that an optical fiber can be used in LCP systems. Although a fiber delivery system for nuclear power reactors has been utilized since 2002 [21], this does not translate easily to practical applications such as aviation and automobile components, as a special fiber is required. A relatively low energy pulse such as 3 or 15 mJ/pulse was developed for a portable laser peening system, in which a microtip laser is connected to a power supply with a fiber cable [28]. If LCP with a relatively longer laser pulse is realized, an LCP system with an optical fiber of tens to hundreds of millijoules can be introduced, thus dramatically expanding the applications of LCP.
At conventional LCP, the maximum repetition frequency of LCP is about 100 Hz because of a Q-switched Nd:YAG laser, which generates both LA and LC impacts. If LC impact induced a pulsed laser with a pulse width of 200 μs realizes LCP without LA impact, a laser such as a fiber laser whose maximum repetition frequency is 50 kHz, can be used for LCP, and the processing efficiency of LCP is improved drastically. In the present paper, to show the possibility of a drastic improvement in the processing efficiency of LCP, LCP using a pulsed laser with a pulse width of 200 μs is demonstrated using a normal-oscillation Nd:YAG laser, after optimizing the LCP conditions such as the standoff distance in water.
2. Materials and Methods
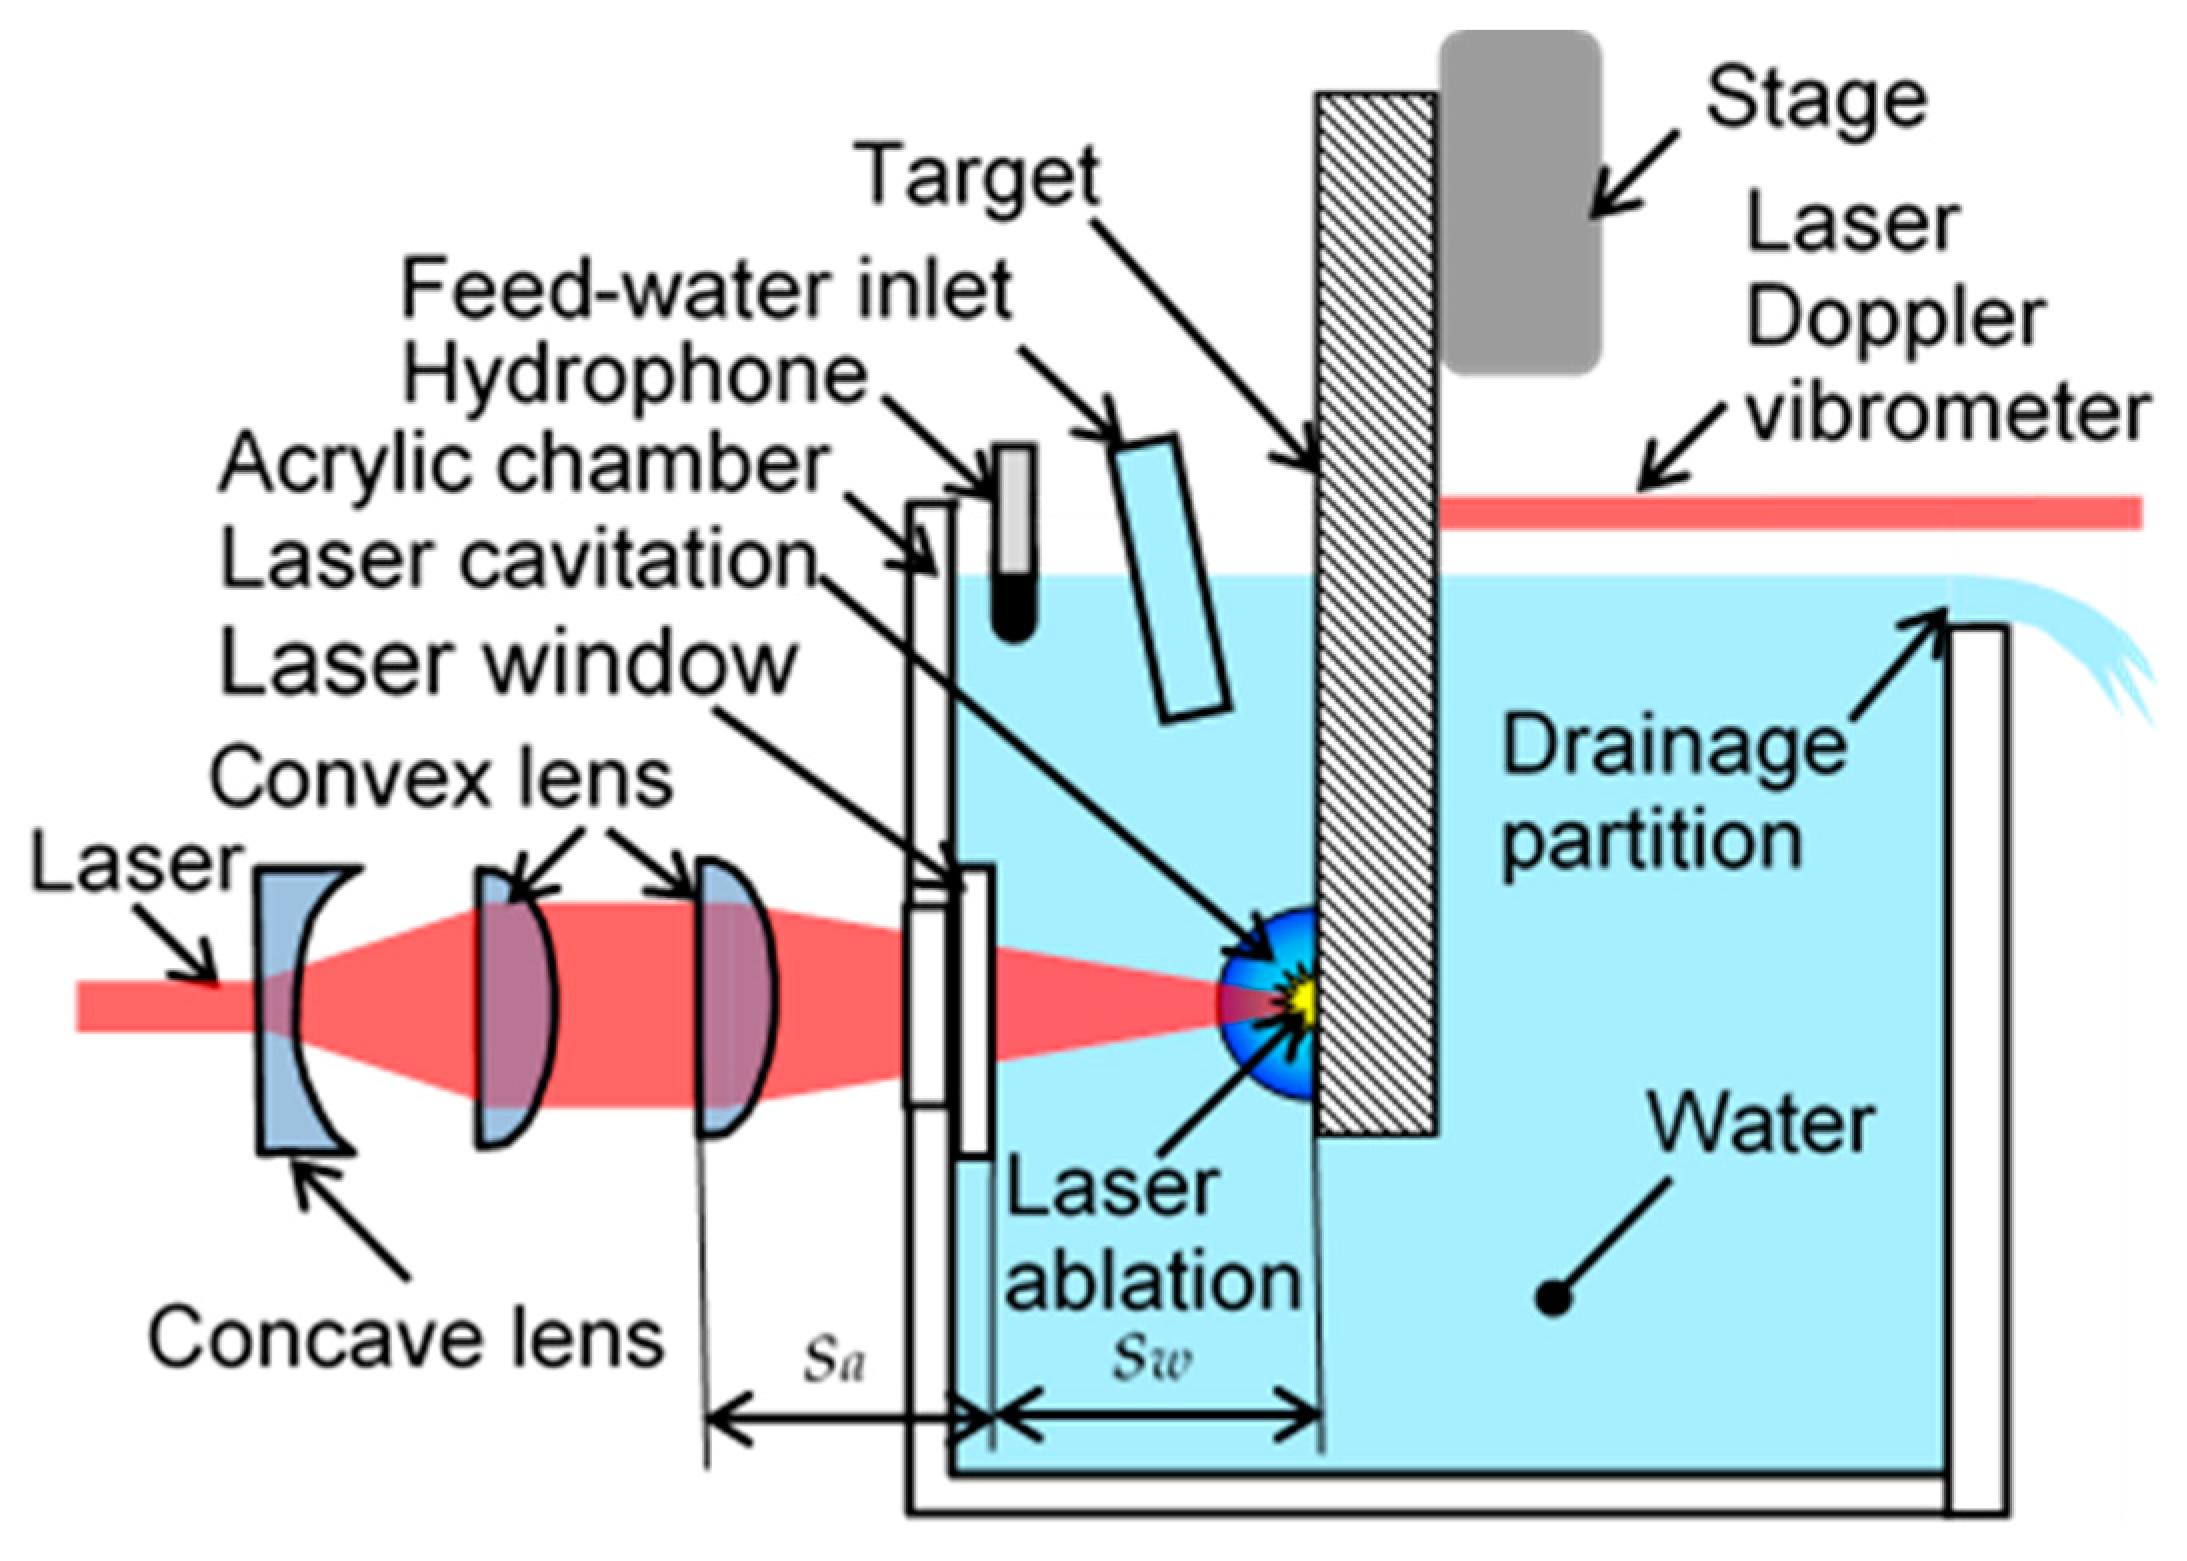
Figure 1 presents a schematic diagram of the test section of the LCP system. The laser source was a normal-oscillation Nd:YAG laser (MiniliteTM ML-I, Continuum®, Amplitude Laser Inc., San Jose, CA, USA), with a power of 0.42 W at 10 Hz repetition frequency and a wavelength of 1064 nm. Note that the energy conditions of the used laser were 42 mJ/pulse, approximately one-eighth that in a previous study (SureliteTM SL I-10, Continuum®, Amplitude Laser Inc., San Jose, CA, USA) [11]. The pulse width of the normal-oscillation Nd:YAG laser was about 200 μs. The beam diameter was about 3 mm. The pulsed laser from the source was reflected by mirrors and expanded by a concave lens to prevent damage to the laser window before being focused by convex lenses to the target surface, which was placed in a water-filled chamber through the laser window at 1064 nm. The thickness of the window was 3 mm. As the LC impact is affected by the water quality surrounding the target [11], degassed water was fed into the chamber at 2 L/min. The oxygen content of the water was about 0.8 mg/L, and the water temperature in the chamber was 296 ± 2 K. The distance from the final convex lens to the target surface was defined as a function of the standoff distance in air sa and the standoff distance in water sw, as shown in Figure 1. The target was placed on a stage that was moved horizontally and vertically by two stepping motors. The laser pulse density dL was defined as a function of the vertical step distance dv and horizontal step distance dh, as shown in Equation (1).
In order to investigate the intensity of LA and LC collapse, a hydrophone (Type 8103, Hottinger Brüel & Kjær, Nærum, Denmark) with a frequency range of 0.1 Hz to 180 kHz was placed in the chamber, and the vibration of the target surface was detected using a laser Doppler vibrometer (LV-1800, Ono Sokki Co., Ltd., Yokohama, Japan) with a frequency range of 0.3 Hz to 200 kHz. During vibration measurements, a high-pass filter of 100 Hz and a low-pass filter of 100 kHz was used to mitigate the noise. The signals from the hydrophone and the laser Doppler vibrometer were recorded using a digital oscilloscope (DPO3054, Tektronix, Inc., Beaverton, OR, USA) with a maximum sampling rate of 350 million samples per second. The aspect of LA and LC was observed using a high-speed video camera (VW9000, Keyence Corporation, Osaka, Japan). The maximum diameter of the bubble dmax was calculated as a function of the relationship between dmax and the developing time tD of LC [11], as shown in Equation (2). Here, tD was determined as the time from the irradiation of pulsed laser t from LA to the first collapse of LC by measuring the signal from the hydrophone.
Under observation using a high-speed video camera with a hydrophone and laser Doppler vibrometer, the laser pulse was generated by an external transistor-transistor logic TTL signal, which was simultaneously recoded with the signals of the hydrophone and the laser Doppler vibrometer. Four measurements were taken under each condition.
As the target material, aluminum alloy plate JIS (Japanese Industrial Standards) A5052-H34 with black aluminum tape (thickness = 0.1 mm) was used. In order to evaluate peening effect, A5052-H34 spray-painted black, with thickness δ = 1, 1.5, or 2 mm, was used. The thickness of the paint was 15. 0 ± 2.2 μm. Eight measurements were taken under each condition. The arc height h of the A5052-H34 plate was measured using an Almen gage [30], as the arc height was used to evaluate the peening intensity. Three measurements were taken under each condition. The arc height was affected by the chord length L, as shown in Figure 2. A unique parameter, i.e., the inverse of curvature 1/ρ, was obtained as described below. Figure 2 illustrates a schematic diagram of how the curvature 1/ρ is obtained from the arc height h of the chord length L. According to the Pythagorean theorem, the radius of curvature ρ can be expressed as a function of h and L, as shown in Equation (3). The radius of curvature ρ can then be derived from Equation (3) to yield Equation (4). Then, the curvature 1/ρ can be obtained, as shown in Equation (5). It can be seen that 1/ρ is proportional to h, but independent from L. Thus, 1/ρ was used to characterize the peening intensity in this study.
The diameter of laser ablation dLA was measured by observing the surface of the black aluminum tape using a digital microscope (VHX-2000, Keyence Corporation, Osaka, Japan). Specifically, dLA was calculated from the equivalent ablation area, as the laser ablation area was slightly elliptical in shape. Five measurements were taken under each condition. To investigate the peening effect, the Vickers hardness of A5052-H34 was measured. The tested load was 1.96 N (200 gf). Seven measurements were taken under each condition, and the mean and standard deviation were calculated from the five points excluding the maximum and minimum values.
3. Results
Figure 3 shows the aspects of LA and LC observed using the high-speed video camera at a recording speed of 23,000 frames/s, whereby the interval of each frame is about 0.0435 ms. At t = 0 ms, the pulsed laser was used to irradiate the target, i.e., aluminum alloy covered by a 0.1 mm thick black aluminum film. Figure 4 and Figure 5 reveal the signals from the hydrophone and the vibration of the target surface measured using the laser Doppler vibrometer. At 0 ≤ t ≤ 0.130 ms, a bright spot produced by the pulsed laser can clearly be observed. Considering the frame interval time, i.e., 0.0435 ms, the laser pulse duration was about 0.2 ms. When the Q-switched Nd:YAG laser was used, the blight spot was observed and the 1st frame observed by the highspeed video camera at 23,000 frames/s [11]. Thus, the duration of LA induced by the normal-oscillation Nd:YAG laser was much larger than that of the Q-switched Nd:YAG laser. Following LA, LC was already developed at t = 0.130 ms, reaching the maximum size at t ≈ 0.2 ms, before shrinking. The minimum size was observed at t = 0.391 ms, i.e., first collapse, before increasing until t = 0.522 ms, and then collapsing again at t = 0.652, i.e., second collapse.
As shown in Figure 4, the pressure detected by the hydrophone pH had a peak at t ≈ 0 ms and another peak at t = 0.379 ms. The peaks at t ≈ 0 ms and t = 0.379 ms were generated by LA and LC collapse, respectively. The amplitude of pH was slightly increased at t ≈ 0.63 ms, caused by the second collapse of LC. The frequency of the first collapse of LC was about 67 kHz, with a wavelength of about 15 μs. According to a comparison of the amplitudes of the peaks, the amplitude of the first collapse of LC was four times larger than that of LA. Note that the amplitudes of LA and LC collapse generated by the Q-switched Nd:YAG laser were nearly equivalent [11]. The pressure generated by LA using the laser pulse of the normal-oscillation Nd:YAG laser, with a pulse width of ~0.2 ms, was remarkably weaker than that of the first collapse of LC. In other words, the impact induced by the first collapse of LC produced by the normal-oscillation Nd:YAG laser was considerably strong compared with that of LA.
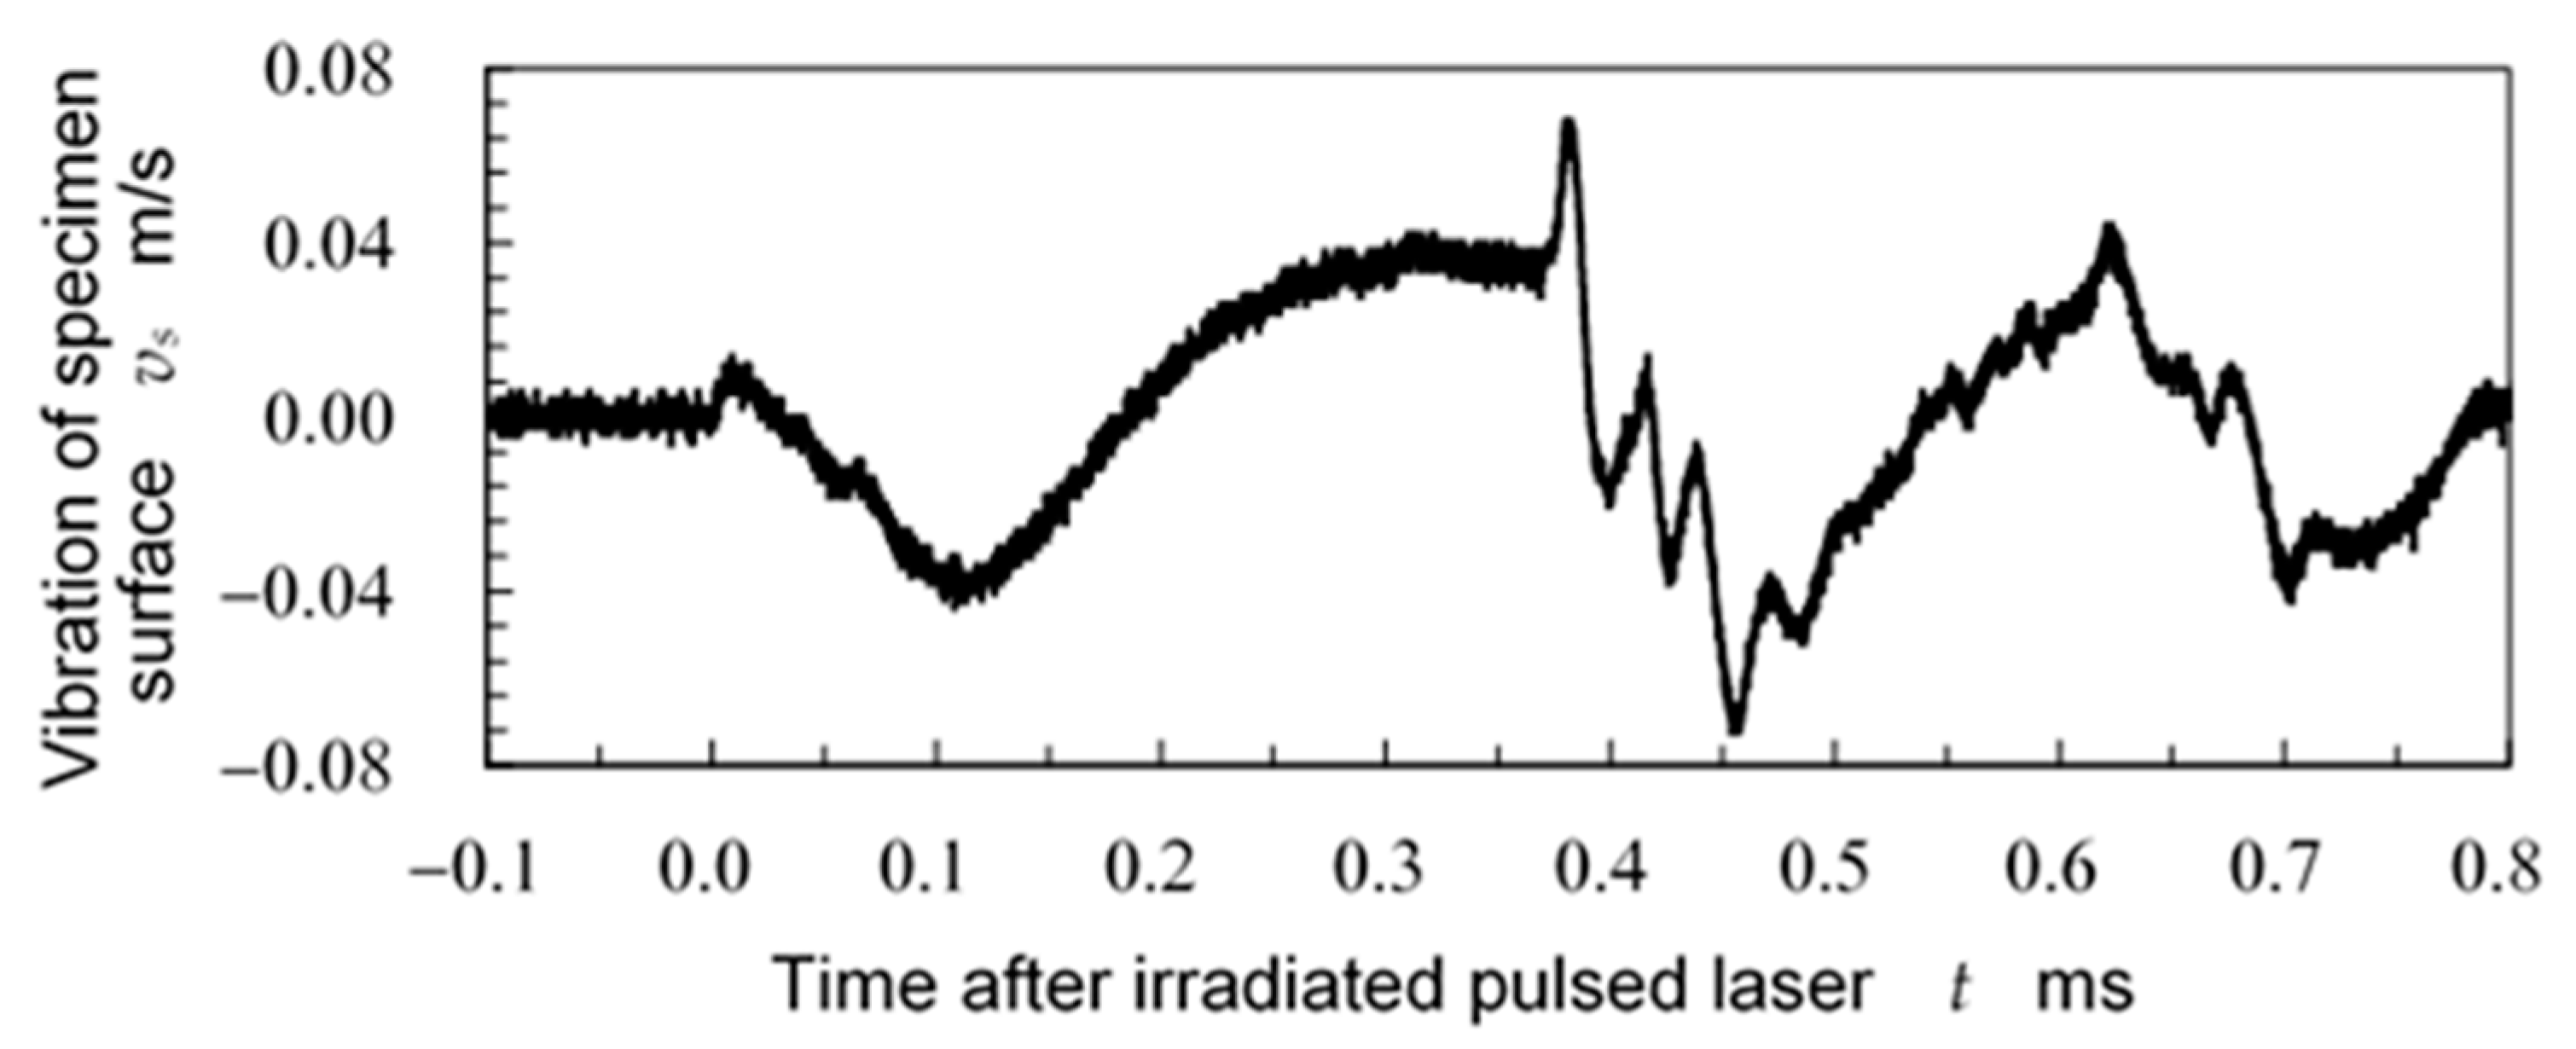
Vibration of the specimen surface was also produced by LA at t ≈ 0 ms and LC collapse at t ≈ 0.38 ms, as shown in Figure 5. The vibration induced by LA was gradually increased at t ≈ 0 ms, and the specimen was vibrated slowly at ~5 kHz. On the other hand, the specimen was impulsively vibrated at 30 kHz by the first collapse of LC. The amplitude of the vibration due to LC collapse was about three times larger than that of LA. Regarding Figure 4 and Figure 5, the local impact induced by LA using the normal-oscillation Nd:YAG laser, with a pulse width of ~0.2 ms, was weak. On the other hand, that of the first collapse of LC was considered effective for peening.
In order to determine a suitable condition for LCP, Figure 6, Figure 7 and Figure 8 illustrate the diameter of LA (dLA), the maximum diameter of LC (dmax), and the peak pressure induced by the first collapse of LC (pLC), which changed as a function of the standoff distance in water sw. As the focus distance of the final convex lens was 100 mm, dLA decreased with the increase in sw for both sa = 87 mm and sa = 92 mm, at sa + sw < 100 mm, as shown in Figure 6. Note that the diameter of laser ablation induced by the Q-switched Nd:YAG laser at optimum standoff distance was about 0.8 mm [11]. The value of dmax also decreased with the increase in sw for both sa = 87 mm and sa = 92 mm, at sa + sw < 100 mm, as shown in Figure 7. On the other hand, pLC had a peak at a certain sw, although the standard deviation was considerably large, as shown in Figure 8. This is because the laser energy that reaches the target surface decreases with the increase in sw, due to absorption by water. On the other hand, when sw is too short, LC becomes pancake-shaped, and then the impact induced by LC collapse becomes weak [11]. Accordingly, pLC peaked at a certain sw, as shown in Figure 8.
The aggressive intensity of cavitation is proportional to the volume of cavitation [6,31], and the number of photons is proportional to the maximum diameter of the bubble [32]. Therefore, Figure 9 illustrates the relationship between the maximum volume of LC (Vmax), and the peak pressure induced by the first collapse of LC (pLC). In the limited region, pLC increased with Vmax at both sa = 87 mm and sa = 92 mm. However, the pLC of Vmax = 32 mm3 at sa = 92 mm and the pLC of Vmax = 81 and 89 mm3 at sa = 87 mm decreased, although Vmax increased. For these three points, sw was 4–5 mm, indicating that the target was placed too close to the laser window. Then, LC became pancake-shaped, thus reducing pLC although Vmax increased, as mentioned above.
In order to reveal the possibility of LCP peening using the normal-oscillation Nd:YAG laser, Table 1 shows the changes in arc height h and the inverse of curvature 1/ρ as a function of the thickness of the plate δ. The material of the plate was JIS A5052-H34, and it was painted black. Considering the results of Figure 8 and Figure 9, the standoff distances were chosen as sa = 92 mm and sw = 5 mm. The repetition frequency of the laser was 10 Hz, and the laser pulse energy was about 42 mJ/pulse. The laser pulse density dL was 4 pulse/mm2. As shown in Figure 6, the diameter of laser ablation dLA was 0.474 ± 0.010 mm, the laser ablation spots did not overlap, as dLA < 0.5 mm. As shown in Table 1, at δ = 1.5 mm and 2.0 mm, the plate was warped, and the treated surface was on the convex side. On the other hand, the treated surface was on the concave side at δ = 1.0 mm. When the thickness of plastic deformation was thicker than 0.5 mm at δ = 1.0 mm, the plate was warped concavely. Regardless, LC generated by the laser pulse using the normal-oscillation Nd:YAG laser produced a peening effect.
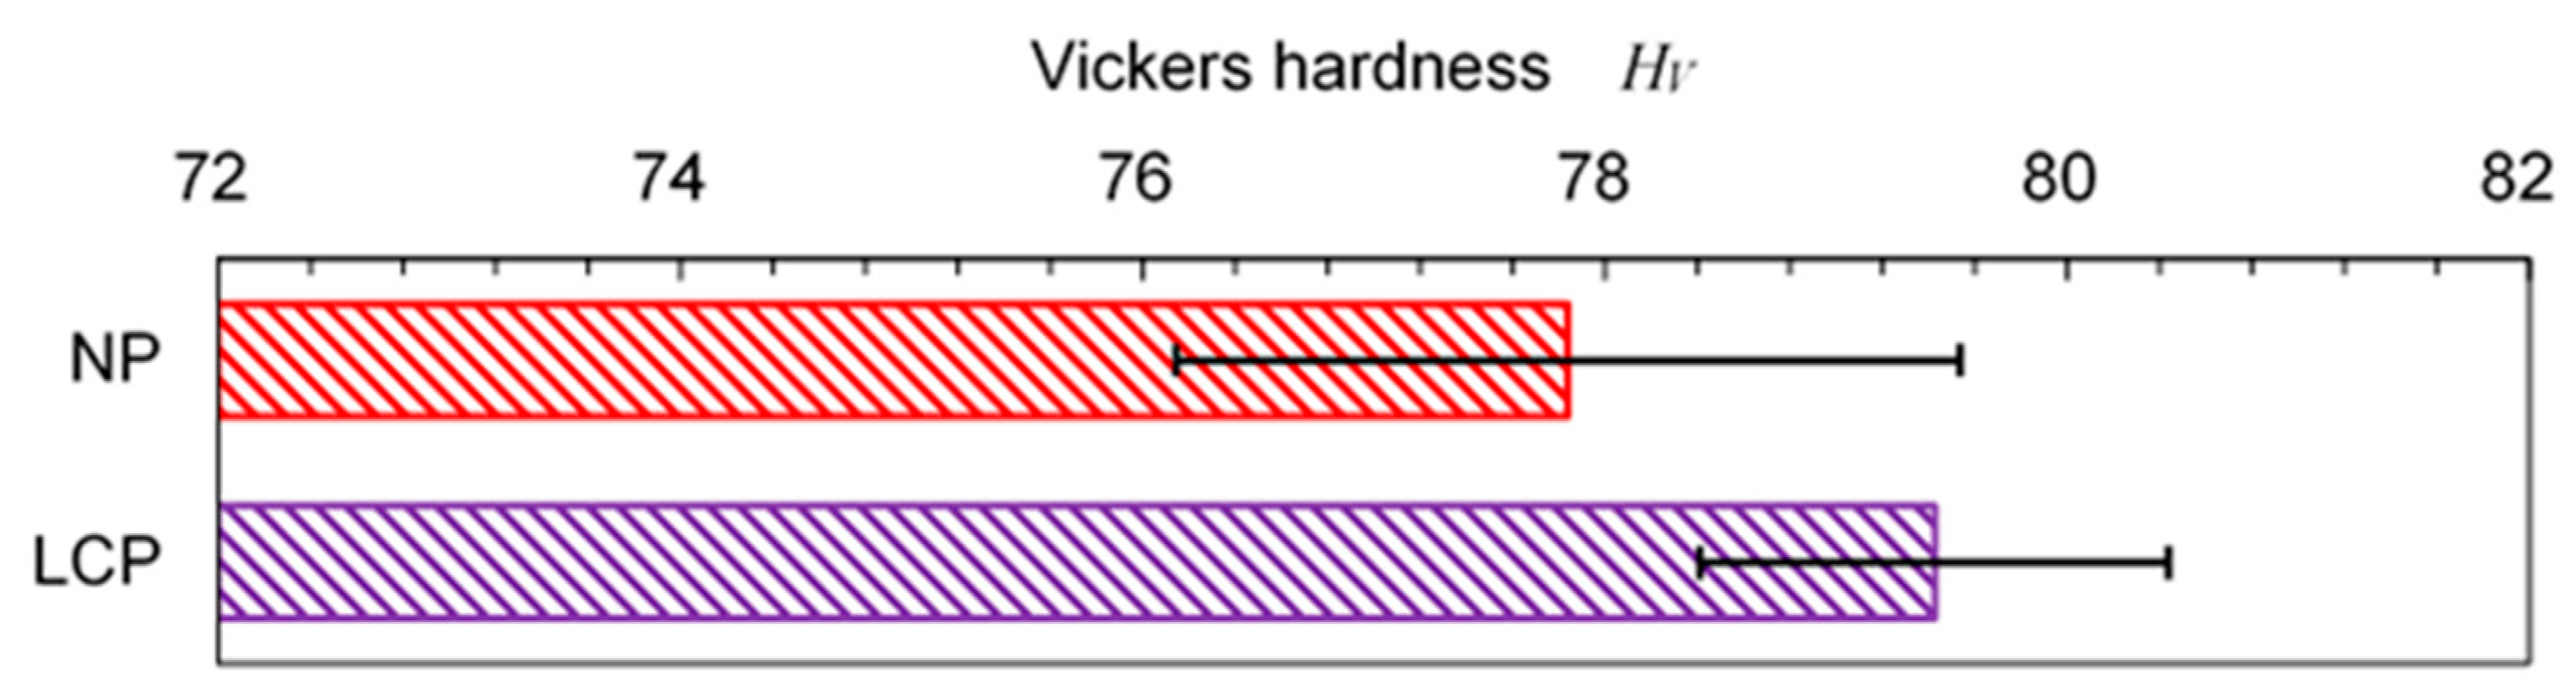
In order to further demonstrate the peening effect, Figure 10 shows the Vickers hardness HV for a non-peened (NP) specimen and an LCP one. The condition of LCP was the same as in Table 1. The specimen was A5052-H34 painted black, with a thickness of δ = 2.0 mm. In the case of LCP, HV at the center of the ablated area was measured. The HV of the NP specimen was 77.8 ± 1.7, while that of the LCP specimen was 79.4 ± 1.0. Thus, it can be concluded that LCP using the normal-oscillation Nd:YAG laser could increase the hardness of aluminum alloy A5052-H34. Specifically, a relatively longer laser pulse, i.e., pulse width of 0.2 ms, can be utilized for LCP.
Two main studies will be explored in the future. The first is an improvement of the processing efficiency using another type of laser system such as a fiber laser, with a maximum repetition frequency of 50 kHz. The second is the development of an LCP system using an optical fiber, which can be used by the abovementioned pulsed laser. In most laser peening systems, the optical systems are fixed, and the targets are moved. If LCP using an optical laser system is realized, its applications can be expanded dramatically.
4. Conclusions
In order to drastically improve the processing efficiency of laser cavitation peening (LCP), the possibility of using a relatively longer laser pulse width was demonstrated, so as to increase the repetition frequency. In the present paper, the LCP process using a normal-oscillation Nd:YAG laser, with a pulsed energy of ~42 mJ/pulse, was optimized by observing the laser ablation (LA) and laser cavitation (LC). Then, the peening effects of LCP were demonstrated. The results obtained can be summarized as follows:
- The laser pulse generated by the normal-oscillation Nd:YAG laser, with a pulse width of about 0.2 ms, produced LC on a black-painted surface.
- The first collapse of LC generated the shock pressure wave and impulsive vibration of the target surface, at an intensity 3–4 times larger than LA.
- The amplitude of shock pressure detected by the hydrophone changed with the standoff distance in air and water. It peaked at a certain standoff distance in the water.
- In the present conditions, LCP using a normal-oscillation Nd:YAG laser could warp the aluminum alloy plate A5052-H34. It also increased the hardness of A5052-H34. Specifically, a laser pulse with 42 mJ energy/pulse and 0.2 ms width can be utilized for LCP.
Funding
This research was partly supported by JSPS KAKENHI (grant numbers 23H01292 and 22KK0050) and the Amada Foundation (AF-2021219-B3).
Institutional Review Board Statement
Not applicable.
Informed Consent Statement
Not applicable.
Data Availability Statement
The data presented in this study are available upon request from the author.
Conflicts of Interest
The author declares no conflict of interest.
Abbreviations
| A5052 | standard aluminum alloy |
| CP | cavitation peening |
| H34 | standard heat treatment |
| HV | Vickers hardness |
| JIS | Japanese Industrial Standards |
| L | chord length |
| LA | laser ablation |
| LC | laser cavitation |
| LCP | laser cavitation peening |
| PVDF | polyvinylidene fluoride |
| TTL | transistor–transistor logic |
| Vmax | maximum volume of LC |
| dh | horizontal step distance |
| dL | laser pulse density |
| dLA | diameter of laser ablation |
| dmax | maximum diameter of LC |
| dv | vertical step distance |
| h | arc height |
| pH | pressure detected by hydrophone |
| pLC | peak pressure induced by first collapse of LC |
| sa | standoff distance in air |
| sw | standoff distance in water |
| t | time after irradiated pulsed laser |
| tD | developing time of LC |
| vs | vibration of specimen surface |
| δ | thickness of plate |
| ρ | radius of curvature |
| 1/ρ | inverse of curvature |
 | sa = 87 mm |
 | sa = 92 mm |
References
- Wagner, L. Mechanical surface treatments on titanium, aluminum and magnesium alloys. Mater. Sci. Eng. A 1999, 263, 210–216. [Google Scholar] [CrossRef]
- Bagherifard, S.; Guagliano, M. Fatigue behavior of a low-alloy steel with nanostructured surface obtained by severe shot peening. Eng. Fract. Mech. 2012, 81, 56–68. [Google Scholar] [CrossRef]
- Skoczylas, A.; Zaleski, K. Study on the Surface Layer Properties and Fatigue Life of a Workpiece Machined by Centrifugal Shot Peening and Burnishing. Materials 2022, 15, 6677. [Google Scholar] [CrossRef]
- Kikuchi, S.; Minamizawa, K.; Arakawa, J.; Akebono, H.; Takesue, S.; Hayakawa, M. Combined effect of surface morphology and residual stress induced by fine particle and shot peening on the fatigue limit for carburized steels. Int. J. Fatigue 2023, 168, 107441. [Google Scholar] [CrossRef]
- Kang, C.-Y.; Chen, T.-C.; Tsay, L.-W. Effects of Micro-Shot Peening on the Stress Corrosion Cracking of Austenitic Stainless Steel Welds. Metals 2022, 13, 69. [Google Scholar] [CrossRef]
- Soyama, H.; Korsunsky, A.M. A critical comparative review of cavitation peening and other surface peening methods. J. Mater. Process. Technol. 2022, 305, 117586. [Google Scholar] [CrossRef]
- Saitou, N.; Enomoto, K.; Kurosawa, K.; Morinaka, R.; Hayashi, E.; Ishikwa, T.; Yoshimura, T. Development of water jet peening technique for reactor internal components of nuclear power plant. J. Jet Flow Eng. 2003, 20, 4–12. [Google Scholar]
- Soyama, H.; Sanders, D. Use of an abrasive water cavitating jet and peening process to improve the fatigue strength of titanium alloy 6Al-4V manufactured by the electron beam powder bed melting (EBPB) additive manufacturing method. JOM 2019, 71, 4311–4318. [Google Scholar] [CrossRef] [Green Version]
- Sano, Y. Quarter Century Development of Laser Peening without Coating. Metals 2020, 10, 152. [Google Scholar] [CrossRef] [Green Version]
- Sasoh, A.; Watanabe, K.; Sano, Y.; Mukai, N. Behavior of bubbles induced by the interaction of a laser pulse with a metal plate in water. Appl. Phys. A 2005, 80, 1497–1500. [Google Scholar] [CrossRef]
- Soyama, H.; Iga, Y. Laser Cavitation Peening: A Review. Appl. Sci. 2023, 13, 6702. [Google Scholar] [CrossRef]
- Soyama, H.; Kuji, C.; Liao, Y. Comparison of the effects of submerged laser peening, cavitation peening and shot peening on the improvement of the fatigue strength of magnesium alloy AZ31. J. Magnes. Alloys 2023, 11, 1592–1607. [Google Scholar] [CrossRef]
- Peyre, P.; Fabbro, R.; Merrien, P.; Lieurade, H.P. Laser shock processing of aluminium alloys. Application to high cycle fatigue behaviour. Mater. Sci. Eng. A 1996, 210, 102–113. [Google Scholar] [CrossRef]
- Hatamleh, O.; Lyons, J.; Forman, R. Laser and shot peening effects on fatigue crack growth in friction stir welded 7075-T7351 aluminum alloy joints. Int. J. Fatigue 2007, 29, 421–434. [Google Scholar] [CrossRef]
- Telang, A.; Gnäupel-Herold, T.; Gill, A.; Vasudevan, V.K. Effect of Applied Stress and Temperature on Residual Stresses Induced by Peening Surface Treatments in Alloy 600. J. Mater. Eng. Perform. 2018, 27, 2796–2804. [Google Scholar] [CrossRef]
- Mao, B.; Liao, Y.; Li, B. Abnormal twin-twin interaction in an Mg-3Al-1Zn magnesium alloy processed by laser shock peening. Scr. Mater. 2019, 165, 89–93. [Google Scholar] [CrossRef]
- Yang, F.; Liu, P.; Zhou, L.; He, W.; Pan, X.; An, Z. Review on Anti-Fatigue Performance of Gradient Microstructures in Metallic Components by Laser Shock Peening. Metals 2023, 13, 979. [Google Scholar] [CrossRef]
- Li, Y.; Geng, J.; Wang, Z.; Shao, Z.; Zhang, C.; Chen, D.; Wang, H. Thermal evolutions of residual stress and strain hardening of GH4169 Ni-based superalloy treated by laser shock peening. Surf. Coat. Technol. 2023, 467, 129690. [Google Scholar] [CrossRef]
- Ye, Y.; Zhang, Y.; Huang, T.; Zou, S.; Dong, Y.; Ding, H.; Vasudevan, V.K.; Ye, C. A Critical Review of Laser Shock Peening of Aircraft Engine Components. Adv. Eng. Mater. 2023, 2201451. [Google Scholar] [CrossRef]
- Sano, Y.; Obata, M.; Kubo, T.; Mukai, N.; Yoda, M.; Masaki, K.; Ochi, Y. Retardation of crack initiation and growth in austenitic stainless steels by laser peening without protective coating. Mater. Sci. Eng. A 2006, 417, 334–340. [Google Scholar] [CrossRef]
- Yoda, M.; Chida, I.; Okada, S.; Ochiai, M.; Sano, Y.; Mukai, N.; Komotori, G.; Saeki, R.; Takagi, T.; Sugihara, M.; et al. Development and Application of Laser Peening System for PWR Power Plants. In Proceedings of the 14th International Conference on Nuclear Engineering, Miami, FL, USA, 17–20 July 2006; pp. 419–424. [Google Scholar]
- Sano, Y.; Akita, K.; Sano, T. A Mechanism for Inducing Compressive Residual Stresses on a Surface by Laser Peening without Coating. Metals 2020, 10, 816. [Google Scholar] [CrossRef]
- Kaufman, J.; Špirit, Z.; Vasudevan, V.K.; Steiner, M.A.; Mannava, S.R.; Brajer, J.; Pína, L.; Mocek, T. Effect of Laser Shock Peening Parameters on Residual Stresses and Corrosion Fatigue of AA5083. Metals 2021, 11, 1635. [Google Scholar] [CrossRef]
- Sano, T.; Eimura, T.; Kashiwabara, R.; Matsuda, T.; Isshiki, Y.; Hirose, A.; Tsutsumi, S.; Arakawa, K.; Hashimoto, T.; Masaki, K.; et al. Femtosecond laser peening of 2024 aluminum alloy without a sacrificial overlay under atmospheric conditions. J. Laser Appl. 2017, 29, 012005. [Google Scholar] [CrossRef] [Green Version]
- Sano, T.; Eimura, T.; Hirose, A.; Kawahito, Y.; Katayama, S.; Arakawa, K.; Masaki, K.; Shiro, A.; Shobu, T.; Sano, Y. Improving Fatigue Performance of Laser-Welded 2024-T3 Aluminum Alloy Using Dry Laser Peening. Metals 2019, 9, 1192. [Google Scholar] [CrossRef] [Green Version]
- Yoshida, M.; Nishibata, I.; Matsuda, T.; Ito, Y.; Sugita, N.; Shiro, A.; Shobu, T.; Arakawa, K.; Hirose, A.; Sano, T. Influence of pulse duration on mechanical properties and dislocation density of dry laser peened aluminum alloy using ultrashort pulsed laser-driven shock wave. J. Appl. Phys. 2022, 132, 075101. [Google Scholar] [CrossRef]
- Philipp, A.; Lauterborn, W. Cavitation erosion by single laser-produced bubbles. J. Fluid Mech. 1998, 361, 75–116. [Google Scholar] [CrossRef]
- Sano, Y.; Kato, T.; Mizuta, Y.; Tamaki, S.; Yokofujita, K.; Taira, T.; Hosokai, T.; Sakino, Y. Development of a portable laser peening device and its effect on the fatigue properties of HT780 butt-welded joints. Forces Mech. 2022, 7, 100080. [Google Scholar] [CrossRef]
- Sugimoto, Y.; Obata, S. Behavior of a sphere caused by pulsed laser induced bubble simulating stone crushing with TUL. In Proceedings of the 11th International Symposium on Cavitation, Daejeon, Republic of Korea (Virtual Conference), 10–13 May 2021; pp. 614–617. [Google Scholar]
- J442; Test Strip, Holder, and Gage for Shot Peening. SAE International Standard: Warrendale, PA, USA, 2013.
- Ward, B.; Emmony, D. The Energies and Pressures of Acoustic Transients Associated with Optical Cavitation in Water. J. Mod. Opt. 1990, 37, 803–811. [Google Scholar] [CrossRef]
- Ohl, C.D.; Lindau, O.; Lauterborn, W. Luminescence from Spherically and Aspherically Collapsing Laser Induced Bubbles. Phys. Rev. Lett. 1998, 80, 393–396. [Google Scholar] [CrossRef]
Figure 1.
Schematic diagram of test section of laser cavitation peening LCP system.

Figure 2.
Schematic diagram of radius of curvature and arc height.

Figure 3.
Aspects of laser ablation (LA) and laser cavitation (LC).
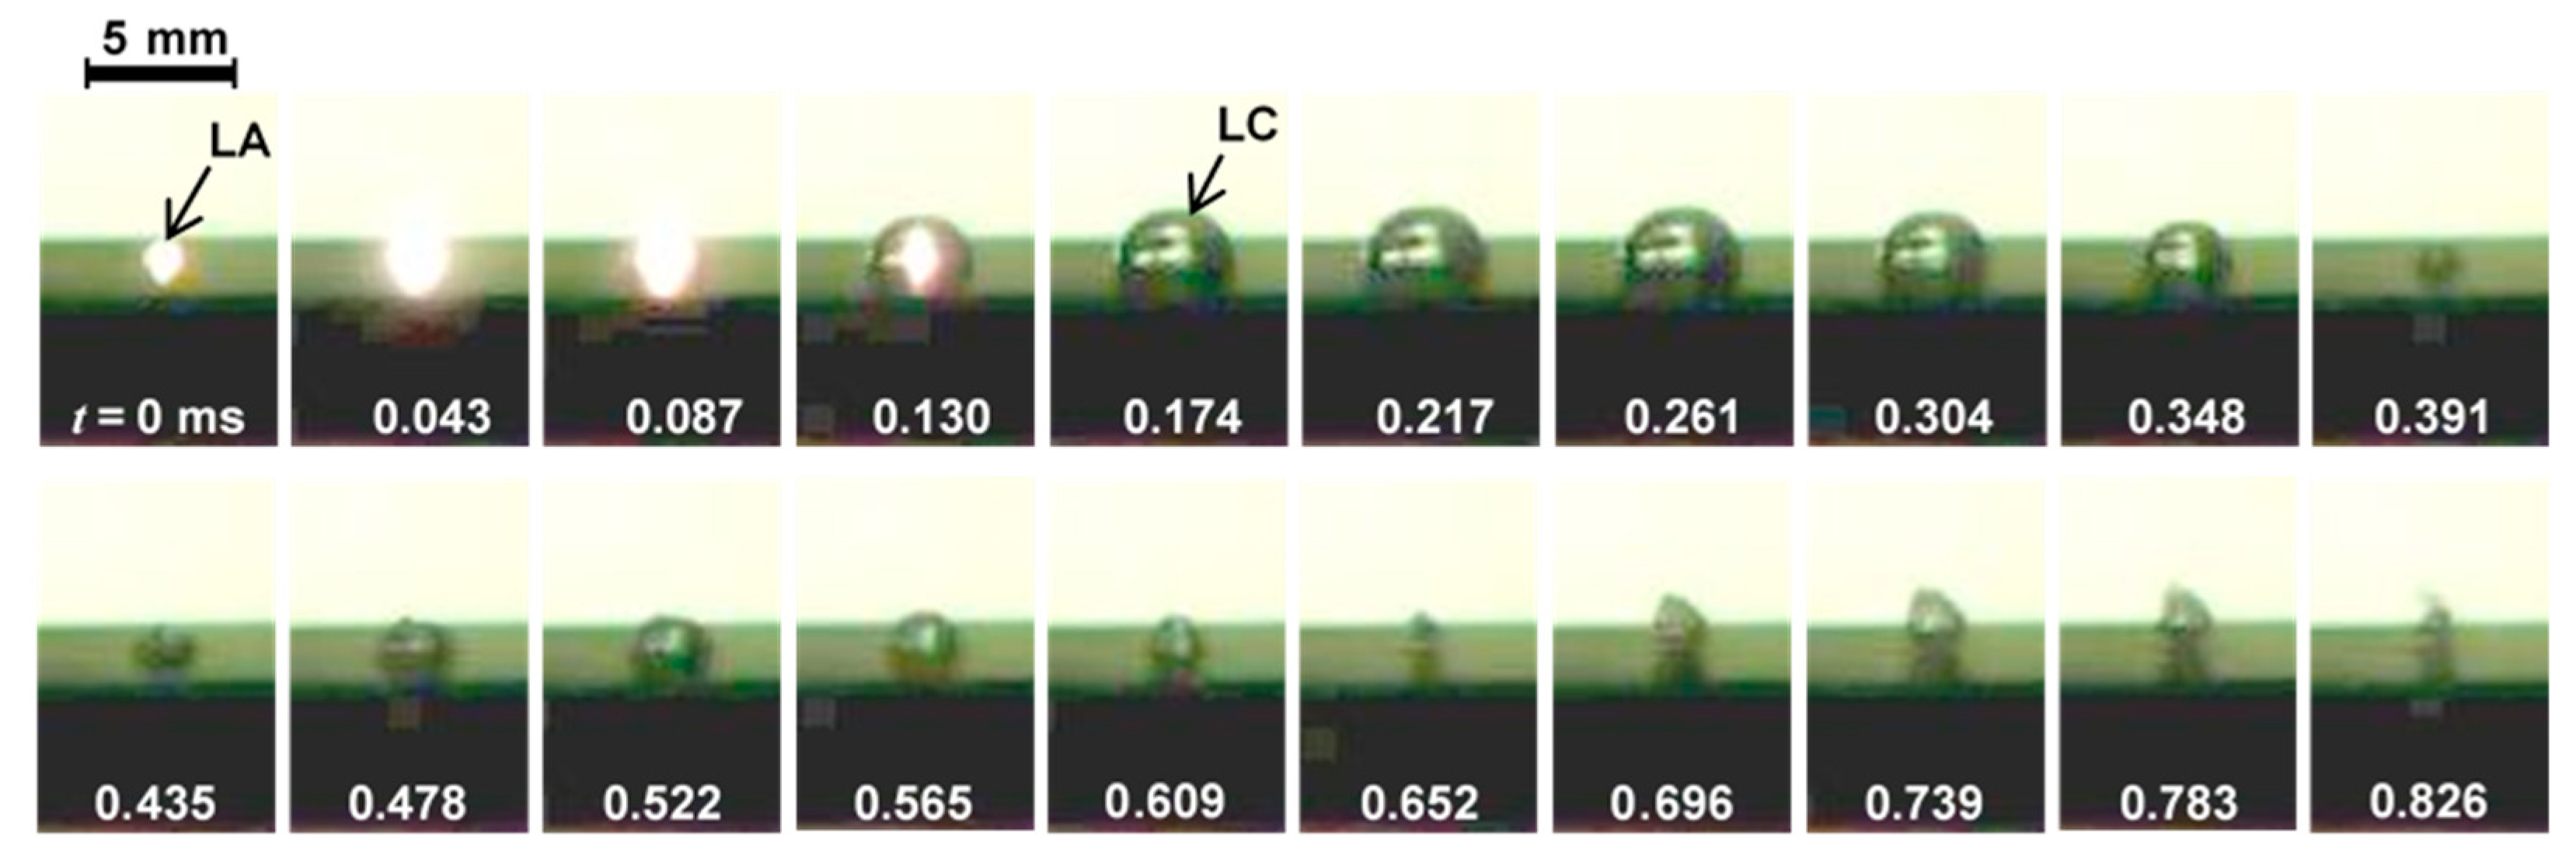
Figure 4.
Signal from hydrophone (the distance from the laser ablation spot to the hydrophone was about 30 mm).
Figure 4.
Signal from hydrophone (the distance from the laser ablation spot to the hydrophone was about 30 mm).
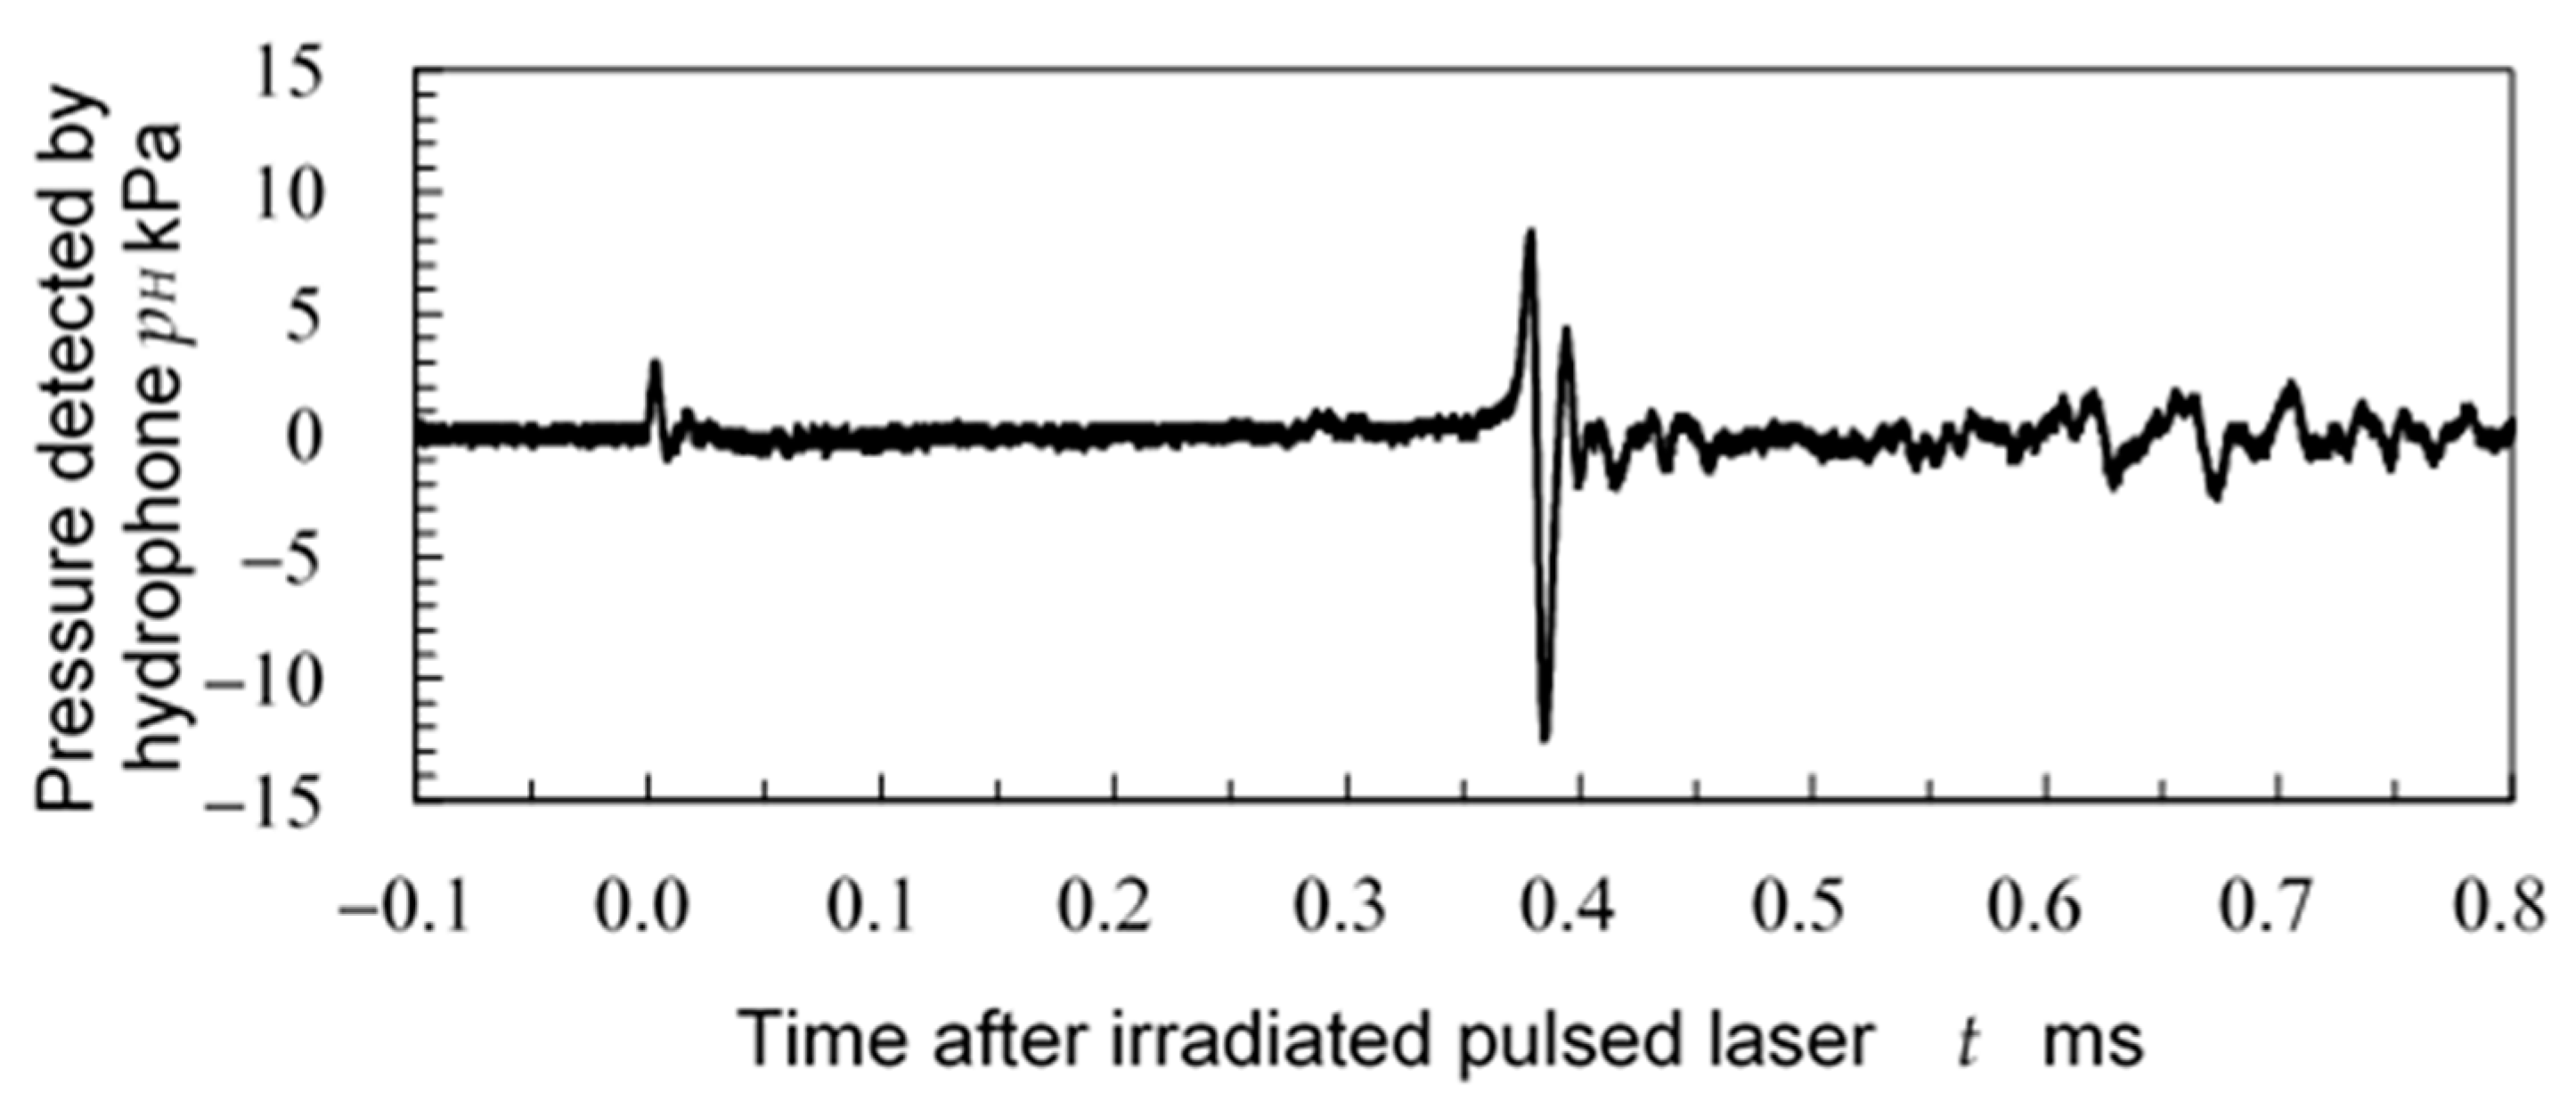
Figure 5.
Vibration of specimen surface detected by laser Doppler vibrometer.

Figure 6.
Effect of standoff distance in water sw on diameter of laser ablation.

Figure 7.
Effect of standoff distance in water on maximum diameter of laser cavitation LC.
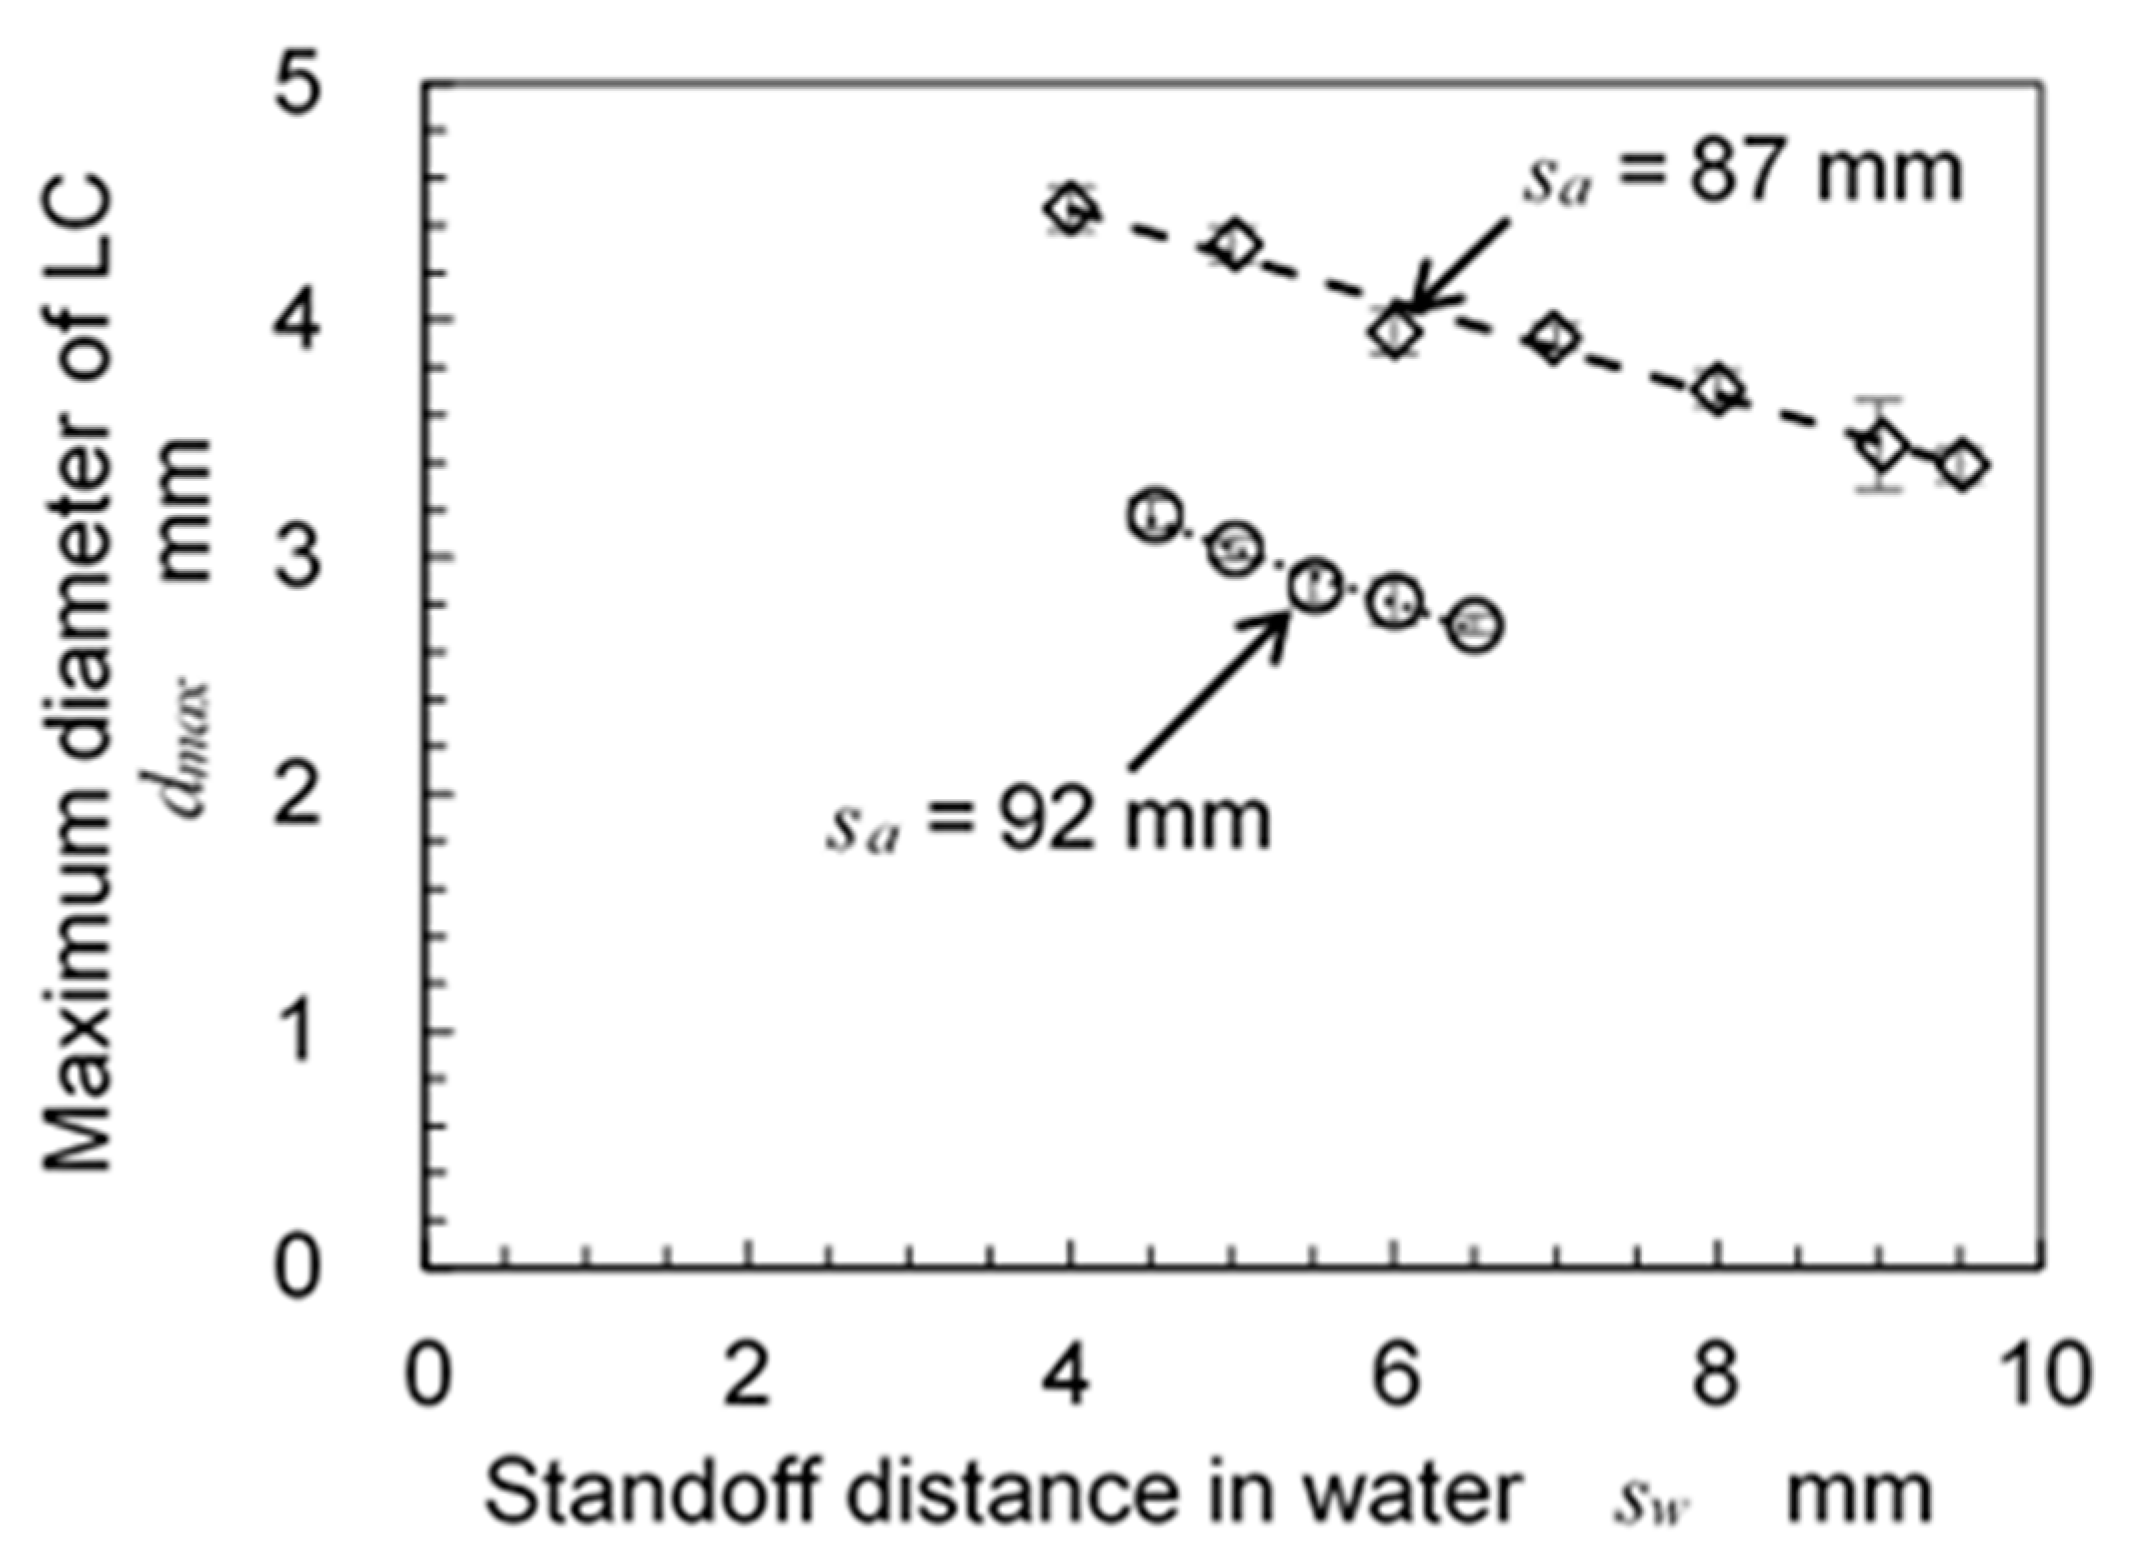
Figure 8.
Effect of standoff distance in water on peak pressure at laser cavitation LC collapse (the distance from the laser ablation spot to the hydrophone was about 75 mm).
Figure 8.
Effect of standoff distance in water on peak pressure at laser cavitation LC collapse (the distance from the laser ablation spot to the hydrophone was about 75 mm).

Figure 9.
Relationship between maximum volume of laser cavitation and peak pressure at laser cavitation collapse (the distance from the laser ablation spot to the hydrophone was about 75 mm).
Figure 9.
Relationship between maximum volume of laser cavitation and peak pressure at laser cavitation collapse (the distance from the laser ablation spot to the hydrophone was about 75 mm).
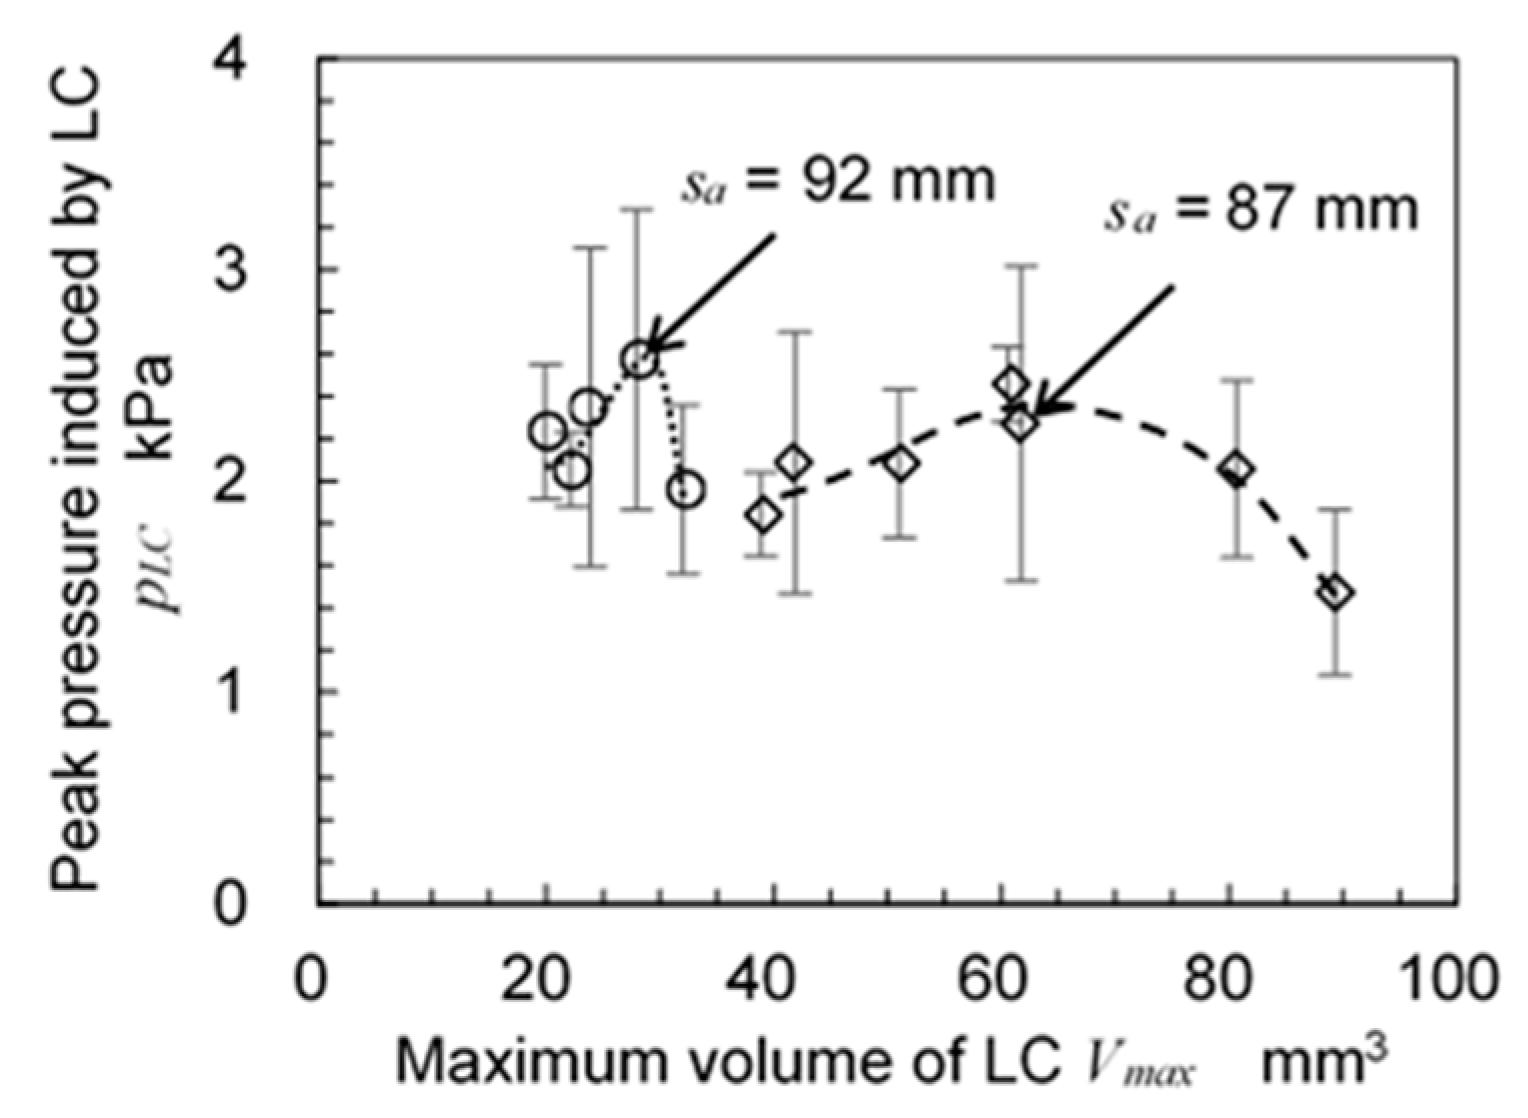
Figure 10.
Effect of laser cavitation peening on hardness.

Table 1.
Arc height and inverse of curvature of aluminum alloy plate A5052-H34.
| Thickness of Plate δ (mm) | Arc Height h (mm) | Inverse of Curvature 1/ρ (m−1) |
|---|---|---|
| 1.0 | −0.0950 ± 0.003 | −0.376 ± 0.010 |
| 1.5 | 0.0347 ± 0.004 | 0.137 ± 0.014 |
| 2.0 | 0.0110 ± 0.002 | 0.044 ± 0.007 |
A positive value indicates a convex shape, while a negative value indicates a concave shape.
Disclaimer/Publisher’s Note: The statements, opinions and data contained in all publications are solely those of the individual author(s) and contributor(s) and not of MDPI and/or the editor(s). MDPI and/or the editor(s) disclaim responsibility for any injury to people or property resulting from any ideas, methods, instructions or products referred to in the content. |
© 2023 by the author. Licensee MDPI, Basel, Switzerland. This article is an open access article distributed under the terms and conditions of the Creative Commons Attribution (CC BY) license (https://creativecommons.org/licenses/by/4.0/).
Share and Cite
MDPI and ACS Style
Soyama, H. Development of Laser Cavitation Peening Using a Normal-Oscillation Nd:YAG Laser. Coatings 2023, 13, 1395. https://doi.org/10.3390/coatings13081395
AMA Style
Soyama H. Development of Laser Cavitation Peening Using a Normal-Oscillation Nd:YAG Laser. Coatings. 2023; 13(8):1395. https://doi.org/10.3390/coatings13081395
Chicago/Turabian StyleSoyama, Hitoshi. 2023. "Development of Laser Cavitation Peening Using a Normal-Oscillation Nd:YAG Laser" Coatings 13, no. 8: 1395. https://doi.org/10.3390/coatings13081395
Note that from the first issue of 2016, this journal uses article numbers instead of page numbers. See further details here.